 Yuhan Yang1
 Zhonghu Wu
 Yujun Zuo
94% of researchers rate our articles as excellent or good
Learn more about the work of our research integrity team to safeguard the quality of each article we publish.
Find out more
ORIGINAL RESEARCH article
Front. Earth Sci., 09 January 2023
Sec. Economic Geology
Volume 10 - 2022 | https://doi.org/10.3389/feart.2022.1120630
This article is part of the Research TopicOrganic Matter Accumulation in Organic-Rich ShalesView all 11 articles
Due to the heterogeneity of rock media, it is difficult to truly reflect its internal three-dimensional microstructure in physical tests or numerical simulation. In this study, CT scanning technology and numerical image processing technology are used, and the finite element software RFPA-3D is used to establish a three-dimensional non-uniform numerical model that can reflect the meso structure of rock mass. In order to study the fracture mechanism of shale with prefabricated fractures, seven groups of three-dimensional numerical models with prefabricated fractures from different angles were constructed, and Brazilian fracturing numerical simulation tests were carried out. The results show that method of reconstructing 3D numerical models by CT scanning is feasible and provides a viable method for in-depth study of the micromechanics of shale. Prefabricated fractures and quartz minerals have significant effects on the tensile strength of shale, and both will weaken the destructive strength of shale specimens. The damage modes of Brazilian disc specimens containing prefabricated fissures can be divided into four categories. The damage process is divided into budding, plateauing and surge periods by acoustic emission. The crack initiation angle of the prefabricated fissure tip increases with increasing fissure angle, and the MTS criterion can be used as a basis for judging prefabricated fissure initiation. The results of the study are important guidance for the fracture initiation mechanism and fracture expansion law of the fractured layer containing natural fractures in the hydraulic fracturing process.
Shale gas, as a new energy resource, now accounts for 40% of the total natural gas, and its share is increasing (Zou et al., 2010; Wang et al., 2016; Wu et al., 2017). China has abundant shale gas resources with huge potential for development. Improving the efficiency of shale gas extraction is of great importance to the development of resources. There are still many problems in the shale gas extraction process that prevent efficient production of shale gas, such as the optimization problem of hydraulic fracturing and the destabilization of well walls. The pores of shale gas storage have a large proportion of nano-scale fractures, and the poor permeability is not conducive to extraction, so shale reservoirs must be fractured and modified to increase permeability (Darabi et al., 2012; Padin et al., 2014; Tahmasebi et al., 2016; Yang et al., 2021). In actual shale rock engineering, in addition to bedding, there are a large number of defects such as natural fractures and artificial fractures at different scales inside the rock mass, and these defects are one of the main internal factors controlling the mechanical properties such as deformation and strength of the rock mass. Under the action of hydraulic pressure and ground stress, the natural fractures in the rock can easily be extended to interpenetrate with the hydraulic fractures, and hydraulic fractures can also expand in other directions under local stress perturbations caused by natural fractures, thus affecting the recovery of shale gas (Bowker 2007; Perez 2010; Liu et al., 2021). Therefore, the study of the extension mechanism as well as the physical properties of shale containing fractures has great engineering significance.
The fracture properties of shale containing fractures have been studied extensively by many scholars. For example, Zuo et al. (Zuo et al., 2019) performed a three-point bending test on shale specimens containing different angular incisions and observed them by scanning electron microscopy (SEM), the results show that the crack usually extends from the tip of the notch towards the loading point, with a more tortuous path as the tilt angle of the notch becomes larger. Shi et al. (Shi et al., 2018) cut prefabricated fissure at different angles in the cis-bedding plane and used a dynamic rock triaxial test system to simulate hydraulic fracturing tests. The results show that the greater the angle of the prefabricated fissure, the greater the maximum pore pressure at which the specimen ruptures. The damage pattern also shows various anisotropies with the fracture’s angle (Yang et al., 2019). used Hopkinson compression bars for impact loading of semicircular bent shale specimens containing cracked notches, the results show that the laminar surface changes the direction of crack extension. Brazil splitting test is a method to measure the tensile properties of rocks. It is not only used to indirectly test the tensile strength of rocks, but also often used to study the fracture properties of rocks. Many scholars have already studied rocks containing Prefabricated fissure using the Brazilian splitting test. Xiong et al. (Xiong et al., 2019) measured shales with type Ⅰ fracture toughness based on Brazilian cleavage, and investigated the effects on fracture toughness in terms of clay minerals, brittle minerals, temperature, and hydration in shales, respectively. Zhou et al. (Zhou and Wang 2016) investigated the mechanism of fissures expansion by compressing Brazilian disc specimens containing single and double fissures based on Non-ordinary state-based peridynamic theory (NOSB-PD). The effect of specimen size and crack inclination on the damage load of specimens with prefabricated fissures is also considered. Several scholars have used the digital image correlation (DIC) method to study the process of crack emergence and expansion in specimens with prefabricated fissures under different loading angles (Xi et al., 2020; Zhou et al., 2021).
However, the limitations of physical tests are that the crack extension process cannot be observed frame by frame and there are certain errors from one specimen to another. Nowadays, numerical simulation is also widely used in the field of oil and gas extraction and rock damage. For example, He and Liu et al. (Liu et al., 2020; He et al., 2021) simulated Brazilian splitting tests using PFC2D software, and a numerical model of rocks containing double fractures was developed to analyze the indirect tensile mechanical behavior of anisotropic disc specimens. The RFPA -dynamic program was used to build numerical models to study the impact properties and mechanisms of different numbers of prefabricated parallel cracks on the specimens (Zhang et al., 2020). The above studies are all based on the two-dimensional case to consider the crack expansion. However, the real crack expansion occurs in three-dimensional space. Therefore, some scholars have also considered various properties of rocks in three-dimensional conditions. For example, based on the RFPA3D finite element program, different 3D models have been constructed to study the rupture mechanism of the specimens by direct shear test, SHPB test, and Brazilian splitting test (Dai et al., 2015; Liao et al., 2020; Zhang et al., 2021). The higher order term coefficients of the Williams series expansion of the central cracked Brazilian disc under compressive loading were obtained using the digital image correlation (3D-DIC) method and the finite element method (Moazzami et al., 2018). Luo et al. (Luo et al., 2017) used digital image correlation technique (3D-DIC) to record the deformation of the specimens under the Brazilian splitting test, and the effects of cracks with different dip angles and lengths present in the Brazilian disc on its mechanical properties, fracture initiation and extension were investigated.
However, due to the complex mineral composition of shale, it contains many brittle minerals. The previous research understanding and practical experience show that the better the brittleness of shale is, the stronger the fracture making ability is, the easier it is to form a complex fracture network, and the better the fracture transformation effect is. Quartz is the main brittle mineral, and its content can effectively reflect the brittleness of shale. However, the general numerical model construction method cannot reflect the shape and distribution characteristics of irregular brittle minerals in real rock mass, and cannot simulate the real mineral distribution characteristics in rock. CT scanning technology is a non-destructive testing method, CT images can well reflect the pore structure inside the rock. In recent years, many scholars have applied CT scanning technology to geotechnical research, and certain research progress has been made (He et al., 2016; Zhou et al., 2016; Li et al., 2017; Dong et al., 2018). The above study lays the foundation for the reconstruction of 3D models from CT scan images.
Therefore, this paper takes shale containing prefabricated fissure as the research object, obtains the internal structure image of shale by CT scan. Combined with this image, a three-dimensional model was built in RFPA-3D, which can reflect the internal meso structure of rocks and characterize the heterogeneity of shale. This model is highly consistent with the real rock sample. Conducted Brazilian splitting tests to study the damage pattern, tensile strength and acoustic emission properties of shale containing prefabricated fissure.
This test piece is taken from the shale of the Lower Cambrian Niutitang Formation in northern Guizhou. The lithology of the study area is mainly black carbonaceous shale, and the mineral composition of the shale is mainly clay minerals and brittle minerals. Brittle minerals mainly include quartz, calcite and carbonate minerals. Generally, the higher the content of brittle minerals and the lower the content of clay minerals in shale, the easier it is to form natural fractures under the action of tectonic stress field or induced fractures during hydraulic fracturing. Therefore, mineral components have a very important influence on the formation of fractures in shale reservoirs. This paper conducts XRD whole rock diffraction analysis and clay mineral analysis on shale of Niutitang Formation of Lower Cambrian. Figure 1 shows the results of XRD diffraction analysis. The results show that the average content of quartz is 40%, the average content of carbon shale is 29%, and the average content of feldspar is 15%. The average content of dolomite is 10%, the average content of pyrite is 5%, and the average content of biotite is 1%.
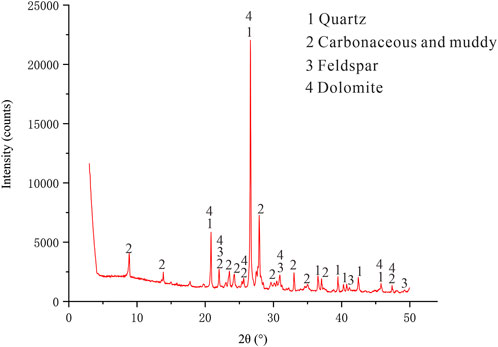
FIGURE 1. XRD whole rock diffraction analysis diagram.
The instrument used in this CT scanning experiment is the X-ray three-dimensional ultra precision micro nano structure detector, and the model is Voxel-3502E. The instrument’s X-ray source voltage is 20–190KV, and the highest spatial resolution of the instrument can reach 0.5 μm. The instrument uses a large field of view flat detector and objective coupling detector together for test imaging, using the current advanced algorithm for three-dimensional accurate and rapid reconstruction of the image. Obtain three-dimensional body data that reflect the real spatial structure inside the sample, and improve the resolution by reducing the size of the detector unit with an optical magnification system.
The principle of CT scanning is that after X-rays penetrate a substance, the degree of attenuation of X-ray intensity is proportional to the density of the object and the thickness of the object. The grayscale value of the CT scan image directly shows the degree of X-ray attenuation: the color changes from black to white, the greater the density of the substance, the higher the degree of X-ray attenuation, and the grayscale value is large (Xue et al., 2015). In the scanning process, During scanning, the positions of the X-ray source and detector are always kept unchanged. The sample rotates at a constant speed from −180° to 180°. One picture is taken every n degrees of rotation. The CT scanning image is shown in Figure 2. The scanning image is 1246 × 1246 pixels, the gray black part of the image is shale matrix. Through thin section identification, the bright spot part is mainly quartz granular ore, the particles are in point line contact or no contact with each other, sub round sub angular, with medium sorting preference, and the particle size range is 0.01–0.1 mm.
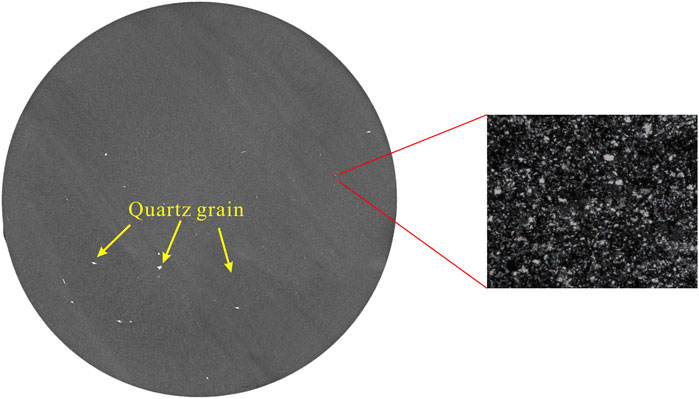
FIGURE 2. CT scanning image.
Cut the CT image, and obtain the microstructure information of the image by histogram threshold method. A prefabricated crack with a length of 25 mm and a thickness of 0.8 mm is set on the scanning image by using the numerical image processing technology, and the sharp crack tip is obtained by reducing the pixel points at the tip. The Brazilian splitting test was performed by spacer loading, with two loading plates set up at both ends of the specimen.
Due to the limitation of computing power, the slice image pixel of CT scan was reduced to 200 × 200. Image processing selects multi threshold segmentation in HSI (Hue is chromaticity, Saturation is saturation, Intensity is brightness) color space by changing the brightness I value. To determine the image segmentation threshold I, a scanning line passing through the rock matrix and quartz mineral at the same time is randomly selected in Figure 3A. Counts the grayscale value of each pixel point on this scan line. The grayscale values of the shale matrix in the scanned image shown in Figure 3B are located below the dashed line and the grayscale values of the quartz are located above the dashed line. The finalized grayscale values were determined by multiple threshold segmentation tests to distinguish between shale matrix and cavity units (I = 40), shale matrix and quartz minerals (I = 105). The image after threshold segmentation is shown in Figure 4.
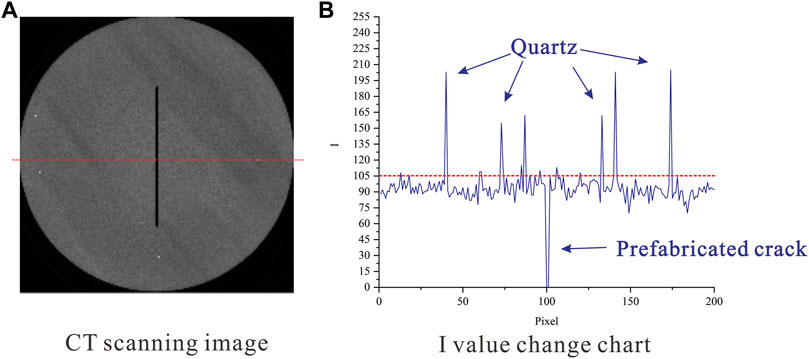
FIGURE 3. I-value change curve. (A) CT scanning image. (B) I value change chart.
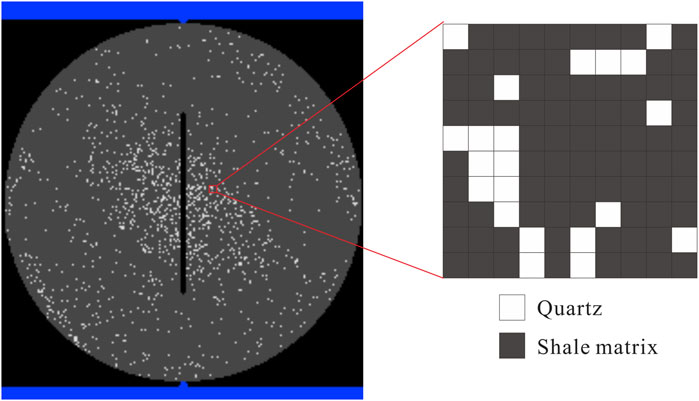
FIGURE 4. Image after threshold segmentation.
To build a 3D digital specimen of the shale, 50 CT image slices were uniformly selected, and 50 digital images of the fine structure of the shale represented were imported into RFPA3D for superimposition. In the reconstruction process, it is assumed that the material slice image can represent the fine structure of a material with a small thickness d. If d is small, the error in the fine structure characterization can be neglected, and the slice thickness d = 0.2 mm is taken. Figure 5 shows the flow chart of 3D numerical model building, and the final 3D numerical model of shale is shown in Figure 5C. The model size is a Brazilian disk with a diameter of 50 mm and a thickness of 25 mm. The entire model is divided into two million units. The prefabricated fissure is set as a cavity unit, the elastic modulus of the loading plate is set to 10 times larger than the material, the compressive strength is set to 500 MPa, and the loading plate is fixed.
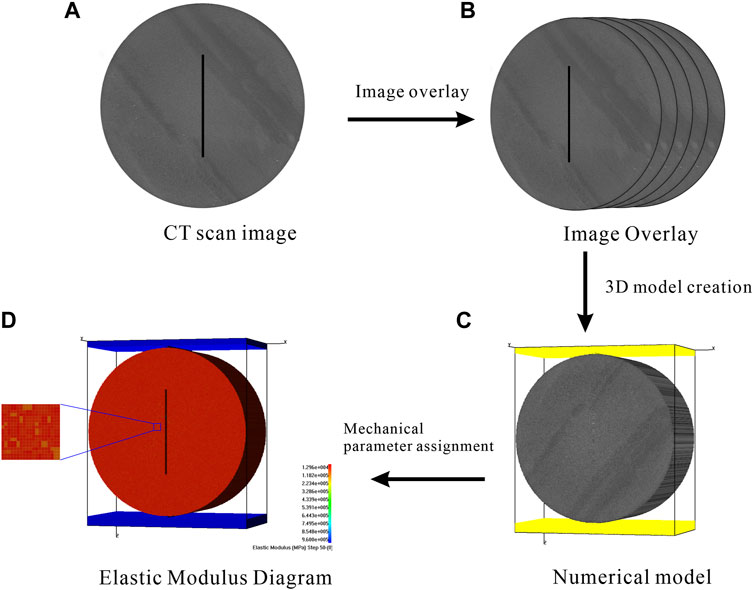
FIGURE 5. Flow chart of 3D numerical model reconstruction. (A) CT scan image. (B) Image overlay process. (C) Numerical model. (D) Diagram of elastic modulus of numerical model.
Weibull distribution function (Weibul, 1939) in RFPA3D was used to assign values to non-uniform shale specimens. The values of strength, Poisson’s ratio, modulus of elasticity and density of the fine unit are assigned by the following equation:
Where x denotes the material medium matrix physical properties parameters (elastic modulus, strength, Poisson’s ratio, density, etc.). β denotes the average of the parameters of the physical properties of the primitive, m indicates the nature parameter of the distribution function, whose physical meaning reflects the homogeneity of the material medium, defined as the homogeneity coefficient of the material medium, reflecting the degree of homogeneity of the material, f(x) is the density of the statistical distribution of the physical properties x of the material (rock) primitive. The material parameters in this test are derived from the mechanical parameters of shale in the Lower Cambrian Niutitang Formation in north area of Guizhou (Wu et al., 2020), and are summarized in Table 1, where the values in brackets represent the uniformity coefficient of this parameter. The elastic modulus diagram after the assignment is shown in Figure 5D.
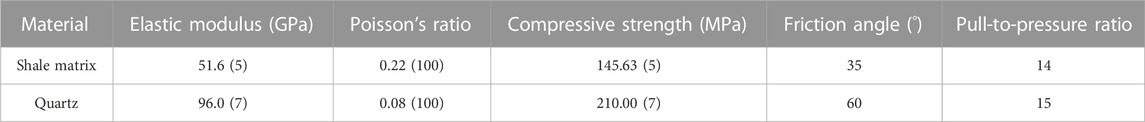
TABLE 1. Material parameters of shale specimens.
The prefabricated fracture angle α is the angle between the fracture and the loading direction. In this paper, the prefabricated fracture angles were selected at equal intervals of 15°, which were 0°, 15°, 30°, 45°, 60°, 75°, 90° and complete specimens for a total of eight groups of prefabricated fracture specimens. Eight groups of undivided quartz test pieces were made synchronously as the control group. The established model sets the loading direction as Z-axis and uses displacement loading method with initial displacement of 0.0001 mm/step and loading displacement of 0.0002 mm/step at each step until the specimen is damaged.
The mechanical properties of the pressed solids were determined by the Brazil test. The maximum fracture strength σr is given by the following equation.
where F is the damage load, and R and B are the diameter and thickness of the sample, respectively.
Figure 6 shows the influence of prefabricated crack angle on the tensile strength of the test piece. It can be seen from the figure that the tensile strength of the two kinds of test pieces is greatly affected by the prefabricated crack angle, and the tensile strength curves are in “M” shape. The tensile strength is significantly affected by the 45° angle specimen. When the crack angle α = 45°, the tensile strength of both test pieces is the minimum; When the crack angle α = 60°, the tensile strength of both test pieces is the maximum. The reason for the large difference in tensile strength is that the existence of prefabricated cracks makes the rock sample produce obvious structural effect. Near the cracks, the bonding force between the rock particles that make up the rock mass is lower than that of the complete rock mass, and the tensile strength of the rock mass will have a large difference under different inclinations. Comparing the failure strength of the two specimens, it can also be found that the failure strength of the specimens containing quartz minerals is far lower than the tensile strength of the specimens without quartz minerals, and the strength of the specimens without quartz minerals changes greatly. The main reason for this difference is that quartz is a typical brittle mineral with high elastic modulus, low Poisson’s ratio and low toughness. Under the effect of fracturing, the internal cohesion of the rock will be broken, and under certain stress, the rock will not undergo obvious deformation and will break directly. Therefore, quartz mineral will greatly affect the failure strength of the test piece. For shale with high quartz content, the more brittle it is, the stronger its fracture making ability is, the easier it is to form a complex fracture network, and the more ideal the volume fracturing effect is.
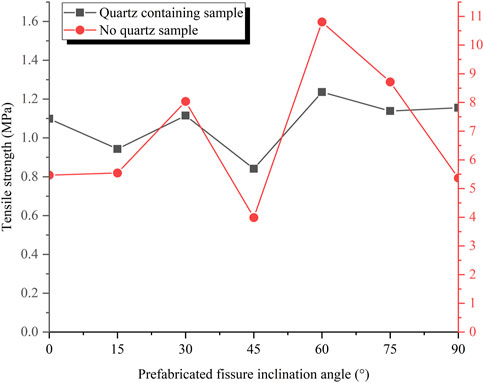
FIGURE 6. Effect of prefabricated fissure angle on the peak stress of the specimen.
To sum up, prefabricated cracks and quartz minerals have a significant impact on the failure strength of the component. On the one hand, this effect is manifested in the substantial weakening of quartz on the strength, and on the other hand, it is manifested in the anisotropy of the angle of the prefabricated crack on the strength, that is, the strength of the specimen varies greatly with the angle of the prefabricated crack.
Figure 7 shows the stress-strain curve of the numerical simulation test. It can be seen from the figure that the strength of shale is greatly weakened by prefabricated cracks, and the tensile strength of both specimens is far lower than that of complete specimens. The failure stages of the two specimens are also quite different. For the test piece containing quartz, the failure can be divided into three stages: elastic stage, plastic stage and failure stage. At the beginning of loading, the stress changes linearly with strain, and at this time it is in the elastic stage, only a relatively small number of units rupture and no obvious cracks are produced. To reach the peak stress when the curve begins to flatten out and a microcrack begins to sprout, at which point it is the yielding stage. When the peak stress is reached, the stress falls rapidly, at which time the internal unit ruptures in large numbers and the crack sharply begins to extend and expand until it penetrates the specimen, at which point it is the damage stage.
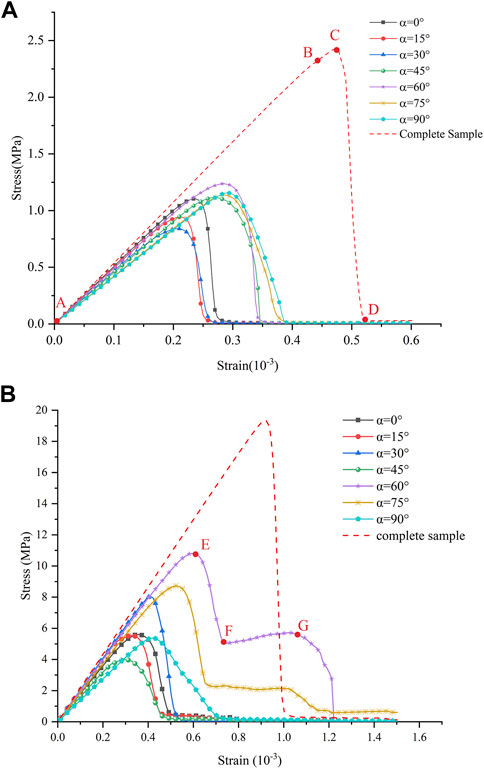
FIGURE 7. Numerical simulation test stress-strain curve. (A) Sample containing quartz. (B) Sample without quartz.
For the test piece without quartz, the fracture dip angle α= 60° and 75°, compared with the above conditions, the residual failure stage occurs after the instability failure of the specimen, and the specimen has a certain residual strength, showing a certain plastic characteristics. The main reason is that this model does not separate the main brittle mineral quartz through the threshold value. The mechanical parameters of the remaining shale matrix are mainly the mechanical parameters of clay minerals. The elastic modulus is far lower than quartz, and the Poisson’s ratio is far higher than quartz, which has a certain plasticity. Therefore, when the inclination angle is α= 60° and 75°, the shear stress concentration appears at both ends of the prefabricated crack, the crack does not penetrate the test piece instantaneously, and the test pieces on both sides continue to bear a certain compressive stress.
To sum up, quartz minerals will affect the variation characteristics of the stress-strain curve, and the test pieces containing quartz show good brittleness characteristics. The mechanical action stage includes linear elastic stage (A-B), strain hardening stage (B-C) and failure stage (C-D). In the quartz free specimen, after the 60° and 75° specimens reach the peak stress again, there are post peak softening stage (E-F) and residual strength stage (F-G).
Figure 8 shows the fracture process of specimens with different fissures dip angles, which clearly shows the progressive fracturing process of disc specimens with different angles of prefabricated fissure. The whole process can be divided into the stage of crack emergence, the stage of crack expansion, and the stage of crack penetration. According to the location of crack sprouting (Deng et al., 2017), classified the cracks into primary and secondary cracks. Among them, primary cracks are sprouted from prefabricated fissures and expand along the loading direction; secondary cracks are sprouted from near the loading point or the edge of the specimen and expand along the direction of the crack tip.
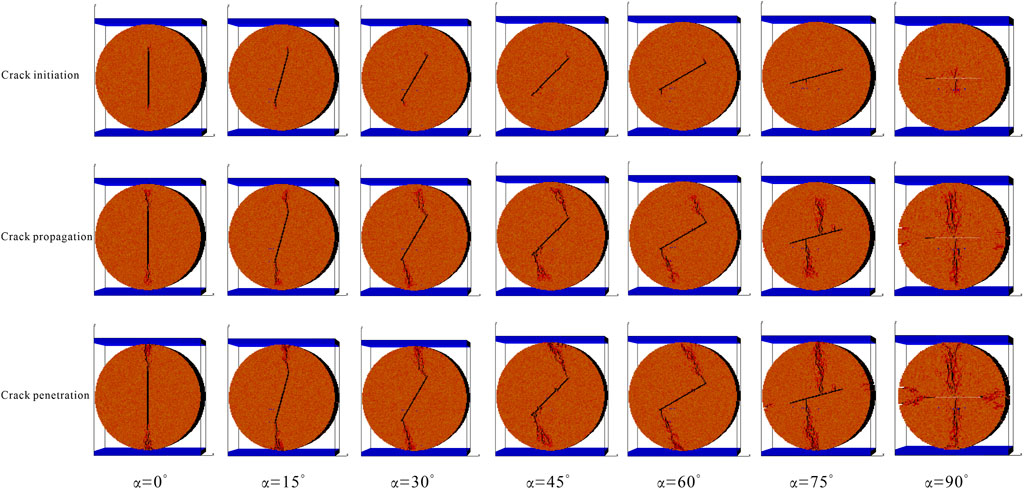
FIGURE 8. Crack extension pattern of numerical simulation specimen.
When the prefabricated crack dip angle α = 0°–60°, at the early stage of loading, the unit near the tip of the prefabricated fissure starts to break down, and the primary crack sprouting at the tip gradually extends to the loading end, followed by a small number of secondary cracks sprouting near the loading point to intersect with the primary crack or expand in the direction of the crack tip. When the prefabricated crack dip angle α = 75°, in the crack budding stage, a unit rupture began around the prefabricated crack, producing some cracks with a tendency to expand toward the loading point. Subsequently, the main crack sprouts at the non-tip, but near the middle part of the fissure, and the main crack extended to the loading point and stopped loading. When the prefabricated fissure dip angle α = 90°, the location of crack sprouting starts from the middle part of the prefabricated crack. After a period of loading, secondary cracks begin to sprout on the left and right edges of the specimen expanding towards the tip of the crack. Eventually the primary cracks connect to the loading point and the secondary cracks connect to the tip of the prefabricated fissure, and the loading ends when the cracks all penetrate each other. The location of crack initiation around the prefabricated crack is mainly determined by the location of its maximum tensile stress. With the increase of the prefabricated crack angle, the location of the maximum tensile stress gradually shifts from the crack tip to the middle of the crack.
Based on the damage results of the specimens from the numerical simulation and similar simulation tests, the crack dip angle of the prefabricated fissure tip can be measured, and the measured results are shown in Table 2. The cracking angle of the prefabricated fissure tip characterizes the cracking orientation of the prefabricated fissure tip, because the cracking point of the specimens with α = 75° and 90° is not at the prefabricated fissure tip, so it is not valid measurement result.
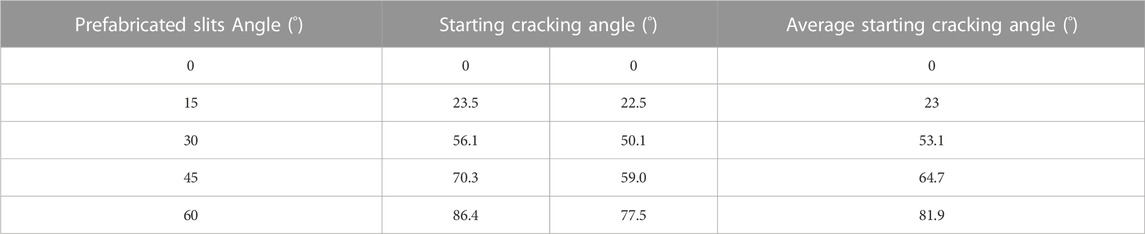
TABLE 2. Prefabricated fissure tip starting angle.
Based on the peak load Pmax of the test damage, refer to the calculation method of Erarslan and Atkinson (Atkinson et al., 1982; Erarslan 2013), the test data were substituted into Eqs 4, 5 to obtain the type Ⅰ fracture toughness value KⅠ and type Ⅱ fracture toughness value KⅡ for different prefabricated fissure angle specimens, and the calculated results are shown in Table 3.
Where p is the peak load at the time of specimen damage, a is the half-length of the prefabricated fissure, R is the radius of the Brazilian disc, B is the thickness of the Brazilian disc, Ti, Si, Ai and Bi represent numerical factors. See the literature for specific meanings (Atkinson et al., 1982).
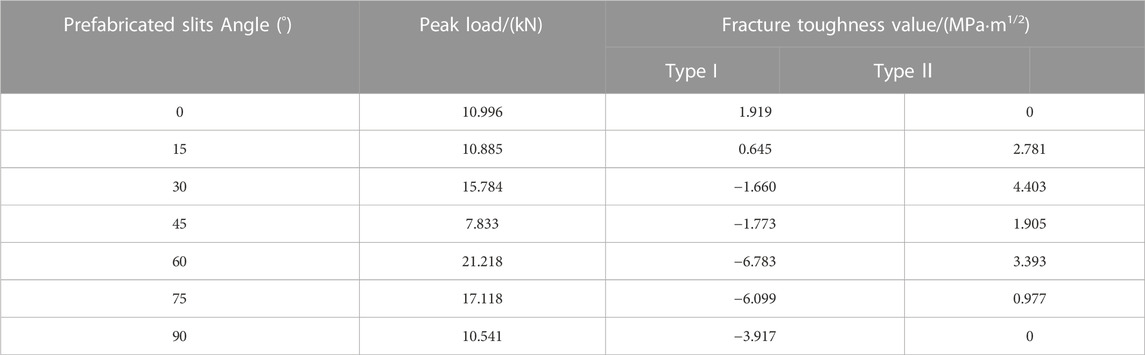
TABLE 3. Calculation results of fracture toughness values.
According to the theory of fracture mechanics, stress concentration occurs at the tip of the crack under external load, and when a limit state is reached, the crack starts to crack and expand, and then a penetration crack is formed and the specimen breaks. The maximum tangential stress criterion (MTS) is one of the most widely used criteria in rock fracture mechanics, which can effectively predict the crack extension characteristics under mixed loading mode (Aliha et al., 2008). In this paper, the MTS criterion is introduced to analyze the fracture mechanism of Brazilian disc specimens containing prefabricated fissure.
According to the Williams (Williams 1957) infinite series expansion, in the I-II mixed loading mode, the tangential stress component at the crack tip can be expressed in the following form if only the action of the singular term is considered:
Where r and θ are the polar coordinate components of the crack tip, and KI and KII are the type I and II fracture toughness values, respectively. According to the MTS criterion, the crack initiation angle θ0 can be determined by the following equation:
Figure 9 shows the comparison between the experimental results of starting cracking angle and the predicted results of the MTS criterion, and it can be seen from the figure that the experimental results are in good agreement with the MTS criterion. The validity of the numerical simulation is illustrated, and it can be seen that the crack initiation angle is controlled by the prefabricated fissure angle, and the starting cracking angle increases with the increase of the prefabricated fissure dip angle. When the prefabricated crack angle reaches near 75°, the crack initiation position deviates from the prefabricated crack tip.
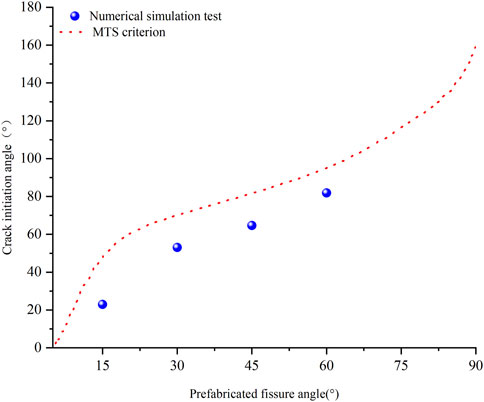
FIGURE 9. Comparison of the experimental results of starting cracking angle with the predicted results of MTS criterion.
When the internal structural units of a brittle material are damaged, acoustic energy is released, so this phenomenon of rapid energy release in a localized area can be called acoustic emission (AE). The acoustic emission characteristics of the Brazilian disc specimen are related to the whole loading process, and the acoustic emission properties can reflect the degree of damage to the structure. The spatial cumulative distribution of acoustic emission points for each specimen at three stress levels (σ/σmax) is shown in Figure 10, corresponding to the ground acoustic emission can be divided into budding, plateauing and surge periods. A ball in the figure represents an acoustic emission event, blue and red circles represent tensile and shear damage, respectively.
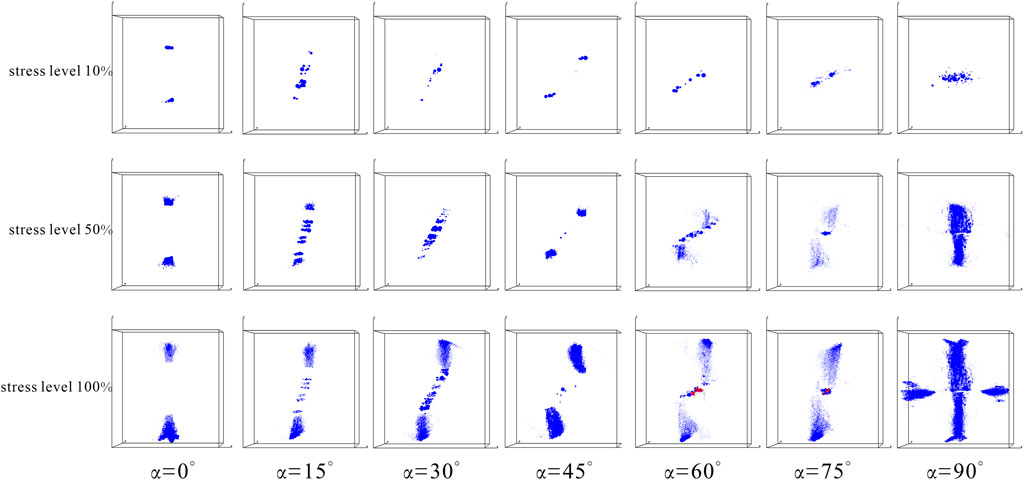
FIGURE 10. Spatial distribution of acoustic emission points at different dip angles and stress levels.
The spatial evolution of acoustic emission can be seen from the diagram: at lower stress levels (10%), a small number of acoustic emission points appear around the fissure due to the concentration of stress around the fissure. Among them, 0° and 45° specimens only have acoustic emission points near the crack tip. As the stress level rises, the damage within the specimen continues to accumulate and acoustic emission points appear with the direction of crack extension. When the peak stress is reached, the number of acoustic emissions skyrockets, and in terms of the density of the spheres, the number of acoustic emissions is highest at 90° and less at 0° and 15°, which is consistent with the number of cracks. From the overall view, the damage modes of α = 0°–45° and 90° are dominated by tensile damage. For α = 60° and 75° specimens, shear damage occurred internally at a stress level of 100%, so the damage mode is a tensile and shear composite damage mode.
The failure modes of Brazilian disc specimens with prefabricated fissure can be divided into four categories: The tensile failure along the central part of the specimen (Type Ⅰ), the tensile failure along the dip direction of the precast crack (Type II), the tensile failure at the precast crack tip (Type III), and the tensile and shear composite failure near the precast crack tip (Type IV). From the above analysis of the damage pattern map and the acoustic emission distribution map. It can be concluded that when α=0°–45°, the damage mode of the numerical model specimen is type III; when α=60° and 75°, the damage mode is type IV; when α=90°, the damage mode is a combination of type I and type II.
Acoustic emission activity can be realistically simulated in RFPA3D, including acoustic emission counting and cumulative energy release. The cumulative AE damage number reflects the degree of damage, and the cumulative damage number is D. The calculation formula is as follows:
Where s is the number of calculation steps, ni is the number of damaged cells in step i, and N is the total number of cells in the model (Tang et al., 2000).
Figure 11 shows the trend of stress, AE, and cumulative AE with strain for seven groups of different prefabricated angles of fractures. The acoustic emission counting curves during the whole loading process can be divided into two modes: one is peak distribution type, i.e. the specimen shows one or two peaks of acoustic emission counting respectively during the whole loading process; the other is peak and uniform distribution type, i.e. there is still uniform acoustic emission generation after the peak. From Figure 11, it can be seen that the characteristic pattern of acoustic emission counting curves for α = 0°–45° and 90° specimens is peak distribution type. Where α = 0°–45° specimens acoustic emission counts reach a peak and then rapidly drop to 0, indicating that the damage of the specimens is a transient process, showing obvious characteristics of brittle damage. The characteristic pattern of the acoustic emission count curve of the α = 90° specimen is of the double-peak distribution type, as shown in Figure 11. (g) The acoustic emission count exhibits two higher peaks. Combined with the acoustic emission spatial distribution diagram (Figure 10), it can be analyzed that this is due to the fact that while the primary crack of the specimen with α = 90° expands towards the loading point, secondary cracks also sprout from the left and right edges of the specimen towards the tip of the prefabricated fissure. The first AE peak occurs due to the extension of the primary crack and the second AE peak occurs due to the extension of the secondary crack. The characteristic pattern of acoustic emission counting curves for α=60° and 75° specimens is peak and uniform distribution type. Although the acoustic emission count of the specimen has reached the peak, the cumulative acoustic emission number is still increasing, indicating that the crack has not been fully penetrated and the specimen still has a certain residual strength. As loading proceeded, there were still acoustic emission events occurring and the cumulative AE counts were increasing in small amounts.
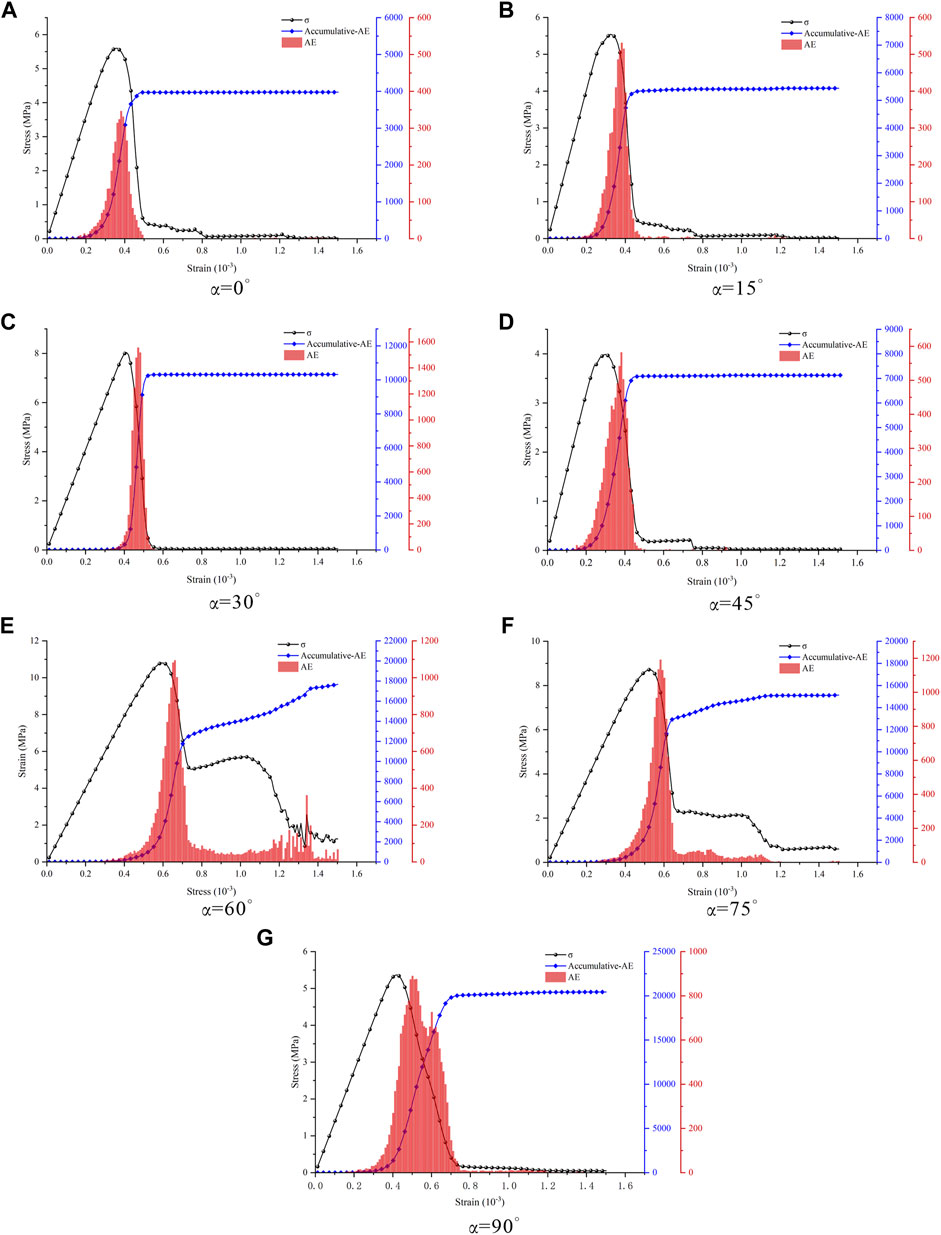
FIGURE 11. Trend of stress, AE, and cumulative AE with strain at different α. (A) α = 0°. (B) α = 15°. (C) α = 30°. (D) α = 45°. (E) α = 60°. (F) α = 75°. (G) α = 90°.
In summary, the acoustic emission characteristics of disc specimens containing prefabricated fissure have certain correlation characteristics with the fracture mode of the specimens, and such correlation characteristics are mainly manifested as follows: When the specimen is purely tensile damage, the acoustic emission counting curve of the specimen shows single-peak distribution characteristics (0°–45°); when the specimen shows compound tensile damage, the acoustic emission counting curve of the specimen mainly shows double-peak distribution characteristics (90°); When the specimen exhibits tensile and shear compound damage, the acoustic emission counting curve of the specimen mainly exhibits the characteristics of peak and uniform distribution. This indicates that the more single the damage mode of the specimen and the more obvious the characteristics of tensile damage, the more obvious the characteristics of the peak distribution of the acoustic emission counting curve.
In this paper, a 3D model of the real fine structure is constructed based on the slice images obtained by CT scan scanning technology combined with RFPA3D software, using shale as the research object. The splitting process of Brazilian disc specimens containing prefabricated fissure was simulated, and the effects of different prefabricated dip angles on the tensile strength, crack extension process, damage mode, and damage evolution process of shale were analyzed. The following conclusions were finally obtained.
1) Identification of shale specimen sections based on CT image scanning and CT image analysis processing techniques, and reconstructed the shale 3D digital specimen reconstruction, and established a shale 3D numerical specimen model. It provides a feasible method for an in-depth study of the fine mechanics mechanism of rocks.
2) Prefabricated fractures and quartz minerals will weaken the tensile strength of shale specimens. The presence of quartz will increase the brittleness of shale. The higher the brittleness, the easier it is to fracture, and the stronger the ability of shale to create fractures. Different fracture inclination angles are affected differently, where the damage strength is the smallest at α=45°, 0.84 MPa, and the largest at α=60°, 1.23 MPa.
3) The crack initiation angle is controlled by the prefabricated crack angle, which increases as the prefabricated crack dip angle increases. The MTS criterion can be used as a basis for judging the crack initiation of prefabricated fissure, and it also verifies the accuracy of the numerical model.
4) The damage modes can be divided into four categories: The tensile failure along the central part of the specimen (Type Ⅰ), the tensile failure along the dip direction of the precast crack (Type Ⅱ), the tensile failure at the precast crack tip (Type Ⅲ), and the tensile and shear composite failure near the precast crack tip (Type Ⅳ).
5) According to the results of acoustic emission characteristics analysis, it can be seen that the more single the damage mode of the specimen, and the more obvious the characteristics of tensile damage, the more obvious the characteristics of the peak distribution of the acoustic emission counting curve. The cumulative AE counts can be divided into budding, plateauing and surge periods.
The original contributions presented in the study are included in the article/supplementary material, further inquiries can be directed to the corresponding author.
Conceptualization, YY, ZW, and YZ; Data curation, YY and HS; Formal analysis, YY and WW; Funding acquisition, MT and HC; Methodology, YY and ZW; Writing—original draft, YY; Writing-review and editing, YY and ZW. All authors have read and agreed to the published version of the manuscript.
This research was funded by the National Natural Science Foundation of China, grant number 51964007, 51774101 and 52104080, Guizhou Science and Technology Fund, grant number [2020]4Y046, [2019]1075, and [2018]1107.
The authors declare that the research was conducted in the absence of any commercial or financial relationships that could be construed as a potential conflict of interest.
All claims expressed in this article are solely those of the authors and do not necessarily represent those of their affiliated organizations, or those of the publisher, the editors and the reviewers. Any product that may be evaluated in this article, or claim that may be made by its manufacturer, is not guaranteed or endorsed by the publisher.
Aliha, M., Ayatollahi, M., and Pakzad, R. (2008). Brittle fracture analysis using a ring-shape specimen containing two angled cracks. Int. J. Fract. 153 (1), 63–68. doi:10.1007/s10704-008-9280-9
Atkinson, C., Smelser, R., and Sanchez, J. (1982). Combined mode fracture via the cracked Brazilian disk test. Int. J. Fract. 18 (4), 279–291. doi:10.1007/BF00015688
Bowker, K. (2007). Barnett shale gas production, fort worth basin: Issues and discussion. AAPG Bull. 91 (4), 523–533. doi:10.1306/06190606018
Dai, F., Wei, M., Xu, N., Ma, Y., and Yang, D. (2015). Numerical assessment of the progressive rock fracture mechanism of cracked chevron notched Brazilian disc specimens. Rock Mech. Rock Eng. 48 (2), 463–479. doi:10.1007/s00603-014-0587-8
Darabi, H., Ettehad, A., Javadpour, F., and Sepehrnoori, K. (2012). Gas flow in ultra-tight shale strata. J. Fluid Mech. 710, 641–658. doi:10.1017/jfm.2012.424
Deng, Q., Gong, L., Ma, F., Xue, Y., Geng, X., and Hu, S. (2017). Analysis of crack propagation of crack straight through brazilian disc using particle flow code. J. Eng. Geol. 25 (2), 402–409. doi:10.13544/j.cnki.jeg.2017.02.018
Dong, H., Sun, J., Lin, Z., Fang, H., Li, Y., Cui, L., et al. (2018). 3D pore-type digital rock modeling of natural gas hydrate for permafrost and numerical simulation of electrical properties. J. Geophys. Eng. 15 (1), 275–285. doi:10.1088/1742-2140/aa8a8e
Erarslan, N. (2013). A study on the evaluation of the fracture process zone in CCNBD rock samples. Exp. Mech. 53 (8), 1475–1489. doi:10.1007/s11340-013-9750-5
He, B., Liu, J., Zhao, P., and Wang, J. (2021). PFC2D-based investigation on the mechanical behavior of anisotropic shale under Brazilian splitting containing two parallel cracks. Front. Earth Sci. 15 (4), 803–816. doi:10.1007/s11707-021-0895-8
He, P., Kulatilake, P., Liu, D., He, M., and Chen, X. (2016). A procedure to detect, construct, quantify, numerically simulate and validate fracture networks in coal blocks. Geomechanics Geophys. Geo-Energy Geo-Resources 2 (4), 257–274. doi:10.1007/s40948-016-0035-1
Jarvie, D. M., Hill, R. J., Ruble, T. E., and Pollastro, R. M. (2007). Unconventional shale-gas systems: The Mississippian Barnett Shale of north-central Texas as one model for thermogenic shale-gas assessment. AAPG Bull. 91 (4), 475–499. doi:10.1306/12190606068
Li, J., Jiang, H., Wang, C., Zhao, Y., Gao, Y., Pei, Y., et al. (2017). Pore-scale investigation of microscopic remaining oil variation characteristics in water-wet sandstone using CT scanning. J. Nat. Gas Sci. Eng. 48, 36–45. doi:10.1016/j.jngse.2017.04.003
Liao, Z., Ren, M., Tang, C., and Zhu, J. (2020). A three-dimensional damage-based contact element model for simulating the interfacial behaviors of rocks and its validation and applications. Geomechanics Geophys. Geo-Energy Geo-Resources 6 (3), 45–21. doi:10.1007/s40948-020-00171-z
Liu, S., Wang, H., Xu, W., Qu, X., and Xie, W. (2020). Numerical Brazilian split test of pre-cracked granite with randomly distributed micro-components. Eng. Comput. 37 (8), 2641–2657. doi:10.1108/EC-03-2019-0123
Liu, Z., Wang, S., Ye, H., Yang, L., Yang, D., Lian, H., et al. (2021). Experimental study on the effects of pre-cracks, fracturing fluid, and rock mechanical characteristics on directional hydraulic fracturing with axial pre-cracks. Geomechanics Geophys. Geo-Energy Geo-Resources 7 (2), 29. doi:10.1007/s40948-021-00225-w
Luo, L., Li, X., Qiu, J., and Zhu, Q. (2017). Study on fracture initiation and propagation in a Brazilian disc with a preexisting crack by digital image correlation method. Adv. Mater. Sci. Eng. 2017, 1–13. doi:10.1155/2017/2493921
Moazzami, M., Ayatollahi, M., Chamani, H., Guagliano, M., and Vergani, L. (2018). Determination of higher order stress terms in cracked Brazilian disc specimen under mode I loading using digital image correlation technique. Opt. Laser Technol. 107, 344–352. doi:10.1016/j.optlastec.2018.06.010
Ougier-Simonin, A., Renard, F., Boehm, C., and Vidal-Gilbert, S. (2016). Microfracturing and microporosity in shales. Earth-Science Rev. 162, 198–226. doi:10.1016/j.earscirev.2016.09.006
Perez, R. (2010). Application of LMR inversion and clustering analysis in the Barnett Shale. SEG Technical Program Expanded Abstracts 2010: Society of Exploration Geophysicists. p 2236–2239. doi:10.1190/1.3513294
Shi, X., Zhang, X., Wang, B., Tang, T., and Han, W. (2018). Hydraulic fracturing test with prefabricated crack on anisotropic shale: Laboratory testing and numerical simulation. J. Petroleum Sci. Eng. 168, 409–418. doi:10.1016/j.petrol.2018.04.059
Tahmasebi, P., Javadpour, F., Sahimi, M., and Piri, M. (2016). Multiscale study for stochastic characterization of shale samples. Adv. Water Resour. 89, 91–103. doi:10.1016/j.advwatres.2016.01.008
Tang, C., Liu, H., Lee, P., Tsui, Y., and Tham, L. (2000). Numerical studies of the influence of microstructure on rock failure in uniaxial compression — Part I: Effect of heterogeneity. Int. J. Rock Mech. Min. Sci. 37, 555–569. doi:10.1016/S1365-1609(99)00121-5
Wang, R., Ding, W., Zhang, Y., Wang, Z., Wang, X., He, J., et al. (2016). Analysis of developmental characteristics and dominant factors of fractures in lower cambrian marine shale reservoirs: A case study of Niutitang Formation in cen’gong block, southern China. J. Petroleum Sci. Eng. 138, 31–49. doi:10.1016/j.petrol.2015.12.004
Weibul, W. (1939). A statistical theory of the strength of materials. Swed R. Inst. Eng. Res. 151, 1–45. doi:10.1090/S0002-9939-1966-0198262-1
Williams, M. (1957). On the stress distribution at the base of a stationary crack. J. Appl. Mech. 24 (1), 109–114. doi:10.1115/1.4011454
Wu, Z., Lou, Y., Yin, S., Wang, A., Liu, H., Sun, W., et al. (2020). Acoustic and fractal analyses of the mechanical properties and fracture modes of bedding-containing shale under different seepage pressures. Energy Sci. Eng. 8 (10), 3638–3656. doi:10.1002/ese3.772
Wu, Z., Zuo, Y., Wang, S., Chen, J., Wang, A., Liu, L., et al. (2017). Numerical study of multi-period palaeotectonic stress fields in lower cambrian shale reservoirs and the prediction of fractures distribution: A case study of the Niutitang Formation in feng'gang No. 3 block, South China. Mar. Petroleum Geol. 80, 369–381. doi:10.1016/j.marpetgeo.2016.12.008
Xi, X., Wu, X., Guo, Q., and Cai, M. (2020). Experimental investigation and numerical simulation on the crack initiation and propagation of rock with pre-existing cracks. Ieee Access 8, 129636–129644. doi:10.1109/ACCESS.2020.3009230
Xiong, J., Liu, K., Liang, L., Liu, X., and Zhang, C. (2019). Investigation of influence factors of the fracture toughness of shale: A case study of the longmaxi formation shale in sichuan basin, China. China. Geotechnical Geol. Eng. 37 (4), 2927–2934. doi:10.1007/s10706-019-00809-0
Xue, H., Xu, R., Jiang, P., and Zhou, S. (2015). Characterization of rock microstructure using 3D x-ray computed tomography. Chin. J. Theor. Appl. Mech. 47 (6), 1073–1078. doi:10.6052/0459-1879-15-102
Yang, B., Xue, L., Duan, Y., and Wang, M. (2021). Correlation study between fracability and brittleness of shale-gas reservoir. Geomechanics Geophys. Geo-Energy Geo-Resources 7 (2), 31–13. doi:10.1007/s40948-021-00231-y
Yang, G., Li, X., Bi, J., and Cheng, S. (2019). Dynamic crack initiation toughness of shale under impact loading. Energies 12 (9), 1636. doi:10.3390/en12091636
Zhang, Y., Liu, H., Yin, G., Ou, C., Lu, J., and He, J. (2020). Impact failure of flattened Brazilian disc with cracks—process and mechanism. Sci. Ed. 35 (5), 1003–1010. doi:10.1007/s11595-020-2348-8
Zhang, Y., Ou, C., Liu, H., Lu, J., Cheng, C., and He, J. (2021). Experimental and numerical study on the dynamic fracture of flattened Brazilian discs with prefabricated cracks. Eng. Fract. Mech. 254, 107885. doi:10.1016/j.engfracmech.2021.107885
Zhou, G., Zhang, Q., Bai, R., and Ni, G. (2016). Characterization of coal micro-pore structure and simulation on the seepage rules of low-pressure water based on CT scanning data. Minerals 6 (3), 78. doi:10.3390/min6030078
Zhou, J., Zeng, Y., Guo, Y., Chang, X., Liu, L., Wang, L., et al. (2021). Effect of natural filling fracture on the cracking process of shale Brazilian disc containing a central straight notched flaw. J. Petroleum Sci. Eng. 196, 107993. doi:10.1016/j.petrol.2020.107993
Zhou, X., and Wang, Y. (2016). Numerical simulation of crack propagation and coalescence in pre-cracked rock-like Brazilian disks using the non-ordinary state-based peridynamics. J. Rock Mech. Min. Sci. 89, 235–249. doi:10.1016/j.ijrmms.2016.09.010
Zou, C., Dong, D., Wang, S., Li, J., Li, X., Wang, Y., et al. (2010). Geological characteristics and resource potential of shale gas in China. Petroleum Explor. Dev. 37 (6), 641–653. doi:10.1016/S1876-3804(11)60001-3
Keywords: shale, CT scan, 3D numerical model, prefabricated fissures, brazilian splitting test
Citation: Yang Y, Wu Z, Zuo Y, Song H, Wang W, Tang M and Cui H (2023) Three-dimensional numerical simulation study of pre-cracked shale based on CT technology. Front. Earth Sci. 10:1120630. doi: 10.3389/feart.2022.1120630
Received: 10 December 2022; Accepted: 19 December 2022;
Published: 09 January 2023.
Edited by:
Ken’ichi Matsumoto, Toyo University, JapanCopyright © 2023 Yang, Wu, Zuo, Song, Wang, Tang and Cui. This is an open-access article distributed under the terms of the Creative Commons Attribution License (CC BY). The use, distribution or reproduction in other forums is permitted, provided the original author(s) and the copyright owner(s) are credited and that the original publication in this journal is cited, in accordance with accepted academic practice. No use, distribution or reproduction is permitted which does not comply with these terms.
*Correspondence: Zhonghu Wu, d3V6aG9uZ2h1Z3p1QDE2My5jb20=
Disclaimer: All claims expressed in this article are solely those of the authors and do not necessarily represent those of their affiliated organizations, or those of the publisher, the editors and the reviewers. Any product that may be evaluated in this article or claim that may be made by its manufacturer is not guaranteed or endorsed by the publisher.
Research integrity at Frontiers
Learn more about the work of our research integrity team to safeguard the quality of each article we publish.