 Chunbo Zhang
 Tao Xu2,3†
 Yaolong Zhao
94% of researchers rate our articles as excellent or good
Learn more about the work of our research integrity team to safeguard the quality of each article we publish.
Find out more
ORIGINAL RESEARCH article
Front. Earth Sci., 13 January 2023
Sec. Hydrosphere
Volume 10 - 2022 | https://doi.org/10.3389/feart.2022.1113997
This article is part of the Research TopicUrban Flooding under a Changing EnvironmentView all 5 articles
Extreme weather has been more frequent in recent years. Urban agglomerations, as areas with a high density of human activities, have been plagued by storm flooding. Historically, the main focus of attention on flood control in urban agglomerations has gradually shifted from underground pipe networks to the impervious surface, reflecting profound changes in the influencing mechanism of urban flooding. Exploring the evolution of the mechanisms influencing urban flooding in the Guangdong Hong Kong Macao Greater Bay Area (GBA) urban agglomeration is of great reference significance for formulating flood prevention and control measures and promoting high-quality development of the GBA city cluster. In this paper, we fully use the collected information on urban flooding events from 1980 to 2018 in the GBA city cluster. Correlation analysis and geographically weighted regression (GWR) are used to analyze the influence of impervious surface percentage (ISP), impervious surface aggregation index (AI), impervious surface mean shape index (Shape_MN), vegetation cover (FVC), water surface ratio (WSR), relative elevation (RE) and slope on flooding in urban clusters and their evolution characteristics over time from a global perspective and spatial heterogeneity, respectively. The results show that: 1) ISP, AI, Shape_MN, and WSR are positively correlated with urban flooding, while FVC, RE, and Slope are negatively correlated with urban flooding. The correlations of each factor showed a general trend of gradual strengthening over time, and the increase rate slowed down after 2000, while the correlation of WSR showed a relatively noticeable decrease. 2) The GWR results show that each factor’s influence on urban flooding has pronounced spatial-temporal heterogeneity, and each factor shows different distribution characteristics. This study uses long time series of urban flooding point data to explore the spatial-temporal evolution of the influencing mechanism of urban flooding in the GBA urban agglomeration. We hope to provide a scientific basis for an in-depth understanding of the causes of urban flooding in the GBA, intending to provide auxiliary decision-making support for the formulation of waterlogging prevention and control measures.
Since the reform and opening up, thanks to the excellent location conditions, China’s coastal region has been through rapid development, and the urbanization process has been accelerated (Chen, 2014; Xu P. F. et al., 2021). Meanwhile, with the increasingly close communication between regional cities, several urban agglomerations have emerged in the coastal region, such as the Beijing-Tianjin-Hebei urban agglomeration, the Yangtze River Delta urban agglomeration, and the Pearl River Delta urban agglomeration. As the central region of China’s new urbanization, urban clusters dominate the lifeline of national economic development, and the high-quality, sustainable development of urban clusters profoundly affects the country’s international competitiveness (Fang, 2015; Tan et al., 2022; Yang et al., 2022; Feng et al., 2023). The particular geographic location of coastal areas brings good opportunities for regional development on the one hand but also makes them more vulnerable to water disasters, especially heavy rainfall flooding, than inland urban agglomerations on the other hand (Aerts et al., 2014; Quan, 2014; Duan, 2016; Jeong et al., 2021). Urban flooding occurs when a short period of heavy rainfall or continuous rainfall exceeds the city’s drainage capacity, resulting in extensive flood disasters (Hammond et al., 2015; Wang and Xie, 2018). Under the current situation of frequent extreme weather, urban flooding caused by high intensity and frequent extreme rainfall has posed a serious challenge to the development of coastal city clusters. For example, the “7.21” extreme rainstorm event in the Beijing-Tianjin-Hebei urban agglomeration, the “5.7” extreme rainstorm event in the GBA urban agglomeration, and the “8.25” extreme rainstorm event in Yangtze River Delta urban agglomeration have all caused serious flooding disasters, resulting in heavy casualties and huge property losses. With the advancement of urbanization in China, flooding in urban agglomerations still tends to intensify (Li C. et al., 2022; Wang Y. et al., 2022), which seriously restricts the high-quality and sustainable development of urban agglomerations (Chan et al., 2021b; Lu et al., 2022). How to effectively mitigate the impact of urban flooding has become a major problem that needs to be solved in the development of urban agglomerations in China (Liu et al., 2021; Luo and Zhang, 2022).
As an infrastructure to resist urban flooding, flood prevention and control measures have always been an important part of urban construction (Wang, 2019). Historically, the evolution of the factors influencing urban flooding has also given rise to different oriented flood control measures. There are two main causes of urban flooding, namely natural and human factors (Wang D. et al., 2015; Miller and Hutchins, 2017; Berndtsson et al., 2019; O'Donnell and Thorne, 2020). Natural factors are mainly persistent or short-duration high-intensity precipitation (ten Veldhuis et al., 2018; Wang X. et al., 2022) and topographic factors (Helderop and Grubesic, 2019), and the former has a higher impact on flooding than the latter (Huang et al., 2021). In the context of global climate change, extreme rainstorms are on the rise in many Chinese cities (He and Zhai, 2018; Li J. et al., 2022; Qian et al., 2022) and are mainly attributed to the increase in short-duration rainstorms (Huang et al., 2021). In recent years, the relationship between precipitation and urbanization has received continuous attention from scholars. Many studies have shown that urbanization not only changes the hydrological characteristics of cities but also exacerbates the extent of extreme precipitation in urban areas, including an increase in frequency and advancement of flood peaks (Wang W. et al., 2015; Liang and Ding, 2017; Lin et al., 2020; Yan et al., 2020; Zhang L. et al., 2020). Thus, although precipitation is the direct cause of urban flooding, the root cause of the increasing severity of urban flooding is that the construction of flood control measures in urban areas lags behind the development rate of urbanization.
In the early stage of urbanization, urban flooding was usually caused by natural factors such as short-term heavy rainfall, which led to previous flood prevention and control measures mainly through the construction of drainage networks to speed up the infiltration of rainwater, and the scale of the network was gradually expanded with urban development (Xiao, 2019). Since the 1980s, the urbanization process has been accelerated with the deepening of reform and opening up (Meng et al., 2020; Liang et al., 2021). The rapid spread of urban built-up areas has caused a significant reduction of rainwater infiltration area (Yu et al., 2021), coupled with the fact that the construction of urban flood control and drainage projects often lags behind the urbanization process (Fang et al., 2021), resulting in the aging of drainage networks and mixed flow of rainwater and sewage (Zhang Q. et al., 2020; Kong et al., 2021). The early planning of the carrying capacity of the pipe network is no longer applicable in a relatively short period (Chan et al., 2021a). At this time, the leading cause of urban flooding is gradually being replaced by human factors (Yu et al., 2018). Since it is not practical to carry out large-scale pipe network renovation in highly urbanized areas (Pietrucha-Urbanik, 2015; Zhou et al., 2018), urban flooding prevention and control measures gradually shifted from underground to above-ground. Such actions as low-impact development (LID) (Chen and Chen, 2018), sponge city construction (Wang et al., 2017), water-sensitive urban design (WSUD) (Salinas Rodriguez et al., 2014), sustainable drainage system (SuDS) (Scholz, 2015), and urban renewal (Liang et al., 2017; Hudson et al., 2022; Zhou et al., 2022) were proposed one after another. Therefore, clarifying the influencing factors of urban flooding and its evolution can provide a scientific theoretical basis for formulating urban flood prevention and control measures (Wang Y. et al., 2022).
Guangdong Hong Kong Macao Greater Bay Area Urban Agglomeration consists of Hong Kong, Macao, and nine cities in the Pearl River Delta. As one of China’s most open and economically vibrant regions (Yang et al., 2022), the GBA urban agglomeration has an important strategic position in the country’s overall development. However, carrying the grand vision of building a “world-class bay area”, the GBA urban agglomeration has a considerable gap in flood prevention and control capacity compared with the world’s first-class bay area. Urban flooding and the phenomenon of “seeing the sea in cities” are frequent in the GBA urban agglomeration (Chen H. et al., 2021). Although national policy documents have clearly required improving urban flood control and drainage capacity to solve the problem of urban flooding (Zhu et al., 2021), the current flood prevention and control measures are still based on passive defense, and the results are not significant despite the vast investment (Liu et al., 2019; Zhang et al., 2022). In the face of the increasingly severe flooding in the GBA, scholars have conducted many studies on hydrological information extraction (Duan et al, 2021), driving factors of urban flooding (Liu et al., 2021; Zhang et al., 2021), contextual simulations (Qiang et al., 2020; Chen X. et al., 2021), and prevention and control measures (Lourenço et al., 2020; Otsuka et al., 2022; Wu et al., 2022), having made some progress. However, due to the difficulty of obtaining long-time series flooding data (Zhang Q. et al., 2020; Zhang et al., 2021), the analysis of the spatial-temporal evolution of the flooding impact mechanism is still lacking. In the development and formation of the GBA urban agglomeration, how the spatial pattern of urban flooding changes and how the influencing factors of urban flooding evolve are still important questions that need to be explored. Therefore, this paper takes the GBA urban agglomeration, which is frequently attacked by rainstorms, as the study area, collects the accumulated 3,592 flood event points that occurred in the study area from 1980 to 2018, and uses them as the research object to explore the spatial-temporal evolution of the urban flooding influence mechanism. We hope to provide auxiliary decision-making support for flood prevention and control at the urban agglomeration scale and urban cluster renewal planning.
This paper takes the GBA urban agglomeration as the study area (Figure 1). The GBA urban agglomeration is located in the core space of South China composed of Guangzhou, Shenzhen, Dongguan, Foshan, Zhuhai, Zhongshan, Jiangmen, Huizhou, Zhaoqing, Hong Kong, and Macao. It is a world-class city cluster with a total area of 56,000 square kilometers. Located at 111°15′∼115°30′E and 21°30′∼24°30′N, the GBA has a tropical and subtropical marine monsoon climate with sufficient rain and heat conditions throughout the year, and the average precipitation for many years is above 1500 mm. Influenced by the Pacific monsoon, precipitation activity is mainly concentrated between April and October, with precipitation accounting for about 80% of the year and often accompanied by typhoon disasters and frequent rainstorms. With the rapid development of the GBA, the built-up area is expanding, and urbanization has brought about a series of urban problems, among which the impact of heavy rainfall and flooding is particularly severe for the people in the Bay Area. The cities here are under the threat of urban flooding all year round. Thus, it can be seen that flooding has become a primary “urban disease” that has to be solved.
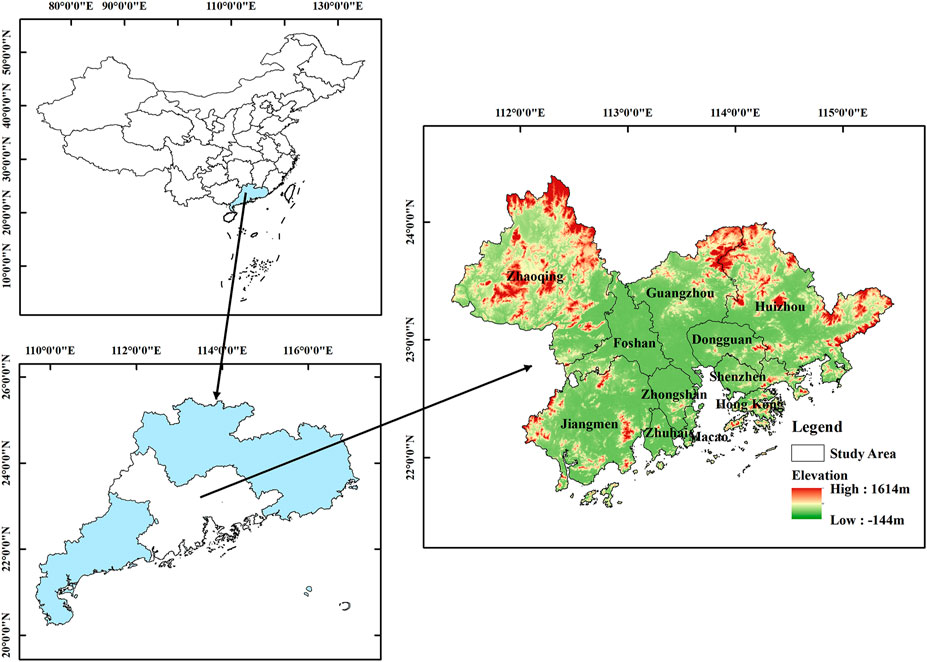
FIGURE 1. The geographical location of the study area.
Analyzing the evolution of influencing factors of flood disasters in urban agglomerations requires multi-source data. The data types, formats, time, and data sources used in this paper are shown in Table 1. We mainly use the textual information of urban flooding event points, impervious surface data with 30 m spatial resolution covering the GBA, digital elevation model (DEM) data, and administrative division data.
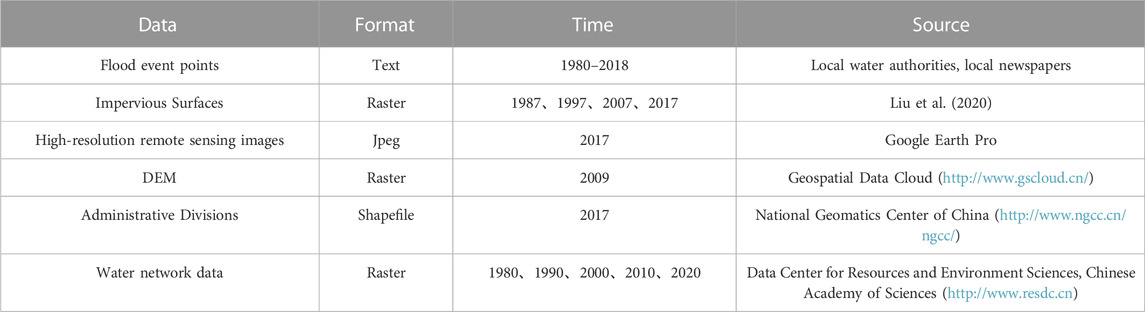
TABLE 1. List of data.
To ensure the accuracy of the data, the urban flooding event points are mainly from mainstream media reports (mostly authoritative local newspapers) and flooding event points with accurate time and location information published by local water authorities, ranging from January 1980 to December 2018. These urban flooding events usually have caused a significant impact on the life of residents, social property, and transportation. Through the collected textual information of urban flooding events, we use ArcGIS and Google Earth for visual identification, vectorize the locations of these events, and establish a spatial data set of flooding points. The vectorization method refers to the method provided by Yu et al. (2018); Zhang et al. 2018), and finally, 3,592 flooding event points were obtained.
Existing studies show that urban flooding is mainly influenced by natural factors such as precipitation, topography, and hydrology and human factors such as land use/cover (Zhang et al., 2018; Xu L. et al., 2021). Based on this, the following seven indicators are selected as the influencing factors of urban flooding for this paper, which is: the percentage of impervious surface (ISP), the aggregation of impervious surface (AI), the mean shape index of impervious surface (Shape_MN), vegetation cover (FVC), water surface ratio (WSR), relative elevation (RE), and slope (Slope).
Impervious surfaces are the ground cover that can prevent water from infiltrating into the soil, mainly composed of various artificial surfaces, such as asphalt or concrete roads, roofs, parking lots, etc. (Arnold and Gibbons, 1996). It is the main reason for the increasing severity of urban flooding (Sohn et al., 2020; Wang K. et al., 2021). In this paper, we use the impervious surface of the GBA in 1987, 1997, 2007, and 2017 extracted by Liu et al. (2020), and the extraction accuracy is above 88%, which meets the analysis demand. The landscape pattern index can highly concentrate the information on various landscape characteristics of surface elements, reflecting the spatial configuration and structural characteristics of landscape units as well as the intrinsic connection between landscape patterns and ecological processes (Li and Wu, 2004). In this study, based on the principle that landscape indices should be selected independently of each other (Riitters et al., 1995) and with reference to existing studies (Seto and Fragkias, 2005; Zhang et al., 2015), three landscape pattern indices, namely patch area share (ISP), aggregation (AI) and mean shape index (Shape_MN), were selected to measure the landscape pattern changes of impervious surfaces quantitatively. All the indices were calculated in Fragstats 4.2, and each index’s specific principles and meanings are shown in Table 2.
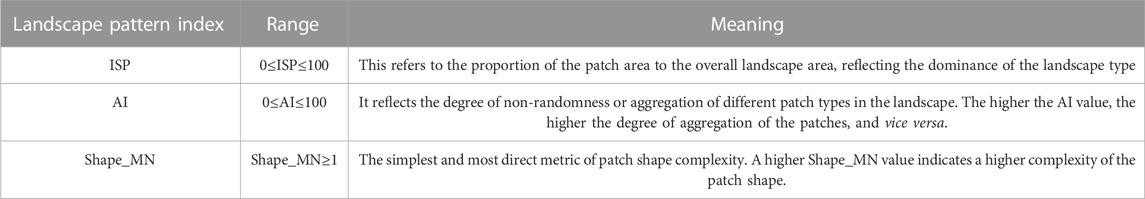
TABLE 2. Landscape pattern index.
Green space, as one of the permeable surfaces, has good infiltration of rainwater and is one of the important influencing factors of urban flooding (Alexander et al., 2019; Afriyanie et al., 2020; Pallathadka et al., 2022). However, with the advancement of urbanization in the GBA, the rapid expansion of impervious surfaces has led to a continuous decrease in the area of green areas, which in turn has reduced the storage capacity of green areas for rainwater (Li L. et al., 2021). This paper uses fractional vegetation cover (FVC) to reflect the green space coverage in the GBA. FVC is the percentage of the projected area of vegetation (including leaves, stems, and branches) in the vertical projection plane over the statistical area, with a value between 0 and 1 (Li C. et al., 2021). It can reflect the size of plants’ photosynthetic area, and, to a certain extent, the lushness of vegetation (Zhao et al., 2015). In this paper, the FVC is extracted from NDVI, which is calculated by the formula
where
Topographic factors such as elevation and slope are also important factors affecting urban flooding. In general, flood is more likely to occur in flat and low-lying areas because rainfall runoff always converges from higher to lower areas. Since topographic factors do not always change in the short term, this paper selects DEM data with an accuracy of 30 m obtained in 2007 as the data source, and selects two indicators, relative elevation (RE) and slope, to analyze the influence mechanism of topographic factors on urban flooding.
In addition, water systems, as important drainage channels, profoundly affect an area’s stormwater storage capacity and ecological carrying capacity (Wang T. et al., 2022; Kõiv-Vainik et al., 2022). However, due to urban construction and human activities, many water systems have been converted into urban built-up areas, and this conversion not only destroys the water network structure but also reduces the rainwater storage capacity of the area (Guo et al., 2021). Therefore, in this paper, water surface ratio (WSR) is calculated by obtaining water system data for different periods and analyzing its influence on urban flooding.
Pearson correlation coefficient is a statistical method that accurately measures the degree of linear correlation between two variables. The magnitude of the coefficient reflects the strength of the linear correlation between two variables, while the positive or negative correlation reflects whether the variables are positively or negatively correlated (Wang Z. et al., 2021). In this study, the Pearson Correlation in SPSS was used to determine the correlation between each influencing factor and the severity of urban flooding at a global scale in preparation for further analysis of the spatial variability of the influencing mechanism of each factor. For the variable
where
The traditional global spatial regression model assumes spatial smoothness within the whole study area. However, due to the significant spatial differences in the development of the GBA urban agglomeration as a whole and within each city, the influencing factors present a certain degree of spatial non-smoothness, i.e., the degree of influence of each factor on urban flooding changes with the change of spatial location. Therefore, the correlation analysis alone cannot fully reflect the spatial differences in the changes of the influencing factors of urban flooding within the GBA, and the geographically weighted regression model can well compensate for this shortcoming.
Geographically Weighted Regression (GWR) is a spatial extension of the traditional regression model (OLS model). It regresses location information into the parameters (Yu et al., 2018), which takes into account the spatial heterogeneity and non-smoothness between geographic data (Gao and Li, 2011), making the results obtained from regression analysis more objective and realistic, and is commonly used to explore and describe spatial variability in the effects of explanatory variables on dependent variables (Lu et al., 2016). The model is currently widely used in the fields of population geography, business geography, and health geography (Wu et al., 2018), but it has been relatively little applied in the field of stormwater flooding disasters in urban agglomerations. Therefore, this paper uses the GWR model to explore the spatial and temporal heterogeneity characteristics of the influence of each factor on urban flooding in city clusters. The model is calculated as follows.
where
The spatial weights, which are mainly divided into fixed bandwidth and adaptive weight functions, are the key to determining the GWR model’s merits. Since there are obvious sparsity differences in the spatial distribution of flooding points, if fixed bandwidth is used, there will be too many points participating in the regression in data-dense areas and not enough points participating in the regression in data-sparse areas. Therefore, the adaptive weight function is chosen in this paper to ensure that there are suitable samples to participate in the regression. The calculation formula is as follows.
where
As shown in Figure 2, the spatial-temporal distribution and the number of flooding points in the GBA urban agglomeration have experienced a significant expansion trend in both time and space. From 1980 to 1989, there were 211 flooding points in the GBA, among which a small number of flooding points existed in Guangzhou, and most of them were concentrated in Hong Kong with 111 points. From 1990 to 1999, the number of flooding points gradually increased to 425 points, mainly concentrated in Hong Kong, Shenzhen, and Guangzhou. During this period, except for Zhuhai with no flooding points, the number of flooding points in all regions shows an increasing trend. From 2000 to 2009, the number of flooding points in the GBA increased sharply to 1,256, which was nearly three times larger than the previous period. The flooding points are mainly distributed in Shenzhen, Foshan, Guangzhou, Dongguan, and Zhuhai, among which the number of flooding points in Shenzhen was the largest, reaching 265. During this period, the number of flooding points in all major cities in the GBA, except Hong Kong, was on a surge. From 2010 to 2018, the number of flooding points in the GBA further increased to 1700, expanding more than eight times compared with the 1980s, and they were distributed in all cities.
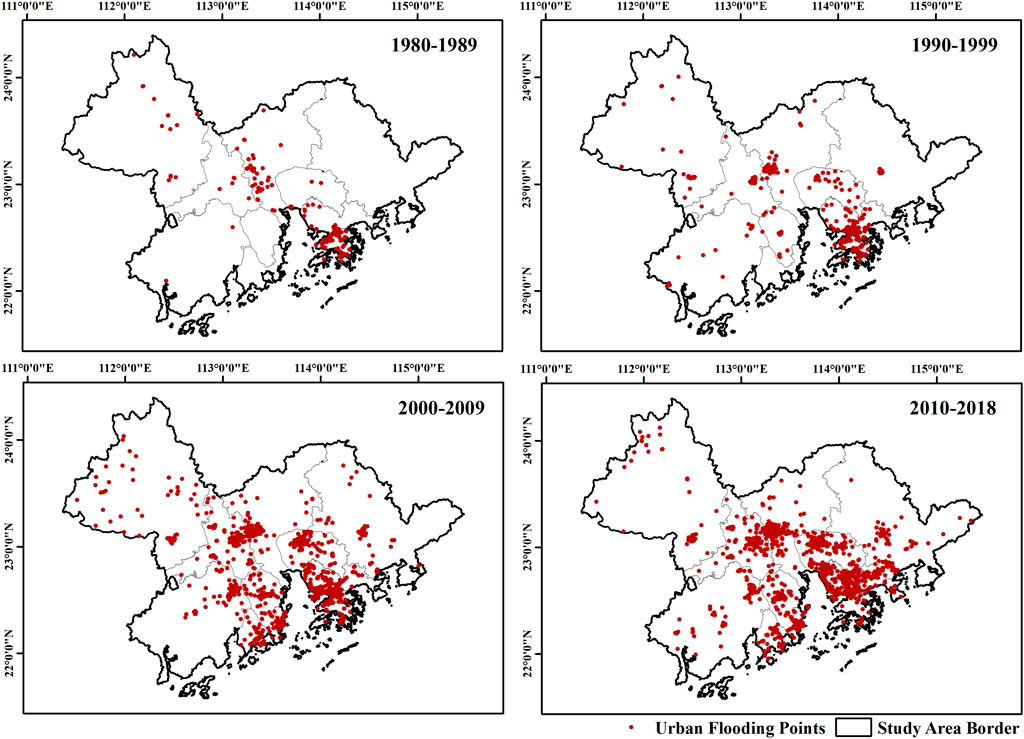
FIGURE 2. Spatial-temporal distribution of urban flooding points in the GBA.
The average observation distance of the flooding points in the study area for all four periods was calculated as 1892m by mean nearest neighbor analysis, and the minimum analysis scale should be larger than the average observation distance. Therefore, a 2 km grid is chosen as the analysis scale to better reflect the detailed differences in spatial-temporal heterogeneity. The kernel density value of flooding points in the grid is used as the severity of flooding in the grid cell, and the correlation between each influence factor and the flood severity is obtained using SPSS software (Table 3). The results show that ISP, AI, Shape_MN, and WSR are positively correlated with the severity of flooding, while FVC, RE, and Slope are negatively correlated with the severity of flooding.
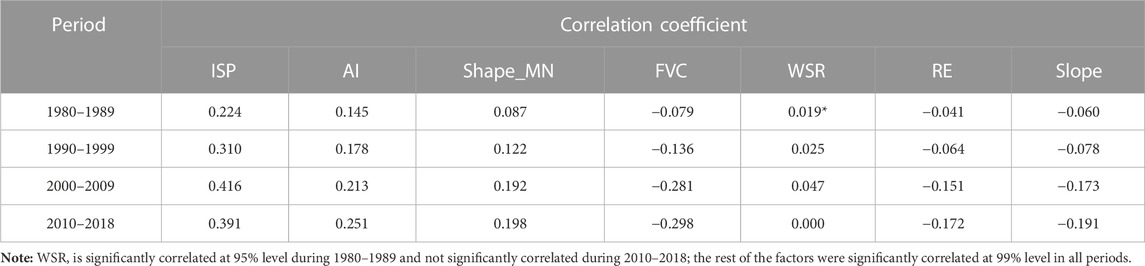
TABLE 3. Results of correlation analysis of the influencing factors of flooding in the GBA.
Observing the temporal changes of the correlation coefficients of each factor (Figure 3), the overall correlation trend showed a gradual increase. Among the positively correlated factors, ISP, AI, Shape_MN, and WSR are ranked from highest to lowest correlation coefficients. ISP always dominates, but its correlation coefficient slightly decreases during 2010–2018, while AI and Shape_MN both keep increasing, indicating that urban flooding is gradually influenced more by the “shape” than by the “quantity” of impervious surface. “The correlation between WSR and urban flooding tends to increase yearly in the first and middle periods but decreases to 0 later. Urban drainage networks mostly have outlets near river waters. However, early urban pipe network construction is inadequate, and the Bay Area rivers are often affected by the upwelling of the sea tide. These lead to a rise in the river’s water level, resulting in an overflow of rainwater at the outlet of the pipe network forming internal flooding, causing a positive correlation between WSR and urban flooding severity. With the continuous optimization of the pipe network construction, this positive correlation is gradually reduced.
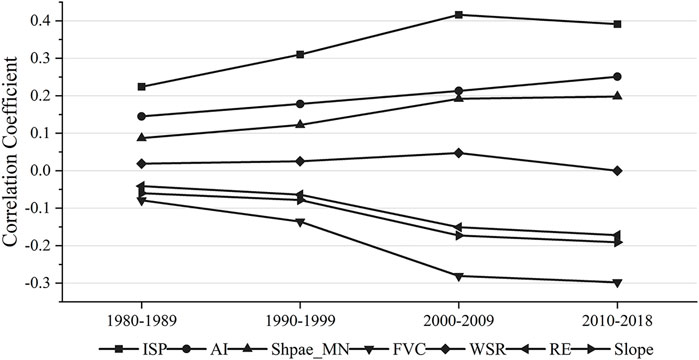
FIGURE 3. Correlation coefficient change of each influence factor of urban flooding in the GBA.
Among the negative correlations, FVC, Slope, and RE are ranked from the highest to the lowest absolute value of the correlation coefficients. All three factors show a trend of increasing correlation year by year, and FVC is significantly larger than Slope and RE in terms of correlation, which indicates that the correlation between green space and flooding severity is stronger than the topographic factor. It can be seen that improving vegetation cover and increasing rainwater infiltration is an effective way to reduce the risk of stormwater flooding.
In this study, the analysis unit is a grid cell with a resolution of 2 km. The fitting results of each factor were obtained by following the AICC minimum principle under the premise that the standard residuals of the model conform to the random spatial distribution (Table 4). The modeling effect is unsatisfactory due to the small number of storm inundation event points between 1980 and 1989, and the adjusted R2 is significantly lower than the other three periods. Overall, RE, ISP, and Slope were better fitted for urban flooding, and the adjusted R2 for the three regression models after 1990 were above 0.95, 0.9, and 0.8, indicating the explanatory power of spatial differences in urban flooding is strong. AI, Shape_MN, FVC, and WSR have relatively weak explanatory power for the spatial differences in urban flooding, but most of the regression model-adjusted R2 are also above 0.4.

TABLE 4. GWR results of the influencing factors of urban flooding in the GBA.
The regression coefficient in the output of the geographically weighted regression model indicates the degree of influence of the factor on the dependent variable, and the larger the absolute value of the regression coefficient, the stronger the degree of impact. Since the density of urban flooding in some areas in the GBA is 0, the corresponding model regression coefficient is also 0. Therefore, no data are shown for the areas where the model regression coefficient is 0, and only the areas where the regression coefficient is not 0 are analyzed.
Impervious surfaces increase surface runoff by reducing stormwater infiltration, contributing to urban flooding. As shown in Figure 4, the impact of ISP on urban flooding shows the characteristics of “polycentric diffusion - polycentric agglomeration”. During 1980–1989, the high-value areas of the regression coefficient mainly appear in the south of Zhaoqing City and the border between Shenzhen and Hong Kong. With time passing, the high value of the regression coefficient also appears to rise significantly, and there is a more obvious phenomenon of the high-value area enlarging, showing a spatial trend of polycentric diffusion. By the period of 2010–2018, the areas with high correlation coefficient values appear to retract, mainly concentrated in the border between Foshan city and Guangzhou city, the downtown area of Dongguan city, and the southern area of Shenzhen City. These areas are the old urban areas of the cities in the GBA, and the impervious surface in the region keeps increasing in density with urban development, while the drainage facilities are often difficult to update and expand, resulting in frequent urban flooding. The high expansion rate of impervious surfaces has been the primary cause of the increasing flooding severity in the GBA.
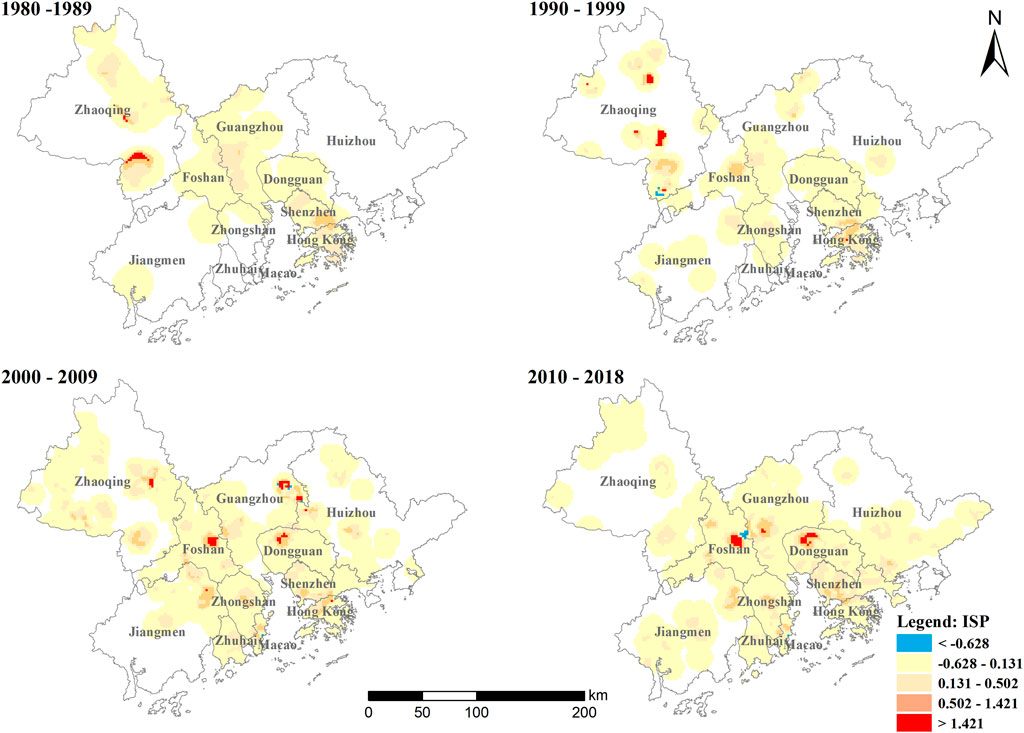
FIGURE 4. Spatial distribution of regression coefficients for ISP during 1980–2018.
AI and Shape_MN reflect the morphology of impervious surfaces, and scholars have paid attention to their effects on urban flooding. From Figure 5 and Figure 6, it can be seen that the two factors have similar influence characteristics on the spatial distribution of urban flooding. The spatial pattern is more prominent, showing the characteristics of “single-center diffusion - double-center concentration”. Both AI and Shape_MN are centered on the Guangzhou-Foshan Co-city area and gradually spread to the surrounding area. After 2000, a second agglomeration center was formed in the main urban area of Dongguan city, and since then, these two centers have continued to spread in all directions. During the development of the GBA, the city’s impervious surface has been increasing in density, and the landscape shape has become more complex (Ma et al., 2021). In the more developed core cities within the GBA, impervious surfaces not only contribute quantitatively to urban flooding, but their shape also has an important impact.
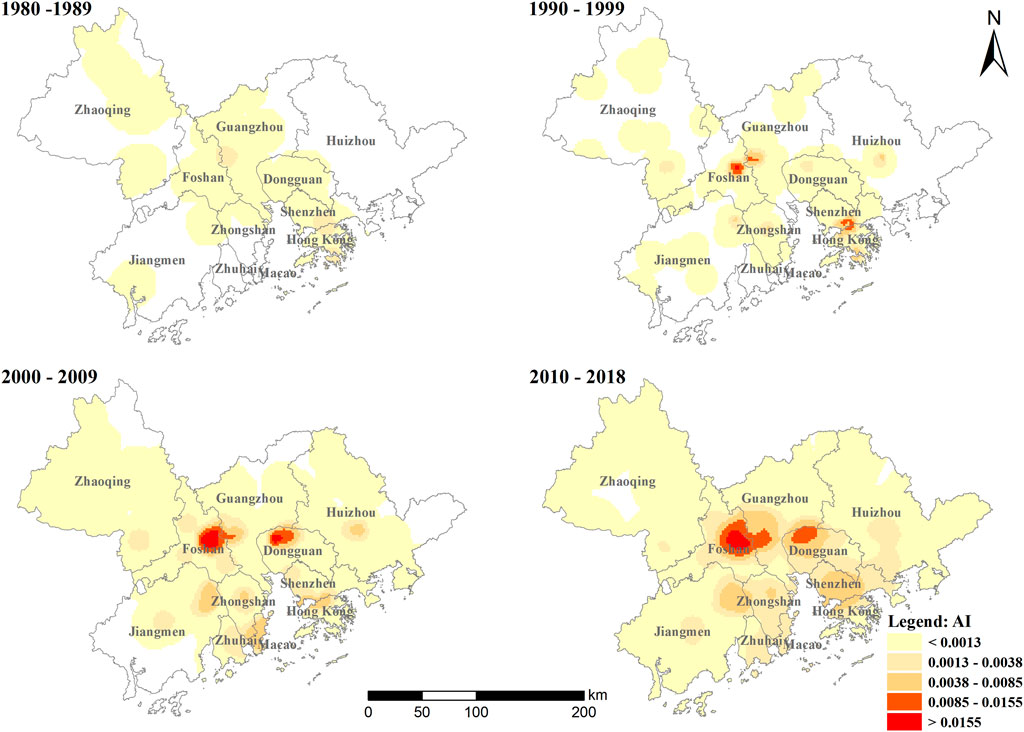
FIGURE 5. Spatial distribution of regression coefficients for AI during 1980–2018.
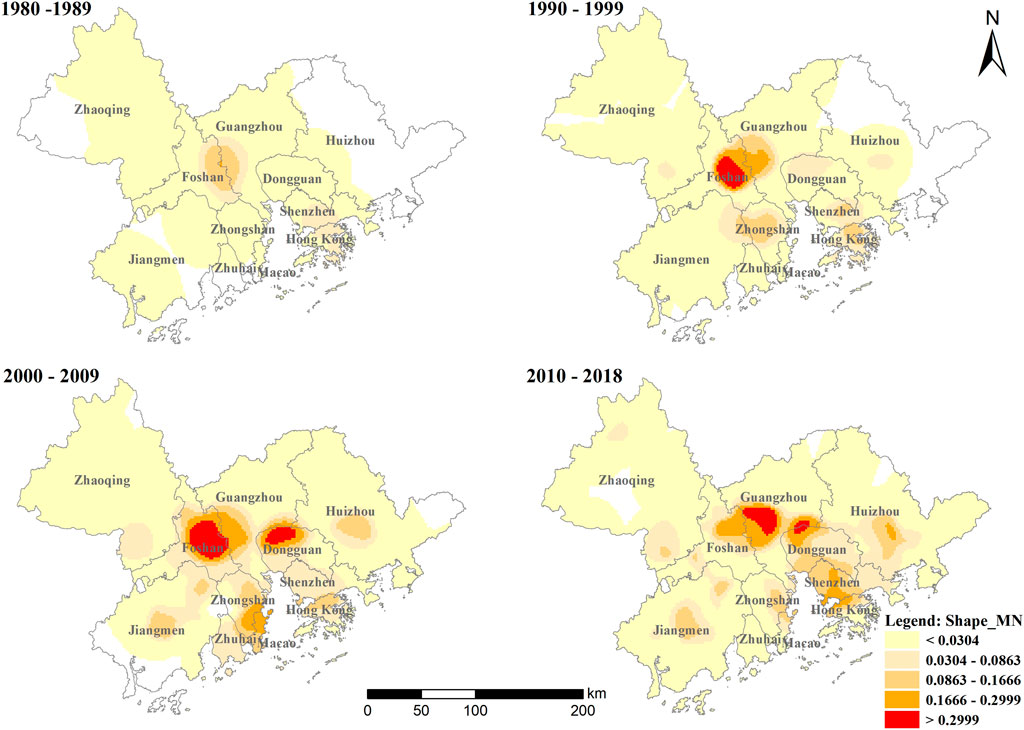
FIGURE 6. Spatial distribution of regression coefficients for Shape_MN during 1980–2018.
As can be seen from Figure 7, the areas with FVC regression coefficients less than 0 have been increasing over time, showing the characteristics of “no center - monocentric diffusion - polycentric diffusion”. During 1980–1989, there was no significant spatial clustering of negative FVC regression coefficients. During 1990–1999, the low-value area of negative FVC regression coefficients was mainly centered on Guangzhou-Foshan Co-city and spread to the surrounding area. During 2000–2009, the low-value area of the negative FVC regression coefficient further expanded and evolved from monocentric to bicentric, spreading in all directions centered on the Guangzhou-Foshan Co-city area and Dongguan City, respectively. After 2010, the low-value area of the negative FVC regression coefficient continued to expand, and the aggregation centers increased to three, spreading in all directions, centering on Guangzhou-Foshan Co-city, the core area of Dongguan City and the southern part of Shenzhen City, respectively. At the same time, the connectivity among the negative low coefficient value areas increased. In the progress of urban development, the area of vegetation is continuously encroached by impervious surfaces, which reduces the infiltration of rainwater and strengthens the risk of urban flooding. At the same time, there is also a significant clustering of positive FVC regression coefficients in the northwestern part of Zhongshan City after 2010, which means the influence of vegetation cover on the flooding severity in this area is not dominant among the factors. These areas may be dominated by other factors influencing the occurrence of urban flooding.
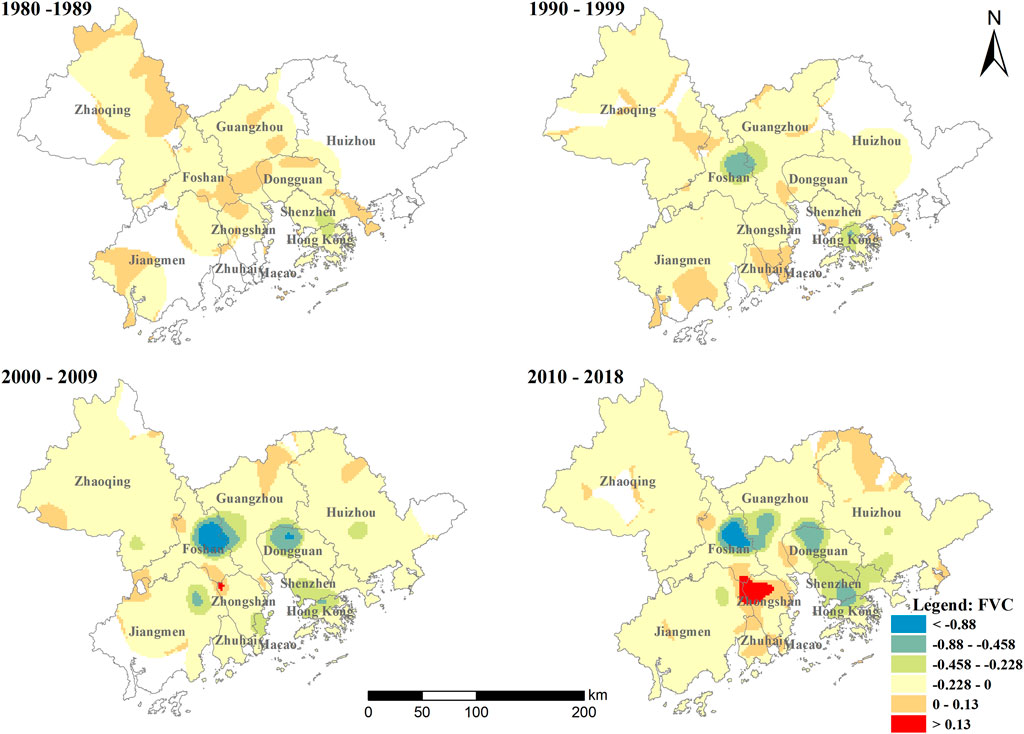
FIGURE 7. Spatial distribution of regression coefficients for FVC during 1980–2018.
The spatial spread pattern of the regression coefficient of WSR is somewhat similar to that of FVC (Figure 8). The WSR regression coefficients during the period of 1980–1989 and 1990–1999 have no significant spatial aggregation, but the coverage area is expanding. The low-value regions with negative WSR regression coefficients during 2000–2009 began to gather spatially, spreading in all directions with the eastern part of Foshan City and the core urban area of Dongguan City as the center, respectively. Between 2010 and 2018, the aggregation centers of low-value areas with negative WSR regression coefficients further increased, spreading in all directions with the eastern part of Foshan City, the western part of Guangzhou City, and the core urban area of Dongguan City, and forming another sub-center in the Shenzhen City. Water bodies are important carriers of underground pipe network drainage. The aggregation of low-value areas with negative WSR regression coefficients in the GBA core areas indicates, to a certain extent, the gradual improvement of drainage pipeline construction in these areas.
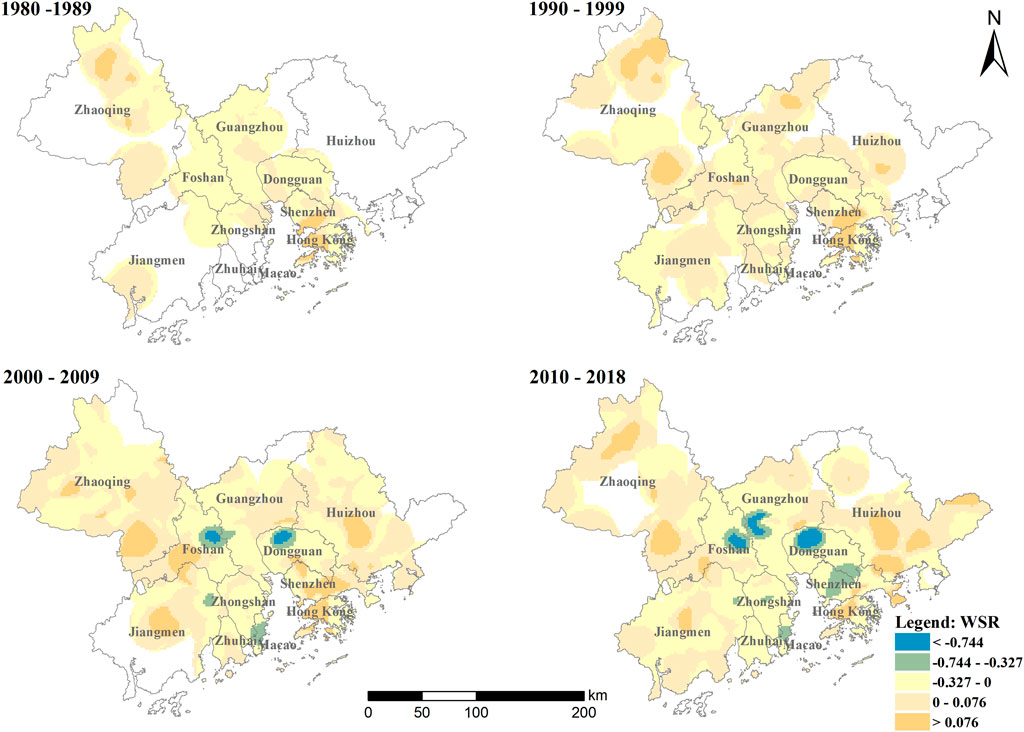
FIGURE 8. Spatial distribution of regression coefficients for WSR during 1980–2018.
As can be seen in Figure 9 and Figure 10, the regression coefficients of RE and Slope are significantly reduced compared to other factors, indicating that topographic factors have less influence on urban flooding. Flooding in the GBA mainly occurs in urban areas, while cities in the region are mainly located in the estuarine plains with less topographic relief, so the impact on flooding is relatively low. The 2 km grid scale used in this paper can still analyze some local macroscopic characteristics from a large-scale perspective. In terms of RE, the low-value region of the negative regression coefficient is in a significantly increasing trend. The grids with regression coefficients less than −0.0007 increased from 0 to 460, indicating that the relevance of topographic factors for urban flooding is strengthening. These low-value areas are mainly concentrated in the Guangzhou-Foshan Co-city, the central part of Shenzhen, and some territories of Dongguan City, and some low-values are also scattered in other areas, with poor inter-regional connectivity. It is worth noting that since 1990, a large number of positive high-value regions appear in the core urban areas of Foshan City and Dongguan City, and negative low-value areas surround these high-value areas This indicates that other factors dominate the occurrence of flooding in these areas, and the presence of such confounding factors leads to different degrees of variation in the results. In fact, this is also the area where impervious surfaces play a significant role. Therefore, it can be inferred that impervious surfaces can not only enhance the flooding severity by itself but also this enhancement is further enhanced by the low roughness of the hardened surface coupled with topographic factors.
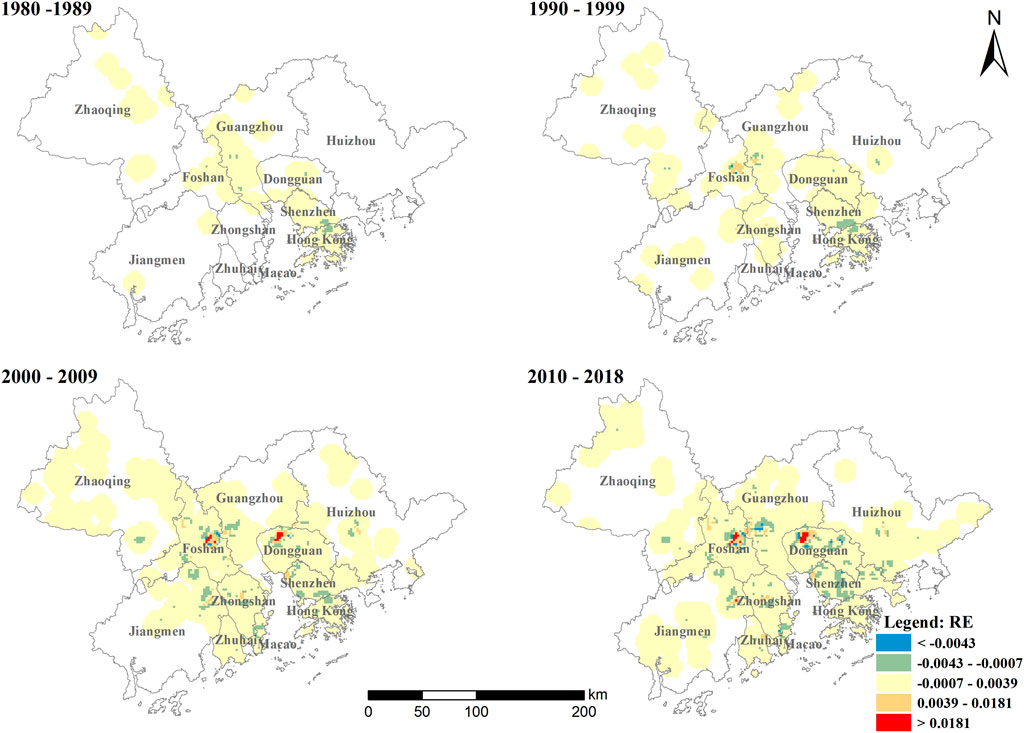
FIGURE 9. Spatial distribution of regression coefficients for RE during 1980–2018.
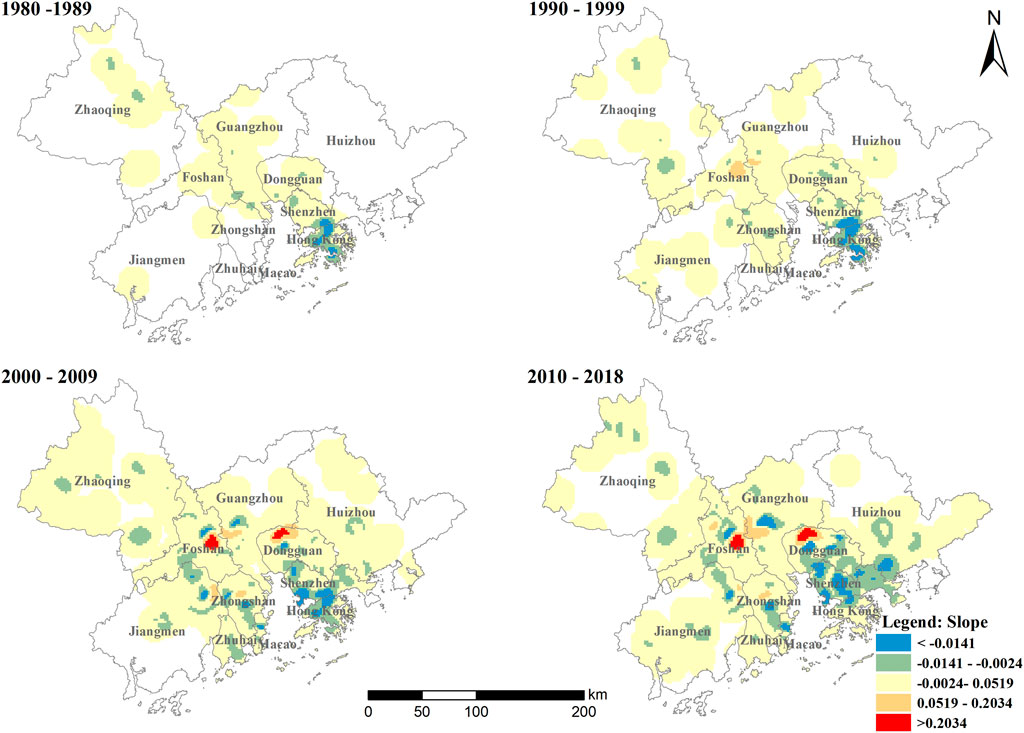
FIGURE 10. Spatial distribution of regression coefficients for Slope during 1980–2018.
By collecting point data on flood events in the GBA urban agglomeration during 1980–2018, this study uses correlation analysis and the GWR model to analyze the changes in the impact mechanism of flooding in the GBA over the past 40 years, to provide additional decision support for urban flooding prevention and urban cluster renewal planning at the urban cluster scale. Through the study, this paper presents the following considerations.
1) The regression coefficients measure the correlation between the independent and dependent variables in numerical terms, and cannot determine whether there is necessarily a causal relationship between the two. Although the GWR model can explore, from the perspective of spatial heterogeneity, the spatial-temporal variation of the impact of various factors on urban flooding in the GBA over the past 40 years, it is not sufficient to explain the causal relationship between the influence factor and flooding severity. For example, even if the regression coefficient between ISP and the flooding severity is high, it is still not possible to determine that urban flooding is solely caused by the expansion of impervious surfaces. The specific causes of a particular urban flooding event still need to be modeled and studied from a microscopic, systematic, and dynamic perspective. The significance of exploring the spatial variability of influencing factors of flooding from a large regional scale is to draw general patterns from microscopic data on flooding and influencing factors and to try to explain the regional anomalies that occur.
2) From a global perspective, impervious surface factors are always in the dominant position of all influence factors of flooding in the GBA. Among them, the correlation coefficient of ISP showed a relatively significant decrease at the end of the study period, and the results of the GWR model indicated that this decrease might be mainly due to the decline of ISP correlation coefficients in Zhaoqing City and the east of Guangzhou City. In addition, the correlation coefficients of AI and Shape_MN, which reflect the “shape” characteristic of impervious surfaces, are steadily increasing compared to ISP, which reflects the “quantity” characteristic. This shows that in the late development stage of the GBA urban agglomeration, the impact of impervious surface on flooding has changed from quantity to shape, which has important guiding significance for the GBA urban renewal.
At the beginning of the reform and opening up, under the influence of Hong Kong and policy support, the industrialization of the Peral River Delta (PRD) region developed significantly, promoting the expansion and contiguity of towns on the east and west sides of the PRD, and urbanization showed a spatial integration across administrative boundaries. At the same time, under the influence of both market economy and administrative control, the urban space in the PRD has shown a phenomenon of “park-city separation” in which production space and living space are separated. Although this phenomenon has provided ample space and great flexibility for the development of export-oriented industries, it has also led to several urban problems, such as “tidal traffic” and “road economy” (Ma et al., 2019). Dismantling existing infrastructure for re-planning can lead to a massive waste of resources and economic loss, so the “urban disease” caused by the rough urbanization development is often difficult to reverse. As one of the four major global Bay Area economies, the GBA urban agglomeration is powerfully promoted by the Chinese government. To achieve its high-quality development must rely on coordinated macroscopic planning and exploring to build an integrative urban and rural construction land market. Optimizing the impervious surface spatial pattern within the GBA urban agglomeration through urban renewal planning will play a positive role in preventing and controlling urban flooding.
3) The results of the global-scale correlation analysis show that the water surface ratio (WSR) is positively correlated with the severity of urban flooding in the early stages, which is inconsistent with the conventional perception. Generally speaking, the more water bodies there are, the easier surface runoff will drain into the water bodies, thus reducing the risk of urban flooding, i.e., WSR is negatively correlated with the flooding severity. The low urbanization level of the GBA in the early stage of the study period and its geographical location by the river and the coast, which is rather vulnerable during extreme weather, led to early flooding caused mainly by heavy rainfall-induced river overflows or seawall breaches. Therefore, there was always much water around the flooding event points in the early stage, causing the higher the WSR, the higher the urban flooding severity in some areas. With the increasing level of urbanization, the flooding gradually migrates to the inner city. The drainage network laid inside the city can effectively discharge the surface runoff into the water bodies, and the drainage capacity is relatively better in places with more river water bodies. Therefore, there are obvious negative correlation areas in Shenzhen, Dongguan, Guangzhou-Foshan Co-city, Zhongshan, and Zhuhai, which pulls down the overall correlation coefficient of WSR. The emergence of this phenomenon further demonstrates the necessity of using the GWR model to explore the spatial heterogeneity of the mechanisms of the influencing factors at large regional scales.
4) Current research also has the following shortcomings. First, the urban flooding data used in the study are mainly obtained from authoritative newspapers in various cities in the GBA. These flooding events were usually reported because they had a greater impact on the safety of people’s lives and production, which may make some flooding points to be neglected, resulting in the collected flooding not being comprehensive and complete. Secondly, in the selection of impact factors, this paper does not consider the underground drainage network, which is mainly due to the difficulty of obtaining underground pipeline data at long time series and large scale. Finally, this paper does not consider the joint effect of multiple influencing factors on urban flooding, which need be further explored in future studies.
Urban flooding, especially in city clusters, has become one of the major urban diseases that threaten the safety of residents and property, hinder public transportation, and limit the healthy and sustainable development of cities. Accurate, abundant, and longer time-scale flooding event points are of great significance for the study of flooding causes and flooding risk prediction. In this paper, we take the GBA as the study area, establish a spatial data set by collecting flooding event points in the Bay Area for the past 40 years from 1980 to 2018, combine Pearson correlation and GWR model to explore the spatial-temporal evolution of the impact mechanism of urban flooding at global and local scales and provide a scientific basis for the prevention and management of flooding in urban clusters. The main findings of the study are as follows.
1) By conducting a time-series analysis of urban flooding points in the long-timescale of the GBA, we can dig into the differences in the impact mechanisms of regional flooding events in time stages, to grasp the impact characteristics of urban cluster development patterns on urban flooding, and provide a new idea for urban cluster renewal planning oriented to urban flooding risk management.
2) The results of Pearson correlation analysis showed that among the main influence factors of flooding in urban clusters, ISP, AI, Shape_MN, and WSR are positively correlated with urban flooding, while FVC, Slope, and RE are negatively correlated with urban flooding. The correlations of the factors in the time dimension showed a general trend of gradual strengthening, slowing down after 2000, and the correlation of the WSR showed a relatively noticeable decline.
3) GWR model results show that there is significant spatial-temporal heterogeneity in the factors influencing urban flooding in the GBA. The influence of ISP on the spatial distribution of urban flooding is characterized by “polycentric diffusion—polycentric agglomeration”; the influence of AI and Shape_MN on the spatial distribution of urban flooding is characterized by “monocentric diffusion - bicentric agglomeration”. The area with negative values of FVC and WSR is spatially characterized by “no center - multicenter”. RE and Slope have less influence on the spatial distribution of urban flooding, and the distribution is more fragmented in space, and there is no significant spatial aggregation compared with other factors.
The original contributions presented in the study are included in the article/supplementary material, further inquiries can be directed to the corresponding authors.
CZ designed the article structure and wrote the manuscript. TX collected the waterlogging data. TW revised the manuscript. YZ initiated the idea of this research article and revised the manuscript.
This research was supported by the National Natural Science Foundation of China (No. 41871292), the Marine Economy Development Foundation of Guangdong Province (No. GDNRC [2020]051), and The Guangdong Provincial Science and Technology plan project (No. 2021B1212100003).
The authors declare that the research was conducted in the absence of any commercial or financial relationships that could be construed as a potential conflict of interest.
All claims expressed in this article are solely those of the authors and do not necessarily represent those of their affiliated organizations, or those of the publisher, the editors and the reviewers. Any product that may be evaluated in this article, or claim that may be made by its manufacturer, is not guaranteed or endorsed by the publisher.
Aerts, J., Botzen, W. J. W., Emanuel, K., Lin, N., de Moel, H., and Michel-Kerjan, E. O. (2014). Evaluating flood resilience strategies for coastal megacities. Science 344 (6183), 473–475. doi:10.1126/science.1248222
Afriyanie, D., Julian, M. M., Riqqi, A., Akbar, R., Suroso, D. S. A., and Kustiwan, I. (2020). Re-framing urban green spaces planning for flood protection through socio-ecological resilience in Bandung City, Indonesia. Cities 101, 102710. doi:10.1016/j.cities.2020.102710
Alexander, K., Hettiarachchi, S., Ou, Y., and Sharma, A. (2019). Can integrated green spaces and storage facilities absorb the increased risk of flooding due to climate change in developed urban environments? J. Hydrol. 579, 124201. doi:10.1016/j.jhydrol.2019.124201
Arnold, C. L., and Gibbons, C. J. (1996). Impervious surface coverage: The emergence of a key environmental indicator. J. Am. Plan. Assoc. 62 (2), 243–258. doi:10.1080/01944369608975688
Berndtsson, R., Becker, P., Persson, A., Aspegren, H., Haghighatafshar, S., Jönsson, K., et al. (2019). Drivers of changing urban flood risk: A framework for action. J. Environ. Manag. 240, 47–56. doi:10.1016/j.jenvman.2019.03.094
Chan, F. K. S., Chen, W. Y., Sang, Y., Chen, Y. D., Huang, W. W., Chen, W.-Q., et al. (2021a). Build in prevention and preparedness to improve climate resilience in coastal cities: Lessons from China’s GBA. One Earth 4 (10), 1356–1360. doi:10.1016/j.oneear.2021.09.016
Chan, F. K. S., Yang, L. E., Scheffran, J., Mitchell, G., Adekola, O., Griffiths, J., et al. (2021b). Urban flood risks and emerging challenges in a Chinese delta: The case of the Pearl River Delta. Environ. Sci. Policy 122, 101–115. doi:10.1016/j.envsci.2021.04.009
Chen, S., and Chen, X. (2018). Simulation of urban rainfall runoff pollution and control effect by low impact development. Water Resour. Prot. 34 (05), 13–19. doi:10.3880/j.issn.1004-6933.2018.05.03
Chen, H., Jiang, Y., and Zhang, L. (2021). Research on resilient waterlogging prevention system in Guangdong-Hong Kong-Macao greater bay area. China Flood Drought Manag. 31 (04), 25–30.
Chen, X., Zhang, H., Chen, W., and Huang, G. (2021). Urbanization and climate change impacts on future flood risk in the Pearl River Delta under shared socioeconomic pathways. Sci. Total Environ. 762, 143144. doi:10.1016/j.scitotenv.2020.143144
Chen, L. (2014). Monitoring and analysis of urban expansion in eastern coastal area of China based on DMSP/OLS night lights image. Master's thesis. Changchun: Northeast Normal University.
Duan, W., He, B., Nover, D., Fan, J., Yang, G., Chen, W., et al. (2016). Floods and associated socioeconomic damages in China over the last century. Natural Hazards 82 (1), 401–413.
Duan, W., Maskey, S., Chaffe, P. L., Luo, P., He, B., Wu, Y., et al. (2021). Recent advancement in remote sensing technology for hydrology analysis and water resources management. Remote sensing 13 (6), 1097.
Fang, Y., Yu, C., Jin, X., Li, J., Xia, L., and Ren, M. (2021). Research on water⁃logging control effect of mountain sponge city based on SWMM⁃CCHE2D unidirectional coupling model. Eng. J. Wuhan Univ. 54 (10), 898–906+941.
Fang, C. (2015). Important progress and future direction of studies on China’s urban agglomerations. J. Geogr. Sci. 25 (8), 1003–1024. doi:10.1007/s11442-015-1216-5
Feng, Y., Lee, C.-C., and Peng, D. (2023). Does regional integration improve economic resilience? Evidence from urban agglomerations in China. Sustain. Cities Soc. 88, 104273. doi:10.1016/j.scs.2022.104273
Fotheringham, A., Brunsdon, C., and Charlton, M. (2002). Geographically weighted regression: The analysis of spatially varying relationships. Chichester: Wiley
Gao, J., and Li, S. (2011). Detecting spatially non-stationary and scale-dependent relationships between urban landscape fragmentation and related factors using Geographically Weighted Regression. Appl. Geogr. 31 (1), 292–302. doi:10.1016/j.apgeog.2010.06.003
Guo, H., Cai, Y., Yang, Z., Zhu, Z., and Ouyang, Y. (2021). Dynamic simulation of coastal wetlands for Guangdong-Hong Kong-Macao Greater Bay area based on multi-temporal Landsat images and FLUS model. Ecol. Indic. 125, 107559. doi:10.1016/j.ecolind.2021.107559
Hammond, M. J., Chen, A. S., Djordjevic, S., Butler, D., and Mark, O. (2015). Urban flood impact assessment: A state-of-the-art review. Urban Water J. 12 (1), 14–29. doi:10.1080/1573062x.2013.857421
He, B.-R., and Zhai, P.-M. (2018). Changes in persistent and non-persistent extreme precipitation in China from 1961 to 2016. Adv. Clim. Change Res. 9 (3), 177–184. doi:10.1016/j.accre.2018.08.002
Helderop, E., and Grubesic, T. H. (2019). Social, geomorphic, and climatic factors driving U.S. coastal city vulnerability to storm surge flooding. Ocean Coast. Manag. 181, 104902. doi:10.1016/j.ocecoaman.2019.104902
Huang, H. B., Wang, X., and Liu, L. (2021). A review on urban pluvial floods: Characteristics, mechanisms, data, and research methods. Prog. Geogr. 40 (06), 1048–1059. doi:10.18306/dlkxjz.2021.06.014
Hudson, P., Raška, P., Macháč, J., and Slavíková, L. (2022). Balancing the interaction between urban regeneration and flood risk management – a cost benefit approach in Ústí nad Labem. Land Use Policy 120, 106276. doi:10.1016/j.landusepol.2022.106276
Jeong, D., Kim, M., Song, K., and Lee, J. (2021). Planning a green infrastructure network to integrate potential evacuation routes and the urban green space in a coastal city: The case study of haeundae district, busan, South Korea. Sci. Total Environ. 761, 143179. doi:10.1016/j.scitotenv.2020.143179
Kõiv-Vainik, M., Kill, K., Espenberg, M., Uuemaa, E., Teemusk, A., Maddison, M., et al. (2022). Urban stormwater retention capacity of nature-based solutions at different climatic conditions. Nature-Based Solutions 2, 100038. doi:10.1016/j.nbsj.2022.100038
Kong, F., Sun, S., and Lei, T. J. (2021). Understanding China's urban rainstorm waterlogging and its potential governance. Water 13 (7), 891. doi:10.3390/w13070891
Li, H., and Wu, J. (2004). Use and misuse of landscape indices. Landsc. Ecol. 19 (4), 389–399. doi:10.1023/b:land.0000030441.15628.d6
Li, C., Hu, Y., Deng, F., Xu, N., Yang, H., Fu, H., et al. (2021). Spatial and temporal variation characteristics and influencing factors of vegetation coverage in hubei province. Resour. Environ. Yangtze Basin 30 (8), 1829–1838.
Li, L., Chan, P. W., Deng, T., Yang, H.-L., Luo, H.-Y., Xia, D., et al. (2021). Review of advances in urban climate study in the Guangdong-Hong Kong-Macau greater bay area, China. Atmos. Res. 261, 105759. doi:10.1016/j.atmosres.2021.105759
Li, C., Liu, M., Hu, Y., Wang, H., Zhou, R., Wu, W., et al. (2022). Spatial distribution patterns and potential exposure risks of urban floods in Chinese megacities. J. Hydrology 610, 127838. doi:10.1016/j.jhydrol.2022.127838
Li, J., Wang, Y., Liu, L., and Yu, S.-Y. (2022). Characteristics and trends of rainstorm activities and their impacts on seasonal vegetation variations in coastal China. Ecol. Indic. 138, 108851. doi:10.1016/j.ecolind.2022.108851
Liang, P., and Ding, Y. (2017). The long-term variation of extreme heavy precipitation and its link to urbanization effects in shanghai during 1916-2014. Adv. Atmos. Sci. 34 (3), 321–334. doi:10.1007/s00376-016-6120-0
Liang, Z., Zhao, Y., and Fu, Y. (2017). Optimization of spatial pattern of urban imperviousness based on the integration of SCS-CN hydrological model and the ant colony algorithm. J. Geo-inf. Sci. 19 (10), 1315–1326. doi:10.3724/SP.J.1047.2017.01315
Liang, L., Chen, M., Luo, X., and Xian, Y. (2021). Changes pattern in the population and economic gravity centers since the Reform and Opening up in China: The widening gaps between the South and North. J. Clean. Prod. 310, 127379. doi:10.1016/j.jclepro.2021.127379
Lin, L. J., Gao, T., Luo, M., Ge, E. J., Yang, Y. J., Liu, Z., et al. (2020). Contribution of urbanization to the changes in extreme climate events in urban agglomerations across China. Sci. Total Environ. 744, 140264. doi:10.1016/j.scitotenv.2020.140264
Liu, C., Lin, S., Jiao, X., Shen, X., and Li, R. (2019). Problems and treatment countermeasures of water environment in Guangdong-Hong Kong-Macao greater bay area. Acta Sci. Nat. Univ. Pekin. 55 (06), 1085–1096. doi:10.13209/j.0479-8023.2019.087
Liu, F., Zhao, Y., Muhammad, R., Liu, X., and Chen, M. (2020). Impervious surface expansion: A key indicator for environment and urban agglomeration—a case study of Guangdong-Hong Kong-Macao greater bay area by using landsat data. J. Sensors 2020, 1–21. doi:10.1155/2020/3896589
Liu, F., Liu, X., Xu, T., Yang, G., and Zhao, Y. (2021). Driving factors and risk assessment of rainstorm waterlogging in urban agglomeration areas: A case study of the Guangdong-Hong Kong-Macao greater bay area, China. Water 13 (6), 770. doi:10.3390/w13060770
Lourenço, I. B., Beleño de Oliveira, A. K., Marques, L. S., Quintanilha Barbosa, A. A., Veról, A. P., Magalhães, P. C., et al. (2020). A framework to support flood prevention and mitigation in the landscape and urban planning process regarding water dynamics. J. Clean. Prod. 277, 122983. doi:10.1016/j.jclepro.2020.122983
Lu, B., Charlton, M., Brunsdon, C., and Harris, P. (2016). The Minkowski approach for choosing the distance metric in geographically weighted regression. Int. J. Geogr. Inf. Sci. 30 (2), 351–368. doi:10.1080/13658816.2015.1087001
Lu, X., Shun Chan, F. K., Chen, W.-Q., Chan, H. K., and Gu, X. (2022). An overview of flood-induced transport disruptions on urban streets and roads in Chinese megacities: Lessons and future agendas. J. Environ. Manag. 321, 115991. doi:10.1016/j.jenvman.2022.115991
Luo, K., and Zhang, X. (2022). Increasing urban flood risk in China over recent 40 years induced by LUCC. Landsc. Urban Plan. 219, 104317. doi:10.1016/j.landurbplan.2021.104317
Ma, X., Chen, Y., and Li, Z. (2019). The history, characteristics and prospects of regional urban cluster planning in the Guangdong-Hong Kong-Macao Greater Bay Region. Urban Plan. Forum (06), 15–24. doi:10.16361/j.upf.201906002
Ma, Y. L., Zhang, S. H., Yang, K., and Li, M. C. (2021). Influence of spatiotemporal pattern changes of impervious surface of urban megaregion on thermal environment: A case study of the Guangdong - Hong Kong - Macao greater bay area of China. Ecol. Indic. 121, 107106. doi:10.1016/j.ecolind.2020.107106
Meng, L., Sun, Y., and Zhao, S. (2020). Comparing the spatial and temporal dynamics of urban expansion in Guangzhou and shenzhen from 1975 to 2015: A case study of pioneer cities in China’s rapid urbanization. Land Use Policy 97, 104753. doi:10.1016/j.landusepol.2020.104753
Miller, J. D., and Hutchins, M. (2017). The impacts of urbanisation and climate change on urban flooding and urban water quality: A review of the evidence concerning the United Kingdom. J. Hydrol. Reg. Stud. 12, 345–362. doi:10.1016/j.ejrh.2017.06.006
O'Donnell, E. C., and Thorne, C. R. (2020). Drivers of future urban flood risk. Philosophical Trans. R. Soc. A Math. Phys. Eng. Sci. 378 (2168), 20190216. doi:10.1098/rsta.2019.0216
Otsuka, C., Fukutomi, H., and Niwa, Y. (2022). Effect of cost–benefit perceptions on evacuation preparedness for urban flood disasters. Int. J. Disaster Risk Reduct. 81, 103254. doi:10.1016/j.ijdrr.2022.103254
Pallathadka, A., Sauer, J., Chang, H., and Grimm, N. B. (2022). Urban flood risk and green infrastructure: Who is exposed to risk and who benefits from investment? A case study of three U.S. Cities. Landsc. Urban Plan. 223, 104417. doi:10.1016/j.landurbplan.2022.104417
Pietrucha-Urbanik, K. (2015). Failure analysis and assessment on the exemplary water supply network. Eng. Fail. Anal. 57, 137–142. doi:10.1016/j.engfailanal.2015.07.036
Qian, J., Du, Y., Yi, J., Liang, F., Huang, S., Wang, X., et al. (2022). Regional geographical and climatic environments affect urban rainstorm perception sensitivity across China. Sustain. Cities Soc. 87, 104213. doi:10.1016/j.scs.2022.104213
Qiang, Y., Zhang, L., and Xiao, T. (2020). Spatial-temporal rain field generation for the Guangdong-Hong Kong-Macau Greater Bay Area considering climate change. J. Hydrol. 583, 124584. doi:10.1016/j.jhydrol.2020.124584
Quan, R. S. (2014). Rainstorm waterlogging risk assessment in central urban area of Shanghai based on multiple scenario simulation. Nat. Hazards 73 (3), 1569–1585. doi:10.1007/s11069-014-1156-x
Riitters, K. H., O'Neill, R. V., Hunsaker, C. T., Wickham, J. D., Yankee, D. H., Timmins, S. P., et al. (1995). A factor analysis of landscape pattern and structure metrics. Landsc. Ecol. 10 (1), 23–39. doi:10.1007/bf00158551
Salinas Rodriguez, C. N. A., Ashley, R., Gersonius, B., Rijke, J., Pathirana, A., and Zevenbergen, C. (2014). Incorporation and application of resilience in the context of water-sensitive urban design: Linking European and Australian perspectives. WIREs Water 1 (2), 173–186. doi:10.1002/wat2.1017
Seto, K. C., and Fragkias, M. (2005). Quantifying spatiotemporal patterns of urban land-use change in four cities of China with time series landscape metrics. Landsc. Ecol. 20 (7), 871–888. doi:10.1007/s10980-005-5238-8
Sohn, W., Kim, J.-H., Li, M.-H., Brown, R. D., and Jaber, F. H. (2020). How does increasing impervious surfaces affect urban flooding in response to climate variability? Ecol. Indic. 118, 106774. doi:10.1016/j.ecolind.2020.106774
Tan, F., Gong, C., and Niu, Z. (2022). How does regional integration development affect green innovation? Evidence from China's major urban agglomerations. J. Clean. Prod. 379, 134613. doi:10.1016/j.jclepro.2022.134613
ten Veldhuis, M.-C., Zhou, Z., Yang, L., Liu, S., and Smith, J. (2018). The role of storm scale, position and movement in controlling urban flood response. Hydrol. Earth Syst. Sci. 22 (1), 417–436. doi:10.5194/hess-22-417-2018
Wang, X., and Xie, H. (2018). A review on applications of remote sensing and geographic information systems (GIS) in water resources and flood risk management. Water 10 (5), 608. doi:10.3390/w10050608
Wang, D., Jiang, P., Wang, G., and Wang, D. (2015). Urban extent enhances extreme precipitation over the Pearl River Delta, China. Atmos. Sci. Lett. 16 (3), 310–317. doi:10.1002/asl2.559
Wang, W., Wang, Q., Lin, H., Gong, D., and Zhang, S. (2015). Summarization and prospection for the studies on China's urban water logging. Urban Probl. (10), 24–28. doi:10.13239/j.bjsshkxy.cswt.151004
Wang, H., Mei, C., and Liu, J. (2017). Systematic construction pattern of the sponge city. J. Hydraul. Eng. 48 (09), 1009–1014+1022. doi:10.13243/j.cnki.slxb.20170308
Wang, K., Onodera, S.-i., Saito, M., and Shimizu, Y. (2021). Long-term variations in water balance by increase in percent imperviousness of urban regions. J. Hydrol. 602, 126767. doi:10.1016/j.jhydrol.2021.126767
Wang, Z., Wang, P., Wang, Y., Peng, H., Hua, P., and Zhang, J. (2021). Wavelet decomposition and genetic BPNN hybrid model based modelling approach for as concentration prediction in surface water. Acta Sci. Circumstantiae 41 (7), 2942–2950.
Wang, T., Jian, S., Wang, J., and Yan, D. (2022). Dynamic interaction of water–economic–social–ecological environment complex system under the framework of water resources carrying capacity. J. Clean. Prod. 368, 133132. doi:10.1016/j.jclepro.2022.133132
Wang, X., Xia, J., Zhou, M., Deng, S., and Li, Q. (2022). Assessment of the joint impact of rainfall and river water level on urban flooding in Wuhan City, China. J. Hydrol. 613, 128419. doi:10.1016/j.jhydrol.2022.128419
Wang, Y., Li, C., Liu, M., Cui, Q., Wang, H., Lv, J., et al. (2022). Spatial characteristics and driving factors of urban flooding in Chinese megacities. J. Hydrol. 613, 128464. doi:10.1016/j.jhydrol.2022.128464
Wang, Z. (2019). Research on urban water logging prophylaxis and treatment in Ningbo. Master's thesis. Hangzhou: Zhejiang A&F University.
Wu, P., Li, T., and Li, W. (2018). Spatial differentiation and influencing factors analysis of rural poverty at county scale: A case study of shanyang county in shaanxi province, China. Geogr. Res. 37 (03), 593–606.
Wu, Y., Yu, G., and Shao, Q. (2022). Resilience benefit assessment for multi-scale urban flood control programs. J. Hydrology 613, 128349. doi:10.1016/j.jhydrol.2022.128349
Xiao, N. (2019). Urban waterlogging resilience analysis and study on preventive measures. Master's thesis. Dalian: Dalian University of Technology.
Xu, L., Cui, S., Wang, X., Tang, J., Nitivattananon, V., Ding, S., et al. (2021). Dynamic risk of coastal flood and driving factors: Integrating local sea level rise and spatially explicit urban growth. J. Clean. Prod. 321, 129039. doi:10.1016/j.jclepro.2021.129039
Xu, P. F., Lin, M. Y., and Jin, P. B. (2021). Spatio-temporal dynamics of urbanization in China using DMSP/OLS nighttime light data from 1992-2013. Chin. Geogr. Sci. 31 (1), 70–80. doi:10.1007/s11769-020-1169-1
Yan, M., Chan, J. C. L., and Zhao, K. (2020). Impacts of urbanization on the precipitation characteristics in Guangdong province, China. Adv. Atmos. Sci. 37 (7), 696–706. doi:10.1007/s00376-020-9218-3
Yang, Y., Zhao, Y., and Wang, B. (2022). Construction of smart urban agglomeration in Guangdong- Hong Kong- Macao greater bay area under the system of "one connection and ecological-living-production space system. J. Geo-information Sci. 24 (06), 1073–1086.
Yu, H. F., Zhao, Y. L., Fu, Y. C., and Li, L. (2018). Spatiotemporal variance assessment of urban rainstorm waterlogging affected by impervious surface expansion: A case study of Guangzhou, China. Sustainability 10 (10), 3761. doi:10.3390/su10103761
Yu, H. F., Zhao, Y. L., Xu, T., Li, J. F., Tang, X. Z., Wang, F. F., et al. (2021). A high-efficiency global model of optimization design of impervious surfaces for alleviating urban waterlogging in urban renewal. Trans. Gis 25 (4), 1716–1740. doi:10.1111/tgis.12757
Zhang, B., Xie, G.-d., Li, N., and Wang, S. (2015). Effect of urban green space changes on the role of rainwater runoff reduction in Beijing, China. Landsc. Urban Plan. 140, 8–16. doi:10.1016/j.landurbplan.2015.03.014
Zhang, H., Cheng, J., Wu, Z., Li, C., Qin, J., and Liu, T. (2018). Effects of impervious surface on the spatial distribution of urban waterlogging risk spots at multiple scales in Guangzhou, south China. Sustainability 10 (5), 1589. doi:10.3390/su10051589
Zhang, L., Chen, X., and Lai, R. (2020). Urban signatures of sub-daily extreme precipitation events over a metropolitan region. Atmos. Res. 246, 105204. doi:10.1016/j.atmosres.2020.105204
Zhang, Q., Wu, Z., Zhang, H., Dalla Fontana, G., and Tarolli, P. (2020). Identifying dominant factors of waterlogging events in metropolitan coastal cities: The case study of Guangzhou, China. J. Environ. Manag. 271, 110951. doi:10.1016/j.jenvman.2020.110951
Zhang, Q., Wu, Z., Guo, G., Zhang, H., and Tarolli, P. (2021). Explicit the urban waterlogging spatial variation and its driving factors: The stepwise cluster analysis model and hierarchical partitioning analysis approach. Sci. Total Environ. 763, 143041. doi:10.1016/j.scitotenv.2020.143041
Zhang, Z., Qiu, J., Cheng, T., Huang, B., and Feng, Z. (2022). Urban flood issues and analysis in the Guangdong-Hong Kong-Macao greater bay area. J. Hydraul. Eng. 53 (7), 823–832.
Zhao, S., Gong, Z., and Liu, X. (2015). Correlation analysis between vegetation coverage and climate drought conditions in North China during 2001-2013. ACTA Geogr. SIN. 70 (05), 717–729.
Zhou, H., Liu, J., Goa, C., and Ou, S. (2018). Analysis of current situation and problems of urban waterlogging control in China. J. Catastrophol. 33 (03), 147–151. doi:10.3969/j.issn.1000-811X.2018.03.028
Zhou, S., Liu, Z., Wang, M., Gan, W., Zhao, Z., and Wu, Z. (2022). Impacts of building configurations on urban stormwater management at a block scale using XGBoost. Sustain. Cities Soc. 87, 104235. doi:10.1016/j.scs.2022.104235
Keywords: Guangdong Hong Kong Macao greater bay area, urban agglomeration, storm waterlogging, influencing mechanism, spatial-temporal evolution
Citation: Zhang C, Xu T, Wang T and Zhao Y (2023) Spatial-temporal evolution of influencing mechanism of urban flooding in the Guangdong Hong Kong Macao greater bay area, China. Front. Earth Sci. 10:1113997. doi: 10.3389/feart.2022.1113997
Received: 02 December 2022; Accepted: 29 December 2022;
Published: 13 January 2023.
Edited by:
Weili Duan, Xinjiang Institute of Ecology and Geography (CAS), ChinaReviewed by:
Shuliang Zhang, Nanjing Normal University, ChinaCopyright © 2023 Zhang, Xu, Wang and Zhao. This is an open-access article distributed under the terms of the Creative Commons Attribution License (CC BY). The use, distribution or reproduction in other forums is permitted, provided the original author(s) and the copyright owner(s) are credited and that the original publication in this journal is cited, in accordance with accepted academic practice. No use, distribution or reproduction is permitted which does not comply with these terms.
*Correspondence: Teng Wang, d2FuZ3Rlbmc0M0Bob3RtYWlsLmNvbQ==; Yaolong Zhao, emhhb3lhb2xvbmdAbS5zY251LmVkdS5jbg==
†These authors have contributed equally to this work and share first authorship
Disclaimer: All claims expressed in this article are solely those of the authors and do not necessarily represent those of their affiliated organizations, or those of the publisher, the editors and the reviewers. Any product that may be evaluated in this article or claim that may be made by its manufacturer is not guaranteed or endorsed by the publisher.
Research integrity at Frontiers
Learn more about the work of our research integrity team to safeguard the quality of each article we publish.