 Yushi Wang
 Yi Ding
- Key Laboratory of Urban Security and Disaster Engineering of China Ministry of Education, Beijing University of Technology, Beijing, China
The spectral accelerations (Sa), which are widely used as ground motion inputs in structural seismic designing, are significantly affected by local site conditions classified by near-surface geology. A novel approach of quantifying the scaling ratios for Sa on site class I, II, III, and IV under the site condition classifications in Chinese seismic codes, was proposed. In this integrated approach, the scaling ratios for Sa on each site class were subordinated to three constituents, i.e., scaling ratios for peak ground acceleration (PGA), scaling ratios for PGA-normalized Sa, and non-linear decay exponents. The scaling ratios for peak ground acceleration were derived from recent studies and numerical simulations of 1,138 borehole models in China, the scaling ratios for PGA-normalized Sa were derived from 3,584 strong motion records in NGA West two database, and the non-linear decay exponents were derived from about 140 thousand borehole observation data recorded by KiK-net. Consequently, this approach was solidly based on statistics of observation data in company with numerical simulations, which resulted in more reasonable and more reliable scaling ratios for Sa caused by the seismic site effect under site condition classifications in China.
1 Introduction
Seismic damage data and strong motion records showed that local site conditions have a significant impact on the characteristics of ground motions, especially the medium-to-long period components are significantly amplified by soft overburdens, which should be sufficiently considered during the determination of ground motion inputs for structural seismic designing (Seed et al., 1969; Hu et al., 1980; Aki, 1993; Hu, 2006). For an important engineering structure, it is generally necessary to carry out engineering geological survey, establish a local site model, and conduct numerical simulation of site seismic response considering the influence of seismic environment, strong motion attenuation, and other factors to determine the ground motion inputs related to the local site condition. Meanwhile, for general projects with large quantities and a wide range of areas, it is necessary to establish the scaling ratios for ground motion induced by the seismic site effect on homologous site conditions for the convenience of engineering applications (Li et al., 2001a; Stewart and Seyhan, 2013; Bo et al., 2021).
Based on the site condition classifications in China, different scaling ratios for ground motion parameters caused by the seismic site effect were given (Lu et al., 2008; Li, 2013), in which the ground motion parameter most commonly concerned was peak ground acceleration (PGA), while effective peak acceleration (EPA) and spectral acceleration (Sa) were also frequently used. The research methods included the conversion of foreign achievements (Lü et al., 2007), the numerical simulation of borehole models (Li et al., 2001b; Lan et al., 2012), and statistics based on strong motion records in western United States (Bo, 1998; Geng, 2005; Liu et al., 2009; Zhao et al., 2009) or Japan (Guo et al., 2011; Cui et al., 2016; Bian et al., 2017), but there were obvious inconsistencies among these results.
Based on the strong motion records now available, a novel approach of quantifying the scaling ratios for Sa under the site condition classifications in China were proposed in this study.
2 Site condition classifications
2.1 Site condition classifications in China
According to “GB 50011: Code for Seismic Design of Buildings” in China (General Administration of Quality Supervision, Inspection and Quarantine of the People's republic of China, 2016), site conditions were classified into I0, I1, II, III, and IV in accordance with shear-wave velocity and overburden thickness, as shown in Table 1, where VS was the shear-wave velocity of the surface rock on the rock site, VSE was the equivalent shear-wave velocity on the soil site. VSE was defined as following:
where di was the thickness of the ith layer of soil within the shallower of overburden thickness and 20 m, and VSi was shear-wave velocity of the ith layer of soil.
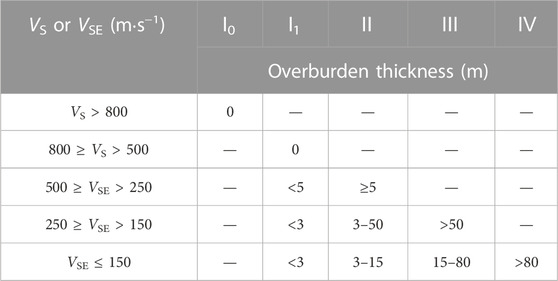
TABLE 1. Site condition classification criteria in China.
2.2 Site condition classifications in this study
The shear-wave velocity structures of the 1,138 borehole models and 140 thousand KiK-net observation data were available, and therefore the corresponding site class could be determined according to Table 1. But in the NGA West two database, the shear-wave velocity structures were not listed, hence the empirical relationship between VS30 (the time-averaged shear-wave velocity to 30 m depth in m·s−1) and VS20 (the time-averaged shear-wave velocity to 20 m depth in m·s−1) (Boore, 2004)
was used to classify the site conditions. If VS20 was treated to be identical to VSE, it could be calculated that VS30 > 562 m s−1 on site class I, 562 m s−1≥ VS30 > 280 m s−1 on site class II, 279 m s−1≥ VS30 > 167 m s−1 on site class III, and VS30 < 167 m s−1 on site class IV under the site condition classification criteria in China. As a result of data insufficiency, the site class I0 was not subdivided from site class I in the following statistics.
3 Scaling ratios for PGA
3.1 Numerical simulations of borehole models
One-dimensional equivalent linearization models for 492 boreholes on site class II, 596 boreholes on site class III, and 50 boreholes on site class IV drilled in Sichuan, Yunnan, Xinjiang and Eastern China, were established. The strong motion inputs of subterrane bottom interface were artificial acceleration time series synthesized according to the average PGA-normalized Sa on site class I for moment magnitude 5.0–6.0, 6.0–7.0, and 7.0–8.0 as shown in Figure 3 scaled by PGA = .5, .75, 1.0, 1.5, 2.0, 3.0, 4.0, 5.0, and 6.0 m/s−2. The amplification factors of PGA induced from the numerical simulation results were shown in Figure 1. The linear fittings for amplification factors of PGA under semi-logarithmic coordinates were calculated. The linear fittings formula was
where the site class i = II, III, or IV, Ai was the amplification factor on site class i versus on site class I0,
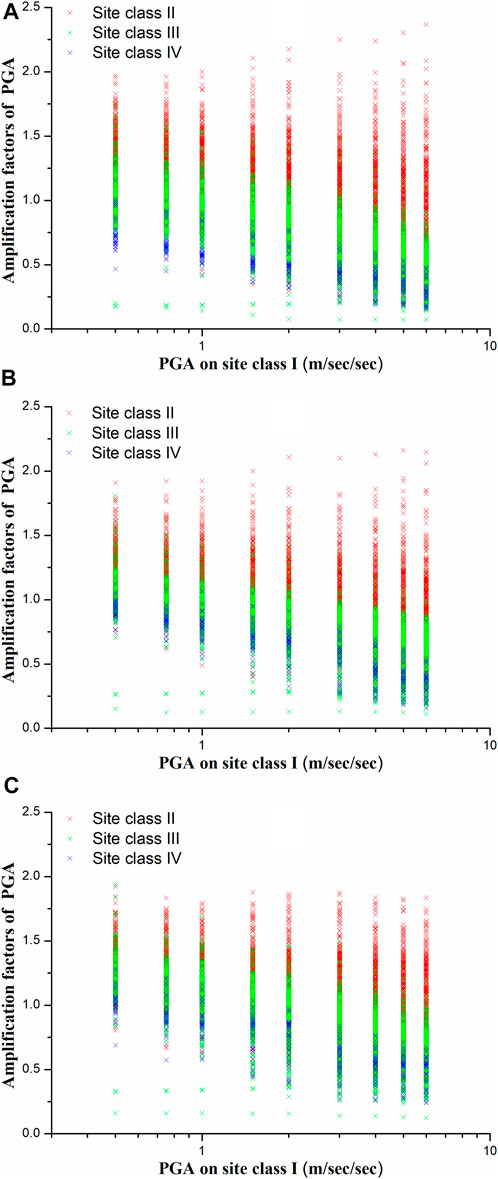
FIGURE 1. PGA amplification factors on site class II, III, and IV versus on site class I0 given by borehole numerical simulations when the motion inputs of subterrane bottom interface were artificial acceleration time series synthesized according to the average PGA-normalized Sa for (A) MW = 5.0–6.0, (B) MW = 6.0–7.0, and (C) MW = 7.0–8.0.
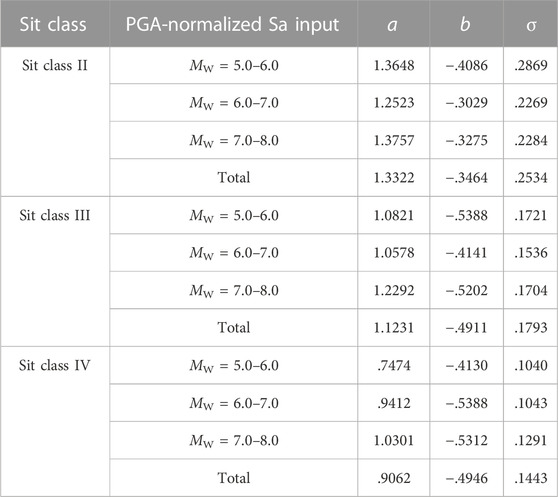
TABLE 2. Fitting coefficients for PGA amplification factors given by numerical simulations.
3.2 Statistical results in recent studies
PGA amplification factors proposed in recent studies when PGA ≤ .5 m s−2 on site class I1 were listed in Table 3, and the PGA amplification factors on site class II, III, and IV versus site class I1 were shown in Figure 2. Considering the differences between the site class I0 and the site class I1, the PGA amplification factors given by numerical simulations in Table 2 were divided by 0.80 according to Table 5. It could be concluded that PGA amplification of soft overburden layers had reached consensus, but the specific values of amplification factors were not identical in different studies, even when the ground motion strength was weak enough to ignore the soil non-linearity (Wang et al., 2022).

TABLE 3. PGA amplification factors when PGA ≤.5 m s−2 on site class I1 in recent studies.
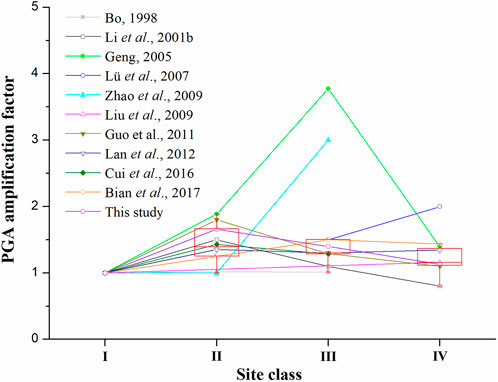
FIGURE 2. PGA amplification factors and their box-plots on site class II, III, and IV versus site class I1 when PGA ≤ .5 m s−2 on site class I1 in recent studies.
3.3 Proposed scaling ratios for PGA
The median values of PGA amplification factors when PGA ≤.5 m s−2 on site class I1 in recent studies shown in Table 3, i.e., 1.00 on site class I1, 1.39 on site class II, 1.30 on site class III, and 1.16 on site class IV, were proposed to be the PGA scaling ratios as a temporary compromise. The PGA scaling ratio on site class I0 was proposed to be .80 according to the practices of NEHRP (Stewart and Seyhan, 2013).
4 Scaling ratios for PGA-normalized sa
4.1 Data resource
The statistical data used in this section were from NGA-West two database of the next generation ground motion attenuation program of the Pacific Earthquake Engineering Research Center. NGA-West two database had collected and processed more than 20,000 strong motion records of shallow crustal earthquakes in active tectonic regions around the world, including detailed earthquake parameters and site information. However, strong motion records in earthquakes above moment magnitude 8.0 were not included in this database. Although abundant strong motion records were obtained in the 2011 earthquake off the Pacific coast of Tōhoku, Japan, they were excluded in this study considering that this earthquake occurred in a marine subduction zone. Almost all the destructive earthquakes in China are of another type of earthquake mechanism, i.e., inland earthquakes. Researches had shown that there were significant differences between the ground motions of the two types of earthquake mechanism, and the long-period ground motions of earthquakes in marine subduction zone were significantly lower than the inland earthquakes.
Three thousand five hundred eighty four strong motion records with moment magnitude MW ≥ 5.0, Joyner-Boore distance (the closest distance to the surface projection of an extended seismogenic fault) ≤200 km, and PGA ≥.3 m s−2 were used. The sample capacities of records on each site class grouped by moment magnitude, Joyner-Boore distance or PGA were listed in Table 4. There were most strong motion records on site class II, and their distribution was relatively uniform grouped by moment magnitude, Joyner-Boore distance or PGA. There were fewer records on site class I and site class III, and only 30 records on site class IV.
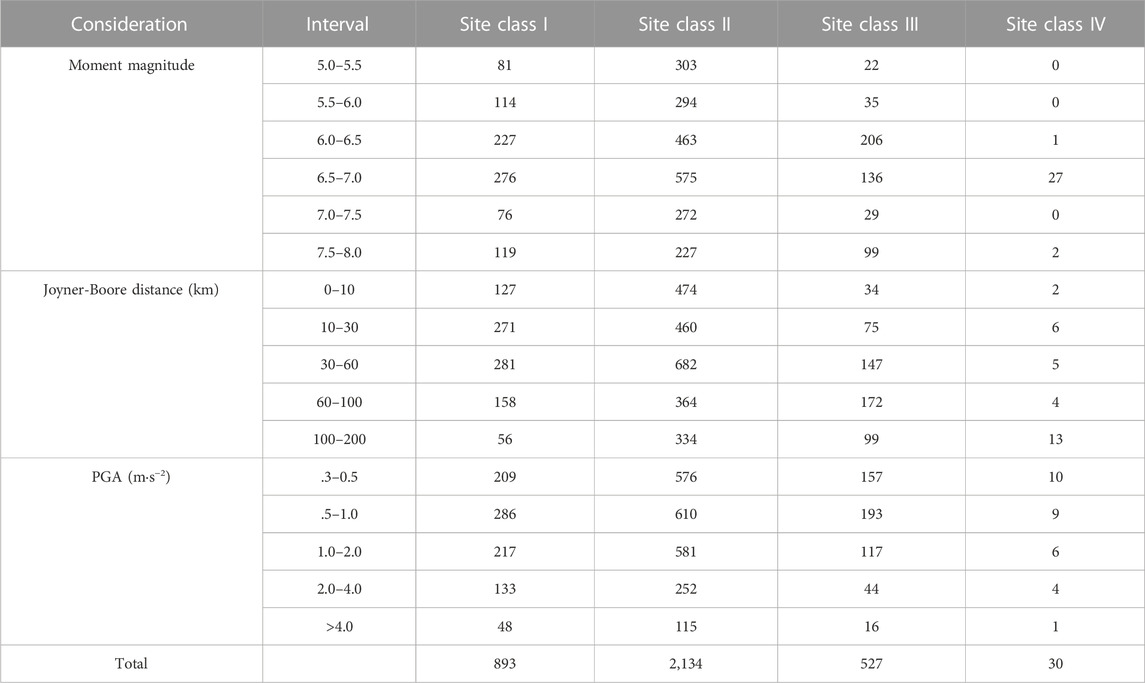
TABLE 4. Sample capacities of records from NGA-West2 database on each site class.
According to the lowest usable frequency of each strong motion record given by NGA-West2 database, the Sa values exceeding the corresponding period were eliminated. Consequently, 100% of the 3,584 records were used in the statistics of Sa when period T ≤ 1.0 s, while 97.0% when 1.0 s < T ≤ 2.0 s, 80.9% when 2.0 s < T ≤ 4.0 s, and 70.1% when 4.0 s < T ≤ 6.0 s.
4.2 PGA-normalized Sa
The PGA-normalized Sa was defined as the quotient of Sa with 5% damping ratio divided by PGA of each strong motion record. The site condition represented by the site class, earthquake magnitude represented by the moment magnitude MW, source distance represented by the Joyner-Boore distance, and ground motion strength represented by PGA, were selected as the key influences on PGA-normalized Sa in this study, for they significantly affected Sa. Only PGA-normalized Sa on site class I, II, and III was analysed due to the small sample capacity of records on the site class IV.
The mean values of PGA-normalized Sa with different moment magnitude intervals were shown in Figure 3, which indicated that:
1) PGA-normalized Sa was significantly affected by the moment magnitude.
2) Generally, the medium-to-long period (T > .20 s on site class I, T > .24 s on site class II, and T > .30 s on site class III) segments of PGA-normalized Sa remarkably increased with the increase of the moment magnitude.
3) The short period (T < .20 s on site class I, T < .24 s on site class II, and T < .30 s on site class III) segments of PGA-normalized Sa with moment magnitude MW = 5.0–7.5 were almost identical to each other, while their values were slightly larger than the values with moment magnitude MW = 7.0–8.0.
4) The differences among the PGA-normalized Sa with moment magnitude MW = 5.5–6.5, 6.0–7.0, and 6.5–7.5, were much slighter comparing the differences among other moment magnitude intervals. It might be caused by the geometry of seismogenic faults, which could be simplified to be a point source in a small earthquake, an area source of several square kilometers in a medium earthquake, and a rectangle source tens to more than 100 km long in a great earthquake.
5) The medium period (.30 s < T < 3.00 s) segments on site class I, and long period (T > 1.00 s) segments on site class III with moment magnitude MW = 6.5–7.5, were abnormally small.

FIGURE 3. Mean values for PGA-normalized Sa with different moment magnitude intervals on (A) site class I, (B) site class II, and (C) site class III.
The mean values of PGA-normalized Sa with different Joyner-Boore distance intervals and with different PGA intervals were shown in Figure 4. It could be concluded that:
1) PGA-normalized Sa was slightly affected by the Joyner-Boore distance or PGA comparing with the influence caused by the moment magnitude.
2) From a global perspective, the medium-to-long period segments of PGA-normalized Sa increased with the increase of Joyner-Boore distance, and decreased with the increase of PGA in an imperceptible degree.
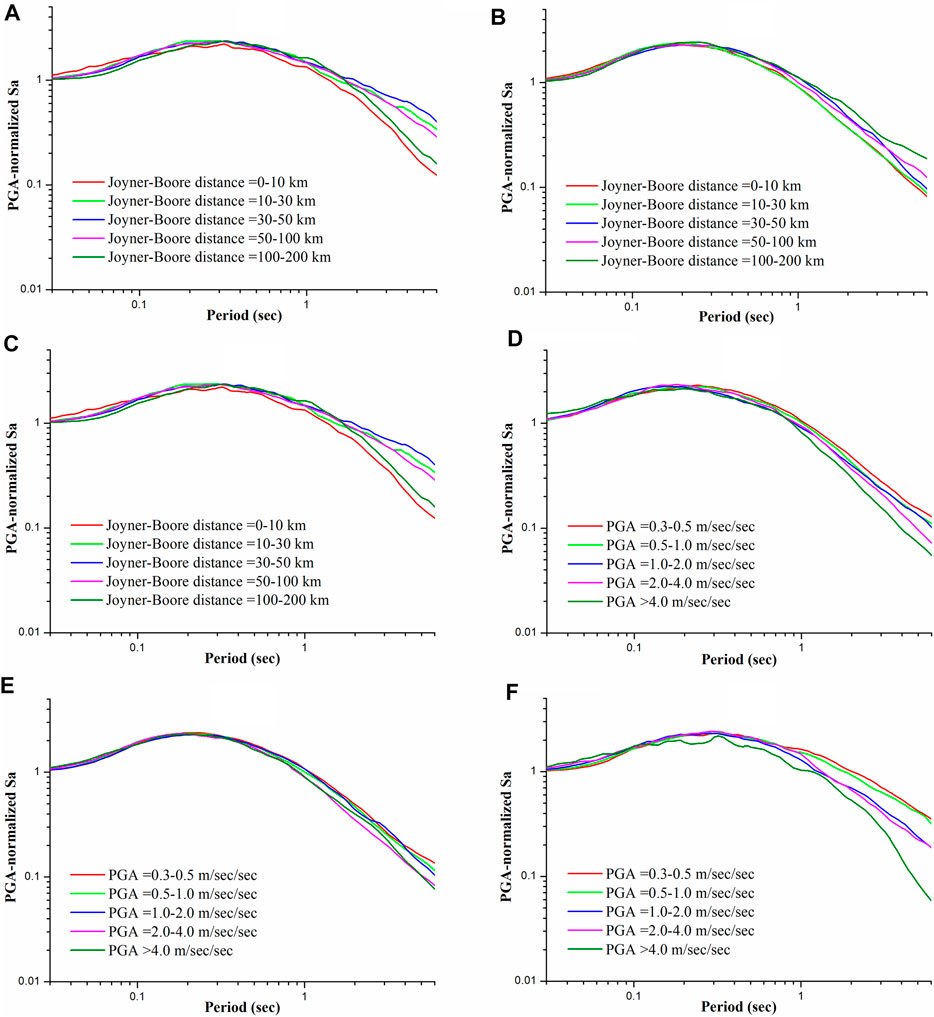
FIGURE 4. Mean values for PGA-normalized Sa with different Joyner-Boore distance intervals on (A) site class I, (B) site class II, (C) site class III, and mean values for PGA-normalized Sa with different PGA intervals on (D) site class I, (E) site class II, and (F) site class III.
4.3 Residual analyses after removing the influence of moment magnitude
In order to further analyse the dependence of the PGA-normalized Sa on the source distance and the ground motion strength, residual analyses were used to remove the influence of the most significant influence factor, namely moment magnitude. According to the moment magnitude and site class corresponding to each strong motion record, fitting values of PGA-normalized Sa of the record were obtained from the data shown in Figure 3 using linear interpolation under logarithmic coordinates. By subtracting the fitting values from the calculated PGA-normalized Sa of each strong motion record, the residuals of logarithmic PGA-normalized Sa were obtained.
The residuals of logarithmic PGA-normalized Sa with different Joyner-Boore distance intervals were shown in Figures 5A–C, which indicated that:
1) The regularity of residual curves with the Joyner-Boore distance on site class I, II and III was weak, which meant that PGA-normalized Sa and the Joyner-Boore distance had weak correlation.
2) The discreteness of residuals caused by the Joyner-Boore distance was sufficiently small, within 10± .1 on site class I and II, as well as on site class III when T ≤.20 s.
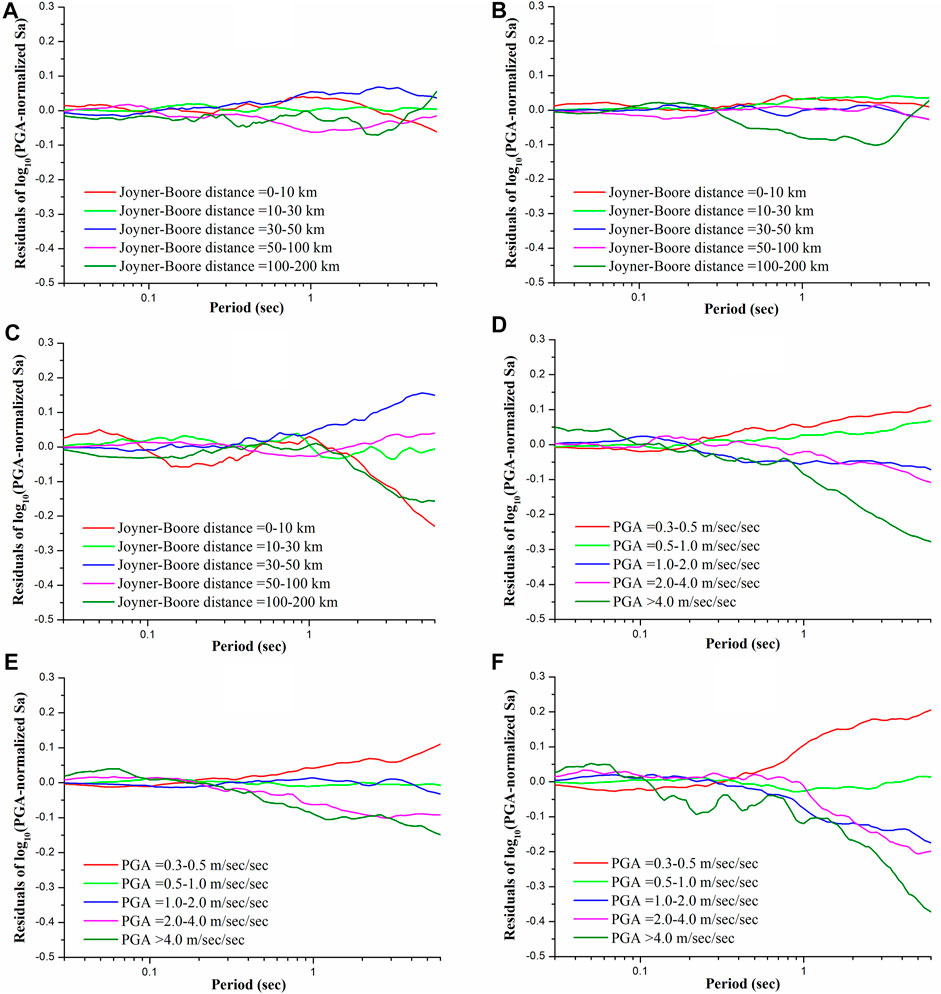
FIGURE 5. Residuals of logarithmic PGA-normalized Sa with different Joyner-Boore distance intervals on (A) site class I, (B) site class II, (C) site class III, and residuals of logarithmic PGA-normalized Sa with different PGA intervals on (D) site class I, (E) site class II, and (F) site class III.
The residuals of logarithmic PGA-normalized Sa with different PGA intervals were shown in Figures 5D–F, which indicated that:
1) When T < .20 s, the discreteness of residuals caused by PGA was within 10± .05 on site class I, II, and III.
2) When T > .30 s, the residuals regularly decreased with the increase of PGA; meanwhile, the differences among the residuals with different PGA intervals gradually increased with the increase of periods.
Comparisons of the residuals in Figure 5 showed that the PGA-normalized Sa was much more significantly correlated with PGA than with the Joyner-Boore distance. In other words, PGA was a more sensitive variable than the Joyner-Boore distance in the determination of PGA-normalized Sa.
Incidentally, PGA and the Joyner-Boore distance were not completely independent variables in an earthquake, for PGA was negatively correlated with the source distance statistically as a result of the strong motion attenuation. Meanwhile, on rock sites with small source distances, the long-period Sa normalized by PGA was known to be smaller than that on the rock sites with large source distances; but at the same time, stronger non-linearity of overburden layers would amplify the long-period Sa on soil sites with smaller source distances. The influences on PGA-normalized Sa caused by PGA and source distance, which offset each other, were a subject worthy of further study.
4.4 Scaling ratios for PGA-normalized Sa on site class II and III
The quotients of PGA-normalized Sa on site class II and III divided by PGA-normalized Sa on site class I with each moment magnitude interval were shown in Figures 6A, B, which indicated that:
1) When T < 1.00 s, the quotients with different moment magnitude intervals on the same site class were identical to each other within acceptable deviations.
2) When T > 1.00 s, the deviations of the quotients with different moment magnitude intervals increased with the increase of periods, and this trend was more significant on site class III than on site class II.
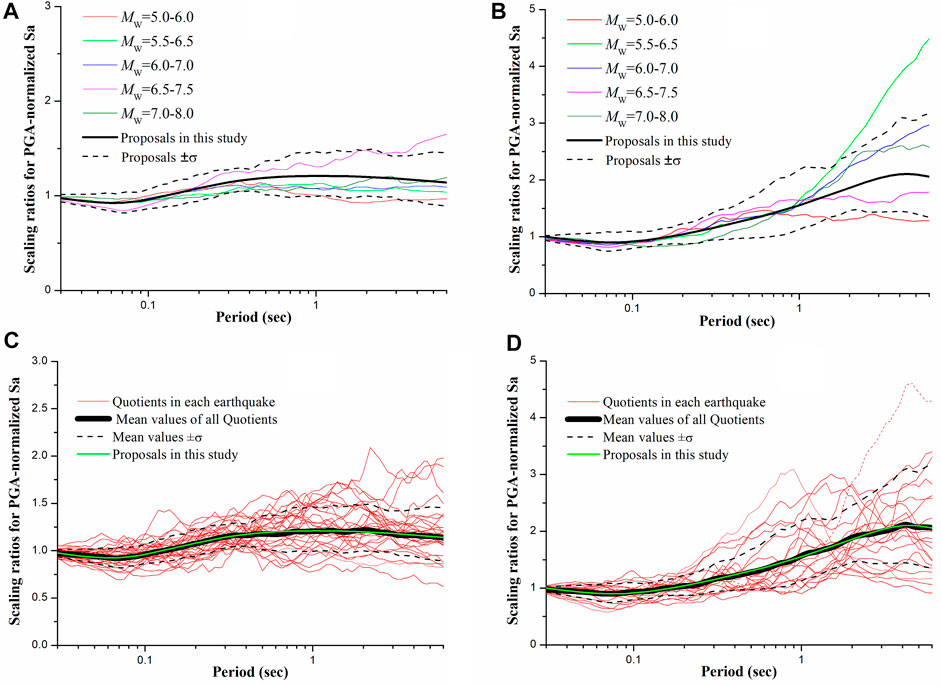
FIGURE 6. Quotients of PGA-normalized Sa on (A) site class II, (B) site class III divided by PGA-normalized Sa on site class I with different moment magnitude intervals, and quotients of PGA-normalized Sa on (C) site class II, (D) site class III divided by PGA-normalized Sa on site class I in the same selected earthquake. The scaling ratios proposed in this study were shown in green curves.
The above phenomenon could be explained by Figure 5, which showed that the Joyner-Boore distance and PGA significantly affected the PGA-normalized Sa when T > 1.00 s. Further considerations of the Joyner-Boore distance and PGA during the calculation would probably lower the deviations.
In order to eliminate the impact of source spectra differences in different earthquakes, earthquakes with no less than five strong motion records on site class I as well as on site class II or III were selected. The quotients of PGA-normalized Sa on site class II or III divided by PGA-normalized Sa on site class I in the same selected earthquake, and their mean values weighted by square roots of the sample capacities on site class I and on site class II or III, were shown in Figures 6C, D, which indicated that:
1) The deviations of the quotients calculated in the same selected earthquake were obviously larger than the deviations of quotients calculated in the same moment magnitude intervals shown in Figures 6A, B.
2) The mean values of quotients calculated in the same selected earthquake were almost identical to the average quotients calculated in the same moment magnitude intervals shown in Figures 6A,B.
The smoothen fittings for the mean values of quotients in Figures 6C,D were proposed as the scaling ratios of PGA-normalized Sa on site class II and III versus on site class I1 in this study, which were shown as green curves. The proposed scaling ratios of PGA-normalized Sa could reflect the average impact of site conditions on spectral compositions on site class II and III as shown in Figures 6A,B, but in a particular earthquake, it would yield great error as shown in Figures 6C,D. As a consequence, the proposed scaling ratios could be used to estimate the seismic site effect for general projects with large quantities and wide areas with an acceptable accuracy in a statistical sense, but they would be non-negligible inaccurate on a particular engineering site in a particular earthquake.
4.5 Scaling ratios for PGA-normalized Sa on site class IV
The PGA-normalized Sa with different moment magnitude intervals on site class IV could not be reliably obtained because of the small sample capacity of only 30 strong motion records as listed in Table 4. So 26 strong motion records with moment magnitude MW = 6.61–6.93 were used to calculate the PGA-normalized Sa on site class IV for second best as shown in Figure 7A. Meanwhile, the average PGA-normalized Sa on site class I with moment magnitude MW ≈ 6.75, which was the average moment magnitude of the 26 records on site class IV, were also calculated as shown in Figure 7A. The quotients of PGA-normalized Sa on site class IV with moment magnitude MW = 6.61–6.93 divided by PGA-normalized Sa on site class I with moment magnitude MW ≈ 6.75 were shown as a black curve in Figure 7C as a black curve.

FIGURE 7. Mean values of PGA-normalized Sa on site class IV with moment magnitude MW = 6.61–6.93 and on site class I with moment magnitude MW ≈ 6.75 (A), the quotients for PGA-normalized Sa on site class IV given by records in the three selected earthquakes (B) and the indirect conversion (C).
Four earthquakes with no less than five strong motion records on site class I as well as on site class IV were selected to eliminate the impact of source spectra differences, one of which was excluded in the calculation of mean values because of the excessive deviation. The quotients of PGA-normalized Sa on site class IV divided by PGA-normalized Sa on site class I in the same selected earthquake, and their mean values weighted by square roots of the sample capacities on site class I and on site class IV were shown in Figure 7B, which indicated that:
1) The deviations of the quotients calculated in the same selected earthquake on site class IV were even much larger than these on site class III as shown in Figure 6D.
2) There was an obvious peak at T = .90 s on the curve of average quotients on site class IV. The period of this peak was inconsistent with the result on site class III as shown in Figure 6D.
In order to distinguish whether the obvious difference between the scaling ratios on site class IV and on site class III were caused by the source spectra of selected earthquakes, the mean values of quotients given by records in the three selected earthquakes on site class II and on site class III were also given in Figure 7B. It indicated that the trend of quotients on site class III given by records in the three earthquakes was comparable with quotients on site class IV, but significantly different from the scaling ratios on site class III given in Figure 6D. So it could be concluded that the uniqueness of source spectra in the three earthquakes might be the reason for this different trend.
Consequently, the quotients of PGA-normalized Sa on site class IV versus on site class I by an indirect conversion to eliminate the uniqueness of source spectra were shown in Figure 7C. To be more specific, the mean values of quotients of PGA-normalized Sa on site class IV in Figure 7B were divided by the quotients of PGA-normalized Sa on site class II or III in Figure 7B, and then multiplied the scaling ratios on site class II or III given in Figure 6C or Figure 6D. It could be concluded that:
1) The quotients calculated by 26 strong motion records with moment magnitude MW = 6.61–6.93 were smaller than the mean values of quotients calculated by records in three selected earthquakes and the quotients converted from site class II. But the three of them shared the same trend, i.e., a peak at period T = .90 s, and relatively small values when period T > 2.00 s.
2) The quotients converted from site class III showed in a blue curve showed a very different trend, but they were comparable with the scaling ratios on site class III in Figure 6D.
Since the classification criteria for the site class IV were close to the site class III only with a smaller equivalent shear-wave velocity and a larger overburden thickness as listed in Table 1, and the peak at period T = .90 s was probably caused by unique source spectra, we proposed the smoothed quotients converted from site class III to be the scaling ratios for PGA-normalized Sa on the site class IV, which were shown in a green curve in Figure 7C.
5 Non-linear decay exponents
5.1 Data resource
More than 140,000 strong motion records at 137 stations in KiK-net (Kiban Kyoshin Network) were used in this section. The maximum peak acceleration of downhole records at each station ≥.75 m s−2. According to the site condition classification criteria in China listed in Table 1, 15 stations were on site class I1, 107 stations were on site class II, 12 stations were on site class III, and only three stations were on site class IV.
5.2 Non-linear decay of surface/borehole Sa
The quotients of Sa on the ground surface divided by Sa in the borehole, i.e., surface/borehole (S/B) Sa, obtained in the same earthquake of each station were calculated, and then the average platform value of surface/borehole Sa were determined using the similar concept as the calculation of EPA but at a variable period range (Ding et al., 2021). The scatter diagrams of the average platform values at four stations were shown in Figure 8, which indicated that large discreteness still could not hide the decay trend with strong motion strength. The mean values of the platform values in a variable sample capacity window narrowing with the increase of the strong motion strength were also shown in Figure 8 as red bold dots, which showed a clearer linear decay trend under semi-logarithmic coordinates than the platform values shown in black dots.
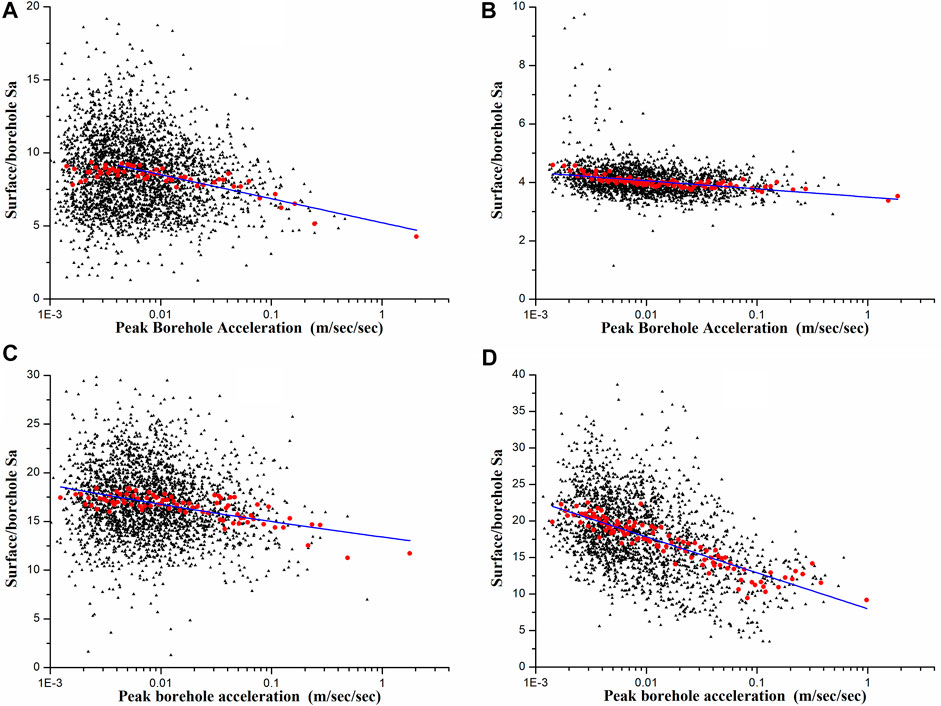
FIGURE 8. The scatter diagrams, their smoothed mean values, and linear fittings for the platform values of surface/borehole Sa at (A) Station TCGH10 on site class I1, (B) Station FKSH11 on site class II, (C) Station TCGH16 on site class III, and (D) Station IBRH10 on site class IV.
The slopes of the linear fittings for platform values at all the 137 station were shown in Figure 9, which indicated that the slopes were smaller on sites with softer and thicker overburdens, even though there was considerable overlap between two adjacent site classes.
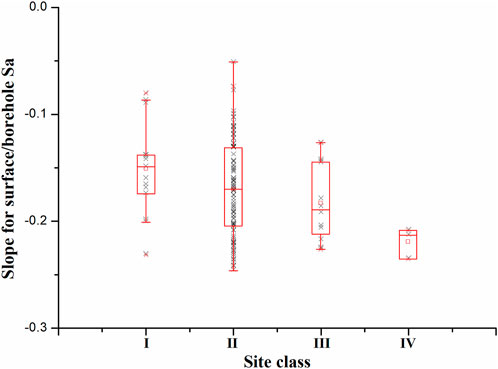
FIGURE 9. The scatter diagrams and box-plots for the slopes of the linear fittings for platform values of surface/borehole Sa for all the 137 stations on each site class.
5.3 Proposed non-linear decay exponents
The median slopes of the linear fittings for platform values of surface/borehole Sa under semi-logarithmic coordinates, i.e., −.150 on site class I1, −.169 on site class II, −.182 on site class III, and −.218 on site class IV, were proposed as the non-linear decay exponents of Sa as a temporary compromise. The non-linear decay exponents on site class I0 was proposed to be 0.
The non-linear decay exponents should be derived from the quotients of Sa on soil sites divided by Sa on rock sites, namely, soil/rock Sa, under the same strong motion inputs, or at least when the distance between the soil site and the rock site was negligible compared with their source distance. There would be an error induced by the assumption that the non-linear decay exponents of surface/borehole Sa were identical to soil/rock Sa. But as there were not sufficient number of samples to obtain soil/rock Sa, the slopes of the linear fittings for platform values of surface/borehole Sa might be approximately regarded to be the non-linear decay exponents of soil/rock Sa (Li et al., 2021).
6 Proposed scaling ratios for sa
According to the scaling ratios for PGA, scaling ratios for PGA-normalized Sa, and non-linear decay exponents given by above statistics, the scaling ratios for Sa on site class I0, I1, II, III, and IV were proposed as following:
where the site class i = I0, I1, II, III, or IV; T was the period in second;
The scaling ratios for PGA, Sa (T = .30 s), Sa (T = 1.00 s), and Sa (T = 3.00 s) varying with
1) The non-linearities of scaling ratios for Sa varying with strong motion strength on site class I1 were imperceptibly indeed comparing with GB18306. One reason for this phenomenon was the consideration of non-linearity on site class I1 in this study, and another possible reason was that the non-linear decay exponents for soil/rock Sa were not identical to the non-linear decay exponents for surface/borehole Sa.
2) The scaling ratios for Sa on site class II, the scaling ratios for Sa at T < .4 s on site class III when
3) The scaling ratios for Sa at .4 s < T < 2.0 s on site class III, and the scaling ratios for Sa at .6 s < T < 2.0 s on site class IV were smaller than or comparable with GB18306, while the scaling ratios for Sa at T > 2.0 s on site class III and IV were obviously larger than GB18306.
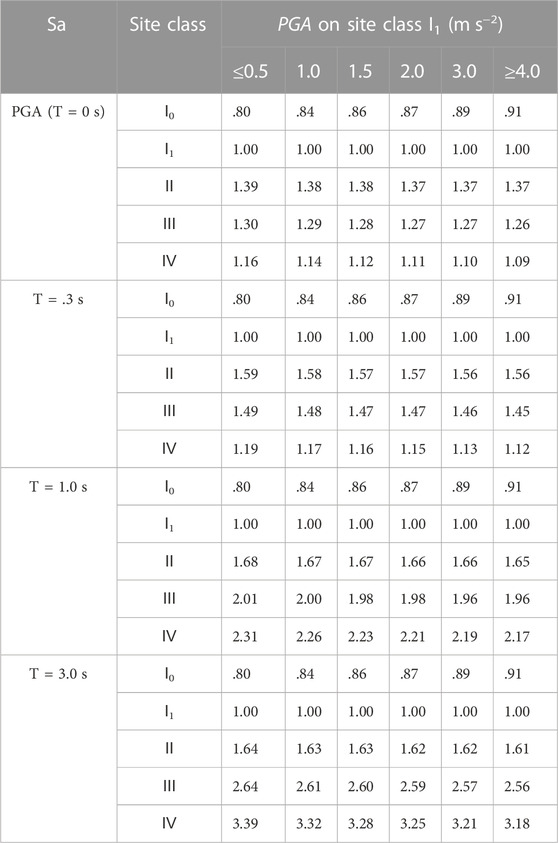
TABLE 5. Scaling ratios for Sa due to site conditions varying with PGA on site class I1.
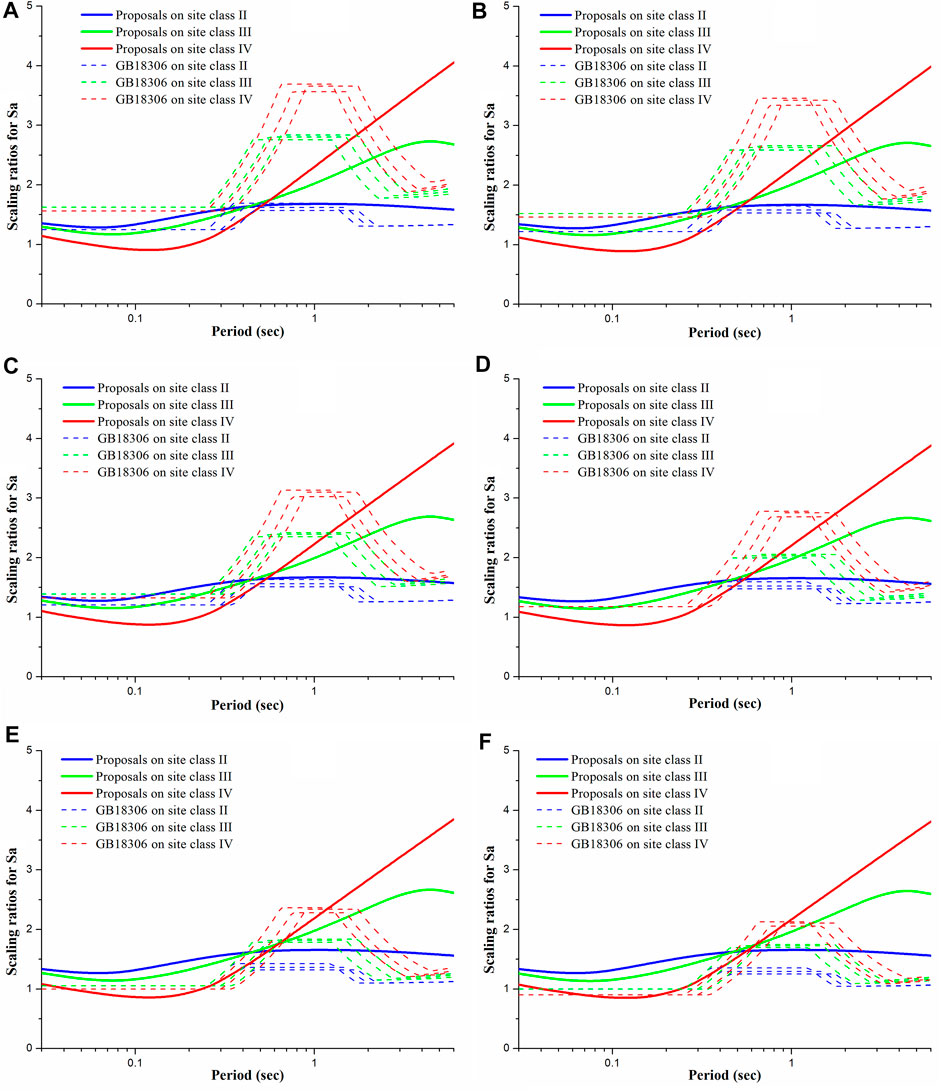
FIGURE 10. Scaling ratios for Sa on site class II, III, and IV when PGA on site class I1 (A) ≤.5 m s−2, (B) = 1.0 m s−2, (C) = 1.5 m s−2 (D) = 2.0 m s−2, (E) = 3.0 m s−2, and (F) ≥4.0 m s−2.
To sum up, the non-linearity of scaling ratios for Sa on site class I1 was non-ignorable, and the proposed scaling ratios on site class II were comparable with GB18306, meanwhile the proposed scaling ratios on site class III and IV were smaller at medium periods .5 s < T < 2.0 s and larger at long periods T > 2.0 s than GB18306.
7 Conclusion and discussions
Based on numerical simulations of 1,138 borehole models in China, 3,584 strong motion records in NGA West two database, and about 140 thousand borehole observation data recorded by KiK-net, a novel approach assembled by scaling ratios for PGA, scaling ratios for PGA-normalized Sa, and non-linear decay exponents, was proposed.
1) The scaling ratios for PGA derived from numerical simulations of borehole models when motions were not so strong were acceptable, but one-dimensional equivalent linearization method might overestimate the non-linearity of soil when motions were strong enough for engineering significance.
2) The scaling ratios for PGA-normalized Sa derived from the strong motion records in NGA-West two database could reflect the average impact of site conditions on spectral compositions, but they would yield great errors in a particular earthquake on an actual site.
3) The non-linear decay exponents of surface/borehole Sa were negatively correlated with site classes, and the non-linear decay exponent on site class I1 was non-ignorable.
4) The scaling ratios for Sa proposed in this study offered an option to determine the impact on Sa caused by seismic site effect on each site class under site condition classifications in China.
Further improvements were also needed to improve the reliability and applicability of the proposed scaling ratios for Sa.
1) The influences of the source distance and the strong motion strength on PGA-normalized Sa needed more considerations.
2) The strong motions on site class I0 and on site class I1 should be distinguished in detail, especially in the determination of non-linear decay exponents. Ignorance of non-linearity on site class I1 might significantly affect the non-linearity of scaling ratios for Sa on all the site classes, which was a common problem in recent studies and current regulations.
3) The non-linear decay exponents of soil/rock Sa needed to be built considering the inconsistency between the soil/rock Sa and surface/borehole Sa.
4) Additionally, scaling ratios on site class IV needed to be paid more attentions because of limited sample capacity.
Data availability statement
The original contributions presented in the study are included in the article/Supplementary Material, further inquiries can be directed to the corresponding author.
Author contributions
All authors listed have made a contribution to conception and design of the study, and approved it for publication. Scaling ratios for PGA: XL. Non-linear decay exponents: YD. Scaling ratios for PGA-normalized Sa and other sections: YW. Writing-original Draft: YW. Writing-reviewing and editing: YW and XL. All authors contributed to manuscript revision, read, and approved the submitted version.
Funding
This study is supported by the National Key R&D Program of China (2022YFC3003503) and National Natural Science Foundation of China (52192675).
Acknowledgments
We acknowledge with thanks the strong motion data from KiK-net of National Research Institute for Earth Science and Disaster Resilience (NIED), and from NGA-West2 database of the Pacific Earthquake Engineering Research Center (PEER). We also owed sincere thanks to two reviewers for their constructive comments optimizing our statistical results.
Conflict of interest
The authors declare that the research was conducted in the absence of any commercial or financial relationships that could be construed as a potential conflict of interest.
Publisher’s note
All claims expressed in this article are solely those of the authors and do not necessarily represent those of their affiliated organizations, or those of the publisher, the editors and the reviewers. Any product that may be evaluated in this article, or claim that may be made by its manufacturer, is not guaranteed or endorsed by the publisher.
Supplementary material
The Supplementary Material for this article can be found online at: https://www.frontiersin.org/articles/10.3389/feart.2022.1112202/full#supplementary-material
References
Aki, K. (1993). Local site effects on weak and strong ground motion. Tectonophysics 218 (1-3), 93–111. doi:10.1016/0040-1951(93)90262-i
Bian, F. D., and Ding, H. P. (2017). Estimation and application of depth correction factor for site coefficient based on KiK-net strong-motion seismograph network. J. Suzhou Univ. Sci. Technol. Eng. Technol. 30 (4), 1456–1519.
Bo, J. S., Li, Q., Qi, W. H., Yuting, W., Xinlong, Z., et al. (2021). Research progress and discussion of site condition effect on ground motion and earthquake damage. J. Jilin Univ. (Earth Sci. Ed. 51 (5), 1295–1305.
Bo, J. S. (1998). Site classification and design response spectrum adjustment method. Harbin, China, Earthquake Administration: Institute of Engineering Mechanics.
Boore, D. M. (2004). Estimating s(30) (or NEHRP site classes) from shallow velocity models (depths < 30 m). Bull. Seismol. Soc. Am. 94 (2), 591–597. doi:10.1785/0120030105
Cui, H., and Ding, H. P. (2016). Estimation of site coefficient based on KiK-net strong-motion seismograph network. Earthq. Eng. Eng. Vib. 36 (4), 147–152.
Ding, Y., Wang, Y. S., Wang, N., et al. (2021). Study on nonlinear statistical characteristics of surface/downhole response spectrum ratio and influencing factors. Technol. Earthq. Disaster Prev. 16 (2), 362–370.
General Administration of Quality Supervision, Inspection and Quarantine of the People's republic of China (2016). Seismic ground motion parameters zonation map of China (Beijing, China: China Quality and Standards Publishing & Media Co.,Ltd), GB18306.
Geng, S. W. (2005). Strong ground motion input parameter for seismic design. Harbin, China, Earthquake Administration: Institute of Engineering Mechanics, 44–69.
Guo, F., Wu, D. M., Xu, G. F., et al. (2011). Effect of site condition on the maximum value of seismic design response spectrum. J. Civ. Eng. Manag. 28 (1), 69–72.
Hu, Y. X., Sun, P. S., Zhang, Z. Y., et al. (1980). Effects of site conditions on earthquake damage and ground motion. Earthq. Eng. Eng. Vib. 0 (0), 34–41.
Lan, J. Y., Lv, Y. J., and Liu, H. S. (2012). Influence of intensity and frequency of ground motion on site earthquake response. Technol. Earthq. Disaster Prev. 7 (1), 37–45.
Li, X. J. (2013). Adjustment of seismic ground motion parameters considering site effects in seismic zonation map. Chin. J. Geotechnical Eng. 35 (S2), 21–29.
Li, X. J., Li, N., Wang, J. K., et al. (2021). Difference between horizontal-to-vertical spectral ratio and surface-to-bedrock spectral ratio of strong-motion and modified horizontal-to-vertical spectral ratio method. Technol. Earthq. Disaster Prev. 16 (1), 81–90.
Li, X. J., Pen, Q., and Liu, W. Z. (2001). Consideration of site effects for determination of design earthquake ground motion parameters. Word Inf. Earthq. Eng. 17 (4), 34–41.
Li, X. J., and Peng, Q. (2001). Calculation and analysis of earthquake ground motion parameters for different site categories. Earthq. Eng. Eng. Vib. 21 (1), 29–36.
Liu, Z., Shen, J. W., Shi, S. Z., et al. (2009). Soft soil amplification of peak ground acceleration. J. Tongji Univ. Nat. Sci. 37 (5), 607–611.
Lü, H. S., and Zhao, F. X. (2007). Site coefficients suitable to China site category. Acta Seismol. Sin. 29 (1), 71–79. doi:10.1007/s11589-007-0071-6
Lu, Y. J., Peng, Y. J., Lan, J. Y., et al. (2008). Some key problems about site effects on seismic ground motion parameters. Technol. Earthq. Disaster Prev. 3 (2), 126–135.
Ministry of Housing and Urban-Rural Development of the People's Republic of China, General Administration of Quality Supervision, Inspection and Quarantine of the People's Republic of China, (2010). Code for seismic design of buildings. Beijing, China: China Architecture & Building Press, GB50011, 18–35.
Seed, H. B., and Idriss, I. M. (1969). Influence of soil conditions on ground motions during earthquakes. J. Soil Mech. Found. Div. 95 (1), 99–137. doi:10.1061/jsfeaq.0001260
Stewart, J. P., and Seyhan, E. (2013). Semi-empirical nonlinear site amplification and its application in NEHRP site factors. Oakland, CA, USA: University of California.
Wang, Y., Li, X., Li, M., et al. (2022). Study on scaling ratios for spectral accelerations of ground motion due to site conditions. Technol. Earthq. Disaster Prev. 17 (3), 464–472.
Keywords: seismic site effect, local site condition, site scaling ratio, near-surface geology, spectral acceleration, strong motion record, NGA West 2 database, KiK-net
Citation: Wang Y, Ding Y and Li X (2023) Scaling ratios for spectral accelerations caused by seismic site effect under site condition classifications in China. Front. Earth Sci. 10:1112202. doi: 10.3389/feart.2022.1112202
Received: 30 November 2022; Accepted: 20 December 2022;
Published: 10 January 2023.
Edited by:
Yefei Ren, Institute of Engineering Mechanics, China Earthquake Administration, ChinaReviewed by:
Haiping Ding, Suzhou University of Science and Technology, ChinaZhinan Xie, Institute of Engineering Mechanics, China Earthquake Administration, China
Copyright © 2023 Wang, Ding and Li. This is an open-access article distributed under the terms of the Creative Commons Attribution License (CC BY). The use, distribution or reproduction in other forums is permitted, provided the original author(s) and the copyright owner(s) are credited and that the original publication in this journal is cited, in accordance with accepted academic practice. No use, distribution or reproduction is permitted which does not comply with these terms.
*Correspondence: Yushi Wang, d2FuZ3l1c2hpQGJqdXQuZWR1LmNu