- 1School of Economics and Management, Taiyuan Normal University, Jinzhong, China
- 2School of Geography and Tourism, Chongqing Normal University, Chongqing, China
- 3Key Laboratory of Desert and Desertification, Northwest Institute of Eco-Environment and Resources, Chinese Academy of Sciences, Lanzhou, China
- 4School of Geography Science, Taiyuan Normal University, Jinzhong, China
Introduction: Yardang stratum is the basic material unit of yardang landforms. Due to their protracted age and complex sedimentary structure, formative yardang stratum mechanisms remain poorly understood. Color, being one of the most intuitive, easily accessible, and important lithological indicators, can be used to identify yardang strata sedimentary environments. However, the lack of quantitative analysis and systematic research have limited how chromatic environmental proxies can be extracted and interpreted.
Materials and methods: The Dunhuang Yardang National Geopark was selected for this experiment. Based on chromaticity, grain-size, chemical element, organic matter, and carbonate content measurements of yardang strata sediment samples, this study used correlation analysis and chromaticity proxy extraction to quantitatively characterize associated color changes, controlling factors, and sedimentary environments.
Results and discussion: Results found significant cyclic changes in chromaticity parameter curves were observed in the profiles, which is likely indicative of a dry/wet evolutionary process that occurred during different stages of the yardang sedimentary environment. Organic matter content was the main factor affecting changes in brightness, while iron oxide content directly affected yardang sediment redness and yellowness values. Due to its low value, effects of carbonate content on brightness were obscured. The grain-size characteristics indirectly affect the brightness value through the content of quartz, feldspar and organic matter. Moreover, based on modern analogy method, the brightness and redness values are proved to be effective proxies for distinguishing the yardang sedimentary environment. Accordingly, it is concluded that the sedimentary environment of Dunhuang yardang landforms is composed of sedimentation that derived from lacustrine, aeolian, and alluvial environments, and that the chromaticity parameter range and characteristic color for sedimentary environments are extracted and quantified. Findings from this study not only rectify the lack of quantitative research on yardang sediment color theory but also provide an important theoretical basis for identifying sedimentary environments in the field.
1 Introduction
Yardang is a type of aeolian erosion driven geomorphic feature distributed throughout extreme arid and semiarid regions. This type of landform develops on soft sediment, such as the earthy deposits of river and lakebeds, and its morphology is dominated by streamlines or long ridges (Niu, 2011; Pelletier, 2018). Yardang strata (i.e., the yardang sedimentary layer) consist of sedimentary rock layers that have formed during different geological periods. In this study, the term “yardang strata” mainly refers to the sedimentary layers exposed on the surface. Yardang strata have an obvious sequential structure, consisting of various numbers of sedimentary layers that differ considerably in thickness. Its sedimentary structure is characterized by the alternating deposition of hard and cemented aqueous sedimentary layers and soft aeolian sedimentary layers (Dong et al., 2011; Dong et al., 2012; Lin et al., 2017; Zhao et al., 2018). In China, large areas of yardang landforms are mainly distributed in Lop Nur, the Hami District, the middle and lower reaches of the Shule River, Qaidam Basin, and the Ulangab League of Inner Mongolia. Among them, the Dunhuang Yardang National Geopark is large in scale and concentrated in distribution, with the distribution of yardang in different development stages and forms, rich sedimentary facies types and obvious facies sequence structure characteristics, where the most typical yardang landforms are found.
Color has long been considered an important lithological indicator. Most relevant studies have qualitatively and quantitatively analyzed color changes in yardang sediment (Niu, 2011; Dong et al., 2012). However, human color perception varies and opinions differ in describing yardang sediment color, and no consensus can therefore be drawn. The four prevailing yardang sediment color types are as follows: yellow (i.e., earthy yellow and grayish yellow), brown (i.e., light brown, tawny, and reddish brown), green (i.e., gray-green and light green), and red (i.e., brown red and light red) (Xia, 1987; Zheng et al., 2002; Qu et al., 2004; Yang, 2009; Dong et al., 2011; Niu, 2011). Moreover, sediment color strongly correlates to environmental condition, which can reflect changes in temperature and humidity conditions throughout geological history (Liu et al., 2015). Therefore, sediment color can be used as an environmental indicator to reconstruct sedimentary environments during different geological periods. Because qualitative descriptions on yardang sediment color diversity cannot effectively be used as environmental indices, a comprehensive quantitative analysis is urgently needed. Additionally, yardang sediment color alternates between dark and light between strata, indicating potential cyclic change during yardang sedimentary environment processes. Although the significance of these color changes in sedimentary environments and associated evolutionary processes are important, no systematic research on this issue has yet been conducted.
CIELAB color space variables (Robertson, 1977) are currently the main color description and measurement system applied, which can quantitatively represent color changes. The system uses brightness, redness, and yellowness to describe any uniform and continuous color space, providing an effective method for the quantitative analysis of yardang sediment color. Chromaticity, as an effective paleoenvironmental proxy, has been widely used in studies on loess, aeolian, and lacustrine sediment (Yang and Ding, 2003; Du et al., 2019; Liu et al., 2019). However, even though it is an effective and recognized quantitative analysis method, it has yet to be systematically applied to yardang strata research.
Accordingly, this study investigates the color changes, controlling factors, chromaticity parameter range and characteristic color of yardang sediments based on chroma, grain-size, chemical element, organic matter content, and carbonate content analysis: 1) to understand the chromaticity characteristics of yardang sediment; 2) to screen the controlling factors of color change in yardang sediments and interpret their influencing process; and 3) to extract the chromaticity proxies for yardang sedimentary environment and associated discriminant threshold.
2 Regional setting
The Dunhuang Yardang National Geopark (90°0′0″–93°13′30″ E, 40°25′36″–40°33′10″N) covers an area of 224 km2, located in the western terminus of the Hexi Corridor, approximately 180 km northwest of Dunhuang City. This geopark is bordered by the Xihu Wetland National Nature Reserve to the south, the Kumtag Desert to the southwest, the Aqik Valley and Lop Nur to the west, the Sanlongsha dune field to the northwest, and floodplains to the northeast (Figure 1). The region has a warm temperate continental drought and desert climate, characterized by arid conditions, minimal precipitation, strong evaporation, lengthy sunshine hours, and considerable diurnal and nocturnal temperature differences. Annual average precipitation and temperature in this region are approximately 14.99 mm and 11.5°C, respectively (weather data obtained from Ruoqiang County) (Zheng et al., 2002; Niu et al., 2017). The region’s annual average wind speed is approximately 3.11 m s⁻1, where wind mainly derives from northerly (NNW–NNE) and easterly (NE–E) directions (Niu, 2014). Strong windy days and dust storms occur in this region.
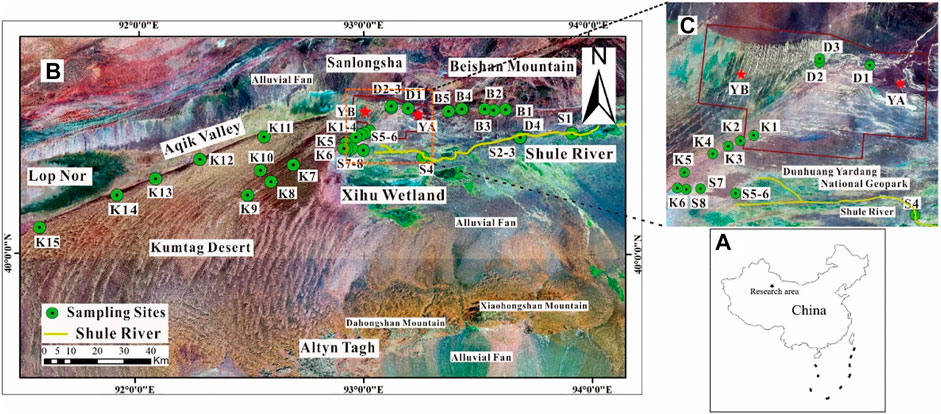
FIGURE 1. (A) Map of the Dunhuang yardang study area at the western terminus of the Hexi Corridor; (B) The physical environment surrounding yardang landforms and the location of sampling points, where the Dunhuang Yardang National Geopark is outlined in red; (C) detailed view of the Dunhuang Yardang National Geopark and its physical environment.
3 Material and methods
3.1 Stratum profile and sampling
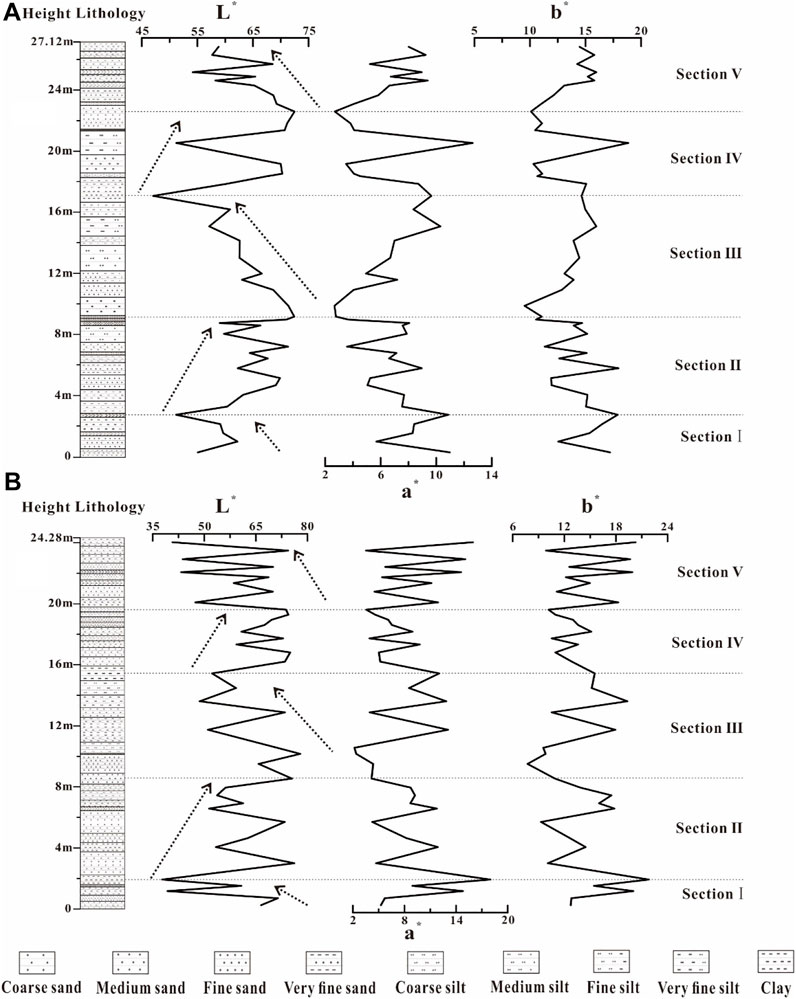
The study area is located within the intermountain basin between Beishan Mountain and Altyn-Tagh, which is connected to the Beishan alluvial fan. The topography descends in elevation from east to west, and geomorphological patterns within these two cardinal directions differ considerably. Accordingly, two yardang profiles were selected for this investigation, one in the east (YA) and one in the west (YB), to analyze their sedimentary environments and spatial differences. The composition of the YA stratum profile (40°29′26″ N, 93°14′28″E; 842 m elevation) is comprised of 22 silt strata, 14 fine sand strata, 6 medium-sized sand strata, and 2 clay strata, forming a sedimentary structure, the length, width, and height of which are approximately 117, 69, and 27.12 m, respectively (Figure 2A). The composition of the YB stratum profile (40°30′3.96″ N, 93°00′2.94″E; 811 m elevation) is comprised of 16 silt strata, 10 fine sand strata, 11 medium-sized sand strata, and 3 clay strata, the length, width, and height of which are approximately 75, 43, and 24.28 m, respectively (Figure 2B).
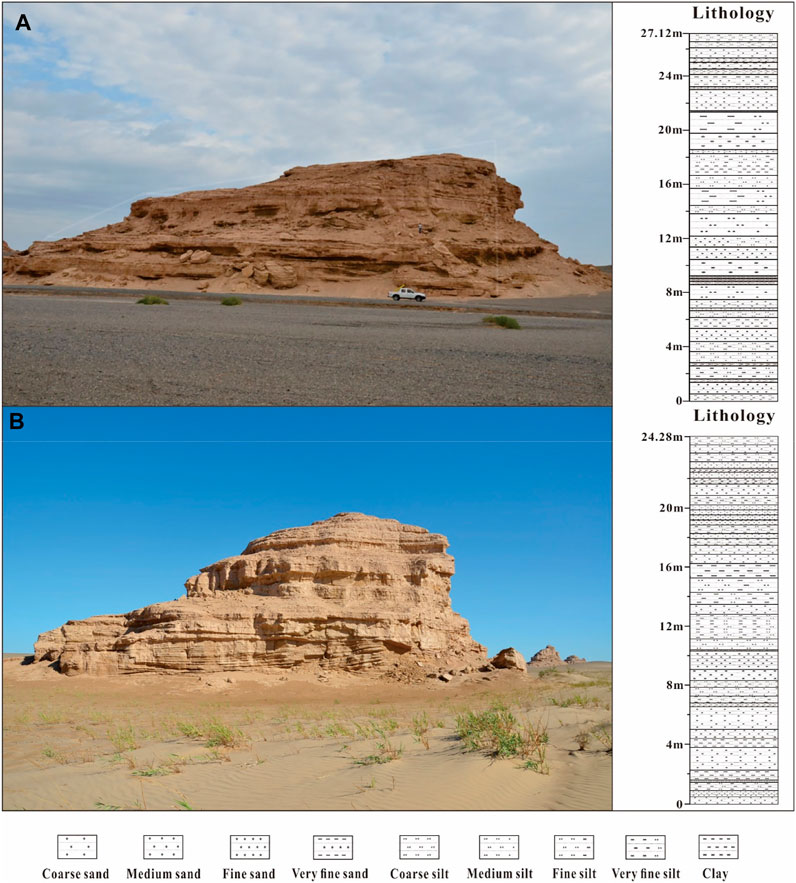
FIGURE 2. Photographic images and lithostratigraphic units of the YA (A) and YB (B) strata profiles.
A total of 84 samples were collected from the strata of yardang YA (44 samples) and YB (40 samples), employing the stratified top to bottom sampling principle. Each sample was a well-proportioned mixture of samples obtained from three different locations (representing one lithological unit). At the same time, we also collected 32 surface samples (0–5 cm) from four different geomorphic units based on their spatial distributions: K1–K15 samples were collected from the interdune corridor of linear dunes in the northeast of the Kumtag Desert and represent typical aeolian sediments; S1–S8 samples were collected from the Shule River, namely, from Xiquan Lake in the southwest of the Hecang Ruins to the seasonal pond at the terminal of the Shule River; S2–S5 samples comprised of dry riverbed sediment, while the remaining samples contained higher moisture levels during collection; B1–B5 samples were collected from the alluvial fan of Beishan Mountain, representing a typical alluvial environment; D1–D4 samples were collected from water-logged land formed by seasonal precipitation in the study area, representing a hydrostatic sedimentary environment.
3.2 Analytical methods
Physical and chemical characteristics analysis, correlational analysis, and an analogical model were the primary research methods used in this study. The way the thesis develops is shown as follows: first of all, the physical and chemical characteristics of yardang sediments and modern surface sediments around the study area were analyzed, including chromaticity, grain-size, geochemical elements, carbonate content, and total organic carbon content; Secondly, combined with the former research results, on the basis of determining the potential influencing factors, the correlation analysis was used to determine whether any relationship exists between chromaticity parameters and potential influencing factors and the associated correlation direction and degree; Thirdly, this study combined qualitative descriptions and quantitative analysis to effectively identify controlling factors of yardang sediment color change; Finally, based on the modern analogy method, selected different typical sedimentary environmental material around the study area as known parameters, and then effectively discriminated the yardang sedimentary environment according to the parameter fitting degree.
Chromaticity was measured using the high-precision JZ-600 colorimeter [applying a D65 standard light source (i.e., the average midday luminosity of western and northern Europe) with a standard deviation of ∆E*ab ≤ .06] at the Environmental Magnetism Laboratory, Northwest Institute of Eco-Environment and Resources, Chinese Academy of Sciences. Samples were first dried and ground and then sifted them through a 200-mesh screen. Following this, powdered samples (4 g) were pressed into 32 mm diameter pellets using the pressed powder pellet technique. After the colorimeter was calibrated for whiteness with the standard color plate, the pellets were placed on a white plate to obtain measurements. For testing, the background light source was kept constant, the viewing field was set to 10°, and the measuring aperture used was 8 mm. Measurements were replicated three times and results were averaged. Estimated errors were <2%. CIELAB color space variables were used to characterize chromaticity parameters.
Grain-size analysis was conducted at the Key Laboratory of Western China’s Environmental Systems, Lanzhou University, Gansu Province, China. Dry samples were pretreated with 30% hydrogen peroxide (H2O2) to remove organic matter and soluble salts, washed with 10% hydrogen chloride (HCL) to remove carbonates, and then rinsed with deionized (DI) water and dispersed in 10 mL of a .05 mol·l−1 sodium hexametaphosphate (NaPO3)6 mixture on an ultrasonic vibrator for 10 min. Using the Malvern Mastersizer laser “grain-size” particle size analyzer, grain-size distribution data were determined to be between .02 and 2000 μm, which were assigned to 100 size classes. Grain-size parameters were calculated according to reference formulas (Folk and Ward, 1957).
This study determined geochemical elements at the Key Laboratory of Desert and Desertification, Northwest Institute of Eco-Environment and Resources, Chinese Academy of Sciences. Samples were first crushed to <75 μm using a multipurpose grinder and then dried in an oven at 105°C. Following this, 4 g of the dry powder material was pressed into 32 mm diameter pellets using 30 t pressure as recommended by the pressed powder pellet technique. Pellets were measured using a wavelength dispersive X-ray fluorescence spectrometer (AXIOS, PANalytical B.V. the Netherlands) with a Super Sharp Tube (SST) using a rhodium (Rh) anose (Rh-anode) filter at 4.0 kW, 60 kW, and 160 mA, while a 75 μ UHT Be end window was used for elemental analysis. SuperQ (version 5) was used for analysis. The estimated error was <5%.
The gas method was used to analyze calcium carbonate (CaCO3) content, employing a Bascomb calcimeter (Bascomb, 1961) at the Environmental Magnetism Laboratory, Northwest Institute of Eco-Environment and Resources, Chinese Academy of Sciences. Measurements were replicated four times and results were averaged. Total organic carbon (TOC) content was measured using the potassium dichromate sulfuric acid oxygen titration method, based on data analysis from the National Standard Sample (GSS-2) of China, with an estimated error of <.2%.
4 Results and discussion
4.1 Chromaticity variation characteristics in yardang sediments
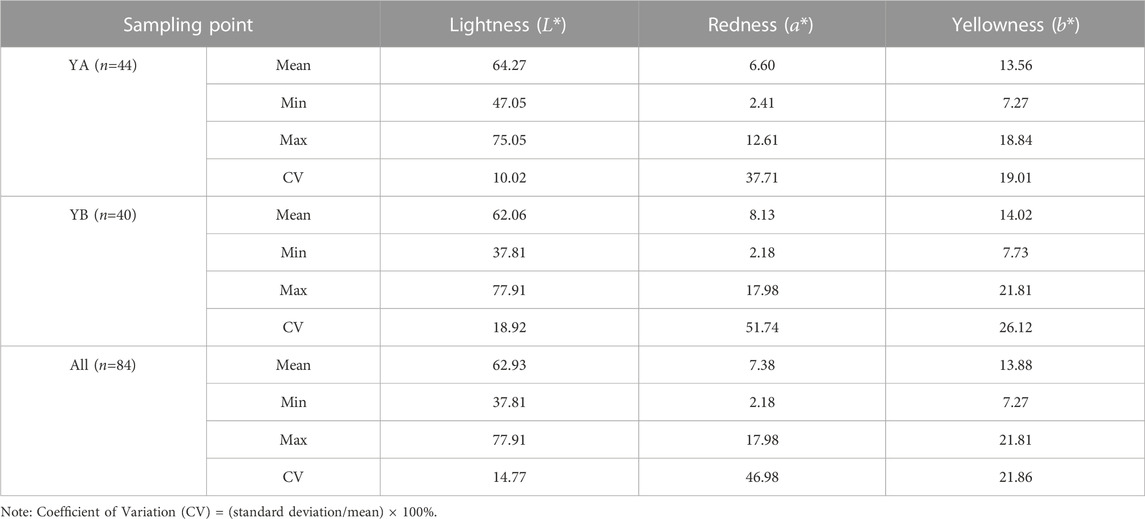
As shown through the appendices, color types of the YA profile can be summarized as yellow (faint-yellow and dark-yellow), brown (tawny and reddish-brown), green (gray-green and light gray-green), and gray sediment, of which tawny and gray-green sediment are dominant with thicker deposits. The color changes in the YB profile are mainly characterized by tawny, reddish-brown, and gray-green sediment, among which the alternate characteristics of the tawny and reddish-brown strata are significant with thicker sediment deposits. Generally, light- and dark-colored sediment appear in an alternating sequence in the profile, under different deposition thicknesses. Spatially, color types in the eastern yardang strata (YA) are richer, while color cycles in the western yardang strata (YB) are more distinctive Supplementary Appendix SA; Supplementary Appendix SB describe lithologic and color characteristics in the YA and YB profiles (where the tables represent the layers from top to bottom).
In CIELAB color space,
Redness values in profiles YA and YB ranged from 2.41–12.61 and 2.18–17.98 (6.60 and 8.13 averages), respectively, with CV values were 37.71% and 51.74% and the maximum values appeared at approximately 20 m and 2 m.
4.2 Controlling factors of yardang sediment chromaticity
Sediment color closely correlates to the sedimentary environment (Yang et al., 2001; Luo et al., 2007; Ma et al., 2021). Different deposition environments typically result in differing sedimentary material composition and chemical elements. Therefore, deposition components and chemical characteristics that are more sensitive to color are likely the main factors affecting sediment color. According to cumulative data from previous studies (Nagao and Nakashima, 1992; Yang et al., 2001; Tian et al., 2012; Du, et al., 2019; Liu et al., 2019), factors that influence sediment color mainly include grain-size distribution, organic matter content, carbonate content, and specific chemical components (i.e., iron oxide). Meanwhile, these influencing factors can also be used as effective environmental proxies, and their application has been successfully applied in lacustrine, loess, and aeolian research.
4.2.1 CIELAB color space (
Correlation analysis between
4.2.2 Control factor analysis
Previous studies have shown that brightness changes in loess are primarily associated with organic matter content, carbonate content, and iron oxides (Chen, J et al., 2002; Chen, Y et al., 2002; He et al., 2010; Liu et al., 2015), while organic matter content is the main influencing factor of aeolian sediment (Liu et al., 2019). The brightness of lacustrine sediment is positively correlated to carbonate content, while being less affected by changes in grain-size (Wu and Li, 2004; Du et al., 2019). Therefore, although the main controlling factors associated with changes in brightness differ among different sediment types, overall potential influencing factors include organic matter content, carbonate content, iron oxide content, and grain-size characteristics. Then, we will screen and extract the factors influencing the color of yardang sediments by correlation analysis.
In the Dunhuang yardang strata profiles,
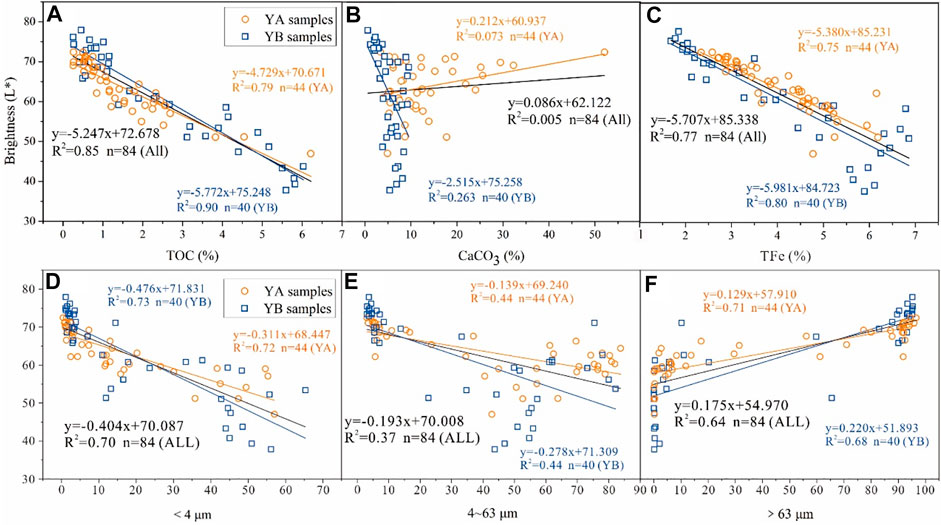
FIGURE 5. Correlation between
No correlation was observed between
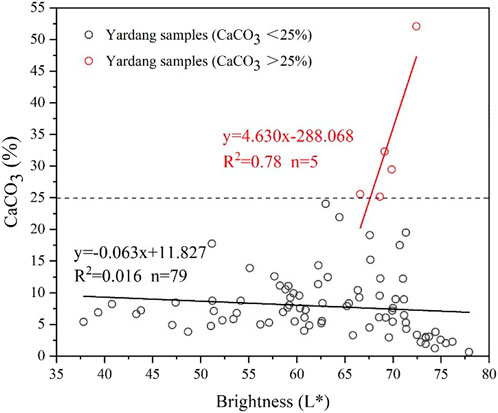
FIGURE 6. Correlation between brightness and carbonate content in yardang samples under different carbonate content levels.
Figure 5D shows the correlation analysis results between
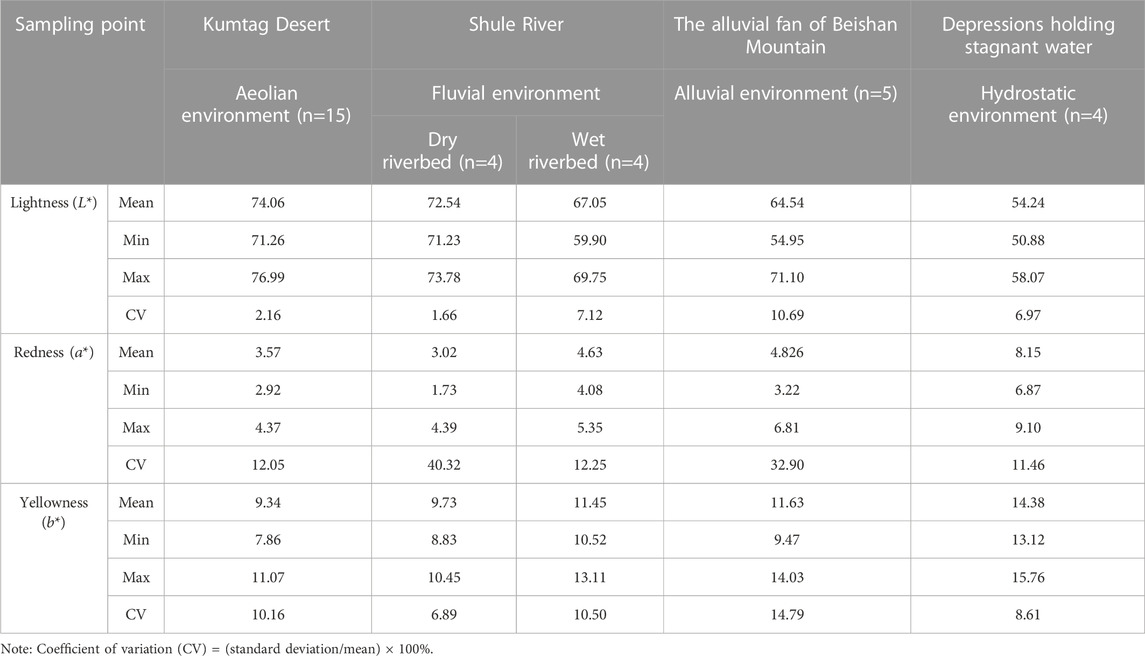
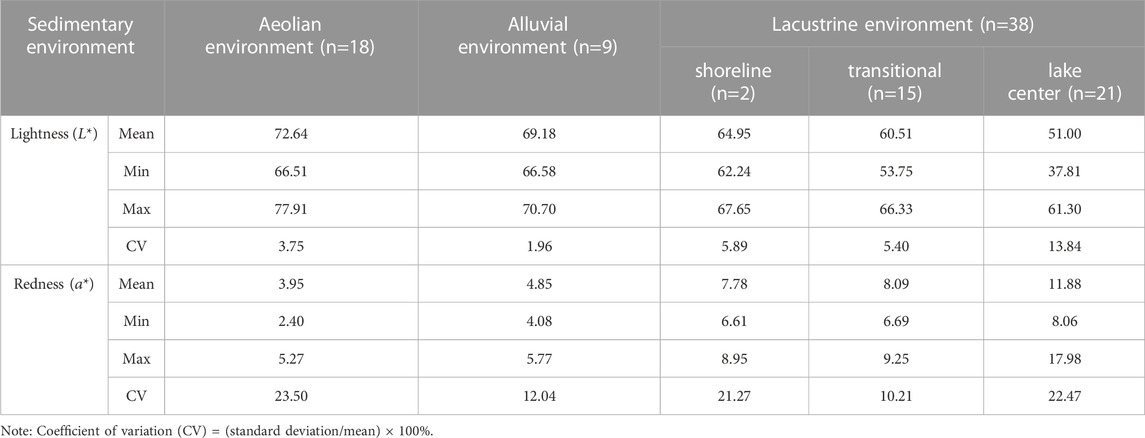
TABLE 2. L*, a*, and L* sediment values from typical sedimentary environments surrounding yardang landforms.
Based on the above findings, we further verified the relationship between iron oxide content and changes in redness and yellowness, showing that the correlation of both
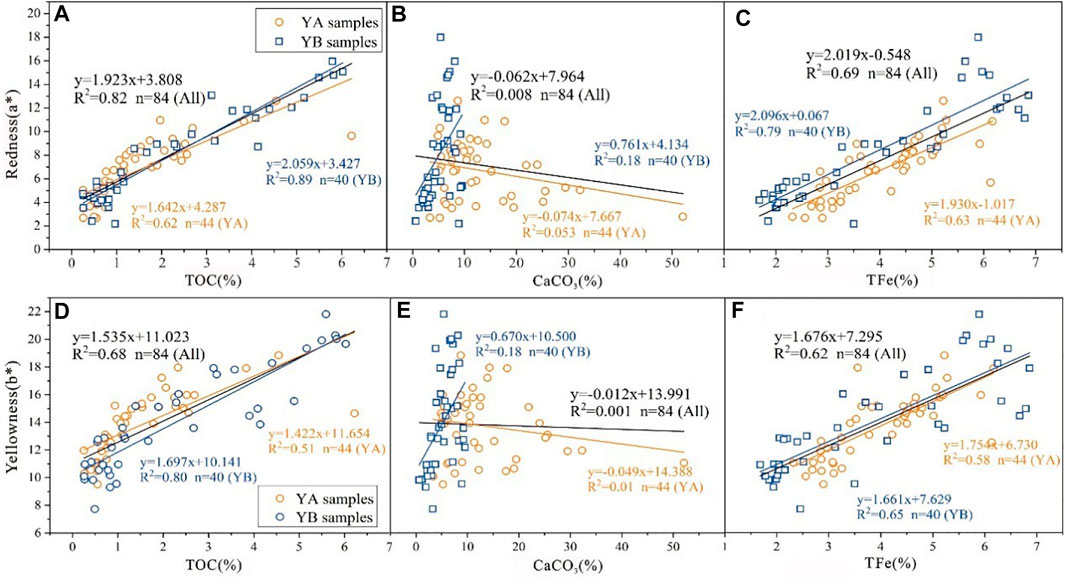
FIGURE 7. Correlation between
Therefore, the main controlling factors that affect color changes in Dunhuang yardang sediment were organic matter, and iron oxide and carbonate content. Among these, organic matter content was the main influencing factor for changes in brightness, followed by iron oxide content. With an increase in organic matter and iron oxide content, sediment will darken, and vice versa. The carbonate content also contributes to brightness value variation; however, due to its low content, its role may be obscured by organic carbon content or other chromogenic minerals. Brightness indirectly correlated to the coarse and fine composition of sediment, while quartz, feldspar, and organic matter content were used as carriers. Iron oxide content, as the main controlling factor for changes in redness and yellowness values in yardang sediment, significantly and positively correlated to
4.3 Implications for sedimentary environments
4.3.1 Discrimination of sedimentary environment
Relevant studies have shown that chromaticity changes are indicative of environmental change to a certain extent, which researchers have used as an effective proxy indicator in the study of paleoenvironmental changes, having been widely used in aeolian (Liu et al., 2019), loess (Kong et al., 2017), lacustrine (Du et al., 2021), and marine sediment (Yang et al., 2018). Where the
According to chromaticity measurement values in contemporary surface sediment (shown in Table 2), the variability of sediment chromaticity values across environments was significant. The chromaticity values exhibit obvious regular changes between dry and wet environmental conditions. Where the highest
According to research results on chromaticity characteristics in Lop Nur sediment within the study area (Luo et al., 2007),
Scatter plots between brightness and redness (Figure 8) showed that yardang samples were sequentially distributed along brightness values (from high to low) and redness values (from low to high). According to the regular distribution and clustering characteristics of the scattered points, we introduced the hierarchical clustering method to classify the yardang samples. The hierarchical clustering analysis uses the average linkage as the linkage method between groups, and the city-block distance is used to quantify the similarity among scatter plots. The number of clusters is estimated through the change in agglomeration coefficient with the number of clusters, and a “knee” is applied to look for the largest magnitude difference between two adjacent points of the change in the agglomeration coefficient, which indicate the optimum number of clusters. The resulted of cluster analysis are shown in Figure 8, where YA samples were divided into four clusters (Figures 8A, B), while YB samples consist of five clusters (Figures 8C, D), indicating the diversity of yardang sedimentary environment types. A comparison of the classification results of the two groups of yardang samples shows that they have great similarity, while YB is richer in terms of the number of clusters and distribution range (Figure 9). After the completion of sedimentary environment classification, the most urgent issue that remains to be resolved is distinguishing among the sedimentary environment types.
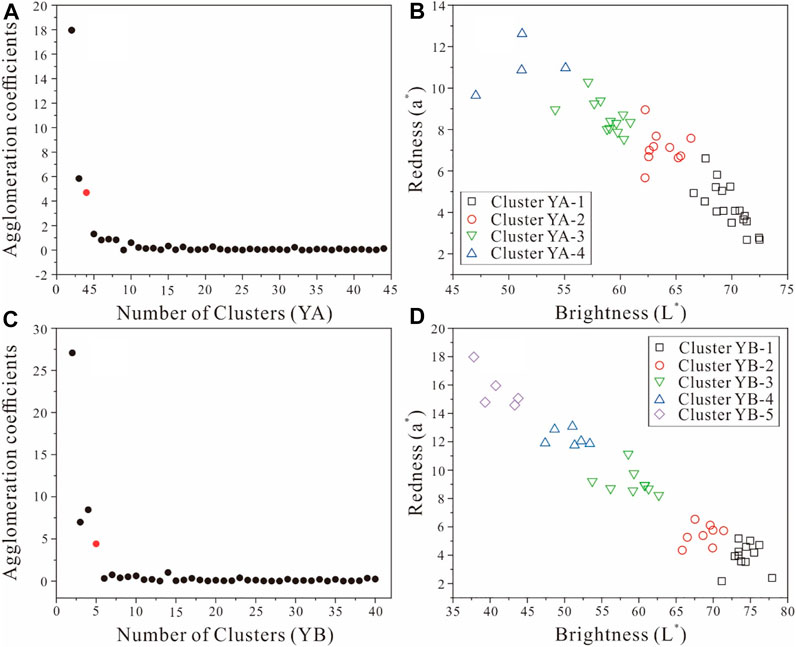
FIGURE 8. Changes in agglomeration coefficients versus the number of clusters (A,C); Clustering results of yardang YA (B) and YB (D) samples.
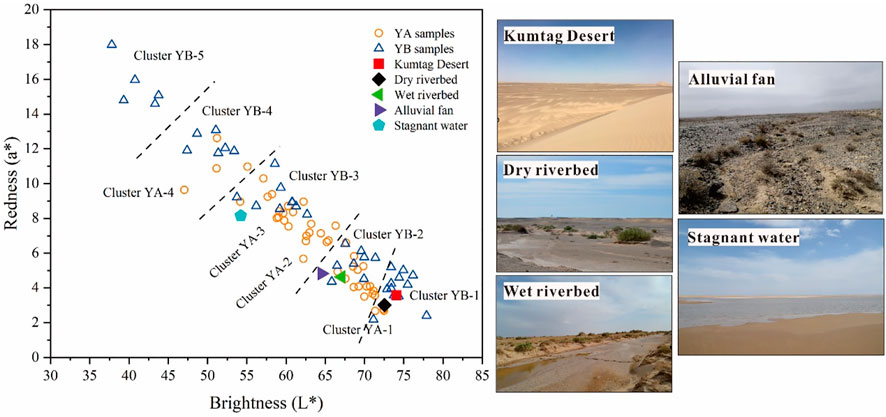
FIGURE 9. Comparison between clustering results of yardang samples and average values of contemporary surface samples (with their corresponding photographic images).
In this study, we use the contemporary analogical method to identify unknown sedimentary environments according to the know parameters. Typical environmental sediments on the surface were selected as known parameters and their average values were mapped to the yardang sample coordinate system (Figure 9), from which it follows that cluster YB1 coincided with the average sediment sampling points in the Kumtag Desert and the dry bed of the Shule River, which is indicative of an arid environment. In arid areas, dry riverbed material is an important desert sediment source, which is mainly influenced by aeolian processes. Therefore, the environment which formed these materials can be identified as an aeolian sedimentary environment. The cluster YB2 samples was corresponded to wet riverbed and alluvial fan material, indicating that these samples are alluvial sediment. The similarity between wet riverbed and alluvial fan material is mainly associated with seasonal precipitation. Surface vegetation in the study area is sparse, and surface runoff is mainly in the form of rivers that formed via seasonal precipitation, which made fluvial and alluvial sediment parameters similar. Cluster YA1 well overlaps with cluster YB1 and YB2, indicating its composition of aeolian and alluvial sediments. According to the degree of overlap of cluster YA2-3 and YB3 and the similarity to hydrostatic sediment, this environment type can be distinguished as a lacustrine sedimentary environment. Cluster YA4 and YB4 belong to the same sediment type, while cluster YB5 belongs to another type. Due to the lack of contemporary lake samples, these two sedimentary environments cannot be distinguished. However, the redness values from cluster YB3 to YB5 samples gradually increased, which suggested an increasing trend in the fine fraction content as per the association between redness and soil formation. Grain-size sediment composition in different regions and in different lakes differed significantly; however, the trend from the shoreline to the lake center was consistent. In other words, the fine fraction gradually increased. Therefore, it can be inferred that the cluster YB3-5 sample derived from a different sedimentary subtype of the lacustrine sedimentary environment, namely, located at different positions from the shoreline to the lake center. To conclude, the yardang depositional environment can be classified into three typical types: aeolian (YB1 and part of YA1), alluvial (YB2 and part of YA1), and lacustrine (YA2–4 and YB3-5, which represent different positions from the shoreline to the lake center).
4.3.2 Extraction of the characteristic color
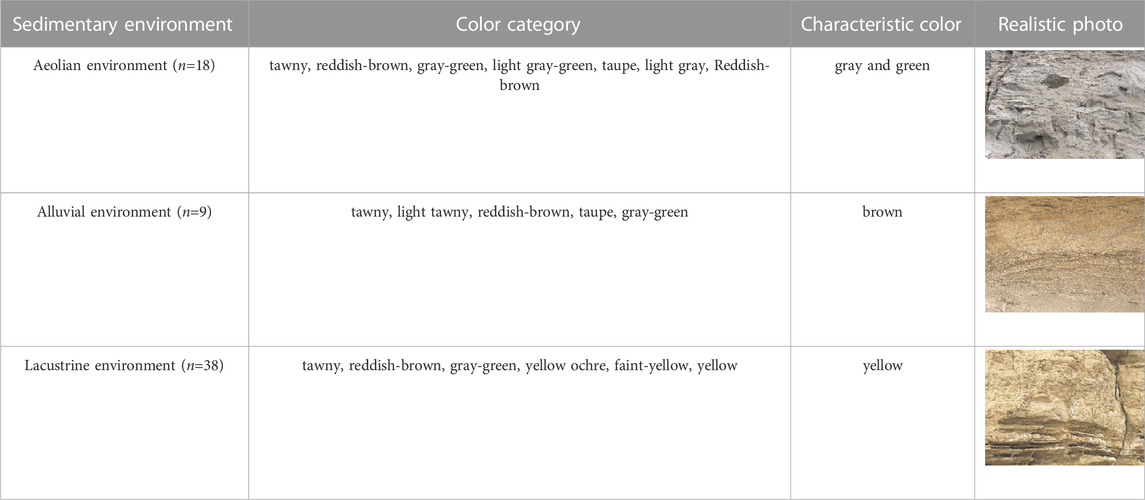
The above results are consistent with our previous quantitative reconstruction of a yardang sedimentary environment based on endmember modeling. On the whole, yardang strata were dominated by the lake environment, and aeolian and hydrogenic material was deposited at an alternating sequence (Liang et al., 2019). To further demonstrate the utility of chromaticity proxies as indicators of sedimentary environments, we conducted an in-depth analysis of chromaticity parameter values of various sedimentary environments in yardang strata. Based on discriminant results from the yardang sedimentary environment, we identified samples with endmember characteristics >70% as typical sediment types. A total of 18 samples of typical aeolian sediment, nine samples of typical alluvial sediment, 38 samples of typical lacustrine sediment, and 19 samples of mixed sediments were obtained after verification. Chromaticity parameter values of each sediment type are shown in Table 3. All typical sediment samples were mapped to the brightness and redness coordinate system (distributions shown in Figure 10A). By comparison, typical aeolian, alluvial, and lacustrine sediments corresponded to cluster 1, cluster 2, and cluster 3–5, respectively, which indicated that results were consistent. Additionally, the variation trend in lacustrine sediment from the shoreline to the transitional zone and then to the lake central was consistent with extrapolations based on chromaticity parameters. Thus, cluster four and five were distinguished as the sedimentary environment of the lake center, while cluster three was relatively mixed and difficult to identify; however, its main body was distinguished as the transitional sedimentary environment. In summary, brightness and redness are effective indicators to distinguish between aeolian, alluvial, and lacustrine sedimentary environments while not effective in identifying subtypes of lacustrine environments. Additionally, according to sample distribution characteristics, the distribution range of typical sediment types within different environments can be effectively divided by excluding “interference” samples. Aeolian samples were mainly concentrated in areas with high brightness and low redness values, with ranges of
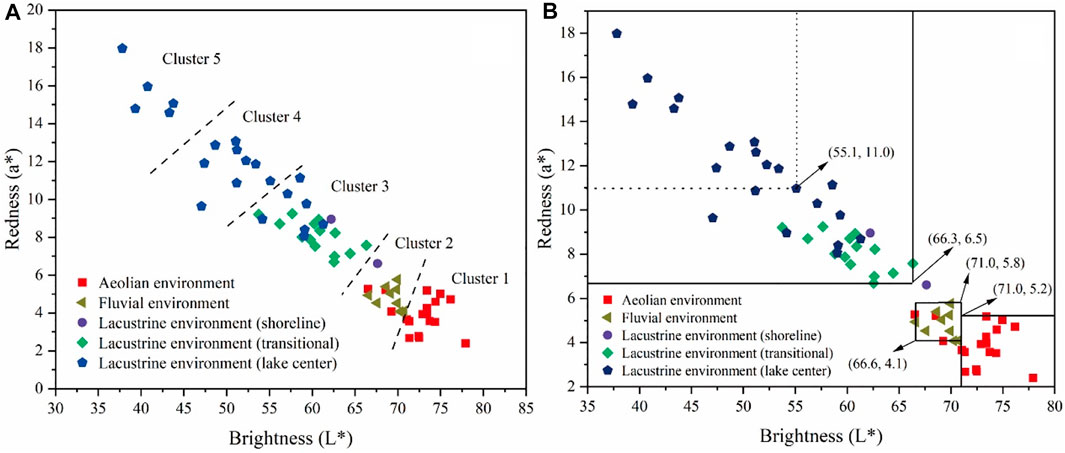
FIGURE 10. Comparison of discriminant results from a yardang sedimentary environment based on chromaticity and grain-size (A) and discriminant threshold analysis of a typical sedimentary environment (B).
Through the above studies, the chromaticity parameters were proved to be effective proxies for distinguishing the yardang sedimentary environment. However, how to establish the relationship between the color change and the sedimentary environment, and provide the basis for the field sediment environment discrimination, has become a desiderative problem to be studied. Therefore, we extracted the color characteristics of typical environmental sediments for summary analysis, and the results are shown in Table 4. The color of yardang sediments is mainly tawny and reddish-brown, which is similar on the whole. However, through comparative analysis, characteristic colors can be effectively extracted, as follows: aeolian sediments (gray and green), alluvial sediments (brown), and lacustrine sediments (yellow).
In summary, the brightness and redness can be used as effective proxies for distinguishing yardang sedimentary environments. At the same time, in combination with sediment environment reconstruction results based on grain-size parameters, the chromaticity parameter range and characteristic color of typical environmental sediment was quantified as follows: aeolian (gray and green,
5 Conclusion
Based on chromaticity analysis of yardang strata sediment and its correlation to grain-size, chemical elements, and organic matter and carbonate content, this study conducted a quantitative interpretation and reconstruction of chromaticity change characteristics, ascertained the main influencing factors, and described sedimentary chromaticity proxy characteristics of the Dunhuang yardang strata sediment environment.
We concluded that Dunhuang yardang sediment was mainly tawny, reddish-brown, and significant cyclic changes in chromaticity parameter curves were observed in the profiles, which is likely indicative of a dry/wet evolutionary process that occurred during different stages of the yardang sedimentary environment. Organic matter content was the main factor affecting changes in brightness, while iron oxide content directly affected yardang sediment redness and yellowness values. The carbonate content also contributes to brightness value variation; however, due to its low content, its role may be obscured by organic carbon content or other chromogenic minerals. Brightness indirectly correlated to the coarse and fine composition of sediment, while quartz, feldspar, and organic matter content were used as carriers. In addition, using brightness and redness as sedimentary environment discrimination proxies, the sedimentary environment of Dunhuang yardang landforms can be divided into aeolian, alluvial and lacustrine environments. Meanwhile, the chromaticity parameter range and characteristic color of typical environmental sediment was extracted and quantified as follows: aeolian (gray and green,
Findings from this study not only rectify the lack of quantitative analysis related to yardang sediment color but also provide a theoretical basis for studying the significance of yardang sediment color change in sedimentary environments.
Data availability statement
The original contributions presented in the study are included in the article/supplementary material, further inquiries can be directed to the corresponding author.
Author contributions
XL: Conceptualization; investigation; writing–original draft. XW: Conceptualization; investigation; conceived and designed the experiments. XZ: Conceptualization; review and editing. QN: Investigation; conceived and designed the experiments. JL: Review and editing.
Funding
This study was funded by the National Natural Science Foundation of China (NSFC) (Grant Nos. 42001007) and the scientific and technological innovation project of colleges and universities in Shanxi Province (Grant Nos. 2021L410).
Conflict of interest
The authors declare that the research was conducted in the absence of any commercial or financial relationships that could be construed as a potential conflict of interest.
Publisher’s note
All claims expressed in this article are solely those of the authors and do not necessarily represent those of their affiliated organizations, or those of the publisher, the editors and the reviewers. Any product that may be evaluated in this article, or claim that may be made by its manufacturer, is not guaranteed or endorsed by the publisher.
Supplementary material
The Supplementary Material for this article can be found online at: https://www.frontiersin.org/articles/10.3389/feart.2022.1107213/full#supplementary-material
References
Bai, Y. F., Wu, J. G., Qi, X., Pan, Q. M., Huang, J. H., Yang, D. L., et al. (2008). Primary production and rain use efficiency across a precipitation gradient on the Mongolia plateau. Ecology 89 (8), 2140–2153. doi:10.1890/07-0992.1
Bigham, J. M., Golden, D. C., Buol, S. W., Weed, S. B., and Bowen, L. H. (1978). Iron oxide mineralogy of well-drained ultisols and oxisols: II. Influence on color, surface area, and phosphate retention. Soil Sci. Soc. Am. J. 42 (5), 825–830. doi:10.2136/sssaj1978.03615995004200050034x
Chen, J., Ji, J. F., Balsam, W., Yang, C., Liu, L. W., and An, Z. S. (2002). Characterization of the Chinese loess–paleosol stratigraphy by whiteness measurement. Palaeogeogr. Palaeocl 183 (3-4), 287–297. doi:10.1016/s0031-0182(02)00246-8
Chen, Y., Chen, J., Ji, J. F., Liu, L. W., and Lu, H. Y. (2002). Whiteness intensity in Luochuan loess sequence (Shaanxi Province) and paleoclimatic implications. Geol. Rev. 48 (1), 38–43. doi:10.1080/12265080208422884
Dong, Z. B., Lv, P., Lu, J. F., Qian, G. Q., Zhang, Z. C., and Luo, W. Y. (2012). Geomorphology and origin of yardangs in the kumtagh desert, northwest China. Geomorphology 139, 145–154. doi:10.1016/j.geomorph.2011.10.012
Dong, Z. B., Su, Z. Z., Qian, G. Q., Luo, W. Y., Zhang, Z. C., and Wu, J. F. (2011). Aeolian Geomorphology of the kumtagh desert. Bejing: Science Press.
Du, D. D., Mughal, M. S., Blaise, D., and Zhang, C. J. (2019). Paleoclimatic changes reflected by diffuse reflectance spectroscopy since last glacial maximum from Selin Co lake sediments, central qinghai-Tibetan plateau. Arid. Land Geogr. 42 (3), 551. doi:10.12118/j.issn.1000-6060.2019.03.11
Du, L., Li, Z. W., Du, D. D., Li, W. B., Wang, Z. G., Ma, Z. Y., et al. (2021). Chromatic characteristics of sediments in zhifu loess section of yantai during the last interglacial period and its paleoenvironmental significance. Trop. Geogr. 41 (2), 423–430. doi:10.13284/j.cnki.rddl.003328
Folk, R. L., and Ward, W. C. (1957). Brazos River bar: A study in the significance of grain size parameters[J]. J. Sediment. Res. 27 (1), 3–26. doi:10.1306/74d70646-2b21-11d7-8648000102c1865d
Gao, F., Xu, Q. M., Yuan, G. B., Yang, J. L., Fan, Y. L., Liu, W. D., et al. (2017). Sedimentary environment evolution of borehole TZ02 in the northern Bohai Bay during late cenozoic. Quat. Sci. 37 (3), 667–678. doi:10.1192/j.issn.1001-7410.2017.03.21
He, L., Sun, Y. B., and An, Z. S. (2010). Changing color of Chinese loess: Controlling factors and paleoclimatic significances. Geochimica 39 (5), 447–455. doi:10.19700/j.0379-1726.2010.05.005
Kong, F. B., Xu, S. J., and Jia, G. J. (2017). Climatic and environmental evolution with multi-index records of the loess in the Focun, Zibo, Shandong Province. J. Earth Environ. 8, 407–418.
Liang, X. L., Niu, Q. H., Qu, J. J., Liu, B., Liu, B. L., Zhai, X. H., et al. (2019). Applying end-member modeling to extricate the sedimentary environment of yardang strata in the Dunhuang Yardang National Geopark, northwestern China. Catena 180, 238–251. doi:10.1016/j.catena.2019.04.029
Lin, Y., Mu, G., Qin, X., Zhao, X., Xu, B., Jia, H., et al. (2017). Erosion characteristics of yardangs at Loulan area, Xinjiang, China. J. Desert Res. 37 (1), 33–39. doi:10.7522/j.issn.1000-694X.2015.00214
Liu, F., Wang, H., Qin, Y. F., Ren, S. F., and Zheng, X. M. (2015). Chroma characteristics of the Zhoujiashan Xiashu loess profile in Nanjing and its significance. Mar Geol Quatern Geol 35 (5), 143–151. doi:10.16562/j.cnki.0256-1492.2015.05.017
Liu, L. Y., Lu, R. J., and Liu, X. K. (2019). Climate change in the mu us desert since holocene based on soil chromaticity. J. Desert Res. 39 (6), 83. doi:10.7522/j.issn.1000-694X.2018.00158
Luo, C., Yang, D., Peng, Z. C., Zhang, Z. F., Liu, W. G., He, J. F., et al. (2007). Climatic and environmental records in the sediment of the luobei billabong in lop-nur, xinjiang in recent 32ka. Quat. Sci. 27 (1), 114–121.
Ma, Y. F., Zhan, T., Yang, Y., Yang, H. L., Liu, J. F., Liang, Y. X., et al. (2021). The indication of chroma characteristics and its palaeoclimatic significance in the Tianhengshan (THS) core from the eastern part of the Northest China Plain to the evolution of Songnen paleo-lake. Acta Geol. Sin. 95 (11), 3519–3531. doi:10.3969/j.issn.0001-5717.2021.11.024
Miao, Y. F., Yang, S. L., Zhuo, S. X., and Sun, A. J. (2013). Relationship between the color of surface sediments and precipitation in arid Northwest China. Mar Geol Quatern Geol 33 (4), 77–85. doi:10.3724/sp.j.1140.2013.04077
Nagao, S. Y., and Nakashima, S. (1992). The factors controlling vertical color variations of North Atlantic Madeira Abyssal Plain sediments. Mar. Geol. 109 (1-2), 83–94. doi:10.1016/0025-3227(92)90222-4
Niu, Q. H. (2011). Formation and evolution process of yardang landforms a case study in Dunhuang yardang national geo-park. Lanzhou, Gansu, China: Chinese Academy of Sciences. Cold and Arid Regions Environmental and Engineering Research Institute(doctoral dissertation).
Niu, Q. H., Qu, J. J., and An, Z. S. (2017). Characteristic of wind erosion climatic erosivity in Dunhuang yardang geo-park of Gansu Province. J. Desert Res. 37 (6), 1066. doi:10.7522/j.issn.1000-694X.2016.00084
Niu, Q. H. (2014). Several problems study of yardnag erosion process. Lanzhou, Gansu, China: Chinese Academy of Sciences. Cold and Arid Regions Environmental and Engineering Research Institute(Postdoctoral).
Pelletier, J. D. (2018). Controls on yardang development and morphology: 2. Numerical modeling. J. Geophys. Research-Earth Surf. 123 (4), 723–743. doi:10.1002/2017jf004462
Qu, J. J., Zheng, B. X., Yu, Q. H., and Zhao, A. G. (2004). The Yardang landform of Aqik Valley in the east of lop-nor and its relationship with the evolution of the Kumtagh Desert. J. Desert Res. 24 (3), 294–300. doi:10.3321/j.issn:1000-694X.2004.03.007
Ren, M. D., and Wang, N. L. (1981). Introduction to modern sedimentary environment. Bejing: Science Press.
Robertson, A. R. (1977). The CIE 1976 color-difference formulae. Color Res. Appl. 2 (1), 7–11. doi:10.1002/j.1520-6378.1977.tb00104.x
Singh, B., and Gilkes, R. J. (2010). Properties and distribution of iron oxides and their association with minor elements in the soils of south-western Australia. Eur. J. Soil Sci. 43 (1), 77–98. doi:10.1111/j.1365-2389.1992.tb00121.x
Sun, Y., He, L., Liang, L., and An, Z. (2011). Changing color of Chinese loess: Geochemical constraint and paleoclimatic significance. J. Asian Earth Sci. 40 (6), 1131–1138. doi:10.1016/j.jseaes.2010.08.006
Tian, Q. C., Yang, T. B., Shi, P. H., Zhu, H. Y., and Zhang, S. X. (2012). Environmental implication of color reflectance of drill hole BDQ0608, Keke Xili region and its influencing factors. Mar Geol Quatern Geol 32 (1), 133–140. doi:10.3724/sp.j.1140.2012.01133
Wu, Y. H., and Li, S. J. (2004). Significance of lake sediment color for short time scale climate variation. Adv. Earth Sci. 19 (5), 789. doi:10.3321/j.issn:1001-8166.2004.05.016
Yang, G. (2009). On distribution of the yardang in xinjiang[J]. Acta Geo Sichuan S2. doi:10.3969/j.issn.1006-0995.2009.z1.054
Yang, J. L., Xu, Q. M., Hu, Y. Z., Yuan, H., Wang, F., and Tian, L. Z. (2018). The sedimentary evolution process, weathering intensity and provenance reconstruction insight from borehole records of Bohai Bay. Earth Sci. 43, 287–300. doi:10.3799/dqkx.2018.137
Yang, S. L., and Ding, Z. L. (2003). Color reflectance of Chinese loess and its implications for climate gradient changes during the last two glacial-interglacial cycles. Geophys Res. Lett. 30 (20), 2003GL018346. doi:10.1029/2003gl018346
Yang, S. L., Fang, X. M., Li, J. J., An, Z. S., Chen, S. Y., and Hitoshi, F. K. S. W. (2001). Transformation functions of soil color and climate. Sci. China Ser. D Earth Sci 44 (1), 218–226. doi:10.1007/bf02911990
Zhao, W. H., Han, X. N., Chen, C., and Wang, X. L. (2022). Spectral analysis of the weathering of yardang buried pterosaur fossils–A case study of yardang near the No. 2 water source of Dahaidao. Spectrosc. Spectr. Analysis 42 (2), 561–567. doi:10.3964/j.issn.1000-0593(2022)02-0561-07
Zhao, Y. H., Chen, N. H., Chen, J. Y., and Hu, C. (2018). Automatic extraction of yardangs using landsat 8 and uav images: A case study in the Qaidam Basin, China. Aeolian Res. 33, 53–61. doi:10.1016/j.aeolia.2018.05.002
Zheng, B. X., Zhang, L. Y., and Hu, X. D. (2002). Distribution and characteristics of yardang landform and its formation period, west to Yumenguan, Gansu. J. Desert Res. 22 (1), 40. doi:10.3321/j.issn:1000-694X.2002.01.008
Keywords: color, chromaticity, yardang stratum, controlling factor, sedimentary environment
Citation: Liang X, Wang X, Zhai X, Niu Q and Li J (2023) Color changes in yardang strata sediment in the Dunhuang Yardang National Geopark, Northwest China: Controlling factors and significance for sedimentary environments. Front. Earth Sci. 10:1107213. doi: 10.3389/feart.2022.1107213
Received: 24 November 2022; Accepted: 28 December 2022;
Published: 12 January 2023.
Edited by:
Zhuolun Li, Lanzhou University, ChinaReviewed by:
Xiaokang Liu, Shaanxi Normal University, ChinaJibin Xue, South China Normal University, China
Copyright © 2023 Liang, Wang, Zhai, Niu and Li. This is an open-access article distributed under the terms of the Creative Commons Attribution License (CC BY). The use, distribution or reproduction in other forums is permitted, provided the original author(s) and the copyright owner(s) are credited and that the original publication in this journal is cited, in accordance with accepted academic practice. No use, distribution or reproduction is permitted which does not comply with these terms.
*Correspondence: Xiaoli Wang, NTE1ODQ5NjQ2QDE2My5jb20=
 Xiaolei Liang
 Xiaoli Wang2*
 Jiyan Li