 Dongfeng Ge1,2
 Dawei Lv
- 1College of Earth Sciences and Engineering, Shandong University of Science and Technology, Qingdao, China
- 2No.9 Geological Party, Xinjiang Bureau of Geological and Mining Resources, Urumqi, China
- 3113 Team of Guizhou Coal Geology Bureau, Guiyang, China
- 4The First Exploration Team of Shandong Province Coal Geology Bureau, Qingdao, China
Shale gas exploration is very important for the China in the further. There are many findings of shale gas in Northwest China, especially in Junggar Basin Permian Lucaogou Formation of the Xinjiang Uygur Autonomous Region. However the basic geological characteristics of Lucaogou Formation is not still clear. In order to solve this problems, Quanzijie shale gas collected from the southern margin of the Junggar Basin is taken as the study area, and shale gas resources are investigated and evaluated using the organic-rich shale section. On this basis, the investigation and evaluation of shale gas resources in the Lucaogou Formation is performed. The reservoir performance, preservation conditions, compressibility, and gas-bearing properties of gas-bearing shale intervals are identified. The results are as follows: The vertical and horizontal lithological and lithofacies variations of the source rocks of the Lucaogou Formation are clarified. This layer is characterized by the upward thinning of grain size and the upward darkening of color in the vertical direction. The layer can be divided into upper and middle-lower sections, with organic shale being most developed in the upper section, and sandstone and dolomite being more developed in the middle and lower area. The main hydrocarbon source rocks are developed in the upper area of the Lucaogou Formation. The total thickness of the hydrocarbon source rocks is 78.12–513.73 m. The lithology is mainly gray-black shale, silty mudstone, and oil shale. The average organic carbon content is 4.86%. The maturity of the organic matter is mainly 0.7–0.8%. The shale reservoirs have a high content of brittle minerals, but the physical properties both of the shale and sandstone reservoirs are poor. These are generally ultra-low porosity and ultra-low permeability reservoirs, in which the oil and gas reservoir space is mainly fractures.
Introduction
In the past few decades, the large-scale commercial development of shale oil and gas has changed the global energy supply structure (Chen et al., 2011; Aljamaan et al., 2017; Tang et al., 2021). The “shale oil and gas revolution” in the United States has turned it from an energy-importing country into an energy-exporting country. China is rich in shale oil and gas resources (Wang et al., 2014; Li et al., 2018; Ju et al., 2019). Continental shale, marine shale, and sea–land transitional shale are widely developed in oil- and gas-bearing basins in the northwest, north, and northeast of China, as well as in Qinghai Tibet and southern regions. This is an important field of unconventional oil and gas exploration and development in China (Gale et al., 2007; Gou., 2017; Gong et al., 2021).
Shale reservoirs are characterized by low porosity and ultra-low permeability (Hou et al., 2018; Javed et al., 2019; Yuan and Rezaee., 2019). Natural fractures are widely developed in shale, which is an important reservoir space and seepage channel of shale reservoirs (Dong et al., 2010; Habina et al., 2017; Guo et al., 2019). This can significantly improve the storage and seepage capacity of shale, affecting the enrichment, preservation conditions, single-well productivity, fracturing, and other development effects of shale oil and gas, and it is an important geological factor to be considered for shale oil and gas development (Yang et al., 2016; Yan et al., 2017; Li et al., 2018; Zhang et al., 2020).
Sets of hydrocarbon source rocks are developed in the southeast margin of Junggar Basin, including Permian, Triassic, Jurassic, Cretaceous, and Paleogene. Among them, the Permian Lucaogou Formation is one of the most important hydrocarbon source rocks, and it is also the stratum with the most potential for oil and gas exploration (Jiao et al., 2014; Hu et al., 2016; Jiang et al., 2019). Until now, several industrial oil wells have been drilled in the Lucaogou Formation. Some scholars have studied the oil-bearing properties, geochemical characteristics, hydrocarbon generation potential, and the mechanisms of the source rocks in this formation. The results show that this set of source rocks is a set of saline and semi-saline lacustrine sediments, with complex and diverse lithology, strong heterogeneity, wide distribution range, and large thickness, which shows good prospects for oil and gas exploration (Li et al., 2015; Liu et al., 2018).
In conclusion, the physical properties of shale reservoirs have become the main controlling factor for shale oil and gas production, and numerous research achievements have been made. However, research on the basic geological (sedimentary facies, reservoir physical properties, etc.) characteristics of shale oil and gas in the southern margin of the Junggar Basin is still insufficient, which seriously restricts the exploration and development of shale oil and gas resources in this area.
In this paper, Quanzijie shale gas collected from the southern margin of the Junggar Basin is taken as the study area, and shale gas resources are investigated and evaluated by using the organic-rich shale section. First, a set of strata is divided into upper and middle–lower sections, the basic characteristics of the source rocks are described in detail, and the shale facies type is identified by using rock type and TOC content. Second, the spatial distribution differences of the hydrocarbon source rocks are studied. Third, the type of organic matter, reservoir physical properties, and pore structure of different rock types and layers are compared, and differences in the organic geochemical characteristics are analyzed. On this basis, the physical property differences of source rocks in the Lucaogou Formation and dynamic variation of free surface energy under their influence is studied. These results can provide a theoretical basis for the efficient development of shale oil and gas in the southern margin of the Junggar Basin.
Geological setting and sample preparation
Geological setting
The tectonic environment of the study area in this paper is located in the eastern segment of the Dahuangshan–Dalongkou reversed turn. Owing to the influence of the Bogda Mountain front thrust belt, a series of tectonic deformations dominated by compressive stress has developed in this study area. Crumpled deformation formed by south to north napping can be seen in the Lucaogou Formation, where hydrocarbon source rocks are developed. This area is located in the east section of the south Junggar thrust belt. Regional and secondary faults are relatively developed. Generally, there are two large folds along the back, namely, the Dalongkou Syncline and the West Dalongkou Anticline. The hydrocarbon source rock horizon in this area is mainly the Lucaogou Formation, which can be mainly divided into the upper and middle-lower sections (Zhao et al., 2017; Qiao et al., 2020).
The upper section of this formation is composed of grayish black carbonaceous shale, silty mudstone, oil shale, and multi-layer dolomitic limestone and marlstone. The lithology of the upper section of the north wing of the Dalongkou Syncline in the area changes continuously, but the sand content in the upper section of the formation is significantly increased near the core of the Dalongkou Syncline and the Bogda Mountain front area in the south wing. The lithology is black-gray argillaceous siltstone, siltstone, and even fine sandstone, and the shale content is lower (Figure 1).
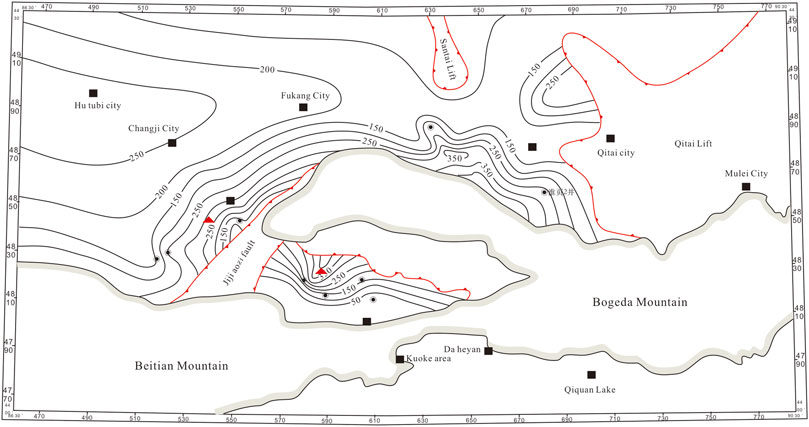
FIGURE 1. Study area, location, columnar drilling, and sampling locations.
Sample and experimental methods
Shale and sandstone samples were collected from the upper and middle–lower sections of the Lucaogou Formation for experimental testing. The organic geochemical characteristics and mineral composition of all the samples were analyzed. Then, the morphological characteristics of all the samples were observed by FE-SEM and quantitatively characterized by PCAS software. Subsequently, pore volume, specific surface area, and pore size distribution of the pores were quantitatively studied by N2 adsorption.
TOC experiments
All the samples were manually selected, manually ground to <60 meshes, and weighed 10 g. According to the national standard (GB/T 19145-2003), they were tested in the Jiangsu Institute of Geology and Mineral Resources Design. In the XRD experiment, the clay test sample was artificially broken into 60–80 meshes, weighing 200 g, and the whole rock test sample was broken into small pieces weighing 30 g, ground completely to <200 meshes, which was completed in Sinopec East China Branch’s test center. The instrument used was Ultima IV, and the experiments were conducted according to the industry standard SY/T 5163-2010.
FE-SEM experiment
Small samples were selected after argon ion polishing, after which a Quanta250 scanning electron microscope was used for testing and analysis. The FE-SEM photos taken were quantitatively analyzed by PCAS software, which is a professional software developed by Liu et al. (2011) to identify the micro pore structure in high-resolution SEM photos. This technique has been successfully applied to the quantitative identification of clay mineral micro-fractures and organic-rich shale micro pores.
Isothermal adsorption test
The instrument used in this experiment was a IS-100 high-pressure gas isothermal adsorption and desorption instrument. In strict accordance with the GB/T 19560-2008 Test Method for High Pressure Isothermal Adsorption of Coal, the sample was ground to 60–80 meshes, and a 100-g sample was taken and put it into the vacuum drying oven. The coal sample was dried at 373K for 6 h. Then, the sample was cooled to room temperature and put into the coal sample tank for evacuation. Methane adsorption experiments were carried out at ambient temperature (30°C) and an equilibrium pressure range of 0–15 MPa. The adsorption equilibrium time at each pressure point was greater than 12 h.
Results and discussion
Detailed description and difference comparison of lithofacies types
Outcrop observation and drilling revealed that the typical sedimentary rocks of the Lucaogou Formation (P3l) in this area are gray shale, oil shale, siltstone with dolomite, limestone lens, and a small amount of sandstone lens. According to the differences in the lithology, sedimentary structure, contents, mineral components, and logging curve of the sediments, the oil shale of the Lucaogou Formation in the study area is divided into five lithologic facies: black oil shale/shale facies; gray-black/dolomitic mudstone facies; gray-white argillaceous dolomite/limestone facies; gray-white micritic dolomite/micritic limestone facies; and granular limestone/dolomite facies. Among them, black oil shale/shale facies and gray-black calcareous/dolomitic mudstone facies are the main lithofacies types.
Black oil shale/shale facies
Black oil shale/shale facies are the most important lithologic facies in this study area. The main lithology is black/black-brown oil shale and gray-black shale. Many shales are intercalated with siltstone laminae or bands (mm). The siltstone can be seen in the liquefaction deformation structure, which may be turbidite sandstone at the far end of the semi-deep lake. The most intuitive features of this phase are the black color and prominent page structure.
The weathered color of the oil shale is mainly light blue-gray, gray-white, etc. The fresh surface is mainly black. After weathering, it presents an obvious book-like page texture. The fresh rock has thick foliation and common horizontal bedding. It contains fish (ancient cod, complete or fragmented), abundant phyllopods, bivalves, ostracods, and plant fossils preserved in situ. There are cubic or globular pseudomorphs of luteite with punctate ferritization and gypsum snowflake crystals (secondary changes) and bitumen-bearing nodules (Figure 2A). In this section, microscopically, the argillaceous structure and the layered structure can be seen (Figure 2).
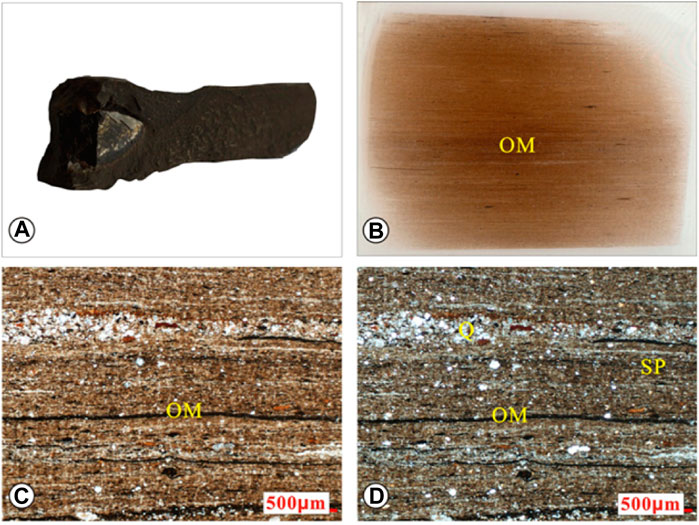
FIGURE 2. Thin section photos of black oil shale samples (A), Asphaltic concretion; (B–D) Muddy structure and layered structure can be seen under the microscope.
Lime/dolomitic mudstone facies
Compared with the black oil shale/shale lithologic facies, the most intuitive sign of this facies is grayish black with undeveloped foliation, mostly in a transitional relationship with the black shale facies. The lithology of this lithofacies includes calcareous mudstone, dolomitic mudstone, and silty mudstone. It is mostly mixed with siltstone laminations or bands.
The weathered color of the mudstone is mostly grayish white, brown-gray, and other colors. The fresh surface is grayish black, with a massive structure, and the section is mostly shell-shaped. Lime shales mixed with thin siltstone laminations or bands are common, and liquefaction deformation structures are found in the siltstone (Figure 3).
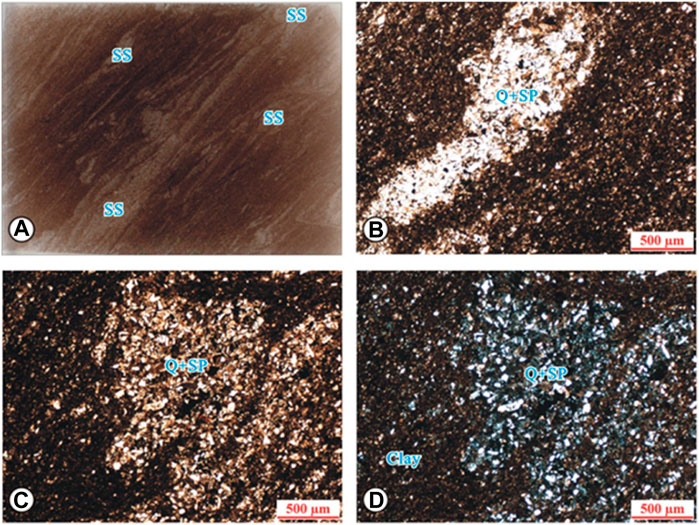
FIGURE 3. Thin section photo of grayish black silty banded dolomitic mudstone rock (A), Lime mudstone; (B), Dolomitic mudstone; (C), Silty mudstone; (D), mudstone rock.
Spatial distribution differences of the hydrocarbon source rocks
Figure 5 shows that the hydrocarbon source rocks of P3l in the study area are distributed in the upper section of the Lucaogou Formation vertically. The thickness of the upper section is 185.22–522.72 m. The lithology of the hydrocarbon source rocks is gray-black shale, silty mudstone, and black oil shale. The total thickness of the upper section is 78.12–513.73 m. The proportion of hydrocarbon source rocks in the upper section of the formation is 36%–98%, with an average of 85%. The lithology of the non-hydrocarbon source rocks in the upper section is gray dolomite, argillaceous dolomite, argillaceous siltstone, and a small amount of argillaceous silty limestone, with a total thickness of 2.92–136.46 m, ranging from 1 to 19 layers. The middle-lower section is composed of gray-white silty fine sandstone and dolomitic siltstone, mixed with a thin layer of dark mudstone, and the source rock is not developed.
The results show that the hydrocarbon source rocks in the upper section are basically distributed around the Dalongkou Syncline. The hydrocarbon source rocks in the north wing of the syncline are exposed to the surface, and their thickness is centered around the Xiaolongkou area, showing a trend of gradual thinning around. The core and south wing of the syncline are covered by the Quaternary system. The thickness of the hydrocarbon source rocks controlled by drilling is much smaller than that of the north wing of the syncline. The thickness of the hydrocarbon source rocks changes: in the south wing of the syncline it is less thick than in the core of the syncline, while it is at its thickest in the north wing of the syncline.
In the study area, the thickness variation of the hydrocarbon source rocks in the upper section is larger. The thickness of the hydrocarbon source rocks in the area of Dalongkou–Gangou in the west decreases gradually toward the surrounding area, while the hydrocarbon source rocks in the area of the Quancan 1 Well are thinner, and thickness of the hydrocarbon source rocks in the area of Well Qi1 increases gradually toward the northeast (Figure 4).
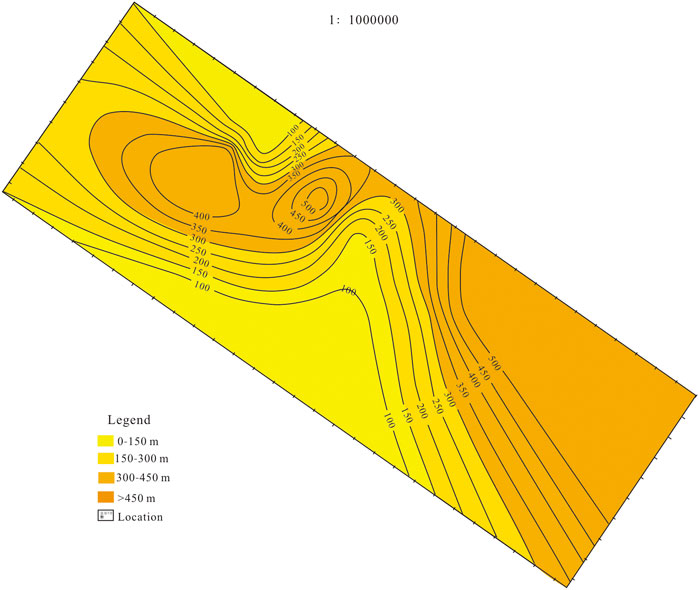
FIGURE 4. Thickness of the hydrocarbon source rocks in the upper part of the Lucaogou Formation.
Difference comparison of organic geochemical characteristics
Type of organic matter
The organic macerals of kerogen are mainly sapropel amorphous and humic amorphous. The sapropel formation is composed of sapropel amorphous and algal bodies, with a relative abundance of 0%–86%, with an average of 49.91%. Most of the non-resinous bodies are cuticle and chitin, with a relative abundance of 0%–87%, with an average of 18.91%. The vitrinite consists of structural vitrinite and unstructured vitrinite, with a relative abundance of 5%–79%, with an average of 26.7%. The relative abundance of the inert group is 2%–53%, with an average of 10.48%. The kerogen is light-yellow-brown, with no weak fluorescence, and the kerogen type index is –82 to 81.
The results show that the types of kerogen in the source rocks are type II1, type II2, and type III, with few type I. Type II is the main type, accounting for 89% in total. This shows that the main type of kerogen in the survey area is sapropel type, followed by sapropel humic type. Vertically, hydrocarbon protoliths of the upper section are type II1, type II2, and a small amount of type III, while the middle–lower section is dominated by type II1.
Organic matter content (TOC)
The organic carbon content of the source rocks is generally higher. The surface and drilling revealed that the TOC content is 0.5%–27.48%, with an average of 4.31%. Based on 22 samples of non-hydrocarbon source rocks, the TOC content was found to be 0.06%–0.48%, with an average of 0.33%, and the TOC content of source rock was mainly distributed between 0.6% and 7.0% (Figure 5). According to distribution of the TOC content (Figure 8), the higher TOC value area of the hydrocarbon source rocks is basically distributed around the basin–mountain junction in the north of the study area, indicating a decreasing trend from north to south. The higher organic carbon content area is concentrated in the Dalongkou–Gangou area in the west, with an average organic carbon content of more than 6%. The average organic carbon content in the area from Heijiawan to Dongdalongkou is 3%–4%, while the average organic carbon content in the area from Quancan Well 1 to Zhunye Well 4 in the south of the survey area is 0.5%–2%.
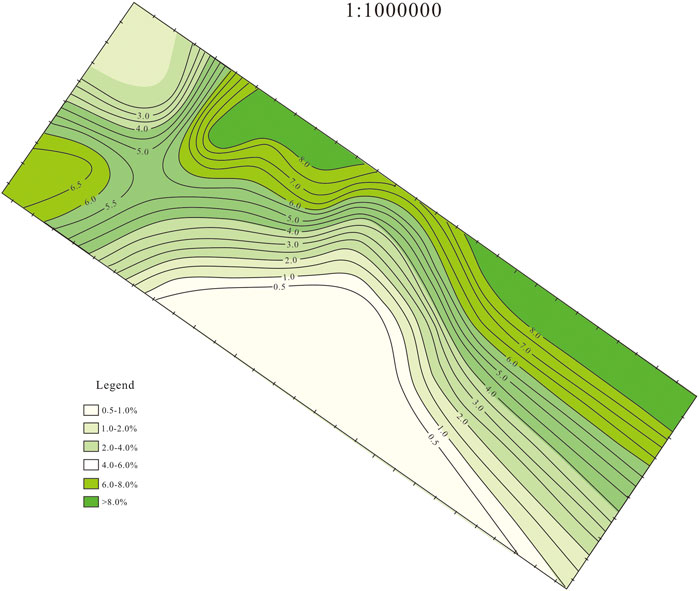
FIGURE 5. Distribution of the TOC content in the source rocks of the Lucaogou Formation.
In conclusion, the hydrocarbon source rock abundance in the north of this study area is better than that in the south. From the tectonic location of the source rocks, the hydrocarbon source rock abundance in the north wing of Dalongkou Syncline is higher than that in the core and south wing of the syncline. This is because the northern area was a deep-water area of the lake basin during the deposition, and the water body gradually became shallow toward the south. Bogda Mountain provided the main material source for the formation of hydrocarbon source rocks in the area during the Lucaogou Formation of the Late Permian, and the TOC content was mainly affected and controlled by the sedimentary environment. The deeper the sediment body, the higher its TOC content will be.
Maturity
The results show that the Ro, max of the hydrocarbon source rocks is 0.53%–1.24%, with an average of 0.78%. It generally follows normal distribution characteristics. The main body belongs to the mature stage, the second belongs to the lower-maturity stage, and a small amount is distributed in the immature stage, with a low degree of thermal evolution (Figure 6).
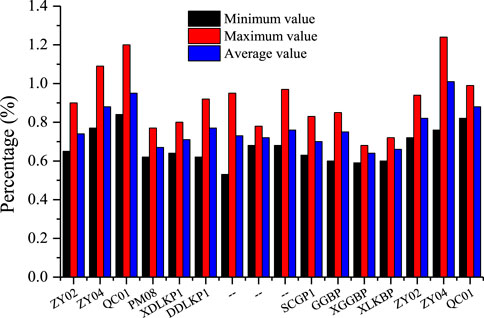
FIGURE 6. Distribution of the TOC content in the source rocks of the samples collected from the Lucaogou Formation.
Adsorption of reservoirs in the Lucaogou Formation
Petromineralogical characteristics
Clay minerals
The maximum clay mineral content (59%) of the shale reservoir samples in the upper section is slightly higher than the maximum clay content (38%) in the middle and lower sections, while the minimum clay content (4%) is equivalent to that of the samples in the middle and lower sections (3%), and the average clay content (28%) in the upper section is higher than that of the samples in the middle and lower sections (16%). The clay mineral composition of the shale reservoirs in the upper and middle–lower sections is mainly illite, followed by the illite/montmorillonite interbeds, while kaolinite, chlorite, and green/montmorillonite interbeds are relatively small. In the clay composition of the upper section, the average illite content (62%) is significantly higher than average illite content (41%) of the lower–middle section (Figure 7). In both the upper sample and the middle–lower sample, the illite/montmorillonite interlayer in the clay mineral components decreases with the increase of illite content.

FIGURE 7. Percentage of clay minerals and components in the upper and middle–lower sections.
Brittle minerals
The brittle minerals of the upper and lower sections are mainly quartz, feldspar, calcite, and dolomite. Among them, the average content of quartz and feldspar in the upper section (60%) is close to that in the middle–lower section (62%), the average content of carbonate rock (10%) is lower than that in middle–lower section (20%), and the average content of brittle minerals (71%) is lower than that in the middle–lower sample (84%) (Figure 8).
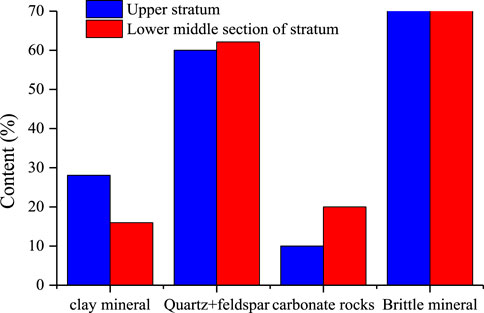
FIGURE 8. Percentage of mineral components in upper and middle–lower samples.
Type of reservoir space
The combination of macro and micro
Based on the core observation and scanning electron microscope results, it can be seen that the reservoir space types of this formation are diverse, mainly including macro-scale fractures and pores, as well as micro-scale pores and fractures.
Pores
The pores are mainly intergranular pores, intragranular pores, intergranular gaps, and mold holes at the micro-scale (Figure 9). All kinds of pores can form good self-sourced oil and gas reservoir spaces.
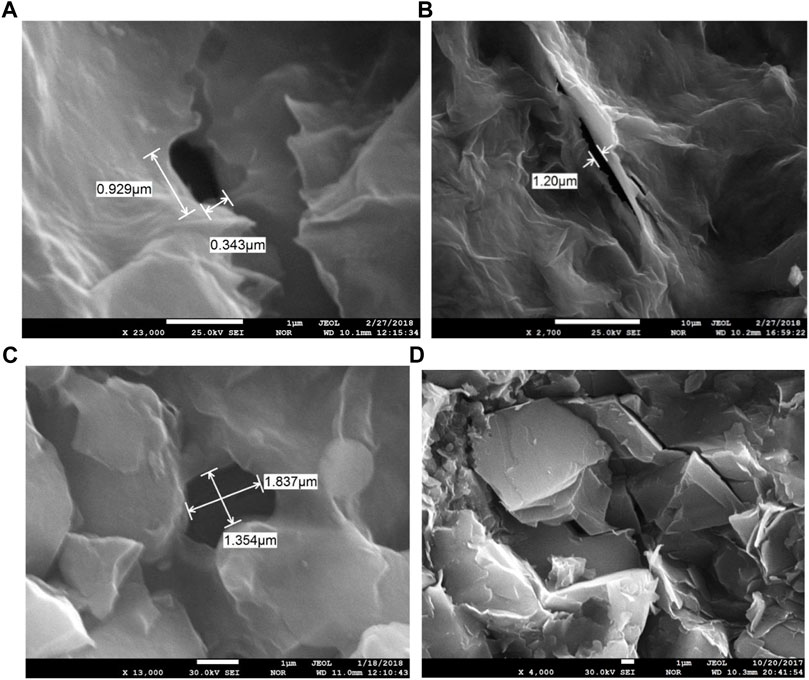
FIGURE 9. Pore type of all samples: (A) intergranular pore of shale reservoirs in the upper section; (B) intergranular gap of shale reservoirs in the upper section; (C) mold pore of sandstone reservoirs in the upper section; (D) granular minerals and intergranular microcracks of sandstone reservoirs in the upper section.
The fractures include macro-scale fractures, dissolution fractures, sutures and micro-scale fractures, lamina fractures, dissolution fractures, intergranular fractures, and internal fractures of clay minerals (Figure 10). For fluids, fractures play a dual role, which can be both a fluid migration channel and an effective reservoir space. It can not only destroy the oil and gas reservoir, resulting in the loss of oil and gas, but can also improve the reservoir pore connectivity and permeability.
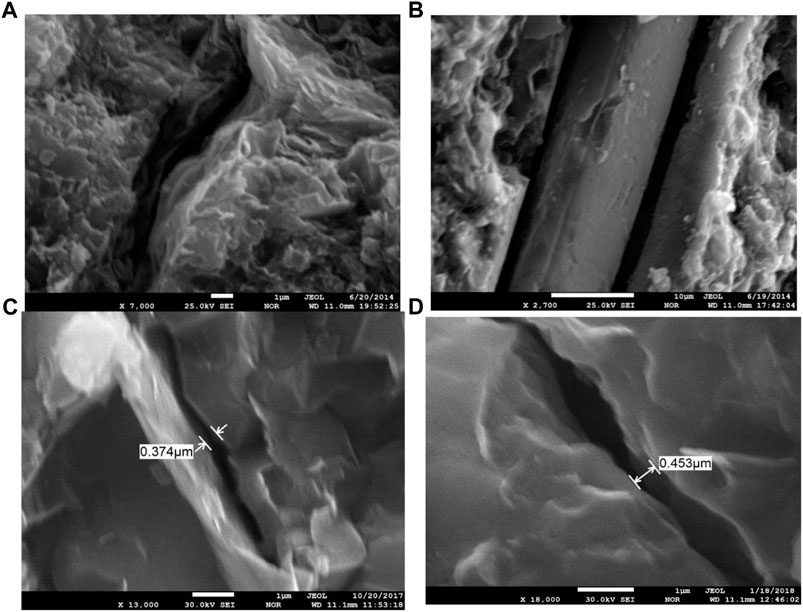
FIGURE 10. Fracture type of all samples: (A) dissolution fissure in the upper section; (B) straight gap between mineral particles of sandstone in the lower section; (C) micro-fracture of sandstone in the upper section; (D) micro-fracture of sandstone in the upper section.
Reservoir physical properties and pore structure
Shale reservoirs in the upper section
The rock density of the shale reservoir has a significant negative correlation with organic carbon content (TOC), that is, low TOC content represents high rock density (Figure 11). Therefore, it can be concluded that rock density logging data can be used to identify carbonaceous shale intervals during drilling.
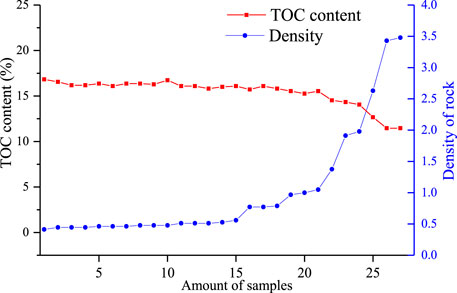
FIGURE 11. Comparison of shale rock density and organic carbon content in the upper part of the Lucaogou Formation.
As shown in Figure 12, permeability tends to increase with the increase of porosity, but the correlation between porosity and permeability is not obvious. On the contrary, some low porosity samples have high permeability values, indicating that their permeability is obviously affected by the micro-fractures. Some higher porosity samples have lower permeability values, indicating poor pore connectivity.
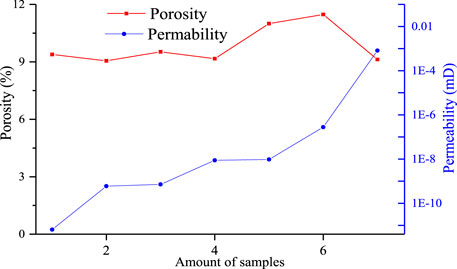
FIGURE 12. Relationship between the porosity and permeability of shale reservoirs in the upper section.
The specific surface area test results show that the minimum value of the specific surface area in the upper section is 0.12 m2/g, the maximum value is 14.2 m2/g, and the average value is 4.08 m2/g, mainly distributed in the range of 0–6 m2/g (Figure 13).
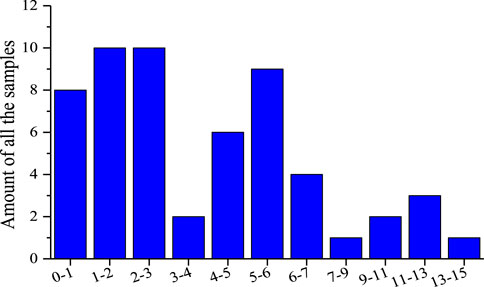
FIGURE 13. Distribution frequency of the specific surface area in different intervals of the upper shale reservoirs.
With the increase of the specific surface area, the porosity generally has an upward trend, but the correlation between them is general. The specific surface area is negatively correlated with the percentage of TOC content, and it is approximately positively correlated with the percentage of clay minerals (Figure 14).
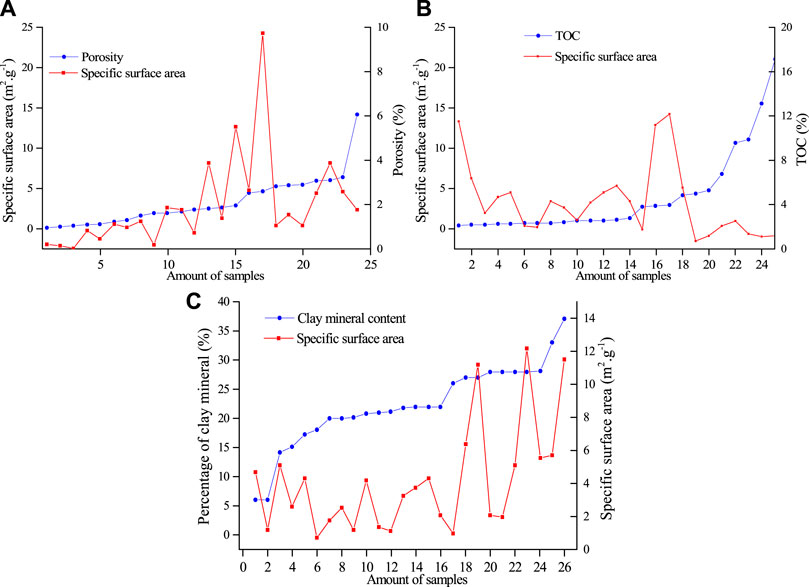
FIGURE 14. Relationship between specific surface area and pore parameter (a, specific surface area vs porosity; b, specific surface area vs TOC; c, specific surface area vs mineral content)
Sandstone reservoirs in the upper part of the Lucaogou Formation
Figure 15A shows that permeability tends to increase with the increase of porosity, but the correlation between porosity and permeability is not obvious. On the contrary, some low porosity samples have high permeability values, indicating that their permeability is obviously affected by the micro-fractures in the samples. Figure 15B shows that the minimum and maximum specific surface areas of the sandstone reservoirs in the upper part of Lucaogou Formation are 0.951 and 5.75 m2/g, respectively, with a main distribution range of 3–6 m2/g. As the specific surface area increases, the porosity has an overall upward trend.
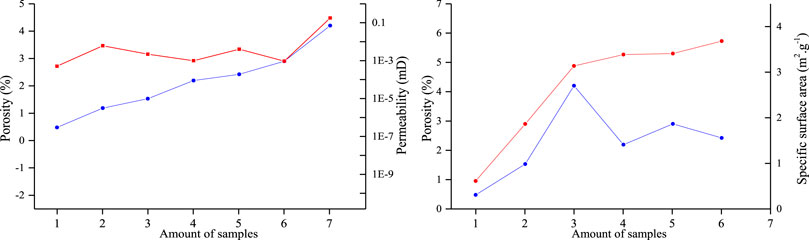
FIGURE 15. Change in the porosity and permeability of the sandstone sample in the upper section. The blue line is porosity and red line is permeability.
Shale reservoirs in the middle-–lower section
Figure 16 shows that the permeability tends to increase with the increase of porosity, but the correlation between porosity and permeability is general. This indicates that the minimum specific surface area of the shale reservoirs in the middle–lower section is 0.162 m2/g, and the main distribution range is 0–1 m2/g (Figure 17).
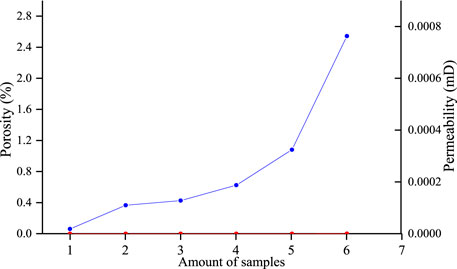
FIGURE 16. Relationship between the porosity and permeability of shale reservoirs in the middle–lower section. The blue line is porosity and red line is permeability.
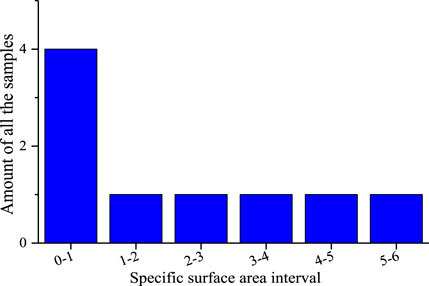
FIGURE 17. Distribution frequency of the specific surface area in different intervals of shale reservoirs in the middle and lower sections.
Sandstone reservoirs in the middle-lower section
Figure 18A shows that there is an upward trend with permeability, but the correlation between porosity and permeability is not obvious. On the contrary, lower porosity samples have high permeability values, which indicates that permeability is obviously affected by micro-fractures in the samples. The minimum and maximum specific surface areas of sandstone reservoirs are 5.75 and 2.056 m2/g, respectively, with a main distribution range of 0–2 m2/g (Figure 18B). Figure 18C shows that porosity has an overall upward trend with the increase of the specific surface area. Figure 18D shows that the pore diameter interval distributions in the samples which reflect the statics data are effective.
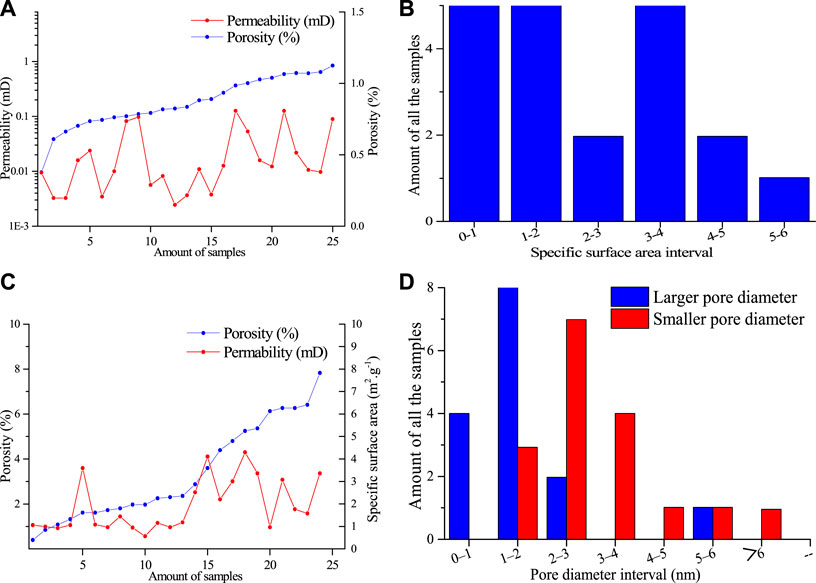
FIGURE 18. Permeability and porosity of sandstone reservoirs in the middle and lower sections/Specific surface area of all the samples in middle-lower section
Physical properties of reservoir rocks
Figure 19A shows that the porosity of the shale reservoirs in the upper section is greater than that in the middle–lower section. The porosity of the upper sandstone reservoirs is less than that of lower sandstone reservoirs. The porosity of the sandstone reservoirs is greater than that of shale, and the porosity of the sandstone reservoirs in the middle–lower section is greater than that of mudstone. Figure 19B shows that the permeability of the shale and sandstone reservoirs in the upper section is higher than that in the middle–lower section. The permeability of the sandstone reservoirs is higher than that of shale. Figure 19C shows that the specific surface areas of sandstone and shale are similar, and the specific surface areas in the upper section are larger than those in the middle-lower section. According to the scanning electron microscope statistical analysis results (Figure 19D), the average pore length and diameter of sandstone rocks are larger than that of shale.
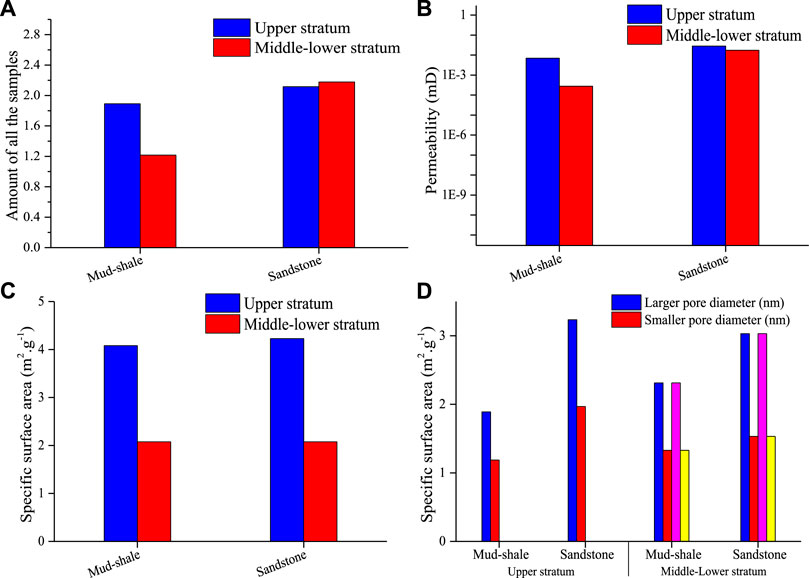
FIGURE 19. Comparison of the petrophysical properties of the upper/middle–lower reservoirs: (A) porosity; (B) permeability; (C) specific surface area; (D) specific surface area comparison of different lithology.
Adsorption of hydrocarbon source rocks in the Lucaogou Formation
In this paper, high-temperature isothermal adsorption tests were carried out on 13 samples to characterize the adsorption of organic-rich shale in the study area (Figure 20). The test conditions comprised a laboratory temperature of 30°C, a helium concentration of 99.999%, and a methane concentration of 99.99%. These results show that the average Langmuir volume VL is 2.93 m3/t and the average Langmuir pressure PL is 7.83 MPa. In general, the larger the Langmuir volume, the stronger the adsorption capacity of mudstone. The average Langmuir volume VL of siltstone fine sandstone is 0.89 m3/t, which is much smaller than that of mudstone, and the average Langmuir pressure PL is 14.8 MPa.
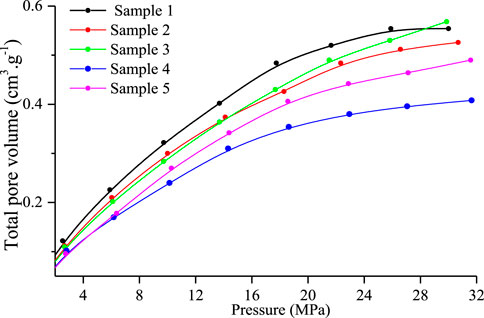
FIGURE 20. Isothermal adsorption simulation experiment curve for Zhunye Well 4.
Conclusion
In this paper, Quanzijie shale gas collected from the southern margin of the Junggar Basin was taken as the study area, and shale gas resources were investigated and evaluated by using the organic-rich shale section. On this basis, the investigation and evaluation of shale gas resources in the Lucaogou Formation was performed. The reservoir performance, preservation conditions, compressibility, and gas-bearing properties of gas-bearing shale intervals were identified. The results are as follows.
The vertical and horizontal lithological and lithofacies variations of the source rocks of the Lucaogou Formation were clarified. This layer is characterized by the upward thinning of grain size and the upward darkening of color in the vertical direction. The layer can be divided into upper and middle–lower sections; organic shale is most developed in the upper section, and sandstone and dolomite are more developed in the middle–lower section.
The main hydrocarbon source rocks are developed in the upper section of the Lucaogou Formation. The total thickness of the hydrocarbon source rocks is 78.12–513.73 m. The lithology is mainly gray-black shale, silty mudstone, and oil shale. The average organic carbon content is 4.86%. The maturity of the organic matter is mainly 0.7–0.8%. The shale reservoirs have a high content of brittle minerals, but the physical properties both of the shale and sandstone reservoirs are poor. They are generally ultra-low porosity and ultra-low permeability reservoirs, in which the oil and gas reservoir space is mainly fractures.
Data availability statement
The raw data supporting the conclusions of this article will be made available by the authors, without undue reservation.
Author contributions
DG is responsible for writing. DL designed the ideas. PY is responsible for drawing. SW is responsible for analyzing the data. JL is responsible for analyzing the data. GL is responsible for analyzing the data.
Funding
This work was jointly financially supported by the Xinjiang Uygur Autonomous Region Tianshan Talents Training Fund Project (TSYC2021171), Xinjiang Uygur Autonomous Region Science and Technology Talent Training Fund (QN2016YX0643), Xinjiang Uygur Autonomous Region Geological Exploration Fund (N16-2-LQ28), Xinjiang Uygur Autonomous Region Tianshan Talent Training Program (TSYC2021171), Youth Innovation Team Development Plan of Universities in Shandong Province, and SDUST Research Fund (No. 2018TDJH101).
Conflict of interest
The authors declare that the research was conducted in the absence of any commercial or financial relationships that could be construed as a potential conflict of interest.
Publisher’s note
All claims expressed in this article are solely those of the authors and do not necessarily represent those of their affiliated organizations, or those of the publisher, the editors, and the reviewers. Any product that may be evaluated in this article, or claim that may be made by its manufacturer, is not guaranteed or endorsed by the publisher.
References
Aljamaan, H., Al Ismail, M., and Kovscek, A. R. (2017). Experimental investigation and Grand Canonical Monte Carlo simulation of gas shale adsorption from the macro to the nano scale. J. Nat. Gas Sci. Eng. 48, 119–137. doi:10.1016/j.jngse.2016.12.024
Chen, S., Zhu, Y., Wang, H., Liu, H., Wei, W., and Fang, J. (2011). Shale gas reservoir characterisation: A typical case in the southern Sichuan Basin of China. Energy 36 (11), 6609–6616. doi:10.1016/j.energy.2011.09.001
Dong, J., Hsu, J., Wu, W., Shimamoto, T., Hung, J. H., Yeh, E. C., et al. (2010). Stress-dependence of the permeability and porosity of sandstone and shale from TCDP Hole-A. Int. J. Rock Mech. Min. Sci. 47 (7), 1141–1157. doi:10.1016/j.ijrmms.2010.06.019
Gale, J. F. W., Reed, R. M., and Holder, J. (2007). Natural fractures in the Barnett Shale and their importance for hydraulic fracture treatments. AAPG Bull. 91 (4), 603–622. doi:10.1306/11010606061
Gong, L., Wang, J., Gao, S., Fu, X., Liu, B., Miao, F., et al. (2021). Characterization, controlling factors and evolution of fracture effectiveness in shale oil reservoirs. J. Pet. Sci. Eng. 203 (2), 108655. doi:10.1016/j.petrol.2021.108655
Gou, Q. Y. (2017). Application of fracture prediction technology based on stack front anisotropy in shale reservoir. China Petrochem. (3), 26–27. [in chinese].
Guo, X., Huang, Z., Zhao, L., Han, W., Ding, C., Sun, X., et al. (2019). Pore structure and multi-fractal analysis of tight sandstone using MIP, NMR and NMRC methods: A case study from the Kuqa depression, China. J. Pet. Sci. Eng. 178, 544–558. doi:10.1016/j.petrol.2019.03.069
Habina, I., Radzik, N., Topór, T., and Krzyzak, A. (2017). Insight into oil and gas-shales compounds signatures in low field 1H NMR and its application in porosity evaluation. Microporous Mesoporous Mater. 252, 37–49. doi:10.1016/j.micromeso.2017.05.054
Hou, X., Zhu, Y., and Yao, H. (2018). Coupled accumulation characteristics of Carboniferous-Permian coal measure gases in the Northern Ordos Basin, China. Arabian J. Geosci. 11 (7), 156. doi:10.1007/s12517-018-3512-8
Hu, J., Tang, S., and Zhang, S. (2016). Investigation of pore structure and fractal characteristics of the lower Silurian Longmaxi shales in Western Hunan and Hubei Provinces in China. J. Nat. Gas Sci. Eng. 28, 522–535. doi:10.1016/j.jngse.2015.12.024
Javed, M. A., Komulainen, S., Daigle, H., Zhang, B., Vaara, J., Zhou, B., et al. (2019). Determination of pore structures and dynamics of fluids in hydrated cements and natural shales by various 1H and 129Xe NMR methods. Microporous Mesoporous Mater. 281, 66–74. doi:10.1016/j.micromeso.2019.02.034
Jiang, J., Yang, W., Cheng, Y., Zhao, K., and Zheng, S. (2019). Pore structure characterization of coal particles via MIP, N2 and CO2 adsorption: Effect of coalification on nanopores evolution. Powder Technol. 354, 136–148. doi:10.1016/j.powtec.2019.05.080
Jiao, K., Yao, S., Liu, C., Gao, Y., Wu, H., Li, M., et al. (2014). The characterization and quantitative analysis of nanopores in unconventional gas reservoirs utilizing FESEM–FIB and image processing: An example from the lower Silurian Longmaxi Shale, upper Yangtze region, China. Int. J. Coal Geol. 128-129, 1–11. doi:10.1016/j.coal.2014.03.004
Ju, W., Wang, J., Fang, H., and Sun, W. (2019). Paleotectonic stress field modeling and prediction of natural fractures in the Lower Silurian Longmaxi shale reservoirs, Nanchuan region, South China. Mar. Pet. Geol. 100, 20–30. doi:10.1016/j.marpetgeo.2018.10.052
Li, W., Liu, H., and Song, X. (2015). Multifractal analysis of Hg pore size distributions of tectonically deformed coals. Int. J. Coal Geol. 144-145, 138–152. doi:10.1016/j.coal.2015.04.011
Li, Z., Shen, X., Qi, Z., and Hu, R. (2018). Study on the pore structure and fractal characteristics of marine and continental shale based on mercury porosimetry, N2 adsorption and NMR methods. J. Nat. Gas Sci. Eng. 53, 12–21. doi:10.1016/j.jngse.2018.02.027
Liu, C., Shi, B., Zhou, J., and Tang, C. (2011). Quantification and characterization of microporosity by image processing, geometric measurement and statistical methods: Application on SEM images of clay materials. Appl. Clay Sci. 54, 97–106. doi:10.1016/j.clay.2011.07.022
Liu, K., Ostadhassan, M., and Kong, L. (2018). Multifractal characteristics of Longmaxi shale pore structures by N2 adsorption: A model comparison. J. Pet. Sci. Eng. 168, 330–341. doi:10.1016/j.petrol.2018.04.072
Qiao, J., Zeng, J., Jiang, S., Ma, Y., Feng, S., Xie, H., et al. (2020). Role of pore structure in the percolation and storage capacities of deeply buried sandstone reservoirs: A case study of the Junggar Basin, China. Mar. Pet. Geol. 113, 104129–129. doi:10.1016/j.marpetgeo.2019.104129
Tang, Q., Zhou, L., Chen, L., Tan, X., and Wang, G. (2021). Development characteristics of shale lithofacies in the Longmaxi Formation and their main controlling factors in the Changning area, South Sichuan basin, SW China. Front. Earth Sci. 9, 775657. doi:10.3389/feart.2021.775657
Wang, Y., Zhu, Y., Chen, S., and Li, W. (2014). Characteristics of the Nanoscale pore structure in northwestern Hunan shale gas reservoirs using field emission scanning electron microscopy, high-pressure mercury intrusion, and gas adsorption. Energy Fuels 28 (2), 945–955. doi:10.1021/ef402159e
Yan, G., Wei, C., Song, Y., and Zhang, J. (2017). Pore characteristics of organic-rich shale in the Carboniferous-Permian coal-bearing strata in Qinshui Basin. Energy Explor. Exploit. 35 (5), 645–662. doi:10.1177/0144598717709668
Yang, R., He, S., Yi, J., and Hu, Q. (2016). Nano-scale pore structure and fractal dimension of organic-rich Wufeng-Longmaxi shale from Jiaoshiba area, Sichuan Basin: Investigations using FE-SEM, gas adsorption and helium pycnometry. Mar. Pet. Geol. 70, 27–45. doi:10.1016/j.marpetgeo.2015.11.019
Yuan, Y., and Rezaee, R. (2019). Fractal analysis of the pore structure for clay bound water and potential gas storage in shales based on NMR and N2 gas adsorption. J. Pet. Sci. Eng. 177, 756–765. doi:10.1016/j.petrol.2019.02.082
Zhang, P., Lu, S., Li, J., and Chang, X. (2020). 1D and 2D Nuclear magnetic resonance (NMR) relaxation behaviors of protons in clay, kerogen and oil-bearing shale rocks. Mar. Pet. Geol. 114, 104210. doi:10.1016/j.marpetgeo.2019.104210
Zhao, P., Wang, Z., Sun, Z., Cai, J., and Wang, L. (2017). Investigation on the pore structure and multifractal characteristics of tight oil reservoirs using NMR measurements: Permian Lucaogou Formation in Jimusaer Sag, Junggar Basin. Mar. Pet. Geol. 86, 1067–1081. doi:10.1016/j.marpetgeo.2017.07.011
Keywords: Junggar Basin, Lucaogou Formation, shale reservoirs, porosity–permeability, hydrocarbon source rocks
Citation: Ge D, Lv D, Yao P, Wen S, Li J and Lei G (2023) Physical property differences of source rocks in the Lucaogou Formation and adsorption ability variation under their influence. Front. Earth Sci. 10:1103286. doi: 10.3389/feart.2022.1103286
Received: 20 November 2022; Accepted: 05 December 2022;
Published: 10 January 2023.
Edited by:
Zhenzhi Wang, Henan Polytechnic University, ChinaReviewed by:
Kun Zhang, Henan Polytechnic University, ChinaYanjun Meng, Taiyuan University of Technology, China
Baoxin Zhang, China University of Mining and Technology, China
Copyright © 2023 Ge, Lv, Yao, Wen, Li and Lei. This is an open-access article distributed under the terms of the Creative Commons Attribution License (CC BY). The use, distribution or reproduction in other forums is permitted, provided the original author(s) and the copyright owner(s) are credited and that the original publication in this journal is cited, in accordance with accepted academic practice. No use, distribution or reproduction is permitted which does not comply with these terms.
*Correspondence: Dawei Lv, bHZkYXdlaTk1QGdtYWlsLmNvbQ==