- 1School of Civil Engineering and Architecture, Guizhou Minzu University, Guiyang, China
- 2Key Laboratory of Karst Environmental Geological Hazard Prevention, Guiyang, China
- 3Key Laboratory of Urban Underground Space Development and Safety in Karst Areas, Guizhou Minzu University, Guiyang, China
- 4State Key Laboratory of Geohazards Prevention and Geoenvironment Protection, Chengdu University of Technology, Chengdu, China
- 5Guizhou Geological Environment Monitoring Institute, Guiyang, China
Soil-rock mixtures are geological materials with complex physical and mechanical properties. Therefore, the stability prediction of soil-rock mixture slopes using machine learning methods is an important topic in the field of geological engineering. This study uses the soil-rock mixture slopes investigated in detail as the dataset. An intelligent optimization algorithm-weighted mean of vectors algorithm (INFO) is coupled with a machine learning algorithm. One of the new ensemble learning models, which named IN-Voting, is coupled with INFO and voting model. Twelve single machine learning models and sixteen novel IN-Voting ensemble learning models are built to predict the stability of soil-rock mixture slopes. Then, the prediction accuracies of the above models are compared and evaluated using three evaluation metrics: coefficient of determination (R2), mean square error (MSE), and mean absolute error (MAE). Finally, an IN-Voting ensemble learning model based on five weak learners is used as the final model for predicting the stability of soil-rock mixture slopes. This model is also used to analyze the importance of the input parameters. The results show that: 1) Among 12 single machine learning models for the stability prediction of soil-rock mixture slopes, MLP (Multilayer Perceptron) has the highest prediction accuracy. 2) The IN-Voting model has higher prediction accuracy than single machine learning models, with an accuracy of up to 0.9846) The structural factors affecting the stability of soil-rock mixture slopes in decreasing order are the rock content, bedrock inclination, slope height, and slope angle.
1 Introduction
Soil-rock mixture slopes are mainly discontinuous, loose soil-rock mixture deposits composed of massive rocks and fine-grained soils with varying physical and mechanical properties (Xu and Zhang, 2021; Zhao et al., 2021). These slopes are widely distributed in areas such as the mountainous regions of southwest China, the Three Gorges Reservoir Region, and the Qinling Mountains (Cen et al., 2017; Gao et al., 2018). The soil-rock mixture slope has significant characteristics of non-uniformity and dual structure, and its stability can be affected by the rock content and grain size gradation (Dong et al., 2020; Xu and Zhang, 2021). Therefore, its stability evaluation is complicated, and slope instability can cause large economic and life losses (Liu et al., 2022; Wang et al., 2022). In July 2011, a landslide of soil-rock mixture occurred in Lueyang County, Hanzhong City, southern Shaanxi Province, resulting in the death of 18 people (Liu et al., 2019). In July 2020, the instability of a soil-rock mixture slope in Wulong District, Chongqing, caused substantial economic losses (Zhou et al., 2021).
Scholars have conducted numerous studies on the stability evaluation of soil-rock mixture slopes. Xu et al. (2016) studied the properties of soil-rock mixtures by numerical simulation with discrete elements. Gao et al. (2018) used the strength parameters of the soil-rock mixture obtained from the direct shear test for evaluation. The damage characteristics of slopes and their stability were simulated using the finite element method (Yue et al., 2003; Chen et al., 2021). Zhao et al. (2021) obtained the stability coefficients of soil-rock mixture slopes using FLAC 3D and strength reduction methods, revealing the influence of rock content on the stability coefficients and damage modes. Peng et al. (2022) coupled discontinuous deformation analysis and smooth particle hydrodynamics to investigate the mechanical properties of soil-rock mixture slopes. Qiu et al. (2022) using the physical deterministic model—Scoops3D model to analyze landslide stability. Zhao et al. (2022) investigated the mechanism of large deformation damage of slopes using the material point method for soil-rock mixture slopes.
With the development of computer technology, many scholars have used machine learning methods for slope stability prediction. For example, some scholars used several single machine learning algorithms or ensemble learning algorithms to predict the stability of slopes. The best prediction model for such slopes could be obtained by comparing the prediction accuracy of each model. Ray et al. (2020) showed that an improved machine learning prediction model based on artificial neural networks was effective for the stability prediction of residual soil slopes. Lin et al. (2021) concluded that non-linear regression models outperformed linear models in predicting slope stability. Ramos-Bernal et al. (2021) revealed that the Adaboost classifier was more suitable for slope prediction modeling. By comparing a single machine learning model with an ensemble learning model, Pham et al. (2021) found that the slope stability prediction model based on the ensemble algorithm was more accurate. Cheng et al. (2022) and Shahzad et al. (2022) found that slope analysis models developed with support vector machines had the highest robustness. Feng et al. (2022) found that support vector machine models and random forest models had more reliable prediction results. Other scholars have further improved the accuracy of slope stability prediction by coupling an intelligent optimization algorithm with a single machine learning algorithm to build a prediction model. Xue (2016) showed that determining the optimal parameters of a least square support vector machine model based on an improved particle swarm algorithm could significantly improve the accuracy of slope stability prediction models. Qi and Tang, 2018 showed that using the firefly optimization algorithm to separately determine the hyperparameters of six machine learning algorithms was effective in improving the model prediction accuracy.
However, due to the complexity of soil-rock mixture slopes, the use of machine learning methods to predict their stability was rarely reported. Therefore, a novel ensemble learning model is proposed in this study to predict the stability of soil-rock mixture slopes, providing new ideas and references for related studies and engineering applications. First, a weighted mean of vectors algorithm (INFO) is used to determine the hyperparameter combinations of 12 single machine learning models. The weight distribution in the novel IN-Voting ensemble learning model is also investigated. In this way, a more accurate slope stability prediction model for soil-rock mixtures is established. Then, the data of mixed soil and rock slopes in Wanzhou District (Chongqing, China) are used for case analysis. Importance analysis of four input parameters (i.e., slope angle, bedrock inclination, slope height, and rock content) is performed using the Permutation Importance method based on the IN-Voting model. The influence degree of these parameters on the stability of the soil-rock mixture slope is obtained.
2 Basic principles of the algorithm
2.1 Intelligent optimization algorithm—INFO
INFO is a new intelligent optimization algorithm proposed by Ahmadianfar et al. (Ahmadianfar et al., 2022), which has the advantages of strong searching ability, fast speed, and less overfitting. The core idea of INFO lies in three stages.
2.1.1 Updating rule stage
where
2.1.2 Vector combining stage
where
2.1.3 Local search equation
where:
where
This study mainly uses the INFO algorithm to determine hyperparameter combinations in single machine learning models and weight values among weak learners in Voting ensemble learning models.
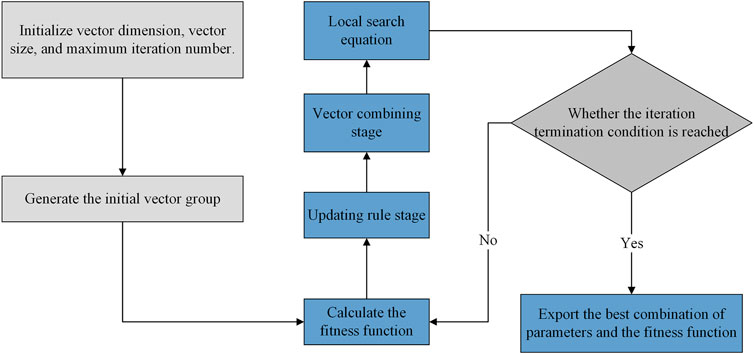
For the practical application, the main flow of the algorithm (Figure 1) is as follows.
1) The maximum iteration number is 100, and the group number is 30. For a single machine learning model, the group dimension is the number of hyperparameters to be adjusted by the machine learning model. For the Voting ensemble learning model, the group dimension is the number of weight values to be adjusted.
2) A random group matching the upper and lower boundary vectors is initialized.
3) The coefficient of determination R2 (Eq. (6)) is used as the fitness function of this algorithm.
4) The new vectors generated in the vector update phase are used to start the vector merge phase.
5) In the local search phase, whether the vector generated in the fourth step exceeds the upper and lower boundary of the group can be determined. By comparing the fitness function values of the old and new vectors, whether to perform the vector update and the change of the best fitness value are determined.
6) Steps 3–5 are repeated until the iteration termination condition is reached, then the results are exported.
2.2 Machine learning models
2.2.1 Adaptive boosting (ADBT) model
ADBT is an ensemble learning model that constructs strong learners by linear combinations of weak learners (Freund and Schapire, 1995). By using the performance in each training iteration to weight the attention created for subsequent training, ADBT assigns larger weights to data that are more difficult to predict and smaller weights to those less difficult to predict, thus improving the overall prediction accuracy of the model (Bui et al., 2019; Lee et al., 2022). In this study, the default learner of ADBT is used, and the three hyperparameters to be determined are the maximum iteration number (n_estimators), the learning rate (learning_rate), and the random seed (random_state).
2.2.2 Bayesian linear regression (BYS) model
Based on Bayesian conditional probability, BYS treats the parameters of the linear model as random variables and computes the posterior through the prior of the model parameters, thus completing the model construction and prediction (Gelman, 2015). The six hyperparameters to be determined in this study are the maximum iteration number (n_iter), the tolerance value (tol), the shape parameter of the Gamma distribution before the alpha parameter (alpha_1), the inverse scale parameter of the Gamma distribution before the alpha parameter (alpha_2), the shape parameter of the Gamma distribution before the lambda parameter (lambda_1), and the inverse scale parameter of the Gamma distribution before the lambda parameter (lambda_2).
2.2.3 ElasticNet regression (ELN) model
ELN combines the regularization methods of Lasso regression and Ridge regression. The L1 regularization and L2 regularization calculations are incorporated into the standard linear regression model conditions to form a new cost function (Zou and Hastie, 2005). The five hyperparameters to be determined for this model are the constant of the penalty term (Alpha), the mixing parameter (l1_ratio), the maximum iteration number (max_iter), the tolerance value (tol), and the random seed (random_state).
2.2.4 Extra-trees (ETR) model
ETR is a machine-learning model for bagging proposed by Geurts et al. (2006). Because the division points in ETR are random, the prediction results of this model require the combined action of multiple decision trees to achieve the best prediction (Ghatkar et al., 2019). The five hyperparameters to be determined are the number of decision trees (n_estimators), the maximum iteration number (max_depth), the random seed (random_state), the minimum number of samples required to split the internal nodes (min_samples_split), and the minimum number of samples required for each node (min_samples_leaf).
2.2.5 Gradient boosting decision tree (GBDT) model
The GBDT model proposed by Friedman (Friedman, 2002) is an ensemble model based on multiple weak learners to obtain strong learning capabilities. In the regression problem, the negative gradient of the loss function is used to approximate the value of the current model as the residual of the boosted tree model, thus obtaining the best prediction results. GBDT has received much attention from scholars since its introduction (Wu and Lin, 2022). In this study, the five parameters to be determined are learning rate (learning_rate), maximum iteration of the weak learner (n_estimators), maximum depth of the decision tree (max_depth), subsample (subsample), and random seed (random_state).
2.2.6 Huber regression (HBR) model
In the HBR model, the loss function in the theoretical approach of linear regression is replaced with Huber loss (Sun et al., 2020). The four hyperparameters to be determined in this study are the number of outliers (Epsilon), the maximum iteration number (max_iter), the regularization parameter (alpha), and the tolerance value (tol).
2.2.7 K-nearest neighbor (KNN) model
The KNN model proposed by Cover and Hart, 1967 is theoretically mature, easy to understand, and highly accurate, which can be used to address classification and regression problems (Sevi and AuthorAnonymous, 2020). Since the selection of the K determines the accuracy of the model prediction (Deng, 2020), three hyperparameters need to be determined to improve the model prediction accuracy: k-value (n_neighbors), the threshold for the number of leaf nodes (leaf_size), and distance metric p).
2.2.8 Lasso (LAS) model
The LAS model is based on a standard linear regression model and L1 regularization (Leeuw, 2009). Compared to linear regression models, LAS models can handle high-dimensional data more quickly and efficiently. Therefore, many scholars considered using LAS models to build prediction models (Wagenaar et al., 2017). In this study, the three hyperparameters to be determined are the constant of the penalty term (Alpha), the maximum iteration number (max_iter), and the tolerance value (tol).
2.2.9 Multilayer Perceptron (MLP) model
The MLP model is constructed through full connectivity between input, hidden, and output layers. The main idea of the input layer is to accept multiple variables from the model and pass them into the hidden layer, where the number of neurons is the same as the type of input variables. The main idea of the hidden layer is to extend the data to a higher dimension, which improves the prediction accuracy of the model by increasing the complexity of the input variables. The main idea of the output layer is to output the final prediction of the model by accepting the last layer of the hidden layer (Almansi et al., 2022).
The seven hyperparameters to be determined in this study are: the regularization term parameter (Alpha), the initial learning rate (learning_rate_init), the index of the inverse scaling learning rate (power_t), the maximum iteration number (max_iter), the momentum of the gradient descent update (momentum), the proportion of the training data to be left as a validation set for early stops (validation_fraction), and the random number seed (random_state).
2.2.10 Random forest (RF) model
The RF model is composed of several unrelated regression trees, and the final output is jointly determined by each regression tree (Zhang et al., 2019). The model was proposed and developed by Ho et al. (Ho, 1998) and Breiman (2001). The five hyperparameters to be determined in this study are the number of decision trees (n_estimators), the minimum number of samples in each division (min_samples_split), the minimum number of samples in the leaf nodes: (min_samples_leaf), the random number seed (random_state), and the minimum weight required by the leaf nodes (min_weight_fraction _leaf).
2.2.11 Support vector machine (SVM) model
Cortes and Vapnik, 1995 proposed that support vector regression (SVR) in SVM models can be used for regression analysis (Kombo et al., 2020). The use of kernel tricks in SVM makes the model a good solution for analyzing non-linear data (Feng et al., 2022). The four hyperparameters to be determined in this study are the number of kernel functions (Degree), kernel coefficients (epsilon), kernel cache size (cache_size), and the maximum iteration number (max_iter).
2.2.12 Stochastic gradient descent (SGD) model
The SGD model is generated based on the gradient descent model (Bui et al., 2019). During the model operation, the dataset is randomly disrupted. Since a sample is randomly selected from the dataset at each iteration, the path used by the model to reach the minimum is usually noisier than that of a typical gradient descent model, but the training time can be significantly reduced. The five hyperparameters to be determined are the constant of the penalty term (Alpha), the elastic net mixing parameter (l1_ratio), the maximum iteration number (max_iter), the initial learning rate (eta0), the inverse scaling learning rate index (power_t), and the random number seed (random_state).
2.2.13 IN-voting model
Voting models are classified into two types: classification and regression. For common regression models, the prediction results of multiple weak learners are reprocessed through arithmetic mean fusion or geometric mean fusion, thus improving the prediction accuracy of the model.
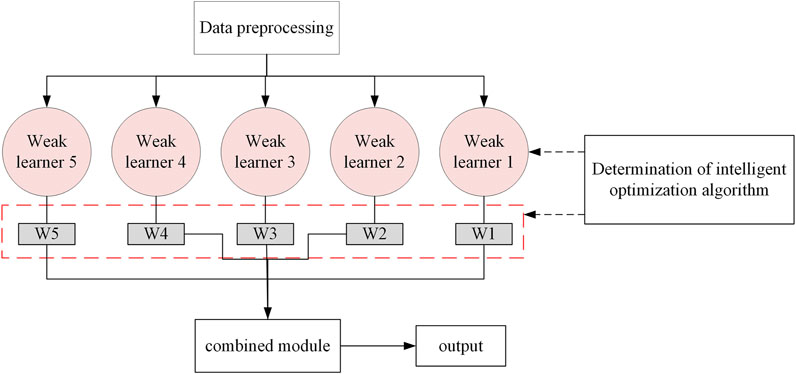
In this study, a new ensemble learning model - IN-Voting is developed based on the regression model of traditional Voting. As shown in Figure 2, the flow of the IN-Voting model is as follows: Firstly, the data is pre-processed for soil-rock mixed slopes. The number of weak learners selected in the model is finally determined to be five based on the complexity of the IN-Voting ensemble learning model and the accuracy rate. Then, the INFO intelligent optimization algorithm improves the prediction accuracy of the model by assigning different weight values to the weak learner. Finally, the combined module in the new ensemble learning model of IN-Voting is used to complete the final building of the model and output the model prediction results.
2.3 Building process of the prediction model
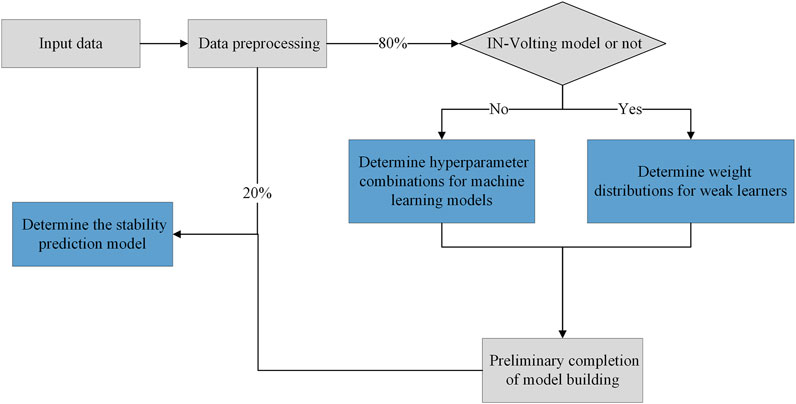
The building process of the stability prediction model for soil-rock mixture slopes is shown in Figure 3, which is explained in detail below.
(1) The input parameters of the soil-rock mixture slopes (i.e., rock content, bedrock inclination, slope angle, and slope height) are standardized and normalized.
(2) To prevent overfitting of the model, 80% of the total data is classified into a training set for the initial establishment model, and 20% is classified into a test set for further validation.
(3) If the stability prediction model is based on a single machine learning model, the hyperparameters of each machine learning model are first determined using the INFO algorithm. In the case of the IN-Voting model, the INFO algorithm is required to determine the weight values of the weak learners.
(4) The training data are fed into the initial machine learning model, and the test set data are used to finalize the stability prediction model for soil-rock mixture slopes.
2.4 Evaluation indicators
For evaluating the prediction performance of the proposed model, the following three indicators are used: The coefficient of determination (R2) that uses the mean value as the error base; the mean squared error (MSE) that reflects the difference degree between the estimated volume and the estimated volume; the mean absolute error (MAE) representing the absolute value of the deviation of all individual observations from the arithmetic mean. As the most important evaluation indicators in this study, the R2 closer to one and smaller MSE and MAE values indicate higher prediction accuracy. The equations of the three indicators are as follows:
where
3 Sample analysis
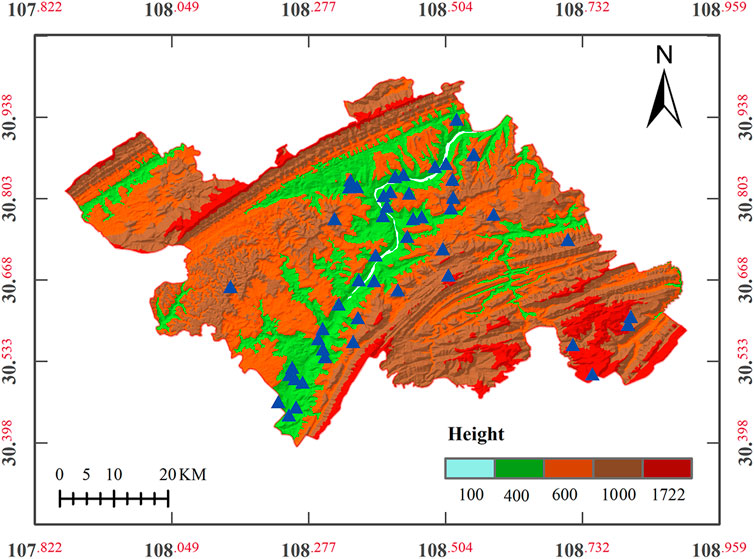
The sample data were obtained from Wanzhou District (Chongqing, China), located in the Yangtze River valley zone of the northeast ridge and valley province of Chuandong. The terrain is high in the east and low in the west, with sufficient rainfall and strata containing rocky sand (Chen et al., 2021). A large number of slopes with mixed soil and rock are developed in this area, with frequent geological hazards. In this study, 49 soil-rock mixture slopes investigated in the previous study are used as the sample for analysis (Cheng, 2009), as shown in the blue-triangle points in Figure 4.
Soil-rock mixture slopes are distinguished from soil slopes and rock slopes. Its slope material is complex and has significant inhomogeneity. As a result, there are many factors affecting the stability of soil-rock mixture slopes, and it is difficult to obtain the parameters of such slopes. In slope stability analysis, the stability coefficient is correlated to the slip resistance and sliding force of the slope body. Therefore, the input parameters in this study are typical structural factors of soil-rock mixture slopes, including rock content, surface inclination, slope angle, and slope height.
In soil-rock mixtures, the rock content is a key parameter in determining the physical-mechanical properties and directly affects the weight, cohesion, and internal friction angle (Kalender et al., 2014). The rock contact, the rock content greatly contribute to the stability coefficient of soil-rock nixture slopes (Wang et al., 2022a; Wang et al., 2022b; Wang et al., 2022c). If there are multicollinearities among the input parameters in machine learning, the accuracy of the prediction model can be affected (Hitouri et al., 2022; Selamat et al., 2022; Xia et al., 2022). Therefore, this study uses rock content as an input parameter instead of weight, cohesion, and internal friction angle. The bedrock surface is the interface separating the soil and rock mixture from the underlying bedrock. Since the base overburden provides the soil-rock mixture slope with a typical binary structure, it is an important factor affecting the overall stability of the soil-rock mixture slopes. Slope angle and slope height are important geometric features significantly affecting the stability of slopes. With the increase of slope height and angle, the slope stability gradually decreases.
As shown in Figure 5, the slope angle ranges from 9°–15°, the base cover dip angle is 5°–13°, the slope height is in the range of 40 m–100 m, and the rock content ranges from 22%–60%. These data characteristics are consistent with the histogram (Figure 5) and the Gaussian curve.

FIGURE 5. Analysis of input parameters (A) slope angle; (B) bedrock inclination; (C) slope height; (D) rock content.
In Figure 6, the single-peak curve distribution characterized by four input parameters and one output parameter reduces the difficulty of data analysis and improves the prediction accuracy of the model. The ten subplots at the lower triangle show the scatter distribution among the parameters. It can be seen that there is no multicollinearity among the four input parameters, which is consistent with the above analysis. The Pearson’s r values in ten subplots of the four input parameters have different correlations with the stability coefficients, Meanwhile slope angle, and slope height show a significant negative correlation with the stability coefficient. The rock content is positively correlated with the stability coefficient, with larger rock content indicating a greater stability coefficient.

FIGURE 6. Correlation and statistical distribution of parameters related to soil-rock mixture slopes.
4 Results
4.1 Single machine learning models
In this study, the prediction performance of 12 single machine learning models based on the INFO intelligent optimization algorithm is analyzed with R2 as the main indicator and MSE and MAE as supplementary indicators, as shown in Figure 7. In Figure 7A, all models have R2 values greater than 0.6. Twelve machine learning models can be divided into three sections: BYS, LAS, ELN, and HBR have R2 values between 0.6 and 0.7, with the lowest prediction accuracy among the 12 machine learning models; The R2 values of ADBT, KNN, SGD, and SVM models are in the range of 0.7–0.9, with the highest value of 0.8746 for the KNN model; The R2 values of ETR, GBDT, MLP, and RFR models are greater than 0.90, with MLP having the highest R2 value of 0.9681. As shown in Figure 7B, only ETR, GBDT, MLP, and RFR have MSE values less than 0.05, where ETR has the lowest MSE value of 0.043, followed by MLP. In Figure 7C, ETR, GBDT, MLP, and RFR have MAE values less than 0.005, with MLP having the lowest MAE of 0.0027.
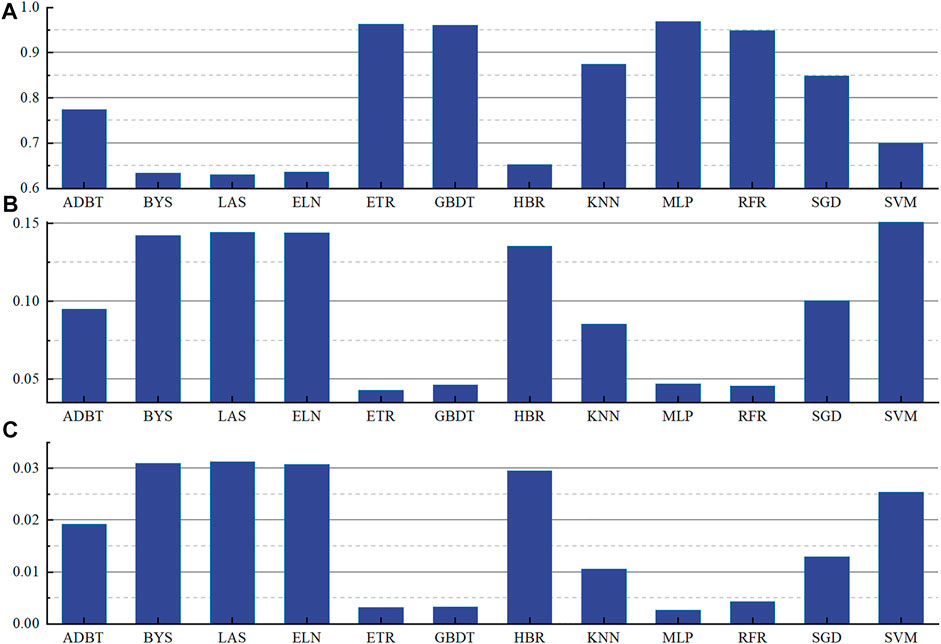
FIGURE 7. Values Model evaluation indicators under INFO algorithm optimization (A) R2; (B) MSE; (C) MAE.
According to the model evaluation criteria in this paper, the R2 and MSE evaluation index values of MLP model are the best, which shows that compared with other models, the model has a very strong adaptive and self-learning function, so it has a higher prediction performance for a small number of samples.
4.2 Novel ensemble learning model—IN-voting
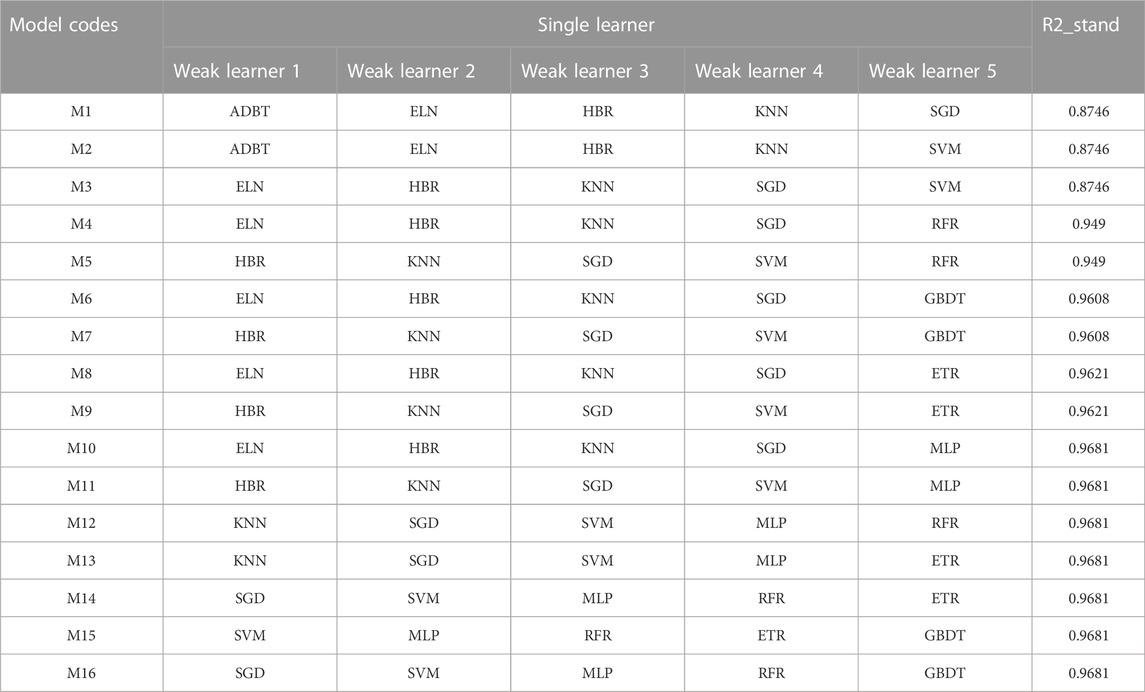
In this paper, five of the twelve single machine learning models are randomly selected to be rearranged as weak learners in IN-Voting. With the accuracy of model optimization and the optimization time of the IN-Voting model as the criteria, 16 results in Table 1 are obtained. In addition, the maximum R2 among five weak learner combinations is used as the theoretical minimum value of the IN-Voting model, denoted as R2_stand. The INFO algorithm is then used to determine the weight values matched by the five weak learners in the IN-Voting model to maximize the prediction accuracy of 16 IN-Voting models and further improve the robustness and credibility of the ensemble model.
The evaluation indicators for the 16 ensemble IN-Voting learning models are shown in Figure 8. The left and right vertical coordinates in Figure 8A are the values of R2 and R2_stand predicted by 16 ensemble IN-Voting learning models. Figures 8B,C show the values of MSE and MAE of the sixteen ensemble IN-Voting learning models. In Figure 8D, the left vertical coordinate indicates the degree of accuracy improvement (Difference value) for the sixteen IN-Voting models based on the five weak learners, and the right vertical coordinate is the optimization time taken by the INFO algorithm for each IN-Voting model. The Difference value is the difference between the R2 and R2_stand of the sixteen ensemble IN-Voting learning models. By comparing Figure 8A with Figure 8D, the advantage of the IN-Voting model can be more significantly represented using the Difference value.
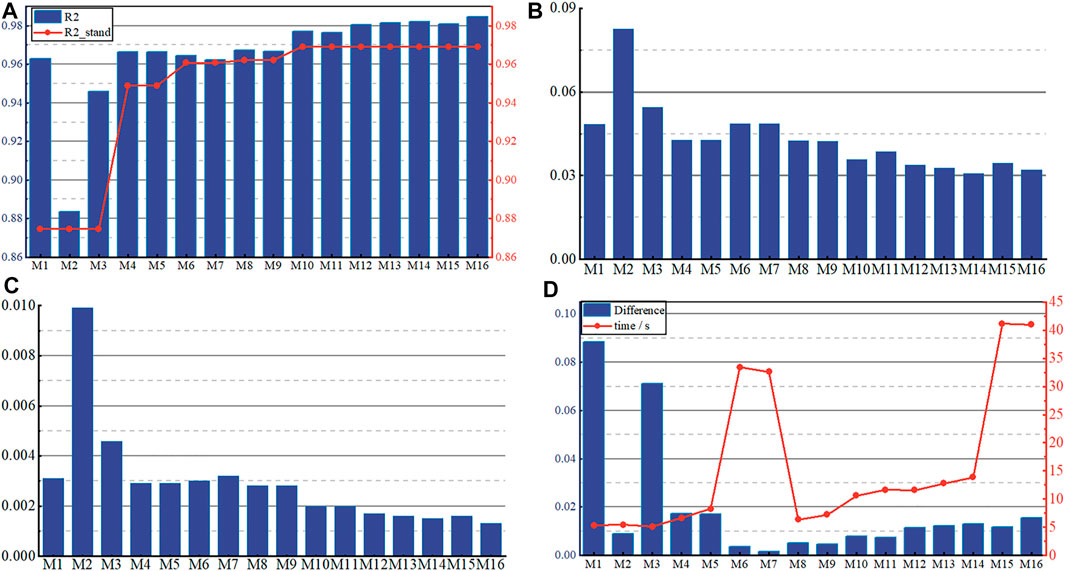
FIGURE 8. Indicators for the 16 IN-Voting models (A) R2 and the distribution of maximum R2 in each combination; (B) The distribution of MSE; (C) The distribution of MAE; (D) Difference values and optimization time.
As can be seen in Figure 8A, the R2 of all 16 groups of IN-Voting models is higher than the R2_stand value, indicating the high feasibility and robustness of the IN-Voting ensemble learning model. Especially in the M10—M16 groups, the MLP models with the highest prediction performance were included, and the R2 index values were higher than 0.9681, with the highest R2 of 0.9846 for the M16 group. In Figures 8B,C, the MSE and MAE values of the M2 group model are the highest, which are 0.0825 and 0.0099, respectively. The MSE values of the seven prediction models from M10 ∼ M16 are all less than 04, with the M14 group having the lowest MSE value of 0.308. The MAE accuracy index values of these seven groups are less than or equal to 0.002, with M16 having the lowest value of 0.0013. In Figure 8D, the prediction accuracy of 16 ensemble IN-Voting learning models is improved to different degrees. M1 and M3 have the greatest improvement with Difference values of 0.0884 and 0.0712, respectively. In M10 ∼ M16 with 0.9681 as the theoretical minimum of the IN-Voting model, the Difference values are all in the range of 0.01–0.016, with M16 improving the most with the Difference value of 0.0155. Among 16 IN-Voting models, M1, M2, M3, M8, and M9 have the shortest optimization time, and M6, M7, M15, and M16 have the longest optimization time. Therefore, the INFO algorithm is efficient in improving the prediction accuracy of the IN-Voting model.
Among the five evaluation indicators, R2 and model optimization capability are the main indicators, and MSE, MAE, and optimization time are the supplementary indicators. It can be seen from Figure 8 that from M10 ∼ M16, the model optimization times of M10 ∼ M14 are relatively less, while these models have fewer overall improvements than the M16 group. Although the optimization time of M16 is relatively long, its R2 and optimization performance are the highest among all prediction models.
The five indicators in Figure 8 are known, the ensemble IN-Voting learning model consisting of SGD, SVM, MLP, RFR, and GBDT is finally selected as the stability prediction model for soil-rock mixture slopes.
4.3 Importance ranking of input parameters for the stability prediction
Due to the complex mechanical properties and material properties of soil-rock mixtures, it is necessary to rank the structural factors (rock content, bedrock inclination, slope angle, and slope height) that affect the stability of soil-rock mixture slopes. Based on the ensemble IN-Voting learning model for the M16 group, this study uses the Permutation Importance method to obtain feature importance rankings.
The main idea of the Permutation Importance method is to randomly rearrange a column of the dataset in the trained model for prediction. The loss function is calculated using the predicted value and the true target value, and the difference due to random sequencing is obtained. In this way, the influence of each feature on the stability prediction is ranked, and the final importance ranking of the features is obtained. The calculation can be expressed as follows:
where
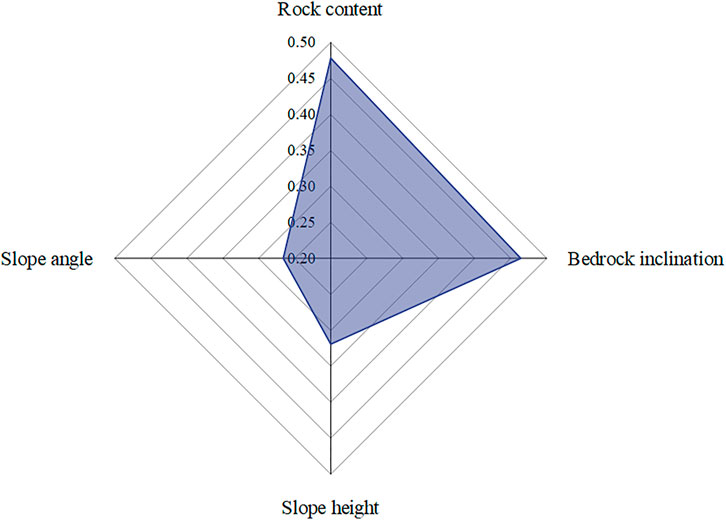
Figure 9 shows the importance of four input parameters in descending order: rock content, bedrock inclination, slope height, and slope angle, which ordinate shows their specific values. Rock content is a structural factor of soil-rock mixture slopes, and its influence on slope stability widely varies (Yang et al., 2020). Therefore, for the engineering evaluation of soil-rock mixture slopes, the rock content can be firstly considered, followed by the bedrock inclination.
5 Discussion
In this study, a novel modeling structure is developed by coupling the INFO algorithm and machine learning algorithm (including the single machine learning algorithm and ensemble learning algorithm) to form stability prediction models for soil-rock mixture slopes. The novel ensemble learning model developed shows the highest prediction accuracy.
Qi and Tang, 2018 concluded that the support vector machine model based on the firefly optimization algorithm had the highest prediction accuracy. Xue (2016) found that the least square support vector machine model based on the particle swarm algorithm could significantly improve the prediction accuracy. In this study, the INFO intelligent optimization algorithm is used to finalize the hyperparameters of a single machine learning algorithm. By comparing the prediction accuracy of the models, it is found that MLP presents more effective in predicting non-linear and small sample datasets. Among the novel ensemble learning models based on the INFO algorithm, the IN-Voting model consisting of five single machine learning algorithms (SGD, SVM, MLP, RFR, and GBDT) exhibits higher prediction accuracy than other models. On the one hand, the INFO intelligent optimization algorithm improves the model prediction performance more significantly in the Voting combination of five weak learners with low prediction accuracy. For example, the prediction accuracy of the M1 group is higher than that of the five weak learners. On the other hand, the INFO intelligent optimization algorithm can also improve the prediction accuracy by about 0.01 in the Voting combination with high prediction accuracy of the weak learner itself. Based on the R2 values of single machine learning models and ensemble learning models under the INFO algorithm, the ensemble learning model has higher prediction accuracy (Pham et al., 2021).
In the new ensemble learning model, the complexity of the M16 is higher, resulting in a longer model optimization time. Therefore, in the stability prediction of soil-rock mixture slopes, the prediction accuracy of the model should be maximized with reduced model complexity. Moreover, the dual structure of soil-rock mixture slopes is complex, in which the distribution ratio of soil and rocks has a great influence on the prediction difficulty of slope stability (Dong et al., 2020; Xu and Zhang, 2021; Zhao et al., 2021). Therefore, in the prediction of slope stability, the soil content of 30%, 60%, and 90% can be divided into four intervals to study the characteristics of stability prediction.
6 Conclusion
In this study, two types of stability prediction models for soil-rock mixture slopes are developed through INFO, including 12 single machine learning models and 16 novel IN-Voting ensemble learning models with different combinations of weak learners. The stability coefficients of the two prediction models are examined in detail. Based on the three evaluation indicators, the novel IN-Voting ensemble learning model shows the best prediction performance. Finally, the importance analysis is performed for factors affecting slope stability, providing a new idea for stability prediction of soil-rock mixture slopes. The conclusions of this study are as follows.
(1) Among the 12 single stability prediction models, MLP has a highest prediction accuracy of 0.9681, which for non-linear data of Soil-rock mixture slopes. The MLP model plays an important role in the IN-Voting ensemble learning model.
(2) The 16 novel ensemble learning models are validated using data on mixed earth and rock slopes that have been investigated in detail. The results show that the R2 of each IN-Voting model is higher than that of the five single weak learner models. In addition, the MSE and MAE are less than 0.01. The M16 group IN-Voting ensemble learning model has the highest prediction accuracy with R2, MSE, and MAE of 0.9846, 0.0321, and 0.0013, respectively.
(3) The Permutation Importance method and the novel IN-Voting ensemble learning model developed by the M16 group are used to analyze the importance of factors affecting the stability of soil-rock mixture slopes. The four parameters in descending order are rock content, bedrock inclination, slope height, and slope angle. Therefore, in the engineering evaluation and treatment of soil-rock mixture slopes, the influence of the rock content rate and bedrock inclination should be emphasized.
Data availability statement
The raw data supporting the conclusions of this article will be made available by the authors, without undue reservation.
Author contributions
Conceptualization, BZ; methodology, XF; software, XF; investigation, JD; resources, YL; data curation, LW; writing-original draft preparation, YW; writing-review and editing, BZ.
Funding
This research is supported by the Guizhou Provincial Science and Technology Projects [Grant Nos. (2019)1169 and (2019)1173], Guizhou Education Department Foundation for Youth, China [Grant No. (2018)151], and Scientific Research Platform of Guizhou Minzu University [GZMUSYS (2021)01].
Conflict of interest
The authors declare that the research was conducted in the absence of any commercial or financial relationships that could be construed as a potential conflict of interest.
Publisher’s note
All claims expressed in this article are solely those of the authors and do not necessarily represent those of their affiliated organizations, or those of the publisher, the editors and the reviewers. Any product that may be evaluated in this article, or claim that may be made by its manufacturer, is not guaranteed or endorsed by the publisher.
References
Ahmadianfar, I., Heidari, A. A., Noshadian, S., Chen, H., and Gandomi, A. H. (2022). INFO: An efficient optimization algorithm based on weighted mean of vectors. Expert Syst. Appl. 195, 116516. doi:10.1016/j.eswa.2022.116516
Almansi, K. Y., Shariff, A. R. M., Kalantar, B., Abdullah, A. F., Ismail, S. N. S., and Ueda, N. (2022). Performance evaluation of hospital site suitability using multilayer Perceptron (MLP) and analytical hierarchy process (AHP) models in malacca, Malaysia. Sustainability 14, 3731. doi:10.3390/SU14073731
Bui, D. T., Shirzadi, A., Chapi, K., Shahabi, H., Pradhan, B., Pham, B. T., et al. (2019). A hybrid computational intelligence approach to groundwater spring potential mapping. Water 11, 2013. doi:10.3390/w11102013
Cen, D., Huang, D., and Ren, F. (2017). Shear deformation and strength of the interphase between the soil–rock mixture and the benched bedrock slope surface. Acta Geotech. 12, 391–413. doi:10.1007/s11440-016-0468-2
Chen, X., Shi, C., Ruan, H.-N., and Yang, W.-K. (2021). Numerical simulation for compressive and tensile behaviors of rock with virtual microcracks. Arabian J. Geosciences 14, 870. doi:10.1007/s12517-021-07163-7
Cheng, G. (2009). Development of classification scheme on the stability of accumulative slopes and its application in three Gorges Reservoir area. Beijing, China: Institute of Geology and Geophysics Chinese Academy of Sciences. [in chinese].
Cheng, J., Dai, X., Wang, Z., Li, J., Qu, G., Li, W., et al. (2022). Landslide susceptibility assessment model construction using typical machine learning for the three Gorges Reservoir area in China. Remote Sens. 14, 2257. doi:10.3390/rs14092257
Cortes, C., and Vapnik, V. (1995). Support-vector networks. Mach. Learn. 20, 273–297. doi:10.1023/A:1022627411411
Cover, T. M., and Hart, P. E. (1967). Nearest neighbor pattern classification. IEEE Trans. Inf. Theory 13, 21–27. doi:10.1109/tit.1967.1053964
Deng, B. (2020). Machine learning on density and elastic property of oxide glasses driven by large dataset. J. Non-Crystalline Solids 529, 119768. doi:10.1016/j.jnoncrysol.2019.119768
Dong, H., Peng, B., Gao, Q.-F., Hu, Y., and Jiang, X. (2020). Study of hidden factors affecting the mechanical behavior of soil–rock mixtures based on abstraction idea. Acta Geotech. 16, 595–611. doi:10.1007/s11440-020-01045-0
Feng, H., Miao, Z., and Hu, Q. (2022). Study on the uncertainty of machine learning model for earthquake-induced landslide susceptibility assessment. Remote Sens. 14, 2968. doi:10.3390/RS14132968
Freund, Y., and Schapire, R. E. (1995). A desicion-theoretic generalization of on-line learning and an application to boosting. Lect. Notes Comput. Sci. 904, 23–37. doi:10.1007/3-540-59119-2_166
Friedman, J. H. (2002). Stochastic gradient boosting. Comput. Statistics Data Analysis 38, 367–378. doi:10.1016/s0167-9473(01)00065-2
Gao, W.-W., Gao, W., Hu, R.-L., Xu, P.-F., and Xia, J.-G. (2018). Microtremor survey and stability analysis of a soil-rock mixture landslide: A case study in baidian town, China. Landslides 15, 1951–1961. doi:10.1007/s10346-018-1009-x
Gelman, A. (2015). Bayesian and frequentist regression methods. Statistics Med. 34, 1259–1260. doi:10.1002/sim.6427
Geurts, P., Ernst, D., and Wehenkel, L. (2006). Extremely randomized trees. Mach. Learn. 63, 3–42. doi:10.1007/s10994-006-6226-1
Ghatkar, J. G., Singh, R. K., and Shanmugam, P. (2019). Classification of algal bloom species from remote sensing data using an extreme gradient boosted decision tree model. Int. J. Remote Sens. 40, 9412–9438. doi:10.1080/01431161.2019.1633696
Hitouri, S., Varasano, A., Mohajane, M., Ijlil, S., Essahlaoui, N., Ali, S. A., et al. (2022). Hybrid machine learning approach for gully erosion mapping susceptibility at a watershed scale. ISPRS Int. J. Geo-Information 11, 401. doi:10.3390/ijgi11070401
Ho, T. K. (1998). The random subspace method for constructing decision forests. IEEE Trans. Pattern Anal. Mach. Intell. 20, 832–844. doi:10.1109/34.709601
Kalender, A., Sonmez, H., Medley, E., Tunusluoglu, C., and Kasapoglu, K. E. (2014). An approach to predicting the overall strengths of unwelded bimrocks and bimsoils. Eng. Geol. 183, 65–79. doi:10.1016/j.enggeo.2014.10.007
Kombo, O. H., Kumaran, S., Sheikh, Y. H., Bovim, A., and Jayavel, K. (2020). Long-term groundwater level prediction model based on hybrid KNN-RF technique. Hydrology 7, 59. doi:10.3390/hydrology7030059
Lee, S. J., Tseng, C. H., Yang, H. Y., Jin, X., Jiang, Q., Pu, B., et al. (2022). Random RotBoost: An ensemble classification method based on rotation forest and AdaBoost in random subsets and its application to clinical decision support. Entropy (Basel) 24, 617. doi:10.3390/e24050617
Leeuw, J. D. (2009). Journal of statistical software, Hoboken, NJ, USA: Wiley Interdisciplinary Reviews: Computational Statistics, 128–129. doi:10.1002/wics.10
Lin, S., Zheng, H., Han, C., Han, B., and Li, W. (2021). Evaluation and prediction of slope stability using machine learning approaches. Front. Struct. Civ. Eng. 15, 821–833. doi:10.1007/s11709-021-0742-8
Liu, L., Mao, X., Xiao, Y., Wu, Q., Tang, K., and Liu, F. (2019). Effect of rock particle content on the mechanical behavior of a soil-rock mixture (SRM) via large-scale direct shear test. Adv. Civ. Eng. 2019–16. doi:10.1155/2019/6452657doi:6452657
Liu, Z., Qiu, H., Zhu, Y., Liu, Y., Yang, D., Ma, S., et al. (2022). Efficient identification and monitoring of landslides by time-series InSAR combining single- and multi-look phases. Remote Sens. 14, 1026. doi:10.3390/rs14041026
Peng, C.-Y., Ren, Y.-F., Ye, Z.-H., Zhu, H.-Y., Liu, X.-Q., Chen, X.-T., et al. (2022). A comparative UHPLC-Q/TOF-MS-based metabolomics approach coupled with machine learning algorithms to differentiate Keemun black teas from narrow-geographic origins. Food Res. Int. 158, 111512. doi:10.1016/J.FOODRES.2022.111512
Pham, K., Kim, D., Park, S., and Choi, H. (2021). Ensemble learning-based classification models for slope stability analysis. Catena 196, 104886. doi:10.1016/j.catena.2020.104886
Qi, C., and Tang, X. (2018). Slope stability prediction using integrated metaheuristic and machine learning approaches: A comparative study. Comput. Industrial Eng. 118, 112–122. doi:10.1016/j.cie.2018.02.028
Qiu, H., Zhu, Y., Zhou, W., Sun, H., He, J., and Liu, Z. (2022). Influence of DEM resolution on landslide simulation performance based on the Scoops3D model. Geomatics, Nat. Hazards Risk 13, 1663–1681. doi:10.1080/19475705.2022.2097451
Ramos-Bernal, R. N., Vázquez-Jiménez, R., Cantú-Ramírez, C. A., Alarcón-Paredes, A., Alonso-Silverio, G. A., Bruzón, G., et al. (2021). Evaluation of conditioning factors of slope instability and continuous change maps in the generation of landslide inventory maps using machine learning (ML) algorithms. Remote Sens. 13, 4515. doi:10.3390/rs13224515
Ray, A., Kumar, V., Kumar, A., Rai, R., Khandelwal, M., and Singh, T. N. (2020). Stability prediction of Himalayan residual soil slope using artificial neural network. Nat. Hazards 103, 3523–3540. doi:10.1007/s11069-020-04141-2
Selamat, S. N., Majid, N. A., Taha, M. R., and Osman, A. (2022). Landslide susceptibility model using artificial neural network (ANN) approach in langat river basin, selangor, Malaysia. Land 11, 833. doi:10.3390/land11060833
Sevi, M., and İ, A. (2020). “COVID-19 detection using deep learning methods,” in 2020 International Conference on Data Analytics for Business and Industry: Way Towards a Sustainable Economy (ICDABI)) (Sakheer, Bahrain, 1–6. doi:10.1109/ICDABI51230.2020.9325626
Shahzad, N., Ding, X., and Abbas, S. (2022). A comparative assessment of machine learning models for landslide susceptibility mapping in the rugged terrain of northern Pakistan. Appl. Sci. 12, 2280. doi:10.3390/app12052280
Sun, Q., Zhou, W. X., and Fan, J. (2020). Adaptive huber regression. J. Am. Stat. Assoc. 115, 254–265. doi:10.1080/01621459.2018.1543124
Wagenaar, D., Jong, J. D., and Bouwer, L. M. (2017). Multi-variable flood damage modelling with limited data using supervised learning approaches. Nat. Hazards Earth Syst. Sci. 17, 1683–1696. doi:10.5194/nhess-17-1683-2017
Wang, L., Qiu, H., Zhou, W., Zhu, Y., Liu, Z., Ma, S., et al. (2022). The post-failure spatiotemporal deformation of certain translational landslides may follow the pre-failure pattern. Remote Sens. 14, 2333. doi:10.3390/rs14102333
Wang, Y., Mao, T., Xia, Y., Li, X., and Yi, X. (2022b10701). Macro-meso fatigue failure of bimrocks with various block content subjected to multistage fatigue triaxial loads. Int. J. Fatigue 163, 107014. doi:10.1016/j.ijfatigue.2022.107014
Wang, Y., Su, Y., Xia, Y., Wang, H., and Yi, X. (2022a). On the effect of confining pressure on fatigue failure of block-in-matrix soils exposed to multistage cyclic triaxial loads. Fatigue & Fract. Eng. Mater. Struct. 45 (9), 2481–2498. doi:10.1111/ffe.13760
Wang, Y., Yi, X. F., Li, P., Cai, M. F., and Sun, T. (2022c). Macro-meso damage cracking and volumetric dilatancy of fault block-in-matrix rocks induced by freeze–thaw-multistage constant amplitude cyclic (F-T-MSCAC) loads. Fatigue & Fract. Eng. Mater. Struct. 45 (10), 2990–3008. doi:10.1111/ffe.13798
Wu, C.-Y., and Lin, S.-Y. (2022). Performance assessment of event-based ensemble landslide susceptibility models in shihmen watershed, taiwan. Water 14 (5), 717. doi:10.3390/w14050717
Xia, D., Tang, H., Sun, S., Tang, C., and Zhang, B. (2022). Landslide susceptibility mapping based on the germinal center optimization algorithm and support vector classification. Remote Sens. 14, 2707. doi:10.3390/rs14112707
Xu, W.-J., Hu, L.-M., and Gao, W. (2016). Random generation of the meso-structure of a soil-rock mixture and its application in the study of the mechanical behavior in a landslide dam. Int. J. Rock Mech. Min. Sci. 86, 166–178. doi:10.1016/j.ijrmms.2016.04.007
Xu, W.-J., and Zhang, H.-Y. (2021). Research on the effect of rock content and sample size on the strength behavior of soil-rock mixture. Bull. Eng. Geol. Environ. 80, 2715–2726. doi:10.1007/s10064-020-02050-z
Xue, X. (2016). Prediction of slope stability based on hybrid PSO and LSSVM. J. Comput. Civ. Eng. 31, 04016041. doi:10.1061/(asce)cp.1943-5487.0000607
Yang, Y., Sun, G., Zheng, H., and Yan, C. (2020). An improved numerical manifold method with multiple layers of mathematical cover systems for the stability analysis of soil-rock-mixture slopes. Eng. Geol. 264, 105373. doi:10.1016/j.enggeo.2019.105373
Yue, Z. Q., Chen, S., and Tham, L. G. (2003). Finite element modeling of geomaterials using digital image processing. Comput. Geotechnics 30, 375–397. doi:10.1016/s0266-352x(03)00015-6
Zhang, Y., Ge, T., Tian, W., and Liou, Y.-A. (2019). Debris flow susceptibility mapping using machine-learning techniques in shigatse area, China. Remote Sens. 11, 2801. doi:10.3390/rs11232801
Zhao, L., Huang, D., Zhang, S., Cheng, X., Luo, Y., and Deng, M. (2021). A new method for constructing finite difference model of soil-rock mixture slope and its stability analysis. Int. J. Rock Mech. Min. Sci. 138, 104605. doi:10.1016/j.ijrmms.2020.104605
Zhao, L., Qiao, N., Huang, D., Zuo, S., and Zhang, Z. (2022). Numerical investigation of the failure mechanisms of soil–rock mixture slopes by material point method. Comput. Geotechnics 150, 104898. doi:10.1016/j.compgeo.2022.104898
Zhou, C., Ai, D., Huang, W., Xu, H., Ma, L., Chen, L., et al. (2021). Emergency survey and stability analysis of a rainfall-induced soil-rock mixture landslide at chongqing city, China. Front. Earth Sci. 9, 774200. doi:10.3389/feart.2021.774200
Keywords: soil-rock mixture slope, machine learning, ensemble learning model, stability prediction, feature importance
Citation: Fu X, Zhang B, Wang L, Wei Y, Leng Y and Dang J (2023) Stability prediction for soil-rock mixture slopes based on a novel ensemble learning model. Front. Earth Sci. 10:1102802. doi: 10.3389/feart.2022.1102802
Received: 19 November 2022; Accepted: 28 December 2022;
Published: 10 January 2023.
Edited by:
Haijun Qiu, Northwest University, ChinaReviewed by:
Yu Wang, University of Science and Technology Beijing, ChinaYuanjun Jiang, Institute of Mountain Hazards and Environment (CAS), China
Copyright © 2023 Fu, Zhang, Wang, Wei, Leng and Dang. This is an open-access article distributed under the terms of the Creative Commons Attribution License (CC BY). The use, distribution or reproduction in other forums is permitted, provided the original author(s) and the copyright owner(s) are credited and that the original publication in this journal is cited, in accordance with accepted academic practice. No use, distribution or reproduction is permitted which does not comply with these terms.
*Correspondence: Bo Zhang, emhhbmdib19kenNAMTI2LmNvbQ==
 Xiaodi Fu
 Bo Zhang
 Linjun Wang1,2
 Yong Wei