 Jia Liu
 Fengshan Ma1,2*
 Yewei Song
94% of researchers rate our articles as excellent or good
Learn more about the work of our research integrity team to safeguard the quality of each article we publish.
Find out more
ORIGINAL RESEARCH article
Front. Earth Sci., 11 January 2023
Sec. Environmental Informatics and Remote Sensing
Volume 10 - 2022 | https://doi.org/10.3389/feart.2022.1101807
This article is part of the Research TopicAdvances in Development and Utilization of Underground SpaceView all 17 articles
Commensurate with economic globalization, the demand for mineral resources is increasing. With increased mining activity, problems related to ground subsidence and rock movement are becoming increasingly prominent, even affecting mining production activities. However, the physical mechanisms behind the ground subsidence phenomenon have been poorly studied, especially for metal mines with a steep dip. This paper applies the Interferometric Synthetic Aperture Radar (InSAR) technique and the numerical simulation method to deduce the characteristics of rock movement in the Xinli deposit of the steeply inclined Sanshandao gold mine. The InSAR results indicate that more subsidence has occurred in the southern part of the Xinli Village coastline area than in the northern part. This is also supported by the numerical simulation results obtained by the fast Lagrangian analysis of continua in three dimensions (FLAC3D). Notably, the range of ground subsidence obtained by numerical simulation shows an obvious asymmetry. The monitoring data of the No. 55 prospecting profile offer a plausible explanation for this, as the surrounding rock of the fault’s hanging wall has a wider range of rock movements. Furthermore, the sublevels of the No. 55 prospecting profile at different depths show different rock movement characteristics, and a logistic function can be well applied to the right part of the settlement curve; the parameter “a” in the function formula is very close to the maximum subsidence value for each sublevel. We defined the ratio “r” to measure the difference between the maximum subsidence value and the corresponding parameter “a” and found this value to be positively correlated with the fractal dimension value of deeper sublevels (−320 m, −400 m, −480 m, and −600 m) and negatively correlated with the fractal dimension value of lower sublevels (−200 m and −240 m).
The rapid development of the global economy has led to an increase in the demand for ore resources, which has forced the surging exploitation and deeper exploitation of minerals (Wagner, 2019; Li et al., 2020a; Xu et al., 2021). This means that problems caused by mining also arise, such as ground subsidence, water inrush accidents, and rock burst phenomena (Meng et al., 2012; Sepehri et al., 2020; Li et al., 2022). Numerous researchers have investigated rock movement characteristics and failure mechanisms of relatively gentle coal (Cui et al., 2001; Ren et al., 2014; Adhikary and Guo, 2015; Ghabraie et al., 2015; Adhikary et al., 2016; Cheng et al., 2017; Tuncay et al., 2021). Since the 19th century, relevant theoretical research has gradually developed due to the needs of increased mining production activities (Whittaker and Reddish, 1989). Later, mature theoretical methods were gradually applied to study ground subsidence. For instance, the influence function method has been popular since the 1950s and serves as the foundational principle behind Knothe’s theory (Kwinta and Gradka, 2020); and the random medium theory, introduced by the Polish scholar Litviniszyn, is a theoretical study of ground subsidence based on the random walk model (Litwiniszyn, 1954; Jiang et al., 2019). At the end of the 20th century, numerous empirical and theoretical methods were gradually developed. In China, the probability integration model created by Liu and Liao is the most frequently applied prediction method in mining-induced subsidence (Liu and Liao, 1965; Liu and Dai, 2016; Hu et al., 2022). The empirical method mostly combines actual monitoring data with suitable mathematical functions, such as varied profile function methods and typical curve methods (Diez and Alvarez, 2000; Xu and Li, 2005; Chen et al., 2016; Meng et al., 2021). Numerical models also played an important role in studying ground subsidence induced by mining (Xie et al., 1999; Sheorey et al., 2000; Park et al., 2005; Svartsjaern et al., 2016).
Although horizontal coal seams are common in mining production activities, there are also numerous steeply inclined coal seams worldwide; however, the study of steeply inclined coal is far from adequate (Alejano et al., 1999; Dai et al., 2002; Asadi et al., 2005; Tu et al., 2015), let alone steeply dipped metal orebodies (Diez and Alvarez, 2000; Ma and Ding, 2009; Zhao et al., 2013a; Li et al., 2022). Metal mining differs from coal mining in many aspects and cannot be treated the same (Cao, 2019). First, the formation conditions and environment of geological occurrence for metal orebodies are more complex and specialized than those of coal mines (Gastaldo et al., 1993; Bai et al., 2002; Villegas et al., 2011; Jiráseka et al., 2018). Second, the two differ in terms of their associated mining methods and techniques. Longwall mining is particularly prevalent in coalfields (Ren et al., 2014), while the filling mining method is popular in metal mines (Holla and Buizen, 1991; Li et al., 2004; Li et al., 2020b). Regardless, it is important and meaningful to study the ground subsidence and rock movement phenomenon caused by the mining of inclined metal orebodies.
With the rapid development of the Interferometric Synthetic Aperture Radar (InSAR) technique, high-resolution SAR imagery has become beneficial to understanding ground deformation influenced by natural hazards or human activities (Yerro et al., 2014; Valkaniotis et al., 2018; Murgia et al., 2019). For instance, the advanced time-series InSAR technology (the small baseline subset technique and the Persistent Scatterer Interferometry technique) has been well developed in the past few decades (Berardino, Fornaro, Lanari, Sansosti; Ferretti et al., 2001; Aly et al., 2012; Foroughnia et al., 2018), especially in applications related to ground subsidence (Sócrates et al., 2020; Tarighat et al., 2021; Bao et al., 2022). In addition, numerical simulation and theoretical research on rock movements are also important. For instance, the fractal theory has been applied in rock mechanics (Xie and Pariseau, 1993; Shen, 2002; Biancolini et al., 2006). In fact, the fractal phenomenon reflects the self-organized criticality (SOC) characteristic of a complex system (Bak et al., 1987; Qin, 2000); that is, the system tends to reach a new equilibrium after being disturbed.
In this paper, we applied InSAR techniques to monitor the ground subsidence induced by mining a steeply inclined metal orebody. We used FLAC3D software to build a realistic depiction of the Xinli deposit in a Sanshandao gold mine model and simulated the excavation process. The essence of ground subsidence in the mining area is related to the movement of the deep rock mass. We took the No. 55 prospecting profile of the Xinli deposit of the Sanshandao gold mine as the study subject, formulated the subsidence curves by a logistic function, and analyzed the subsidence velocity of each sublevel by the fractal theory. We found that the fractal dimension is related to one parameter in the logistic function formula and is also relevant to the mining activities of each sublevel, especially sublevels characterized by a “funnel”-type subsidence curve. In general, we provide a comprehensive understanding of ground subsidence and rock movement caused by a steeply inclined metal mine after analyzing the monitoring data of the ground and surrounding rock. This may offer a reference for other mines with similar geological conditions. Hereafter, we will focus more on the deformation characteristic of the jointed rock mass to better study the rock movement mechanism of a steeply inclined metal mine.
The study area is located in Xinli Village, Laizhou City, Shandong Province. As shown in Figure 1, Xinli Village is remotely situated on the west coast of the Shandong Peninsula, bordering the Bohai Sea. The Xinli deposit of the Sanshandao gold mine is the only coastal metal orebody in China, which has a large dip angle. The study area is situated in the eastern area of the Tan−Lu fault, the northeastern area of the Sanshandao−Cangshang fault zone, and the north limb of the Qixia anticlinorium. The exposed strata in the mining area are the Lugezhuang Formation of the Paleoproterozoic Jingshan Group, found in the Lujia unit of the Qixia super unit (Zhao et al., 2013b). The fault F1 is the ore-controlling fault with an extended depth of about 1000 m, with a strike of 62°, and an average dip angle of 46° in the study area. The altered rocks are zoned along the F1 fault, whose lithology mainly includes different types of granite and cataclasite. The upper surface, corresponding to the main part of the mining area, is comprised of a silt layer and seawater. In Figure 1, the area encircled by the dotted yellow line is the Xinli deposit of the Sanshandao gold mine. According to the available reports, the horizontal tectonic stress in the mining area is significant; the maximum horizontal principal stress lies in a nearly horizontal direction (NNW direction). The maximum horizontal principal stress, the minimum horizontal principal stress, and the vertical principal stress increase with the increasing depth, and they share a nearly linear relationship.
Here,
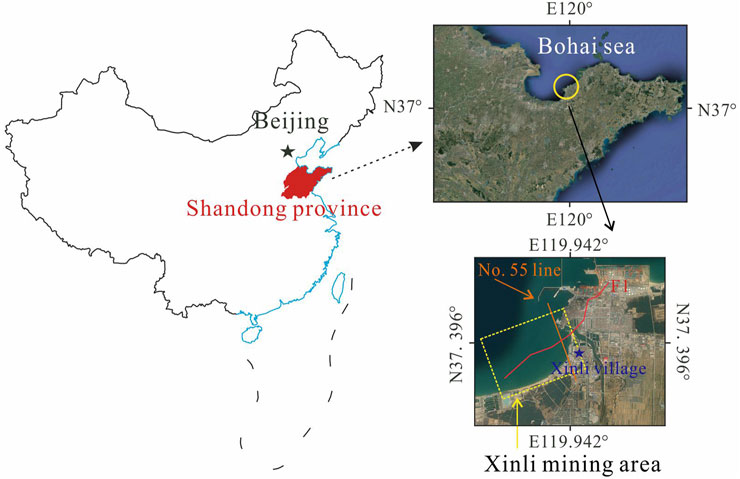
FIGURE 1. Location of the study area.
The climate in the study area is pleasant, and the tourism industry is well developed. As displayed in Figure 2, the mining facilities of the Xinli mining area are near the sea with hills in the distance. Thus, more attention should be paid to the healthy development of the mining industry in the Xinli mining area.
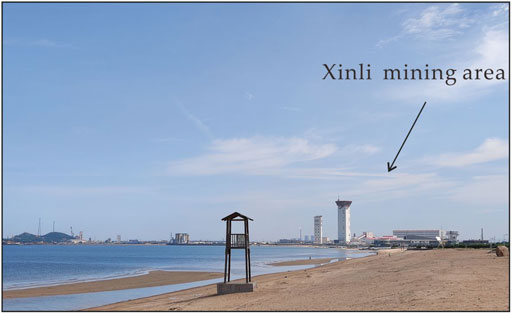
FIGURE 2. Overview of the Xinli mining area by the sea.
It has been nearly 20 years since the Xinli mining area was built in 2005. The mechanical upward horizontal slice stopping−filling method was used in the mining process, and the method of simultaneous upward mining in several sublevels was adopted for the mitigation of rock deformation and higher production efficiency (Liu et al., 2022a). To facilitate survey and design work, prospecting profile lines were designed and aligned almost perpendicular to the orebody. As shown in Figure 1, the orange line represents the location of the No. 55 prospecting profile line. Figure 3 also offers the simplified geological condition of the No. 55 prospecting profile (Liu et al., 2022a). After the excavation, the mined-out volume was immediately filled with backfill slurry paste.
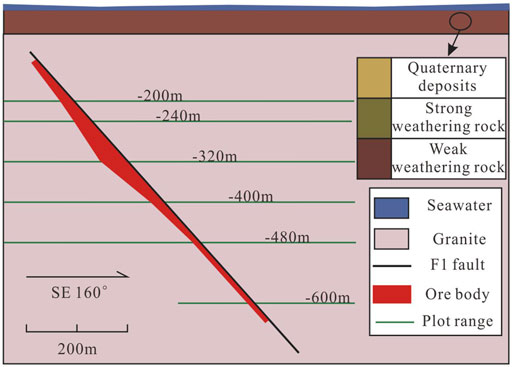
FIGURE 3. Simplified No. 55 prospecting profile (Liu et al., 2022a).
In this paper, we collected 57 SAR images for data processing, which were acquired using Sentinel-1A between 11 April 2018 and 12 July 2021. In addition, we conducted data processing by two time-series InSAR techniques, an SBAS technique, and a PSI technique. Detailed information about SAR images and data processing is available (Liu et al., 2022b). Because the Xinli mining area is mainly located below the sea level, the range of ground subsidence caused by mining is small. To more comprehensively present the characteristics of ground subsidence, we adopted a numerical simulation method. First, we used Rhinoceros and ANSYS software to establish a realistic mining model (Figure 4A); second, we exported the node information and element information of the meshes; finally, we imported the obtained information of the existing real model into FLAC3D software (Figure 4B). According to the rock mechanics test results of the rock mass at different positions in the mine, as conducted by the mining company, we attributed different properties for different groups. The main parameters of the key groups are listed in Table 1. Furthermore, we used FLAC3D software to simulate the excavation and backfilling of the orebody.
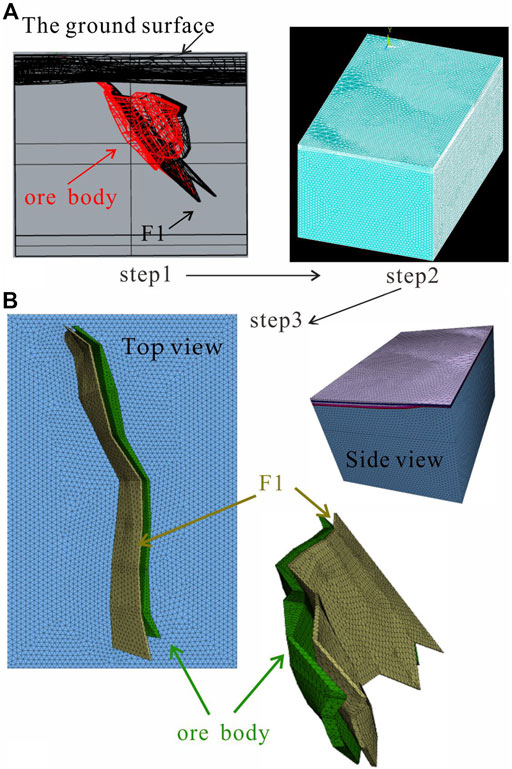
FIGURE 4. Constructed realistic mining models. (A) Modeling process step 1 and step 2; (B) Modeling process step 3.
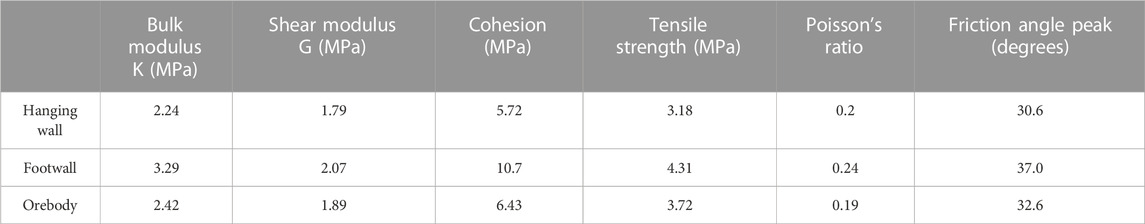
TABLE 1. Main parameters of the hanging wall, footwall, and orebody.
Ground subsidence is usually the external manifestation of the movement, deformation, and failure of the deep rock mass; namely, the deformation of the rock mass is an essential cause of ground subsidence. Thus, it is significant and necessary to study the rock movement phenomenon. In the Xinli mining area, the subsidence monitoring system has been established in several sublevels of the No. 55 prospecting profile (−200 m, −240 m, −320 m, −400 m, −480 m, and −600 m) since August 2015. The fourth-level leveling method was adopted, and the time interval for the monitoring work is usually 1 or 2 months. The monitoring network system of the No. 55 prospecting profile is shown in Figure 5 (Liu et al., 2022a). In this paper, we collected monitoring data from August 2015 to November 2021 with a monitoring interval of 1 to 2 months. Notably, there were two special situations: the workers ended the monitoring work of the −200 m sublevel earlier in April 2019 due to some unexplainable reasons, and the −600 m sublevel was more recently excavated, delaying the start time of the monitoring work there.
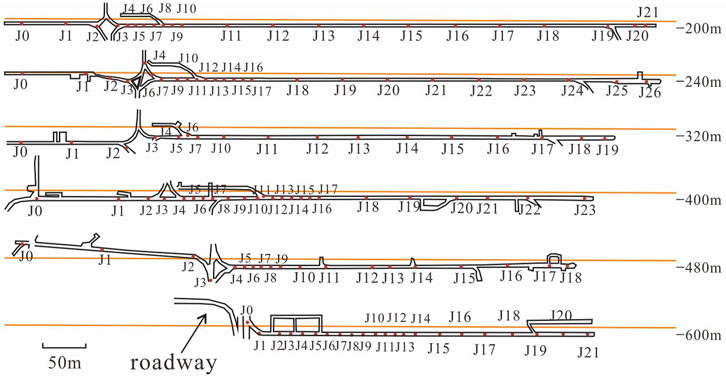
FIGURE 5. Monitoring network system of the No. 55 prospecting profile of the Xinli mining area (Liu et al., 2022a).
As shown in Figures 6, 7, we obtained the LOS displacement fields for Xinli Village using SBAS and PSI techniques. The two monitoring results of the cumulative LOS displacement indicate values of more than 3 cm during the monitoring period. The flat area to the west of Xinli Village has a large subsidence value, while the ground subsidence phenomenon of other areas of Xinli Village is not obvious. Notably, there is a very obvious phenomenon within the monitoring results: the image obtained by the PSI technique is missing a portion of the domain. This is related to the inherent property of the PSI technique, that is, areas with dense vegetation have fewer permanent scatterers. Additionally, due to atmospheric influences, the propagation path of the radar beam will be delayed in the process of passing through the atmosphere, which is the so-called atmospheric effect (Massonnet et al., 1994). The atmospheric effect is especially pronounced in coastal areas. Although we applied the Generic Atmospheric Correction Online Service (GACOS) data processed by the Toolbox for Reducing Atmospheric Phase Screen Estimation (TRAIN) to eliminate atmospheric errors during data processing (Yu et al., 2017; Yu et al., 2018a; Yu et al., 2018b), the outcome is imperfect. However, the results provide some meaningful subsidence data and the overall ground subsidence pattern of Xinli Village.
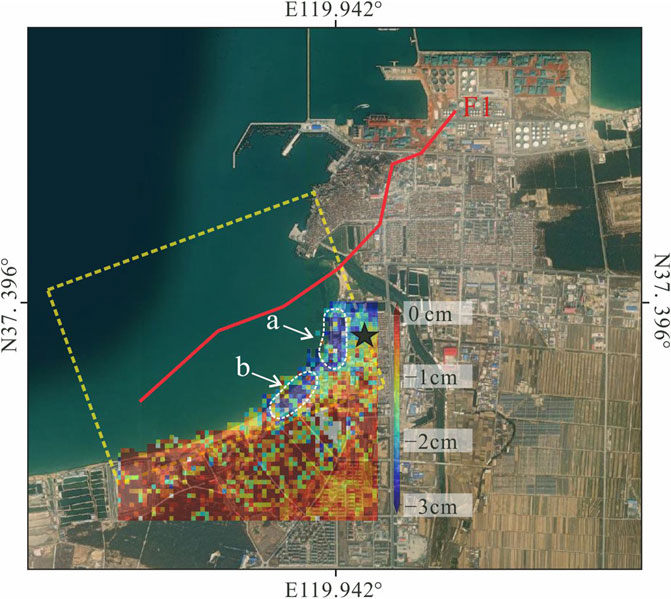
FIGURE 6. Spatial characteristics of the LOS displacement field (SBAS result).
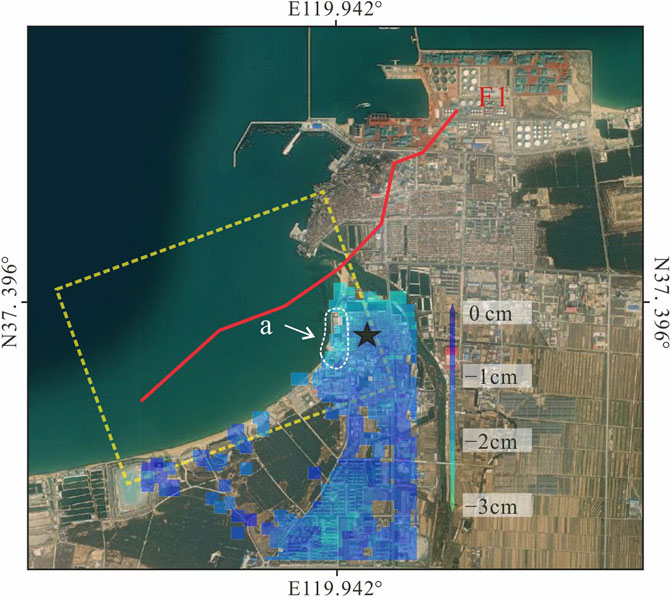
FIGURE 7. Spatial characteristics of the LOS displacement field (PSI result).
To obtain the cumulative LOS displacement of Xinli Village over time, we isolated zones (represented by the letters “a” and “b” in Figures 6, 7) for analysis. As shown in Figure 8, the values of the cumulative LOS displacements of zone “a” at different time periods are nearly equal (3 cm). Both results show stochastic fluctuations of the ground subsidence (Hui et al., 2019). Namely, the subsidence value does not continually increase in the subsidence area, and the subsidence events and uplift events can occur at any time in the ground subsidence area. The curves were linearly fitted, allowing us to obtain the corresponding formulas, as given in Figure 8. The LOS velocities are −0.0263 mm/day and −0.025 mm/day for PSI and SBAS methods, respectively. The linear fitting effect is satisfactory, and the corresponding “R2” values are 0.95 (PSI) and 0.91 (SBAS). After calculation and comparison, we found that the LOS subsidence velocity of zone “a” is nearly 9 mm/year. In a similar manner, we obtained the cumulative LOS displacement of zone “b”, with a SBAS-derived LOS subsidence velocity of 0.0306 mm/day, which translates to a subsidence velocity that is nearly 11.2 mm/year (Figure 9). Apparently, zone “b” has a bigger LOS subsidence velocity.
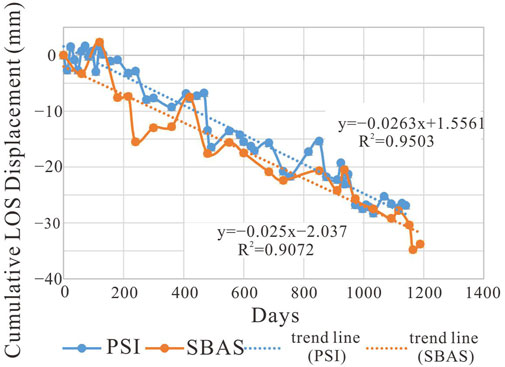
FIGURE 8. Cumulative LOS displacement of zone “a” (PSI and SBAS results).
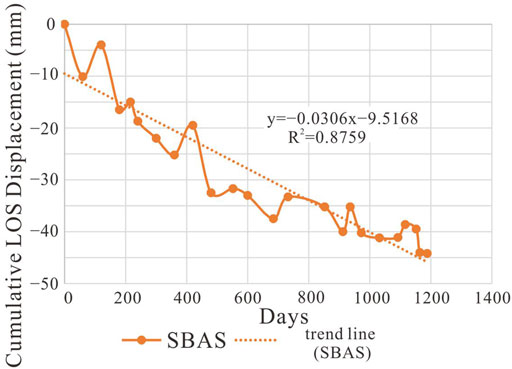
FIGURE 9. Cumulative LOS displacement of zone “b” (SBAS result).
We conducted the excavation and backfilling on the existing FLAC3D numerical model. According to the actual production plan of the Xinli deposit of the Sanshandao gold mine, the general direction of mining is from the northeast to the southwest (that is, along the orebody), from shallow to deep. Thus, we first excavated the upper northeast orebody, then the lower northeast orebody and the upper southwest orebody, and finally, the lower southwest orebody. In this way, we obtained the vertical displacement result of the study area and the vertical displacement of the No. 55 profile (Figure 10). We obtained an oval-shaped basin of subsidence, with the long axis of the ellipse aligned with the strike of the orebody. The subsidence isolines are the densest on the side nearest to the orebody and sparse on the side near the coast. In addition, a long and narrow uplift zone existed in the mining area. In the study area, the cumulative maximum ground subsidence value is about 0.42 m, and the cumulative maximum ground uplift value is about 0.066 m. Additionally, we projected the numerical simulation contour plot onto the map and concluded that zone “b” has a larger subsidence value than zone “a”, which is due to the special shape of the subsidence basin (Figure 11).
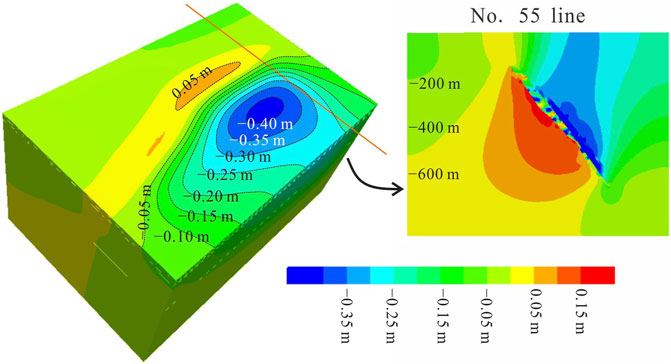
FIGURE 10. Vertical displacement result of the study area.
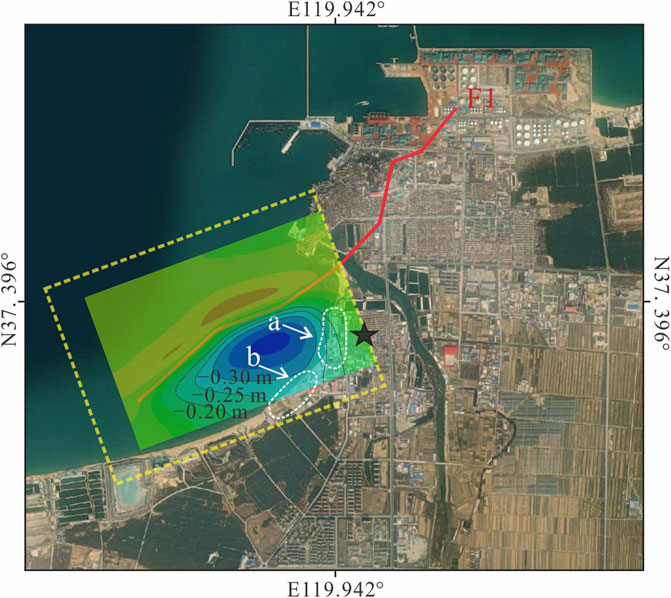
FIGURE 11. Result of superimposing the subsidence contour plot onto the map.
We plotted the cumulative subsidence of various sublevels of the No. 55 prospecting profile in Figure 12. The ordinate represents the cumulative subsidence value, and the abscissa represents the horizontal distance for each monitoring point of each sublevel from the starting point of the −240 m sublevel. According to the shapes of the cumulative subsidence curves, we divided them into two categories: the “pan” type (−200 m and −240 m) and the “funnel” type (−320 m, −400 m, −480 m, and −600 m) (Liu et al., 2022a). In addition, we counted the monitoring data of each sublevel of the No. 55 prospecting profile for many years. We obtained subsidence velocity values of 254 (−200 m), 204 (−240 m), 221 (−320 m), 287 (−400 m), 132 (−480 m), and 133 (−600 m), all of which were less than 3 cm/month. We used the fractal theory to analyze the monitoring data, and the function model is expressed as N(r) = C r−D. In this equation, “r” represents a characteristic scale, “C” represents the proportionality factor, “D” represents the fractal dimension, and “N(r)” represents the number of scales greater than “r.” Finally, we obtained “N(r)” values for each sublevel (Figure 13, tables). We projected the results onto a logarithmic coordinate graph and fitted them by the least square method specific to a log−log plot. In fact, the absolute value of the slope of the line is the fractal dimension “D.” Figure 13 displays the linear fitting formula of each sublevel and the determination coefficient “R2.”
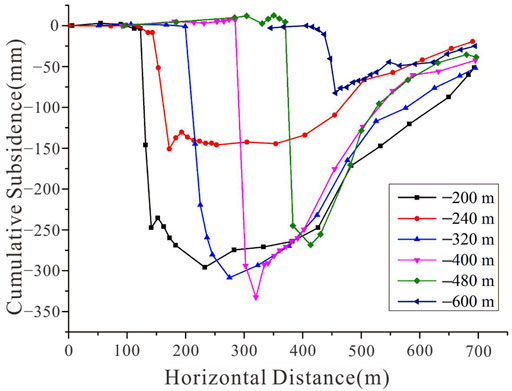
FIGURE 12. Cumulative subsidence of various sublevels of the No. 55 prospecting profile.
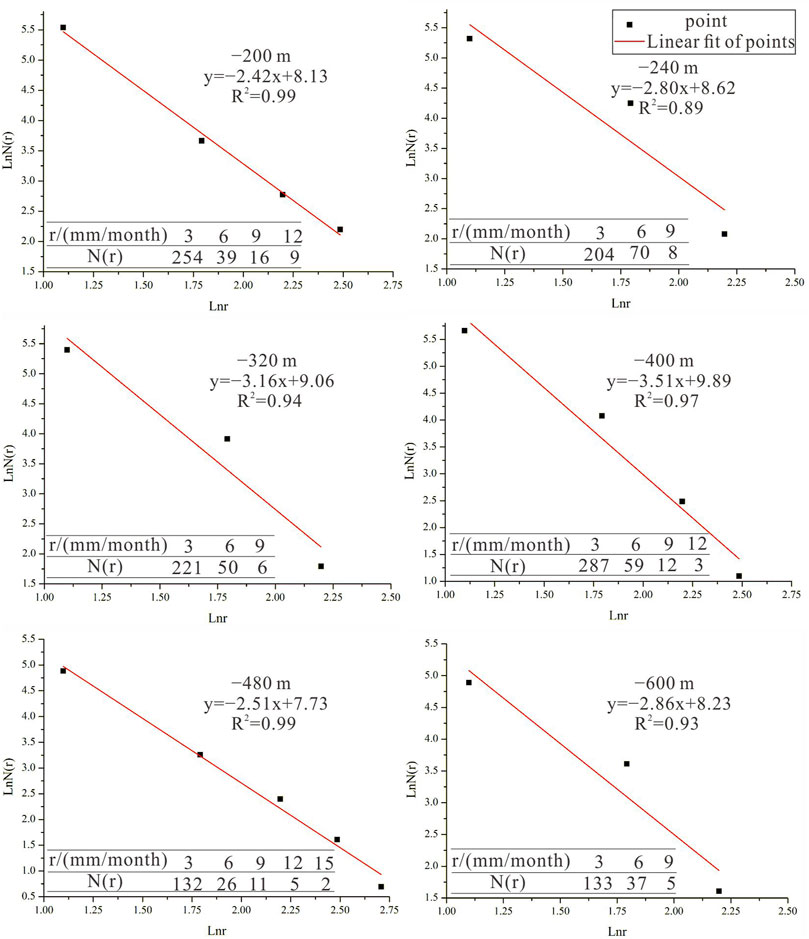
FIGURE 13. Fractal dimensions of various sublevels of the No. 55 prospecting profile.
As mentioned previously, we divided the cumulative subsidence curves into two categories: the “pan” type (−200 m and −240 m) and the “funnel” type (−320 m, −400 m, −480 m, and −600 m). Apparently, “pan”-type subsidence curves of the upper sublevels have more numerous large cumulative subsidence values; that is, the bottom of the curves are wider and softer. We infer that this phenomenon is related to the amount of the excavated orebody. From 2016 to 2021, the mining activities are mainly conducted in deep sublevels of the No. 55 prospecting profile, whereas there is little mining activity conducted in the upper sublevels of the No. 55 prospecting profile. It is well known that as a body moves under a force, it acquires inertia and that gravity is the root cause of subsidence. In other words, the upper rock mass will be affected by the mining activities in the lower rock mass, just as underground mining causing the upper ground surface to subside. This is illustrated in the simplified diagram in Figure 14, where “(1)” is the upper subsidence curve (we assume its presence) and “(2)” is the newly formed subsidence curve. We also assumed that the newly formed subsidence curve will transfer a certain degree of subsidence to the upper subsidence curve. The green line represents the sum of the subsidence values of the original “(1)” curve and the corresponding lower subsidence value of the “(2)” curve multiplied by the coefficient (0.2). The other cases remain the same. According to the superimposed results in three cases, we found that the slope of the curve becomes smaller in the light blue area. In general, the scope of subsidence of the “(1)” curve becomes greater than that in the original situation. Since the subsidence curves of the upper sublevels are affected by the lower mining activities, the numerical simulation result is deemed reasonable.
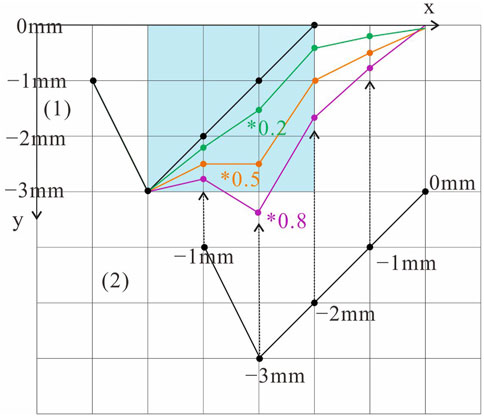
FIGURE 14. Simplified diagram of the cause of the subsidence curve of the upper sublevels.
As shown in Figure 12, the cumulative subsidence value will drop abruptly at a certain stage and then change steadily. Combined with Figure 5, the right part of the cumulative subsidence curves, which change steadily, mainly reflects the cumulative subsidence of the fault’s hanging wall rock mass. According to the previous content, this part of the curve is S-shaped. To further study the characteristics of the curves, we used the profile function method [66] to fit the curves. We applied a logistic function and the simplex method, both of which are the built-in functions in Origin software, to fit the subsidence values of this part, and obtained good fitting results, as evidenced by a determination coefficient (R2) mostly in the range of 0.95–1. The curve-fitting formula is shown as follows:
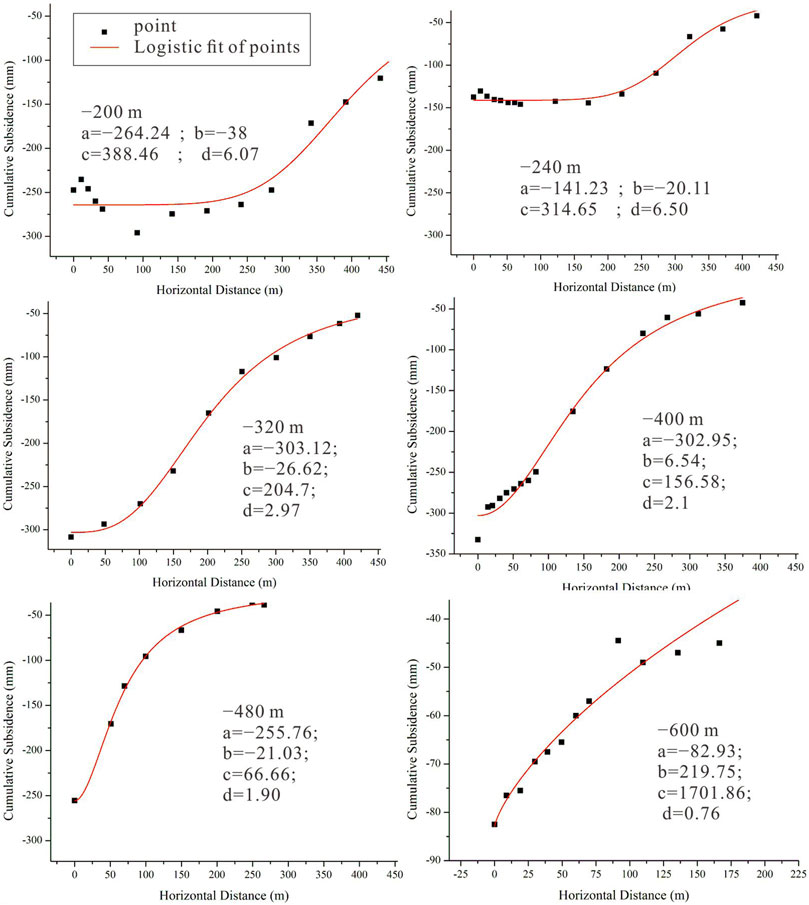
FIGURE 15. Logistic fitting results and relevant parameters in the formula.
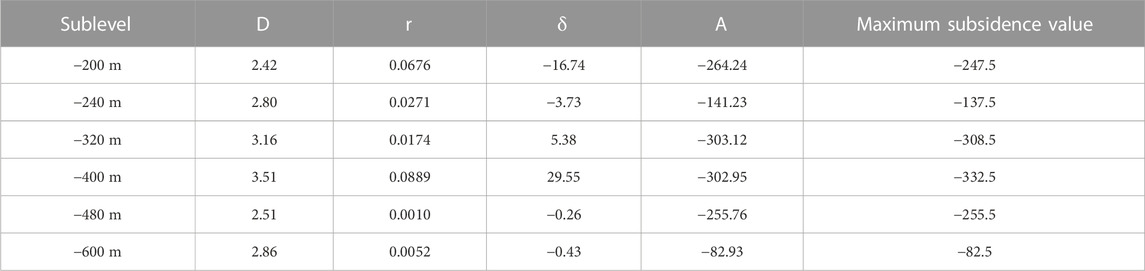
TABLE 2. Relevant parameters.
As a coastal, steeply inclined gold mine, the rock movement caused by mining in the Xinli deposit of the Sanshandao gold mine is of great research value as seawater may flood into the roadway along the damaged rock mass, and the movement and deformation of the surrounding rock may threaten the safety of workers and damage surface buildings. In this paper, we conducted a preliminary analysis of the mining-induced rock movement characteristics in the Xinli deposit of the Sanshandao gold mine; the key conclusions are presented in the following paragraphs
First, the InSAR results indicated that the southern part of the coastline within the Xinli Village area is experiencing greater subsidence than the northern part.
Second, the numerical simulation results obtained using FLAC3D are consistent with the InSAR results. In addition, the range of ground subsidence obtained by numerical simulation shows an obvious asymmetry. Specifically, the subsidence value on the southeast side of the subsidence basin changes more gently.
Third, the monitoring data of the No. 55 prospecting profile can provide a plausible explanation for the subsidence results: the slope of the right part of the maximum subsidence point of the subsidence curve is smaller than that on the left part; namely, the surrounding rock of the fault’s hanging wall has a wider range of rock movements. Furthermore, although the sublevels of the No. 55 prospecting profile at different depths have different rock movement characteristics, the upper sublevels (−200 m and −240 m) of the No. 55 prospecting profile tend to show “pan”-type curves, while the lower sublevels (−320 m, −400 m, −480 m, and −600 m) tend to show “funnel”-type curves.
Finally, a logistic function can well fit the right part of the subsidence curve, and the value of parameter “a” in its function formula is very close to the maximum subsidence value of each sublevel, especially the newly excavated sublevels. We found that the value of “r” is positively correlated with the fractal dimension value in deeper sublevels (−320 m, −400 m, −480 m, and −600 m) and is negatively correlated with the fractal dimension value in more shallow sublevels (−240 m and −200 m), and the fractal dimension value reflects the degree of disturbance of the excavated sublevel.
The original contributions presented in the study are included in the article/Supplementary Material; further inquiries can be directed to the corresponding author.
Conceptualization, JL and FM; methodology, JL and JG; formal analysis, JL and FM; investigation, JG and GL; resources, FL; data curation, YS; writing—original draft preparation, JL; writing—review and editing, FM; supervision, JG; project administration, GL and FL; funding acquisition, FM. All authors have read and agreed to the published version of the manuscript.
This research was funded by the National Natural Science Foundation of China (Grant numbers 41831293 and 42072305). The authors express grateful appreciation for the support.
The authors would like to thank the Copernicus program of the European Space Agency (ESA) for providing Sentinel-1A data and NASA for arranging the SRTM DEM data. The data for eliminating atmospheric errors were provided by Generic Atmospheric Correction Online Service (GACOS). The authors also thank Lv for professional instructions. The authors also thank the editor and reviewers for their valuable advice, which improved the paper.
The authors declare that the research was conducted in the absence of any commercial or financial relationships that could be construed as a potential conflict of interest.
All claims expressed in this article are solely those of the authors and do not necessarily represent those of their affiliated organizations, or those of the publisher, the editors, and the reviewers. Any product that may be evaluated in this article, or claim that may be made by its manufacturer, is not guaranteed or endorsed by the publisher.
Adhikary, D., and Guo, H. (2015). Modelling of longwall mining-induced strata permeability change. Rock Mech. Rock Eng. 48, 345–359. doi:10.1007/s00603-014-0551-7
Adhikary, D., Khanal, M., Jayasundara, C., and Balusu, R. (2016). Deficiencies in 2D simulation: A comparative study of 2D versus 3D simulation of multi-seam longwall mining. Rock Mech. Rock Eng. 49, 2181–2185. doi:10.1007/s00603-015-0842-7
Alejano, L. R., RamõÂrez-Oyanguren, P., and Taboada, J. (1999). FDM predictive methodology for subsidence due to flat and inclined coal seam mining. Int. J. Rock Mech. Min. Sci. 36 (4), 475–491. doi:10.1016/s0148-9062(99)00022-4
Aly, M. H., Klein, A. G., and Zebker, H. A. (2012). Land subsidence in the Nile Delta of Egypt observed by persistent scatterer interferometry. Int. J. Remote Sens. 33, 2068–2096.
Asadi, A., Shahriar, K., Goshtasbi, K., and Najm, K. (2005). Development of a new mathematical model for prediction of surface subsidence due to inclined coal-seam mining. J. S Afr. I Min. Metall. 105 (1), 15–20.
Bai, Y. R., Gu, Z. M., and Bai, S. W. (2002). Preliminary study on surface subsidence and strata movement caused by underground mining in eastern Chengchao Iron Mine. Chin. J. Rock Mech. Eng. 21, 340–342.
Bak, P., Tang, C., and Wiesenfeld, K. (1987). Self-organized criticality an explanation of the 1/f noise. Phys. Rev. Lett. 59, 381–384. doi:10.1103/physrevlett.59.381
Bao, X., Zhang, R., Shama, A., Li, S., Xie, L. X., Lv, J. C., et al. (2022). Ground deformation pattern analysis and evolution prediction of shanghai pudong international airport based on PSI long time series observations. Remote Sens. 14 (3), 610. doi:10.3390/rs14030610
Berardino, P., Fornaro, G., Lanari, R., and Sansosti, E. A new algorithm for surface deformation monitoring based on small baseline, IEEE Transactions on Geoscience and Remote Sensing, 40, 2002
Biancolini, M. E., Brutti, C., Paparo, G., and Zanini, A. (2006). Fatigue cracks nucleation on steel, acoustic emission and fractal analysis. Int. J. Fatigue 28, 1820–1825. doi:10.1016/j.ijfatigue.2005.12.003
Cao, J. Y. (2019). Study on deformation law of rock mass caused by mining of seabed inclined ore body. Ph.D. Thesis. Beijing, China: University of Chinese Academy of Sciences.
Chen, S. J., Wang, H. L., Wang, H. Y., Guo, W. J., and Li, X. S. (2016). Strip coal pillar design based on estimated surface subsidence in eastern China. Rock Mech. Rock Eng. 49, 3829–3838. doi:10.1007/s00603-016-0988-y
Cheng, G. W., Chen, C. X., Ma, T. H., Liu, H. Y., and Tang, C. A. (2017). A case study on the strata movement mechanism and surface deformation regulation in chengchao underground iron mine. Rock Mech. Rock Eng. 50, 1011–1032. doi:10.1007/s00603-016-1132-8
Cui, X. M., Wang, J. C., and Liu, Y. S. (2001). Prediction of progressive surface subsidence above longwall coal mining using a time function. Int. J. Rock Mech. Min. Sci. 38, 1057–1063. doi:10.1016/s1365-1609(01)00061-2
Dai, H. Y., Wang, J. Z., Cai, M. F., Wu, L. X., and Guo, Z. Z. (2002). Seam dip angle based mining subsidence model and its application. Int. J. Rock Mech. Min. Sci. 39, 115–123. doi:10.1016/s1365-1609(02)00008-4
Diez, R. R., and Alvarez, J. T. (2000). Hypothesis ofthe multiple subsidence trough related to very steep and vertical coal seams and its prediction through pro¢le functions. Geotechnical Geol. Eng. 18, 289–311. doi:10.1023/a:1016650120053
Ferretti, A. C., Prati, C., and Rocca, F. (2001). Permanent scatterers in SAR interferometry. Trans. Geosci. Remote Sens. 39, 8–20. doi:10.1109/36.898661
Foroughnia, F., Nemati, S., Maghsoudi, Y., and Perissin, D. (2018). An iterative PS-InSAR method for the analysis of large spatio-temporal baseline data stacks for land subsidence estimation. Int. J. Appl. Earth Obs. Geoinf. 74, 248–258. doi:10.1016/j.jag.2018.09.018
Gastaldo, R. A., Demko, T. M., and Liu, Y. J. (1993). Application of sequence and genetic stratigraphic concepts to carboniferous coal-bearing strata – An example from the black warrior basin. USA. Geol. rundsch. 82, 212–226.
Ghabraie, B., Ren, G., Zhang, X., and Smith, J. (2015). Physical modelling of subsidence from sequential extraction of partially overlapping longwall panels and study of substrata movement characteristics. Int. J. Coal Geol. 140, 71–83. doi:10.1016/j.coal.2015.01.004
Holla, L., and Buizen, M. (1991). The ground movement, strata fracturing and changes in permeability due to deep longwall mining. Int. J. Rock Mech. Min. Sci. Geomech. Abstr. 28 (2/3), 207–217. doi:10.1016/0148-9062(91)92168-x
Hu, Q. F., Cui, X. M., Liu, W. K., Feng, R. M., Ma, T. J., and Li, C. Y. (2022). Quantitative and dynamic predictive model for mining-induced movement and deformation of overlying strata. Eng. Geol. 311, 106876. doi:10.1016/j.enggeo.2022.106876
Hui, X., Ma, F., Zhao, H. J., and Xu, J. M. (2019). Monitoring and statistical analysis of mine subsidence at three metal mines in China. Bull. Eng. Geol. Environ. 78, 3983–4001. doi:10.1007/s10064-018-1367-6
Jiang, Y., Misa, R., Li, P. Y., Yuan, X., Sroka, A., and Jiang, Y. (2019). A review of the development process of mine subsidence theory. Metal. Mine 10, 1–7.
Jiráseka, J., Opluštil, S., Sivek, M., Schmitz, M. D., and Abels, H. A. (2018). Astronomical forcing of Carboniferous paralic sedimentary cycles in the Upper Silesian Basin, Czech Republic (Serpukhovian, latest Mississippian): New radiometric ages afford an astronomical age model for European biozonations and substages. Earth-Science Rev. 177, 715–741. doi:10.1016/j.earscirev.2017.12.005
Kwinta, A., and Gradka, R. (2020). Analysis of the damage influence range generated by underground mining. Int. J. Rock Mech. Min. Sci. 128, 104263. doi:10.1016/j.ijrmms.2020.104263
Li, G., Hui, X., Ma, F. S., and Guo, J. (2022). Temporal analysis of ground movement at a metal mine in China. Remote Sens. 14 (19), 4993. doi:10.3390/rs14194993
Li, G., Ma, F. S., Guo, J., and Zhao, H. J. (2020). Deformation characteristics and control method of kilometer-depth roadways in a nickel mine: A case study. Appl. Sci. 10, 3937. doi:10.3390/app10113937
Li, G., Ma, F. S., Guo, J., Zhao, H. J., and Liu, G. (2020). Study on deformation failure mechanism and support technology of deep soft rock roadway. Eng. Geol. 264, 105262. doi:10.1016/j.enggeo.2019.105262
Li, X., Wang, S. J., Liu, T. Y., and Ma, F. S. (2004). Engineering geology, ground surface movement and fissures induced by underground mining in the Jinchuan Nickel Mine. Eng. Geol. 76, 93–107. doi:10.1016/j.enggeo.2004.06.008
Litwiniszyn, J. (1954). Displacements of a rock mass in the light of the theory of probabilityTom II. Arch. Górn i Hut.Z 2.
Liu, B. C., and Dai, H. Y. (2016). Research development and Origin of probability integral method. J. Min. Strata Control Eng. 21 (02), 1–3.
Liu, B. C., and Liao, G. H. (1965). The Basic Law of the Movement of the Surface of the Coal Mine. Beijing, China: China Industry Press.
Liu, J., Ma, F. S., Guo, J., Li, G., Song, Y. W., and Wan, Y. (2022). A field study on the law of spatiotemporal development of rock movement of under-sea mining, Shandong, China. Sustainability 14, 5864. doi:10.3390/su14105864
Liu, J., Ma, F. S., Li, G., Guo, J., Wan, Y., and Song, Y. W. (2022). Evolution assessment of mining subsidence characteristics using SBAS and PS interferometry in Sanshandao gold mine, China. Remote Sens. 14, 290. doi:10.3390/rs14020290
Ma, F. H., and Ding, Y. (2009). Numerical simulation of ground movement behavior inclined multiple seams mining with deep dip angle. Chin. Min. Mag. 18 (06), 71–73.
Massonnet, D., Feigl, K., Rossi, M., and Adragna, F. (1994). Radar interferometric mapping of deformation in the year after the Landers earthquake. Nature 369 (6477), 227–230. doi:10.1038/369227a0
Meng, F. F., Piao, C. D., Shi, B., Sasaoka, T., and Shimada, H. (2021). Calculation model of overburden subsidence in mined-out area based on Brillouin optical time-domain reflectometer technology. Int. J. Rock Mech. Min. Sci. 138, 104620. doi:10.1016/j.ijrmms.2021.104620
Meng, Z. P., Li, G. Q., and Xie, X. T. (2012). A geological assessment method of floor water inrush risk and its application. Eng. Geol. 143, 51–60. doi:10.1016/j.enggeo.2012.06.004
Murgia, F., Bignami, C., Brunori, C. A., Tolomei, C., and Pizzimenti, L. (2019). Ground deformations controlled by hidden faults: MultiFrequency and multitemporal InSAR techniques for urban hazard monitoring. Remote Sens. 11, 2246. doi:10.3390/rs11192246
Park, E. S., Choi, S. O., and Shin, H. S. (2005). Simulation of the ground subsidence mechanism using a PFC2D. The 40th U.S. Symposium on Rock Mechanics, Anchorage, Alaska. 29, 05–735.
Qin, S. Q. (2000). Catastrophe model and chaos mechanism of ramp instability. Chin. J. Rock Mech. Eng. 19, 486–492.
Ren, G., Li, G., and Kulessa, M. (2014). Application of a generalised influence function method for subsidence prediction in multi-seam longwall extraction. Geotech. Geol. Eng. 32 (4), 1123–1131. doi:10.1007/s10706-014-9787-y
Sepehri, M., Apel, B. D., Adeeb, S., Leveille, P., and Hall, A. R. (2020). Evaluation of mining-induced energy and rockburst prediction at a diamond mine in Canada using a full 3D elastoplastic finite element model. Eng. Geol. 266, 105457. doi:10.1016/j.enggeo.2019.105457
Shen, G. Q. (2002). Fractal dimension and fractal growth of urbanized areas. Int. J. Geogr. Inf. Sci. 16, 419–437. doi:10.1080/13658810210137013
Sheorey, P. R., Loui, J. P., Singh, K. B., and Singh, S. K. (2000). Ground subsidence observations and a modified influence function method for complete subsidence prediction. Int. J. Rock Mech. Min. Sci. 37, 801–818. doi:10.1016/s1365-1609(00)00023-x
Sócrates, F. M., Víctor, M. H. M., José, T. V., and Cecilia, I. V. R. (2020). Evolution assessment of structurally-controlled differential subsidence using SBAS and PS interferometry in an emblematic case in Central Mexico. Eng. Geol. 279, 105860. doi:10.1016/j.enggeo.2020.105860
Svartsjaern, M., Saiang, D., Nordlund, E., and Eitzenberger, A. (2016). Conceptual numerical modeling of large-scale footwall behavior at the kiirunavaara mine, and implications for deformation monitoring. Rock Mech. Min. Sci. 49, 943–960. doi:10.1007/s00603-015-0750-x
Tarighat, F., Foroughnia, F., and Perissin, D. (2021). Monitoring of power towers’ movement using persistent scatterer SAR interferometry in south west of tehran. Remote Sens. 13 (3), 407. doi:10.3390/rs13030407
Tu, S. H., Yuan, Y., Wang, F. T., and Bai, Q. S. (2015). Present situation of fully mechanized mining technology for steeply inclined coal seams in China. Arab. J. Geosci. 8, 4485–4494. doi:10.1007/s12517-014-1546-0
Tuncay, D., Tulu, B. I., and Klemetti, T. (2021). Re-Analysis of abutment angle method for moderate and deep cover retreat room and pillar mines and investigation of loading mechanics using finite volume modeling. Rock Mech. Rock Eng. 54, 3447–3468. doi:10.1007/s00603-020-02336-4
Valkaniotis, S., Papathanassiou, G., and Ganas, A. (2018). Mapping an earthquake-induced landslide based on UAV imagery; case study of the 2015 Okeanos landslide, Lefkada, Greece. Eng. Geol. 245, 141–152. doi:10.1016/j.enggeo.2018.08.010
Villegas, T., Nordlund, E., and Dahnér-Lindqvist, C. (2011). Hangingwall surface subsidence at the kiirunavaara mine, Sweden. Eng. Geol. 121, 18–27. doi:10.1016/j.enggeo.2011.04.010
Wagner, H. (2019). Deep mining: A rock engineering challenge. Rock Mech. Rock Eng. 52, 1417–1446. doi:10.1007/s00603-019-01799-4
Whittaker, B. N., and Reddish, D. J. (1989). Subsidence: Occurrence,Prediction and control. Amsterdam, Netherlands: Elsevier Amsterdam.
Xie, H. P., and Pariseau, W. G. (1993). Fractal character and mechanism of rock bursts. Chin. J. Rock Mech. Eng. 30, 343–350. doi:10.1016/0148-9062(93)91718-x
Xie, H. P., Zhou, H. W., Wang, J. A., Li, L. Z., and Kwasniewski, M. A. (1999). Application and comparative analysis of FLAC in coal mining subsidence prediction. Chin. J. Rock Mech. Eng. 4, 397–401.
Xu, H. Z., and Li, X. H. (2005). Time function of surface subsidence based on Logistic growth model. Rock Soil Mech. (S1), 151–153.
Xu, J. M., Zhu, W. B., Xu, J. L., Wu, J. Y., and Li, Y. C. (2021). High-intensity longwall mining-induced ground subsidence in Shendong coalfield, China. Int. J. Rock Mech. Min. Sci. 141, 104730. doi:10.1016/j.ijrmms.2021.104730
Yerro, A., Corominas, J., Monells, D., and Mallorquí, J. J. (2014). Analysis of the evolution of ground movements in a low densely urban area by means of DInSAR technique. Eng. Geol. 170, 52–65. doi:10.1016/j.enggeo.2013.12.002
Yu, C., Li, Z., Penna, N. T., and Crippa, P. (2018). Generic atmospheric correction model for interferometric synthetic aperture radar observations. J. Geophys. Res. Solid Earth. 123, 9202–9222. doi:10.1029/2017jb015305
Yu, C., Li, Z., and Penna, N. T. (2018). Interferometric synthetic aperture radar atmospheric correction using a GPS-based iterative tropospheric decomposition model. Remote Sens. Environ. 204, 109–121. doi:10.1016/j.rse.2017.10.038
Yu, C., Penna, N. T., and Li, Z. (2017). Generation of real-time mode high-resolution water vapor fields from GPS observations. J. Geophys. Res. Atmos. 122, 2008–2025. doi:10.1002/2016jd025753
Zhao, D. D., Jin, G., Li, H. S., and Huang, J. Y. (2013). Geological characteristics of Sanshandao island gold deposit in Laizhou, Shandong province and the genetic discussion. Contributions Geol. Mineral Resour. Res. 28 (04), 546–551.
Keywords: ground subsidence, InSAR, asymmetry, logistic function, fractal dimension value
Citation: Liu J, Ma F, Guo J, Li G, Song Y and Li F (2023) A preliminary analysis of the mining-induced rock movement characteristics in the Xinli deposit of the Sanshandao gold mine. Front. Earth Sci. 10:1101807. doi: 10.3389/feart.2022.1101807
Received: 18 November 2022; Accepted: 28 December 2022;
Published: 11 January 2023.
Edited by:
Naifei Liu, Xi’an University of Architecture and Technology, ChinaReviewed by:
Jiuyang Huan, Yangzhou Polytechnic Institute, ChinaCopyright © 2023 Liu, Ma, Guo, Li, Song and Li. This is an open-access article distributed under the terms of the Creative Commons Attribution License (CC BY). The use, distribution or reproduction in other forums is permitted, provided the original author(s) and the copyright owner(s) are credited and that the original publication in this journal is cited, in accordance with accepted academic practice. No use, distribution or reproduction is permitted which does not comply with these terms.
*Correspondence: Fengshan Ma, ZnNtYUBtYWlsLmlnZ2Nhcy5hYy5jbg==
Disclaimer: All claims expressed in this article are solely those of the authors and do not necessarily represent those of their affiliated organizations, or those of the publisher, the editors and the reviewers. Any product that may be evaluated in this article or claim that may be made by its manufacturer is not guaranteed or endorsed by the publisher.
Research integrity at Frontiers
Learn more about the work of our research integrity team to safeguard the quality of each article we publish.