 Zhang Yu1
 Jia Jun
- 1Exploration Business Department of PetroChina Southwest Oil and Gas Field Company, Chengdu, China
- 2College of Resource and Environmental Engineering, Mianyang Normal University, Mianyang, China
- 3State Key Laboratory of Oil and Gas Reservoir Geology and Exploitation, Southwest Petroleum University, Chengdu, China
- 4School of Geoscience and Technology, Southwest Petroleum University, Chengdu, China
The calcareous tight sandstone reservoir of the Triassic Shaximiao Formation in the G oil field of the central Sichuan Basin has high calcium content and abnormally high resistivity, making it difficult to reveal the oil-bearing property, evaluate water saturation, and calculate geological reserves. In this work, a petrophysical volume model of calcareous tight sandstone was established through systematic petrophysics experiments and the analysis of the main control factors of oil bearing grade. A method of using conventional logging data to calculate the calcium content of the reservoir and correct the calcium content of resistivity was proposed. After resistivity correction, the water saturation of the tight calcareous sandstone reservoir was more accurately calculated based on variable rock-electro parameters. The results indicated that with the decrease in calcium content and the increase in feldspar content, the reconstructive effect of corrosion was enhanced, the physical properties and pore structure of the reservoir were improved, and the oil bearing grade increased. The calcium content of the reservoir can be continuously calculated by the volume model and the crossplot of logRtn/ACn and Vca/POR. The resistivity of the reservoir with a high calcium content can be corrected using the resistivity index of calcium content (Ica). In conjunction with the water saturation calculation model using variable parameters, the accuracy of calculated water saturation was 14% and 5.8% higher than the calculation results without resistivity correction and using fixed rock-electro parameters, which can satisfy the requirements for reservoir evaluation and the calculation accuracy of hydrocarbon reserves.
1 Introduction
In the past decade, unconventional hydrocarbon resources represented by tight oil/gas and shale oil/gas, have played an increasingly important role in world energy structures (Roberto, 2013; Zou et al., 2014). Unconventional oil and gas accounted for 25% of global oil production in 2018 (US EIA, 2018), with tight oil contributing significantly. The tight oil production in the United States alone reached 3.29 × 10⁸ t, pushing the oil production in the U.S. to the second-highest level (US EIA, 2019). Unlike conventional oil and gas exploitation, the exploitation in tight reservoirs has been a challenge due to the complex lithology and pore structure (Clarkson et al., 2012), strong heterogeneity (Liu, 2021), and difficulty in determining the controlling factors of oil bearing grade (Dai et al., 2012) and characterizing reservoir parameters (Li and Zhu, 2020).
Lithology identification is the foundation for tight reservoir evaluation and hydrocarbon exploitation (Zhang C. S. et al., 2019; Mateen et al., 2022). Mineral composition, structure, and cementation mode are directly related to the physical properties (Enkin et al., 2020; Bai et al., 2021), pore structure (Slatt and O’Neal, 2011), and wettability of reservoirs (Esfahani and Haghighi, 2004; Sauerer et al., 2020), and affect the distribution of reservoir fluid (Wu et al., 2016) and the evaluation accuracy of reservoir parameters (Agbasi et al., 2018). Lithology can be identified by experimental test techniques, such as Scanning Electron Microscope (SEM) (Quaid et al., 2016; Li et al., 2017), Cast Thin Section (CTS) (Borazjani et al., 2016; Dong et al., 2019), X-Ray Diffraction (XRD) (Kahle et al., 2002), and Computed Tomography Scan (CT) (Kyle and Ketcham, 2015; Ma et al., 2017). However, the experimental results are discrete, and it is difficult to obtain the continuous lithological characterization along the Well shaft. In addition, the above techniques cannot be widely used due to the excessive cost. In recent years, statistical analysis techniques have been applied to lithology identification, such as Gradient Boosting Decision Trees (Zhang G. et al., 2019; Dev and Eden, 2019), Neural Networks (Gu et al., 2018; Ahmed et al., 2021), and Machine Learning techniques (Thinesh et al., 2022). However, the identification accuracy of the above statistics methods depends on the number and significance of samples, and their application is regionally restricted. Economical, efficient, and continuous logging data with high vertical resolution have become a crucial means for lithology identification. Previous studies plotted the crosslet by lithology-sensitive logging curves (Benoit et al., 1980; Liu et al., 2016) and identified the logging lithology using Elemental Capture Spectroscopy (ECS) logging (Wu et al., 2013), imaging logging (Lai et al., 2019), and multi-mineral model (Butt and Naseem, 2022). Crossplot has been widely used to identify the lithology of conventional reservoirs; however, it is less effective in identifying the complex lithology of tight sandstone reservoirs due to the similar logging response of complicated lithological components. Therefore, it is beneficial to refine the crossplot technique and improve its performance in identifying complex lithology in tight reservoirs.
Some calcareous tight sandstone reservoirs in the Triassic Shaximiao Formation in the G oil field of the central Sichuan Basin are characterized by high calcium content (≥ 20%) and large variation in calcium content, which, together with the random distribution of calcium, complicates the lithology identification. The calcareous sandstone reservoir contains quartz and calcite, and the mineral content ratios are variables. As a result, the rock matrix value cannot be easily determined by logging evaluation. In addition, logging response characteristics are influenced by the change in calcium content, leading to large errors in lithology identification and reservoir parameters evaluation. At the same time, calcium will reduce the travel time of acoustic waves, increase the compensated density, and abnormally increase the resistivity of the sandstone reservoir (Djebbar and Erle, 2012). Consequently, the logging response characteristics between tight dry and oil reservoirs are easily confused, which further adversely affects fluid identification and hydrocarbon reserves calculation.
To address these problems, this paper analyzed the controlling factors of oil-bearing property in the calcareous tight sandstone reservoir through systematic petrophysical experiments, established the petrophysical volume model of calcareous tight sandstone, and uses optimized crossplot to extract lithology-sensitive logging curves to calculate the calcium content of the reservoir. On this basis, the resistivity index caused by calcium content (Ica) was proposed to correct the resistivity, then the water saturation of the calcareous tight sandstone reservoir was calculated by variable rock-electro parameters to eliminate the influence of calcium and improve the evaluation accuracy of the calcareous tight sandstone reservoir.
2 Geological setting
G oilfield is located in the north-central Sichuan Basin, with hilly terrain and an altitude of 300–500 m (Figure 1). The northern part is higher than the southern part, and the exploration area is 1700 km2 (Yang et al., 2016). The regional geological structure is formed in Yanshanian, which is a long stripe-shaped anticline extending in an east-west direction with NE-EW stress orientation, and its main fault lies parallel to the tectonic axis. The targeted formation, Shaximiao Formation in the Middle Jurassic, is the main productive zone of the oilfield and is widely spread in this area, with a formation thickness of 600–2200 m and a buried depth of 2100–2700 m. The sedimentary type is inland freshwater lacustrine facies clastic sediment, dividing into S1 and S2 sub segments from the bottom up, and the lithology is mainly aubergine and grey-green mudstone interbedded with pale grey-green and grey-green sandstone (Huang et al., 2017). In recent years, tight sandstone oil/gas reservoirs in this region have proven reserves of over 100 million tons, making it one of the hot spots for unconventional hydrocarbon exploitation in China (Yang et al., 2022).
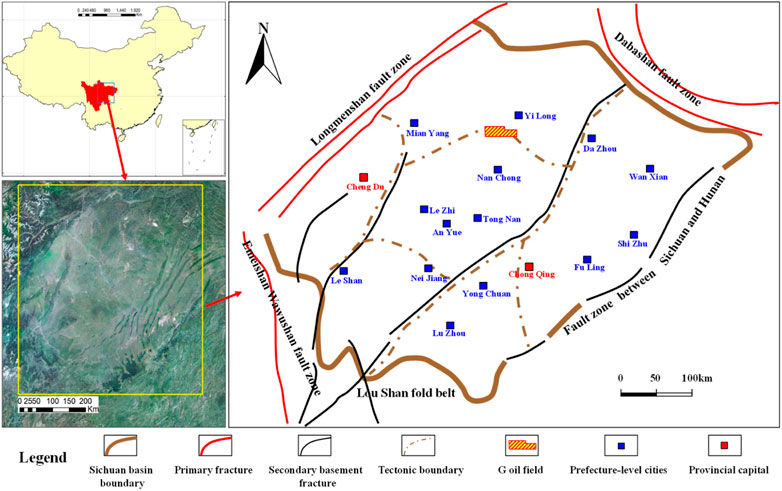
FIGURE 1. Geographical and structural location of G oilfield.
3 Methodologies
We collected core samples from 11 Wells with a high coring recovery rate and representative reservoir characteristics, prepared rock plug samples with diameters ranging from 25 to 80 mm, and performed the petrophysical experiment in steps (Figure 2).
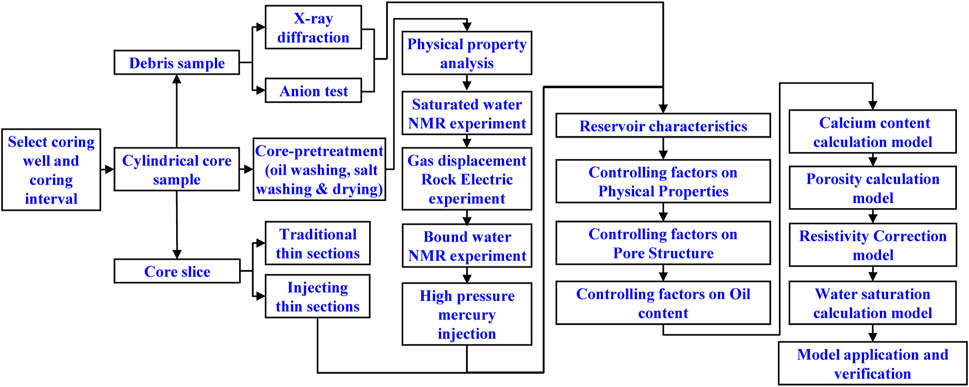
FIGURE 2. Experiment and research flow chart.
X’Pert MPD PRO was used in the X-ray diffraction (XRD) analysis. AniMR-Hole Core was used in the nuclear magnetic resonance (NMR) experiment (maximum sample size: 150mm × 150mm × 150 mm). The automated mercury porosimeter Poremaster60 GT was applied in the High-Pressure Mercury Injection (HPMI) experiment (pore-size distribution: 0.0036–950um). The ion chromatography instrument ICS-5000 was employed in Anion Test (AT). The above experiments were completed in strict accordance with industry standards. The core samples used for the petroelectric test and conventional physical properties were pretreated beforehand by washing oil and salt using the carbon dioxide displacement method. Considering the influence of crystal water of clay minerals on pore structure, samples were dried at constant temperature and humidity (T&H: 70°C, 40%).
4 Phenomena and results
4.1 Lithologic characteristics
XRD results showed that the lithology of the Shaximiao Formation was mainly feldspar lithic sandstone and detritus feldspar sandstone (Figure 3A). The mass fraction of quartz (wQ) and feldspar (wR) ranged from 22% to 72% and 4%–48%, respectively, and their average values were 45.95% and 20.4%, respectively. The composition of debris was complicated, including sedimentary rock debris, igneous rock debris, metamorphics debris, and little mica (Figure 3B). Laumontite was also found in some wells.
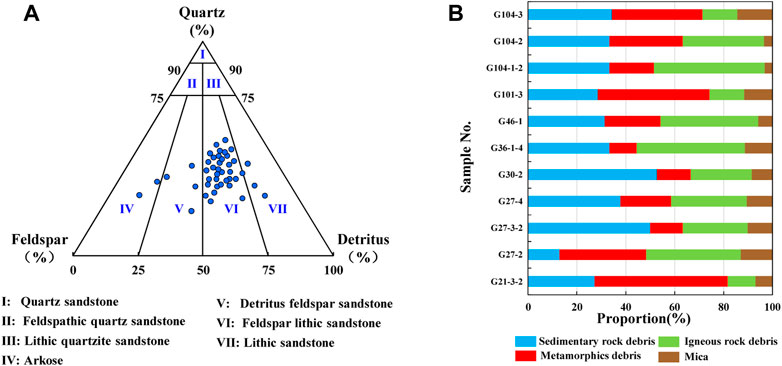
FIGURE 3. Lithology (A) and debris (B).
Laumontite is a porous silicate mineral with a water frame structure formed by the alteration of intermediate basic pyroclastic and alkaline minerals in an environment of low temperature and alkaline water medium. It has a large number of micropores and cavities (Lu et al., 2004; Chipera et al., 2008).
Compared with common porous minerals, laumontite is much less dense than quartz, plagioclase, and calcite, with an average density of 2.3 g/cm3. At the same time, due to its high specific surface area (SSA), laumontite can adsorb large amounts of water and has large neutron porosity (CNL>31.3–35.3%). In terms of electrochemistry, the hydrous cation in laumontite cannot migrate through the zeolite skeleton cavity, resulting in poor conductivity. Therefore, laumontite strata generally have high resistivity (Yang and Qiu, 2002).
4.2 Physical properties
The analysis of physical properties showed that Shaximiao Formation was a tight sandstone reservoir with low porosity and permeability. The porosity and permeability of the reservoir ranged from 2% to 10% and 0.01 mD to 0.5 mD, respectively. The means of porosity and permeability were 5.5% and 0.12 mD, respectively. Porosity less than 6% and permeability less than 0.1 mD contributed up to 77.8% and 79.3% to the core physical properties, respectively. In general, core porosity had a good correlation with permeability.
4.3 Pore structure characteristics
The analysis of rock thin section indicated that the pore types of the Shaximiao tight sandstone reservoir were dominated by residual intergranular pore (43.18%) (Figure 4A), feldspar dissolution pore (23.35%) (Figure 4B), and debris dissolution pore (21.28%) (Figure 4C), followed by intergranular dissolution pore (Figures 4D, E) and moldic pore (Figure 4F). No microfractures appeared. According to statistical analysis, the more developed the residual intergranular pores and secondary dissolution pores, the better the reservoir pores, and the higher the areal porosity and core porosity.
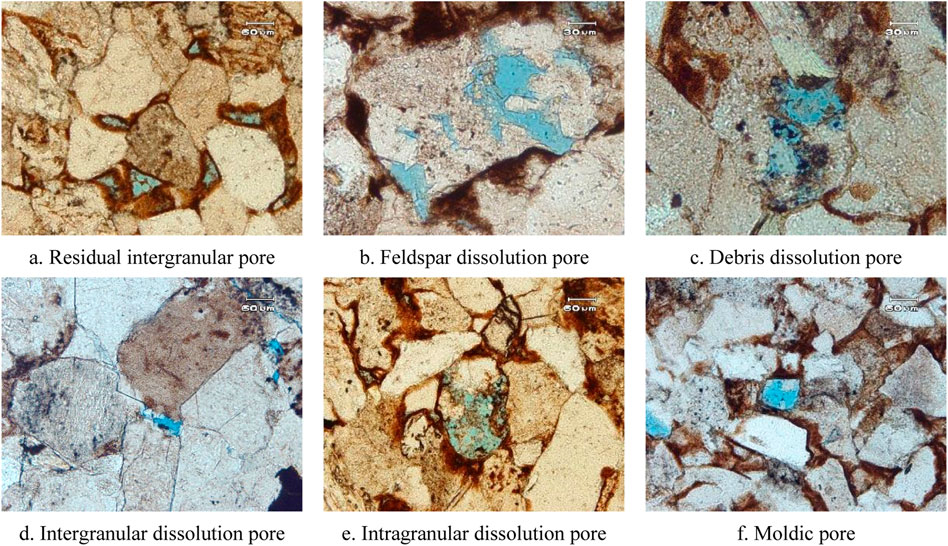
FIGURE 4. Pore types of reservoir. (A) Residual intergranular pore. (B) Feldspar dissolution pore. (C) Debris dissolution pore. (D) Intergranular dissolution pore. (E) Intragranular dissolution pore. (F) Moldic pore.
5 Analysis and discussions
5.1 Influencing factors of oil-bearing grade
Oil bearing grade was synthetically influenced by generating, reservoiring and capping conditions, hydrocarbon charging degree, and reservoir characteristics (Zhang et al., 2017). To study the controlling factors of the oil-bearing grade of calcareous tight sandstone, this paper analyzed the interrelationships between oil bearing grade, lithology, physical properties, and pore types from the perspective of reservoir characteristics.
5.1.1 Influence of lithology on physical properties
The analysis results on the correlation between physical properties and XRD experimental results demonstrated that calcium and feldspar had a greater influence on the physical properties of the reservoir in the Shaximiao Formation. Overall, as the calcium content decreased and the feldspar content increased, the porosity and permeability continued to rise, while the correlation between the content of quartz, clay, and physical properties was not significant (Figure 5). However, a few samples with a high feldspar content but a low calcium content (g21-3-2, g46-1, g46-2) still had poor physical properties. The rock thin section analysis revealed that their residual intergranular pores and secondary dissolution pores were underdeveloped, and part of the pore space was filled by asphalt.
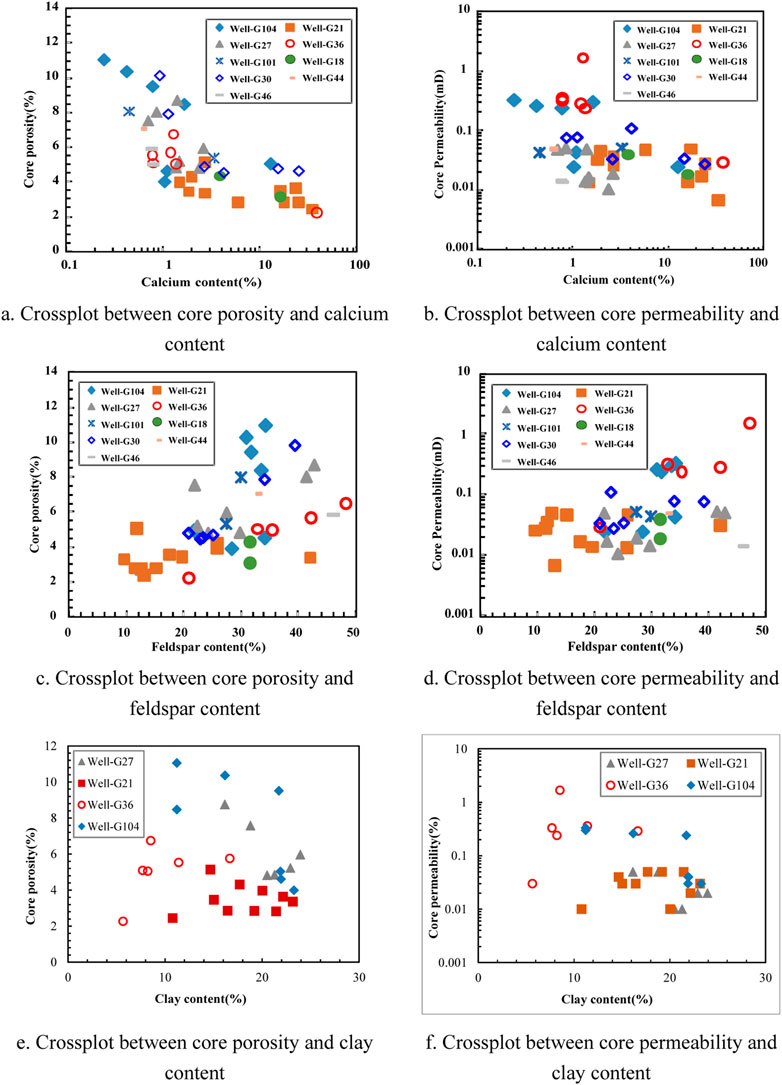
FIGURE 5. Correlation between feldspar, calcium, and clay content with porosity and permeability. (A) Crossplot between core porosity and calcium content. (B) Crossplot between core permeability and calcium content. (C) Crossplot between core porosity and feldspar content. (D) Crossplot between core permeability and feldspar content. (E) Crossplot between core porosity and clay content. (F) Crossplot between core permeability and clay content.
5.1.2 Influence of lithology and dissolution on pore structure
Many studies have confirmed that there is a connection between T2 spectrum distribution and pore radius (Mao and He, 2005). In this paper, the pore structure of the core was investigated by NMR T2 spectra (Yan et al., 2017; Yan et al., 2020), and the relationship between the T2 spectrum and calcium and feldspar content in the core was further analyzed.
From the test results, for the core samples with calcium content greater than 2%, the transverse relaxation time (T2) ranged from 0.01–3 ms, and the curve exhibited a unimodal distribution of the T2 spectrum. For core samples with calcium content less than 2%, one part of the curve still showed a unimodal distribution and T2 between 0.05–6 ms, while the other part exhibited bimodal characteristics and T2 between 4–200 m after the peak (Figure 6A). When the feldspar content of core samples was less than 30%, the curve exhibited a unimodal distribution, and T2 ranged from 0.02 to 3 m. When the content was greater than 30%, most of the distribution curve exhibited bimodal characteristics, and T2 was in the range of 7–200 m after the first peak (Figure 6B). In other words, low calcium content, high feldspar content, and good physical properties were the basis for high-quality reservoir space. However, the pore structure of some core samples which can meet the above conditions was still not ideal (Figure 7A), and the reconstructive effect of corrosion of the pore space of such cores was weak. However, the pore structure gradually becomes better with the development of dissolution pores and the increase in secondary areal porosity (Figures 7B, C).
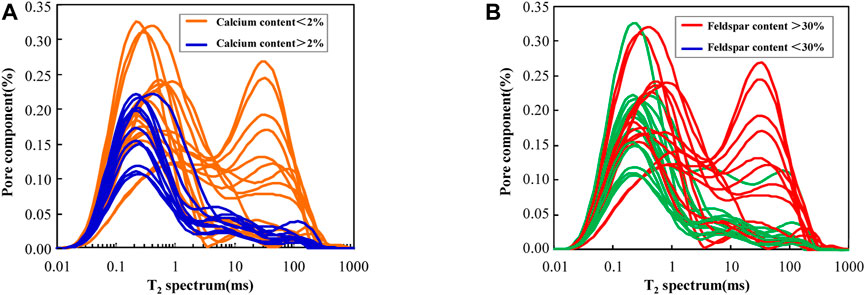
FIGURE 6. NMR T2 spectrum of core samples with different calcium (A) and feldspar (B) content.
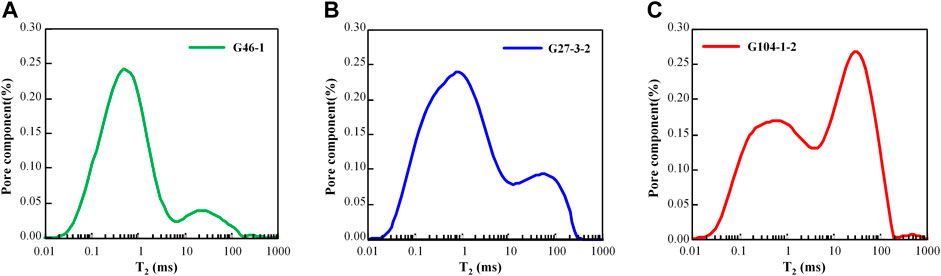
FIGURE 7. NMR T2 spectrum of core with different development degrees of dissolution pores. (A) No.G46-1, low calcium content (0.76%), high feldspar content (46%), undeveloped dissolution pores (secondary surface porosity = 1.5%), poor pore structure. (B) No.G27-3-2, low calcium content (1.39%), high feldspar content (42.8%), dissolution pores developed (secondary areal porosity 3.5%), better pore structure. (C) No.G104-1-2, low calcium (0.76%), high feldspar content (46%), dissolution pores developed (secondary areal porosity 3.8%), good pore structure.
5.1.3 Influence of physical properties and pore structure on oil-bearing grade
The porosity, permeability, and NMR T2 spectral characteristics of core samples in different oil-bearing grades indicated that the porosity of oily cores mainly ranged from 6% to 12% and the permeability was generally greater than 0.05 mD. Therefore, the physical properties of oily cores were better than those of oil-free cores (Figure 8). Regarding the pore structure characteristics, the T2 spectrum of oily cores showed a bimodal distribution (Daigle and Johnson, 2015; Gong and Liu, 2020), T2 ranged from 0.4 to 3 m and 7–200 m. In addition to micropores, meso- and macropores were also developed in oily cores to some extent. The T2 distribution curves of oil-free cores were almost unimodal and T2 ranged from 0.3 to 1.5 m. The samples were dominated by small- and micropores, with poor pore structure and weak permeability (Shao et al., 2017).
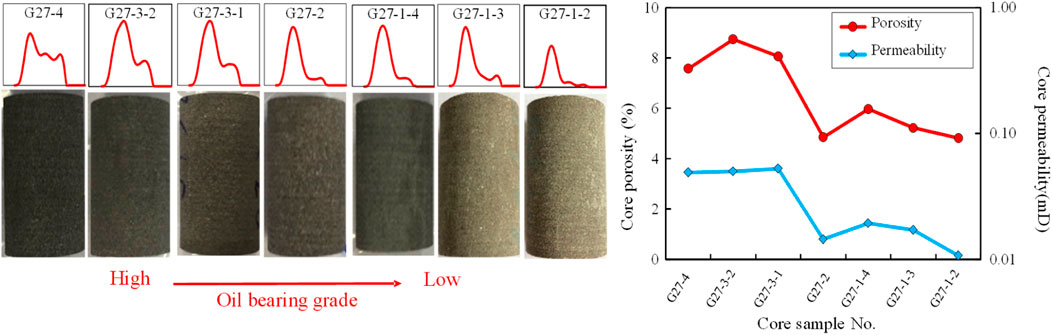
FIGURE 8. Variation of oil-bearing grade with physical properties and pore structure (Well G27)
5.2 Resistivity correction for the effect of calcium content
In conventional sandstone reservoirs, resistivity logging curves were used to analyze the fluid properties and distribution features. Under similar reservoir conditions, the resistivity of the oil-bearing interval was greater than that of the oil-free interval. Based on classic Archie (1942)’s formula, water saturation can be calculated by resistivity curves. However, due to the high calcium content in the tight reservoir in the study area, in the oil-free interval, the resistivity increased significantly and the calculated water saturation was low, resulting in an inaccurate reflection of the oil content of the reservoir. Therefore, in order to eliminate the influence of calcium on resistivity, the calcium of resistivity must be corrected before evaluating the saturation of calcareous tight sandstone reservoir with resistivity logging.
5.2.1 Calculation of calcium content
XRD results were used to calibrate logging curves. The logging response of intervals with high calcium content (Vca) was characterized by short acoustic travel time (AC) and increased resistivity (Rt), and there was no significant correlation between other logging curves. By analyzing the crossplot of AC and logRt with Vca of corresponding reservoir intervals, it was found that their correlation was low, which indicated that apart from lithology (calcium content), AC was also influenced by porosity, and resistivity was influenced by porosity and the formation water salinity (RW).
Given that the study intervals belong to the same sedimentary type and their RW is close, the influence of RW on Rt could be ignored. As the calcium content increased, AC and POR decreased, logRt increased, and the variation trends of Vca/POR and logRt/AC were the same. Although the correlation between logRt/AC and Vca/POR (Figure 9) was higher than that of AC, logRt, and Vca of corresponding intervals, it still did not satisfy the accuracy requirements for log evaluation. According to the analysis, the dimensional differences of data between logRt and AC might lead to a low correlation, and the difference of RW between Wells might also lead to the deviation of Rt.
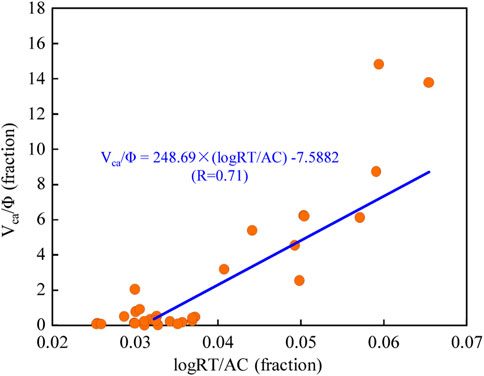
FIGURE 9. Crossplot between logRt/AC and Vca/POR.
The crossplot of logRtn/ACn and Vca/POR (Figure 10) was plotted to weaken the influence of the above factors, that is, the relationship between logging response characteristics and calcium content (Vca) was analyzed with relative variation trends of logRt and AC, instead of their concrete values (Li et al., 2022). After normalization, the values of logRt and AC ranged from 0 to 1. When Vca increased, Rt increased, and AC decreased. The variation trends of Rt and AC were opposite. The normalized ratios could effectively reflect the variation features of logging-sensitive curves caused by Vca change. In addition, the normalized logRt attenuated the influence of the different resistivity of formation water among Wells. The results indicated that logRtn/ACn was highly correlated with Vca/POR, and the model to calculate Vca was derived (Eq. 1):
where Vca is the calcium content, %; logRtn is the normalized logRt, fraction; ACn is the normalized AC, f; and Φ is the porosity, %.
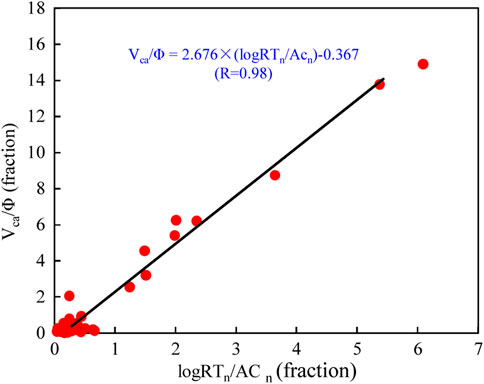
FIGURE 10. Crossplot between logRtn/ACn and Vca/POR.
The above model of Vca indicates that obtaining reliable porosity is the prerequisite for the accurate calculation of Vca. To this end, we proposed the petrophysical volume model that considers calcareous content (Figure 11) and established logging response equations (Eqs. 2, 3).
where Φ is the porosity, %; DTf is the travel time of fluid, 189 μs/ft; and DTca is the travel time of calcium, 47.5 μs/ft. DTm is the travel time of the matrix, DTm is in the range of 51–58 μs/ft, Vca is the calcium content, %; and Vm is the matrix volume, %.
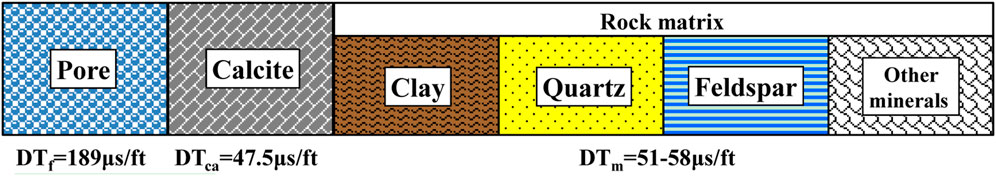
FIGURE 11. Petrophysical volume model of calcareous sandstone.
By combining Eqs. 1–3, the calculation model of porosity was obtained (Eq. 4):
5.2.2 Resistivity correction for the effect of calcium content
In reservoir intervals with high calcium content, calcium will significantly increase the deep lateral resistivity, up to 1000 Ω m. The influence of calcium on resistivity is greater than the effect of fluid properties on resistivity. In accordance with the principle of resistivity logging, the existence of calcium is equivalent to the addition of a heterogeneous and stochastically varying resistivity to the homogeneous sandstone reservoir. In addition, its influence on formation resistivity is closely related to the degree of homogeneity. When the calcium is homogeneously distributed, it is equivalent to high resistance in parallel in the formation, and the influence is limited. When the distribution of calcium is heterogeneous, the formation is equivalent to a high resistance sometimes in series and sometimes in parallel, which will have a significant impact on the formation resistivity. In this case, the water saturation calculation by Archie’s formula based on resistivity logging will be greatly affected. The followings are two common scenarios: (1) The water or dry layers with high calcium content are mistaken for oil-water or oil layers. (2) Low-resistivity oil zones with low calcium content are mistaken for water layers.
In order to eliminate the influence of calcium content on water saturation calculation, it is necessary to correct the calcium content of resistivity. In the classic Archie (1942)’s formula, the contribution of oil and gas to resistivity is manifested by the resistivity index, I (I=Rt/Rw). Based on the above principle, in this study, the resistivity index caused by calcium content was defined as Ica, which is the ratio of the resistivity of calcareous formation (logRtca) to that of sandstone formation (logRt). The regression analysis on calcium content (Vca) and Ica showed that they had a good linear relationship, and the correlation coefficient was 0.93 (Figure 12).
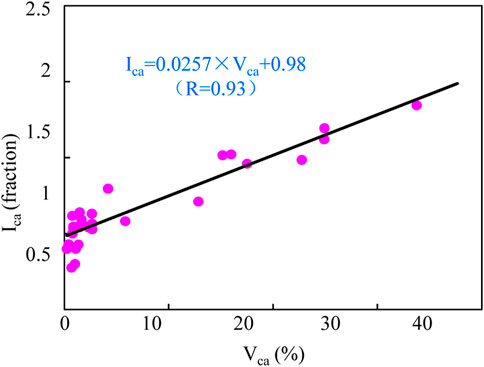
FIGURE 12. Crossplot between Ica and Vca.
Then, the correction model for calcium content of resistivity was obtained as follows:
The above method was used to correct the calcium content of resistivity in Well G30. The resistivity of the calcium-free interval (2510–2530 m) did not change before and after correction, while that of intervals with a high calcium content (2546–2550m, 2554–2560m) decreased significantly after correction (Figure 13). The calculated calcium content and porosity were in good accordance with those from the core analysis. The calcium content and porosity of Wells G21, G27, G30, G36, and G104 were calculated and compared with analyzed calcium content and porosity. Both calculation and analyzed results were in high agreement. The average absolute errors of porosity and calcium content were 3.8% (Figure 14) and 4.2% (Figure 15), respectively.
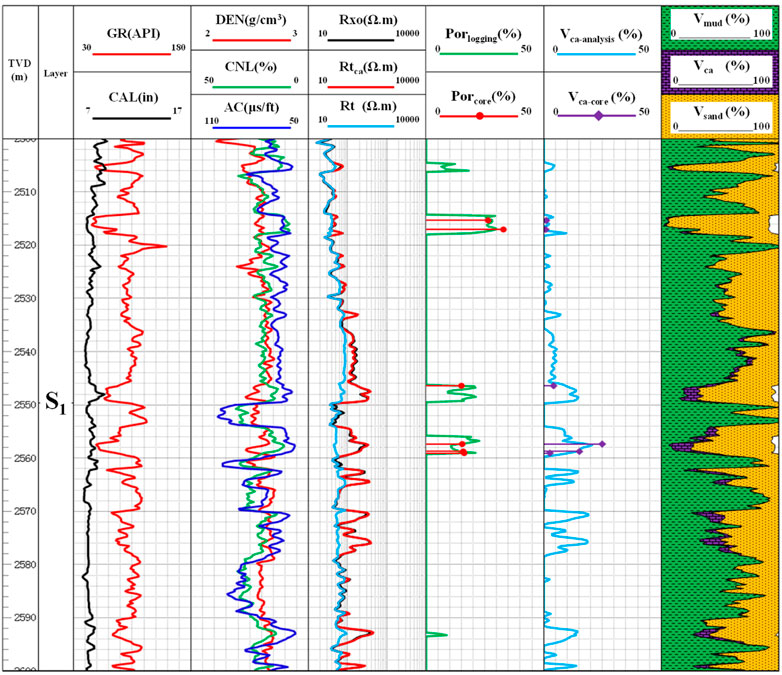
FIGURE 13. Resistivity correction of Well G30.
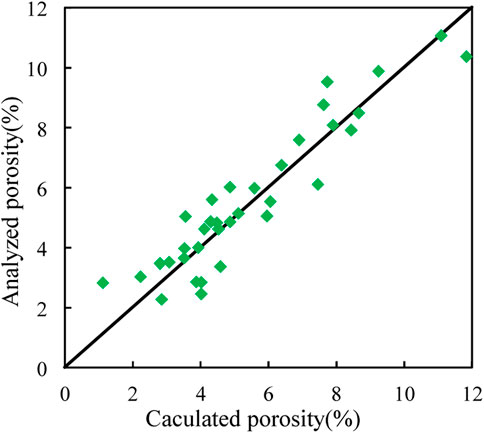
FIGURE 14. Crossplot between core analysis and calculated porosity.
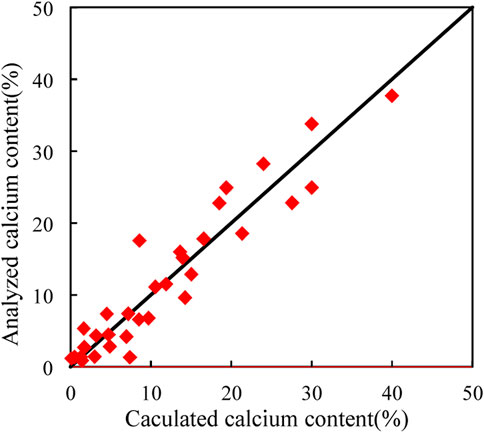
FIGURE 15. Crossplot between core analysis and calculated calcium content.
5.3 Water-saturation calculation of calcareous tight sandstone
Based on resistivity correction, the water saturation of the calcareous sandstone reservoir could be calculated by Archie’s formula. As the key parameters in Archie’s formula, rock-electro parameters have a direct impact on the calculation accuracy of water saturation and are usually obtained by rock electricity experiments at high pressure and temperature.
5.3.1 Archie parameters
5.3.1.1 Fixed Archie parameters
In the rock electricity experiment, it was found that some cores were oversaturated, that is, the actual water inflow exceeded the theoretical water inflow of pores by 22%. By comparing XRD and CTS results for this type of core, it was found that the oversaturation was caused by laumontite cementation in cores. The crystal structure of laumontite contains a lot of cavities and canals and is in the shape of a porous sponge (Koporulin, 2013). After a long time of pressure saturation, water flows into laumontite to form zeolitic water, which can conduct electricity, similar to bound water. In addition, due to the unbalanced electrovalence generated by the displacement of silicon by aluminum, alkali metal ions and water molecules can move between the crystal lattice of laumontite, making the laumontite itself conductive and affecting the accurate calculation of rock-electro parameters.
Due to the above factors, the resistivity of the oversaturated rock decreased significantly, resulting in small F values of samples. By comparison, the n parameter was unrelated to saturation, therefore, oversaturation did not affect n values. After excluding the oversaturated core samples, the parameters of Archie’s formula were determined as a = 1, b = 1, m = 1.798, and n = 2.904 (Figure 16). However, the influence of the reservoir heterogeneity (lithology, physical property) was not considered in the saturation calculation using fixed rock-electro parameters.
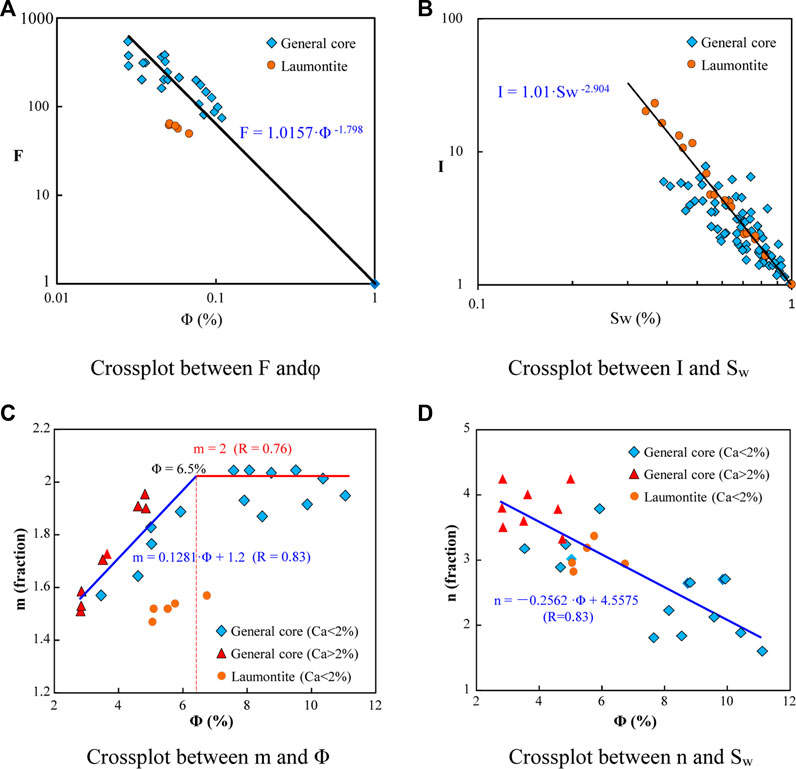
FIGURE 16. Rock-electro parameters. (A) Crossplot between F andφ. (B) Crossplot between I and Sw. (C) Crossplot between m and Φ. (D) Crossplot between n and Sw.
5.3.1.2 Variable Archie parameters
The analysis of the relationship between m, n, and porosity revealed that there was a piecewise functional relationship between m and porosity, and a linear functional relationship between n and porosity. In addition, m and n of calcic samples were greater than those of calcium-free samples. When m and n were fixed, the calculation of Sw must have errors. Therefore, considering the relationship between porosity, m, and n, a statistical regression model was proposed to calculate m and n by porosity. The calculation model for n is as follows (Eq. 7):
Taking porosity of 6.5% as the boundary value, the piecewise calculation model of m was obtained (Eqs. 8, 9):
5.3.2 In-situ application
Archie’s formula with fixed and variable parameters was used to calculate Sw of Well G21 (Figure 17).
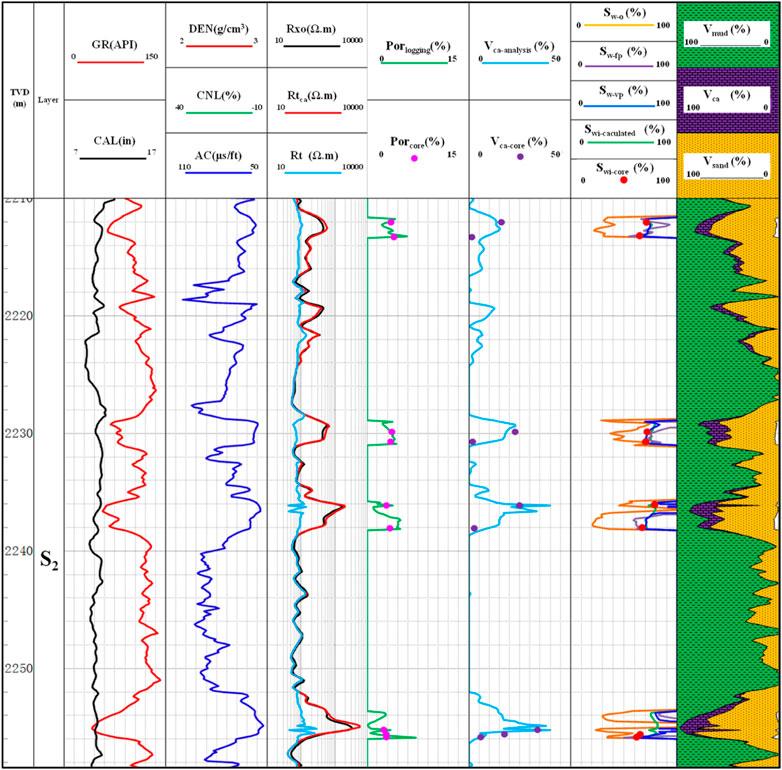
FIGURE 17. Comprehensive interpretation of Well G21.
The core analysis showed that Vca and Sw of intervals between 2211.8–2213.3 m, 2228.9–2230.8 m, 2236.2–2238.3 m, and 2252.7–2255.3 m ranged in 2.7–34.7% and 62–84.5%, respectively. The logging curves were characterized by abnormally low GR and high resistivity responses due to the influence of calcium on the above intervals. In previous studies, Sw measured by the classic Archie’s formula without calcium correction for resistivity ranged from 20.5% to 54%, obviously lower than the results from the core analysis. Logging interpretation misidentified intervals as productive strata. After calcium correction, Sw calculated by the model with fixed and variable parameters ranged from 56.5–79% and 60–83%, respectively, close to the results from the core analysis. Logging interpretation corrected intervals as unproductive strata, and hydraulic fracturing tests confirmed that no industrial oil flowed in the above intervals.
The above methods were adopted to measure the Sw of Wells in the study area, and the results were compared with calculations and core irreducible water saturation (Swir) in previous studies (Table 1). The mean absolute error of Sw in previous research was 18.5%. After calcium correction of resistivity, the mean absolute error of Sw measured by Archie’s model with fixed and variable parameters was 10.3% and 4.5%, respectively. The errors were significantly reduced and met the accuracy requirements of reservoir evaluation and oil reserves calculation.

TABLE 1. Water saturation calculation results with different methods.
6 Conclusion
(1) Calcium and feldspar are the main minerals controlling the physical properties of the calcareous tight sandstone reservoir in the Shaximiao Formation. Corrosion further improves the porosity and pore structure of the reservoir. In addition, lithology and pore structure jointly control the oil bearing grade of the reservoir.
(2) By using the improved crossplot of logRtn/ACn and Vca/POR, the influence of different Rw among Wells and dimensional differences of logging curves was weakened, and the difference in logging response of calcium content was effectively reflected. Based on the calcareous petrophysical volume model, a calculation model of calcium content and porosity of the calcareous sandstone reservoir with high accuracy was proposed.
(3) By introducing the Ica index, the regression relation between Vca and Ica was established, and the resistivity in reservoir intervals with high calcium content was effectively corrected.
(4) The calculation accuracy of Sw in calcareous tight sandstone obtained by putting the resistivity after calcium correction into Archie’s formula with variable parameters was significantly better than that of the formula with fixed parameters and previous results. The absolute error was less than 5% compared with water saturation through sealed coring, which met the accuracy requirements of reservoir evaluation and oil and gas reserves calculation.
Data availability statement
The original contributions presented in the study are included in the article/Supplementary Material; further inquiries can be directed to the corresponding author.
Author contributions
ZY: Writing—Original Draft, FS: Data Curation, Investigation. JJ: Conceptualization, Writing—Review and Editing, Investigation. HH: Resources and Editing. DY: Visualization. AH: Editing.
Funding
This research was jointly supported by the National Natural Science Foundation of China (Grant No. U2003102) and Natural Science Foundation of Science and Technology Department in Sichuan Province (Declaration No. 23NSFSC1626).
Conflict of interest
Authors ZY, HH, and AH were employed by the company of Exploration Business Department of PetroChina Southwest Oil and Gas Field Company.
The remaining authors declare that the research was conducted in the absence of any commercial or financial relationships that could be construed as a potential conflict of interest.
Publisher’s note
All claims expressed in this article are solely those of the authors and do not necessarily represent those of their affiliated organizations, or those of the publisher, the editors and the reviewers. Any product that may be evaluated in this article, or claim that may be made by its manufacturer, is not guaranteed or endorsed by the publisher.
References
Agbasi, O. E., Igboekwe, M. U., Chukwu, G. U., and Sunday, E. E. (2018). Discrimination of pore fluid and lithology of a well in X Field, Niger Delta, Nigeria. Arab. J. Geosci. 11, 274. doi:10.1007/s12517-018-3610-7
Ahmed, A., Elkatatny, S., Gamal, H., and Abdulraheem, A. (2021). Artificial intelligence models for real-time bulk density prediction of vertical complex lithology using the drilling parameters. Arab. J. Sci. Eng. 47, 10993–11006. doi:10.1007/s13369-021-05537-3
Archie, G. E. (1942). The electrical resistivity log as an aid in determining some reservoir characteristics. Trans. AIME 146, 54–62. doi:10.2118/942054-g
Bai, X., Li, Z., and Lai, F. (2021). Optimal selection method for sweet spots in low-permeability multilayered reservoirs. Geofluids 2021, 1–10. doi:10.1155/2021/6698010
Benoit, W. R., Sethi, D. K., and Fertl, W. H. (1980). “Geothermal well log analysis at desert peak, neaada,” in Proceeding of the SPWLA, 21thAnnual Logging Symposium, Lafayette, Indiana, July 1980.
Borazjani, O., Ghiasi-Freez, J., and Hatampour, A. (2016). Two intelligent pattern recognition models for automatic identification of textural and pore space characteristics of the carbonate reservoir rocks using thin section images. J. Nat. Gas. Sci. Eng. 35, 944–955. doi:10.1016/j.jngse.2016.09.048
Butt, F. M., and Naseem, S. (2022). Lithology identification and gross rock volume estimation of B-Sand in NIM Block, Lower Indus Basin, Pakistan. Arab. J. Geosci. 15, 321. doi:10.1007/s12517-021-09381-5
Chipera, S. J., Goff, F., Goff, C. J., and Fittipaldo, M. (2008). Zeolitization of intracaldera sediments and rhyolitic rocks in the 1.25 Ma lake of Valles caldera, New Mexico, USA. J. Volcanol. Geotherm. Res. 178 (2), 317–330. doi:10.1016/j.jvolgeores.2008.06.032
Clarkson, C. R., Freeman, M., He, L., Agamalian, M., Melnichenko, Y., Mastalerz, M., et al. (2012). Characterization of tight gas reservoir pore structure using USANS/SANS and gas adsorption analysis. Fuel 95, 371–385. doi:10.1016/j.fuel.2011.12.010
Dai, J. X., Ni, Y. Y., and Wu, X. Q. (2012). Tight gas in China and its significance in exploration and exploitation. Petroleum Explor. Dev. 39 (3), 277–284. (inChinese). doi:10.1016/s1876-3804(12)60043-3
Daigle, H., and Johnson, A. (2015). Combining mercury intrusion and nuclear magnetic resonance measurements using percolation theory. Transp. Porous Media 111, 669–679. doi:10.1007/s11242-015-0619-1
Dev, V. A., and Eden, M. R. (2019). Formation lithology classification using scalable gradient boosted decision trees. Comput. Chem. Eng. 128, 392–404. doi:10.1016/j.compchemeng.2019.06.001
Djebbar, T., and Erle, C. D. (2012). Petrophysics: Theory and practice of measuring reservoir rock and fluid transport properities, 3rd edition. Elsevier(Singapore) Pte Ltd.
Dong, S., Zeng, L., Xu, C., Dowd, P., Gao, Z., Mao, Z., et al. (2019). A novel method for extracting information on pores from cast thin-section images. Comput. Geosci. 130, 69–83. doi:10.1016/j.cageo.2019.05.003
Enkin, R. J., Hamilton, T. S., and Morris, W. A. (2020). The henkel petrophysical plot: Mineralogy and lithology from physical properties. Geochem. Geophys. Geosyst. 21 (1), 818. doi:10.1029/2019gc008818
Esfahani, M. R., and Haghighi, M. (2004). Wettability evaluation of Iranian carbonate formations. J. Pet. Sci. Eng. 42 (2-4), 257–265. doi:10.1016/j.petrol.2003.12.016
Gong, Y. J., and Liu, K. Y. (2020). Pore throat size distribution and oiliness of tight sands-A case study of the Southern Songliao Basin, China. J. petroleum Sci. Eng. 184, 106508. doi:10.1016/j.petrol.2019.106508
Gu, Y. F., Bao, Z. D., and Rui, Z. H. (2018). Complex lithofacies identification using improved probabilistic neural networks. Petro. S. Journ. 59 (2), 245–267. doi:10.30632/pjv59n2-2018a9
Huang, D., Li, Y., Liu, M., Yang, J., Bai, R., and Yang, Z. (2017). Reservoir features and exploration potential of the 1st member of Shaximiao Formation of Middle jurassic in central Sichuan Basin. China Pet. Explor. 22 (2), 44–49. (In Chinese). doi:10.3969/j.issn.1672-7703.2017.02.005
Jadoon, Q. K., Roberts, E., Thomas, B., Wust, R. J. A., and Shah, S. A. (2016). Petrophysical evaluation and uncertainty analysis of Roseneath and Murteree shales reservoirs in Cooper Basin, Australia (a case study). J. Petroleum Sci. Eng. 147, 330–345. doi:10.1016/j.petrol.2016.06.010
Kahle, M., Kleber, M., and Jahn, R. (2002). Review of XRD-based quantitative analyses of clay minerals in soils: The suitability of mineral intensity factors. Geoderma 109, 191–205. doi:10.1016/s0016-7061(02)00175-1
Koporulin, V. I. (2013). Formation of laumontite in sedimentary rocks: A case study of sedimentary sequences in Russia. Lithol. Min. Resour. 48 (2), 122–137. doi:10.1134/s002449021302003x
Kyle, J. R., and Ketcham, R. A. (2015). Application of high resolution X-ray computed tomography to mineral deposit origin, evaluation, and processing. Ore Geol. Rev. 65, 821–839. doi:10.1016/j.oregeorev.2014.09.034
Lai, J., Pang, X., Xiao, Q., Shi, Y., Zhang, H., Zhao, T., et al. (2019). Prediction of reservoir quality in carbonates via porosity spectrum from image logs. J. Petroleum Sci. Eng. 173, 197–208. doi:10.1016/j.petrol.2018.10.022
Li, G. X., and Zhu, R. K. (2020). Progress, challenges and key issues of unconventional oil and gas development of CNPC. China Pet. Explor. 25 (2), 1–13.
Li, J., Jiang, H., Wang, C., Zhao, Y., Gao, Y., Pei, Y., et al. (2017). Pore-scale investigation of microscopic remaining oil variation characteristics in water-wet sandstone using CT scanning. J. Nat. Gas. Sci. Eng. 48, 36–45. doi:10.1016/j.jngse.2017.04.003
Li, S., Zhou, K., Zhao, L., Xu, Q., and Liu, J. (2022). An improved lithology identification approach based on representation enhancement by logging feature decomposition, selection and transformation. J. Petroleum Sci. Eng. 209, 109842. doi:10.1016/j.petrol.2021.109842
Liu, G. (2021). Challenges and countermeasures of log evaluation in unconventional petroleum exploration. Petroleum Explor. Dev. 48 (5), 891–902. doi:10.11698/PED.2021.05.02
Liu, J., Chang, Q., Lin, C., Zhang, J., and Xia, S. (2016). A new method of deep carbonate lithology identification at the Tadong uplift in the eastern section of the Tarim Basin. Arab. J. Geosci. 9, 118. doi:10.1007/s12517-015-2050-x
Lu, W., Zhu, G., and Li, D. (2004). Discovery of sloanite sandstone reservoir of jurassic xiashaximiao Formation in central sichuan region and its significance. China Pet. Explor. 5, 53–58.
Ma, M., Li, C., Lv, C., Chen, G., Yang, F., Yan, Y., et al. (2017). Geochemistry and provenance of a multiple-stage fan in the upper miocene to the pliocene in the yinggehai and qiongdongnan basins, offshore south China sea. Mar. Pet. Geol. 79, 64–80. doi:10.1016/j.marpetgeo.2016.11.001
Mao, Z. Q., He, Y. D., and Ren, X. J. (2005). An improved method of using NMR T2 distribution to evaluate pore size distribution. Chin. J. Geophys. 48 (2), 412–418. doi:10.1002/cjg2.668
Mateen, H., Naveen, H., Ghulam, B., Kanungo, S., Thusu, B., Craig, J., et al. (2022). An assessment of the source potential and reservoir characterization for tight gas exploration in the Subathu Formation shale, Himalayan Foreland Basin, Northwestern India. J. Asian Earth Sci. 230, 105205. doi:10.1016/j.jseaes.2022.105205
Roberto, A. (2013). Flow units: From conventional to tight gas to shale gas to tight oil to shale oil reservoirs[C]. Monterey, California: Society of Petroleum Engineers. (SPE-165360).
Sauerer, B., Al-Hamad, M., Ma, S. M., and Abdallah, W. (2020). Effect of oil-based-mud filtrate on the wettability of rock surfaces with different mineralogy and topology. Energy fuels. 34 (7), 8250–8259. doi:10.1021/acs.energyfuels.0c01335
Shao, X., Pang, X., Jiang, F., Li, L., Huyan, Y., and Zheng, D. (2017). Reservoir characterization of tight sandstones using nuclear magnetic resonance and incremental pressure mercury injection experiments: Implication for tight sand gas reservoir quality. Energy fuels. 31, 10420–10431. doi:10.1021/acs.energyfuels.7b01184
Slatt, E. M., and O’Neal, N. R. (2011). Pore types in the Barnett and Woodford gas shales: Contribution to understanding gas storage and migration pathways in fine-grained rocks. Am. Assoc. Pet. Geol. Bull. 95 (12), 2017–2030. doi:10.1306/03301110145
Thinesh, K., Seelam, N. K., and Rao., G. S. (2022). Lithology prediction from well log data using machine learning techniques: A case study from talcher coalfield, eastern India. J. Appl. Geophys. 199, 104605. doi:10.1016/j.jappgeo.2022.104605
US Energy Information Administration (2018). International energy outlook 2018. Washington: US Energy Information.
US Energy Information Administration (2019). Annual energy outlook 2019 with projections to 2050. Washington: US Energy Information Administration.
Wu, H., Li, N., Lan, C., Kong, X. Z., and Chai, H. (2013). Standard spectrum measurement and simulation of elemental capture spectroscopy log. Appl. Geophys. 10 (1), 109–116. doi:10.1007/s11770-013-0369-1
Wu, S. T., Zou, C. N., Zhu, R. K., Yao, J., Tao, S., Yang, Z., et al. (2016). Characteristics and origin of tight oil accumulations in the upper triassic yanchang formation of the ordos basin, north-Central China. Acta Geol. Sin. - Engl. Ed. 90 (5), 1821–1837. doi:10.1111/1755-6724.12819
Yan, J., He, X., Geng, B., Hu, Q. H., Feng, C. Z., Kou, X. P., et al. (2017). Nuclear magnetic resonance T2 spectrum multifractal characteristics and pore structure evaluation. Appl. Geophys. 14 (2), 205–215. doi:10.1007/s11770-017-0614-0
Yan, J., He, X., Zhang, S., Feng, C., Wang, J., Hu, Q., et al. (2020). Sensitive parameters of NMR T2 spectrum and their application to pore structure characterization and evaluation in logging profile: A case study from chang 7 in the yanchang formation, heshui area, ordos basin, NW China. Mar. Petroleum Geol. 111 (1), 230–239. doi:10.1016/j.marpetgeo.2019.08.025
Yang, X., and Qiu, Y. (2002). Formation process and distribution of laumontite in yanchang formation (upper triassic) of ordos basin. Acta Sedimentol. Sin. 20 (4), 628–632. doi:10.1007/s11769-002-0037-5
Yang, Y., Yang, J., and Yang, G. (2016). New research progress of Jurassic tight oil in central Sichuan Basin. Petroleum Explor. Dev. 43 (6), 873–882. (In Chinese). doi:10.11698/PED.2016.06.04
Yang, Y., Wang, X., Chen, S., Wen, L., Wu, C., Guan, X., et al. (2022). Sedimentary system evolution and sandbody development characteristics of Jurassic Shaximiao Formation in the central Sichuan Basin. Nat. Gas. Ind. 42 (1), 12–24. (in Chinese). doi:10.3787/j.issn.1000-0976.2022.01.002
Zhang, C., Zhu, D., Luo, Q., Liu, L., Liu, D., Yan, L., et al. (2017). Major factors controlling fracture development in the Middle Permian Lucaogou Formation tight oil reservoir, Junggar Basin, NW China. J. Asian Earth Sci. 146, 279–295. doi:10.1016/j.jseaes.2017.04.032
Zhang, C. S., Zhang, Y., Shi, X. J., Almpanidis, G., Fan, G., and Shen, X. (2019a). On incremental learning for gradient boosting decision trees. Neural process. Lett. 50 (1), 957–987. doi:10.1007/s11063-019-09999-3
Zhang, G., Wang, Z., Gu, X., Sun, Y., Sun, L., and Pan, L. (2019b). Characteristics of lacustrine dolomitic rock reservoir and accumulation of tight oil in the Permian Fengcheng Formation, the Western slope of the Mahu Sag, Junggar Basin, NW China. J. Asian earth Sci. 178, 64–80. doi:10.1016/j.jseaes.2019.01.002
Keywords: Sichuan Basin, calcareous tight sandstone, petrophysics, resistivity correction, water saturation
Citation: Yu Z, Jun J, Hua H, Yao D, Hongyi A and Shi F (2023) Resistivity correction and water saturation evaluation for calcareous tight sandstone reservoir: A case study of G oil field in Sichuan Basin. Front. Earth Sci. 10:1099848. doi: 10.3389/feart.2022.1099848
Received: 16 November 2022; Accepted: 05 December 2022;
Published: 04 January 2023.
Edited by:
Qiaomu Qi, Chengdu University of Technology, ChinaReviewed by:
Hongtao Wang, Chengdu University of Technology, ChinaXiaobin Li, China National Petroleum Corporation, China
Copyright © 2023 Yu, Jun, Hua, Yao, Hongyi and Shi. This is an open-access article distributed under the terms of the Creative Commons Attribution License (CC BY). The use, distribution or reproduction in other forums is permitted, provided the original author(s) and the copyright owner(s) are credited and that the original publication in this journal is cited, in accordance with accepted academic practice. No use, distribution or reproduction is permitted which does not comply with these terms.
*Correspondence: Jia Jun, ZS5jcnVpc2VyQDE2My5jb20=