
95% of researchers rate our articles as excellent or good
Learn more about the work of our research integrity team to safeguard the quality of each article we publish.
Find out more
ORIGINAL RESEARCH article
Front. Earth Sci. , 24 January 2023
Sec. Atmospheric Science
Volume 10 - 2022 | https://doi.org/10.3389/feart.2022.1098797
 Yidi Xue1,2,5
 Xiaopeng Cui2,3,4,5*
High-resolution numerical simulation data of super typhoon Rammasun simulated by the Weather Research and Forecasting (WRF) Model was used to study the cloud microphysical processes under different hourly rainfall intensities. The grid points in the gale circle were categorized into four types (0–5, 5–20, 20–50, and 50- mm) based on hourly rainfall. The precipitation and microphysical characteristics under different types were investigated by diagnostic and statistical methods. The results showed that on the eve of the first landfall, extremely hourly heavy precipitation (50- mm type) was significantly enhanced compared to other types. The vertical movement was significantly reduced to the middle and lower troposphere which was very conducive to the relative movement and interaction of hydrometeors with the enhancement of the collision processes. The rainfall in the 5–20 and 20–50 mm types both mostly accounted for about 40% of the total rainfall in the gale circle, while that of the 0–5 and 50- mm types were generally smaller than the former two. As the rainfall intensity increased, the absolute conversion rates of all major cloud microphysical processes had shown increasing trends, especially the non-uniformity of Cnd (the condensation of water vapor to cloud water), Pracw (the accretion of cloud water by rain) and Dgacw (the accretion of cloud water by graupel). The relative contribution of Pgmlt (the melting of graupel) increased slightly and then decreased significantly from the 20–50 mm type (36.28%) to the 50- mm type (25.06%), while that of Pracw had significantly increased especially from the 20–50 mm type (41.77%) to the 50- mm type (50.97%), which was related to the upward motion characteristics.
China is one of the countries most severely affected by tropical cyclones in the world. In general, there are about nine tropical cyclones landing in China every year, ranking first in the world (Duan et al., 2014). Tropical cyclones (especially landfalling tropical cyclones) can bring heavy rain, especially extreme hourly rainfall events (Chen and Meng, 2001), constituting a great threat to the lives and properties of people. The China Meteorological Administration (CMA) recently planned to include hourly rainfall intensity into the standard of rainstorm warning signals. Thus, more attention should been paid to understanding the physical mechanisms and processes responsible for hourly heavy rainfall related to tropical cyclone.
A few studies have been conducted to study different aspects of tropical cyclone rainfall. For example, Cheng et al. (2009) pointed out that the melting of graupel and snow played an important role in the growth of rain water in the spiral rain belt, which may not be the dominant factor in the cloud wall. Hua and Liu (2013) also emphasized the importance of graupel in maintaining the precipitation on the surface and in the spiral rain belt of tropical cyclone Krosa (0716). Some studies mainly focused on the sensitivity results of the cloud microphysical parameterization schemes in the model (Chen et al., 2015; Chan and Chan, 2016; Deng et al., 2016). The above studies all paid attention to the microphysical characteristics of tropical cyclone rainfall, but few of them focused on the microphysical processes under different hourly rainfall intensities.
Ren and Cui (2014) discussed the differences of cloud-microphysical processes before and during the precipitation amplification associated with Bilis (0604) and revealed that the ice-phase hydrometeors contributed more to the surface rainfall. Huang et al. (2016) analyzed the cloud microphysical differences with precipitation intensity in a torrential rainfall event based on six-hourly accumulated rainfall. Liu and Cui (2018) founded that the relationship between hourly rainfall intensity and precipitation efficiency was not linear in tropical cyclone Bilis (0604). Guo et al. (2021) investigated the impact of typhoon precipitation intensity on the applicability of wind profiler radar. Overall, the study of the cloud microphysical processes of tropical cyclone with different hourly rainfall intensities is still quite limited (Cui et al., 2014; Zhao et al., 2020). Hence, more detailed studies and more cases are still needed. We are motivated to fill this gap by simulating and analyzing the microphysical processes under different hourly rainfall intensities related to tropical cyclone. For example, how does the hourly rainfall intensity change during the evolution of tropical cyclone? And what are differences of the key cloud microphysical processes and their contribution between different hourly rainfall intensities?
Super typhoon Rammasun is investigated in this study, causing severe damage to southern China. Rammasun quickly intensified into super typhoon before making landfall in China. At 0600 UTC 18 July 2014, the maximum wind speed near the center reached 72 m s−1 and the minimum sea level pressure at the center reached 888 hPa. It landed three times in China, such as Wenchang of Hainan, Xuwen of Guangdong and Fangchenggang of Guangxi (Xue and Cui, 2020). Some studies pointed out that the advantageous conditions for the rapid intensification of Rammasun with extreme hourly rainfall involved many aspects, for instance, the role of large-scale circulation evolution and sea surface temperature and dynamic perspectives (Chen et al., 2014; Zheng et al., 2014; Zhang et al., 2017; Li et al., 2020; Xiao et al., 2020). However, the complex interaction between macroscopic dynamic processes and cloud microphysical processes both contribute to rainstorm (Tang et al., 2019). It is necessary to also examine the microphysical processes under different hourly rainfall intensities in Rammasun.
Based on previous studies, this study focuses on the processes of heavy rainfall during the period when Rammasun rapidly strengthened into super typhoon and landed in China using high-resolution simulation and diagnostic research by the WRF model. Section 2 briefly introduces the data and the model settings. The results are presented in section 3, and a summary is given in section 4.
The precipitation data used in this study was from a 0.1°× 0.1° resolution dataset generated through hourly precipitation observations by automatic weather stations in China and merged with CMORPH (Climate Prediction Morphing Technique) satellite data (Pan et al., 2012; Shen et al., 2013). The best track data was from the Shanghai Typhoon Research Institute of the China Meteorological Administration (Ying et al., 2014, https://tcdata.typhoon.org.cn/zjljsjj_zlhq.html). The initial and lateral boundary conditions were interpolated from the six-hourly final analysis data of the National Centers for Environmental Prediction (NCEP FNL) with a 1°× 1° resolution on 26 vertical levels (https://rda.ucar.edu/datasets/ds083.2/). The NCEP real-time global high-resolution daily sea temperature data (RTG_SST_HR) with a 1/12°×1/12° resolution was used (https://polar.ncep.noaa.gov/sst/ophi/verification.shtml).
The simulation was integrated for 72 h, using three nests with horizontal grid spacing of 54, 18, and 3 km, respectively. The initial time of the outermost two layers was 0000 UTC 16 July 2014, while the innermost layer started 6 h later. The Kain–Fritsch cumulus parameterization scheme was only used in the outermost two layers. Other physical parameterizations included the Goddard GCE microphysics scheme, YSU for the planetary boundary layer, the Monin–Obukhov surface-layer scheme, and the Dudhia cloud radiation scheme. As an extension of the conventional output, the numerical simulation also output the intermediate cloud microphysics data. Only the results of the 3 km high-resolution simulation data were used for simulation verification and other details in section 3.
According to previous studies (Xue and Cui, 2020), the water vapor causing heavy rainfall mainly came from the Arabian Sea, the Bay of Bengal, the South China Sea and the Northwest Pacific. Therefore, in order to ensure the performance of the simulation, the outermost area (D01) was expanded as much as possible to basically cover the source of water vapor and the large-scale circulation evolution, while the innermost zone (D03) mainly involved the area where Rammasun moved northwest to China, and landed three times in the observation.
Comparing the best track and the simulated one (Figure 1A) showed that the model generally simulated the northwestward movement of Rammasun well. The track deviation was mostly controlled within 60 km, especially within 40 km in the second half of the integration. Moreover, the moment and location of the three landfalls were very close to the observation (Figure 1A). In addition, the observed moving speed (Figure 1B) changed in the range of 4–7 m s−1, while the simulated one was slightly larger. However, the differences between the two (observation-simulation) were within the range of −2 to 1 m s−1.
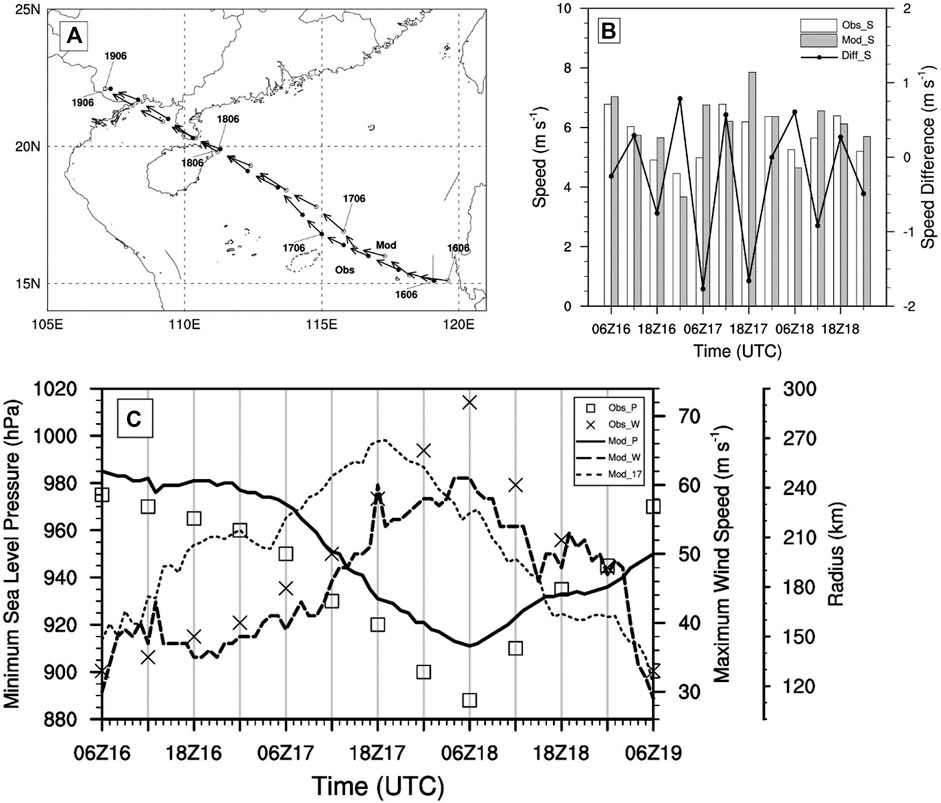
FIGURE 1. Observed and simulated (A) tracks, (B) speed (histogram, units: m s−1) and speed deviation (dotted line, units: m s−1), (C) time series of maximum wind speed (observation: crosses, simulation: dashed lines, units: m s−1), and minimum sea level pressure (observation: squares, simulation: solid lines, units: hPa) of Rammasun from 0600 UTC 16 July to 0600 UTC 19 July 2014. The arrow length in (A) represents the speed and the dirction of the arrow represents the direction of movement. The short dashed line in (C) represents the average radius with 17 m s−1 of 10-m wind
From the intensity comparison (Figure 1C), the minimum sea level pressure of Rammasun decreased rapidly at first and then increased both in the observation and simulation. The rapid enhancement process before landing and the weakening process after landfall had been well simulated and reproduced. However, the simulated minimum sea level pressure near the center was mostly higher than the observation, indicating that the simulated tropical cyclone was weaker, and the minimum sea level pressure rose slower than the observation after landfall, indicating the simulated tropical cyclone decayed slower, which may be due to the fact that the maximum horizontal grid spacing of the simulation (3 km) was still relatively coarse. The observed and simulated minimum sea level pressure both reached its minimum value (888 hPa and 910 hPa, respectively) at around 0600 UTC 18 July. Although there were some differences in the simulated and observed intensity of Rammasun, both of them reached the super typhoon level and maintained for a long time.
In addition, in order to analyze the cloud microphysical characteristics of different hourly rainfall intensities, it was necessary to define the study area of the tropical cyclone. There are many ways to select circulation areas of tropical cyclone. Some studies studied rainfall within a circular area with a fixed radius from the center of tropical cyclone (Lau et al., 2008; Wang et al., 2019a; 2019b). Others chose the area surrounded by the closed contour line with zero tangential wind vorticity at 850 hPa (Wu and Lei, 2012), or the radius of 17 m s−1 of 10-m wind (Chan and Chan, 2016). The distribution of radar reflectivity at different altitudes during the oceanic stage had also been regarded as storm circulation (Yang et al., 2011). In this paper, the main circulation and precipitation area of Rammasun was defined similar to Chan and Chan (2016).
The box-and-whisker plot of the distance between the grid point with 17 m s−1 of 10-m wind and the center of Rammasun simulated in D03 showed that the distribution of the distance was relatively concentrated, indicating that Rammasun had a relatively symmetrical structural feature. Meanwhile, the average at each moment was similar to the median. Therefore, this paper selected the average of the distance as the radius of the gale circle. The circular area surrounded by the tropical cyclone center and the above-mentioned gale circle, was defined as the main circulation and precipitation area of Rammasun. The radius of the gale circle was generally unimodal (Figure 1C), increasing from the beginning of the simulation. When the main circulation of Rammasun began to touch the land (around 2000 UTC 17 July, see Figure 3), the radius began to decrease and the main circulation began to shrink, indicating that the radius of the gale circle reached its peak earlier than the tropical cyclone intensity. Rammasun became weakening and slowing down after entering the Beibu Gulf, but the decreasing trend of the radius of the gale circle almost stopped, which may be related to the changes of the underlying surface. During the entire integration period, the radius of the gale circle varied between 120 and 269 km. Although the gale circle radius and the maximum wind speed near the ground had similar changes over time, the peaks of the two were different, showing that the relationship between the intensity and scale of tropical cyclone were complex, which was consistent with the conclusions of Guo and Tan (2017).
From the observed cumulative rainfall from 1800 UTC 16 July to 0600 UTC 19 July 2014 (Figure 2A), heavy rainfall was brought to the South China Sea and the south coast of China along with the northwestward movement of Rammasun. The precipitation area was mainly distributed on the left side of the track. The simulated cumulative rainfall (Figure 2B) also reproduced the above characteristics, but the precipitation intensity was relatively strong. By comparing the 12-h interval observed (Figure 2C) and simulated (Figure 2D) rainfall in the gale circle, it can be more clearly seen that the model simulated the distribution and evolution characteristics of the hourly precipitation of Rammasun well. At 1800UTC 17 July, the precipitation strengthened near the center of the circulation, which were reflected in the simulation results. Rammasun became strongest before landing in China at 0600 UTC 18 July. The center of the observed and simulated heavy precipitation was both located on the east side of Hainan Island and the model also gave a good simulation of rainfall near the southwestern border of Guangxi.
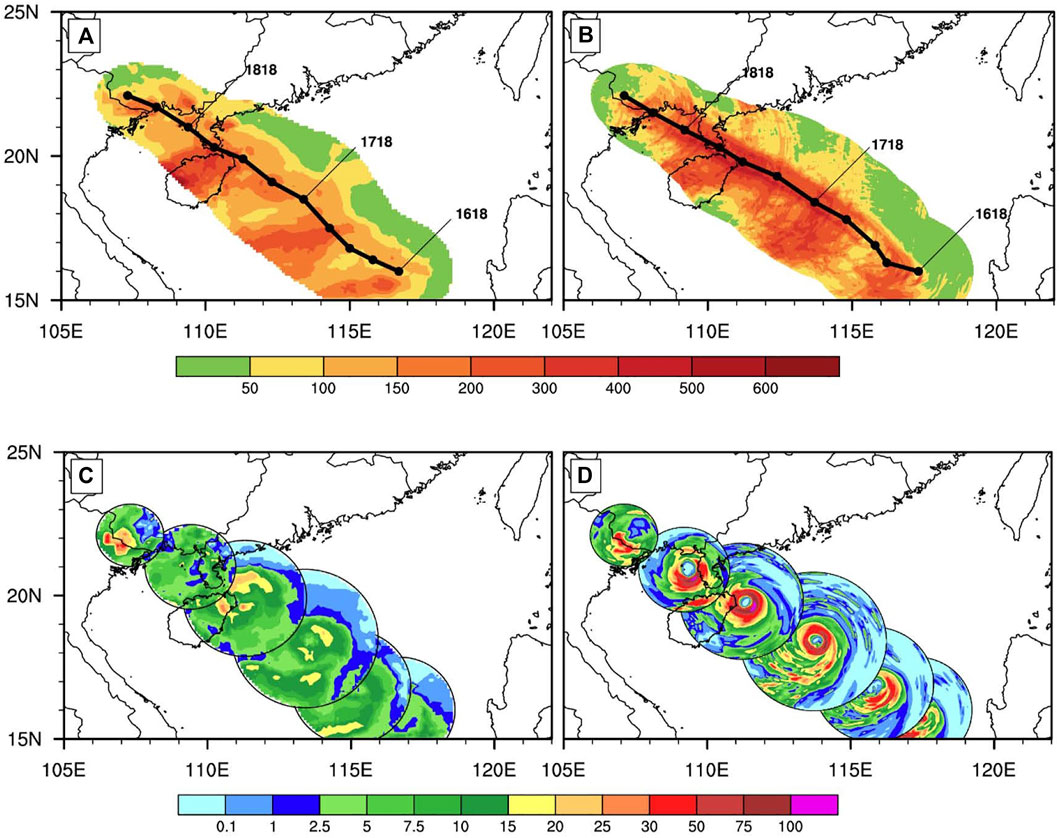
FIGURE 2. Spatial distribution of observed (A,C) and simulated (B,D) D03 cumulative rainfall (units: mm) of Rammasun in the gale circle from 1800 UTC 16 July to 0600 UTC 19 July 2014. The black lines in the (A,B) represent the observed and simulated track, respectively. (C,D) are for 12-h interval precipitation.
It should be pointed out that the intensity of the simulated precipitation (Figure 2D) was mostly obviously stronger than the observation (Figure 2C), especially on the sea, which may be due to the observed precipitation data used in this paper. The hourly precipitation data of automatic weather stations was integrated with precipitation products retrieved by the CMORPH satellite, especially on the sea, which was more reasonable to describe the overall spatial distribution and evolution characteristics of tropical cyclone precipitation, but the precipitation intensity was significantly underestimated (Sapiano and Arkin, 2009; Pan et al., 2011), especially for heavy rainfall (Yu et al., 2009). Therefore, in general, the model simulated and reproduced the overall distribution characteristics and evolution of precipitation in the gale circle of Rammasun, while the precipitation intensity was stronger than the observation, which may be due to the inherent shortcomings of the precipitation products retrieved by satellites.
Based on the comparison verification of the aforementioned track, moving speed, intensity and precipitation, the model had a good simulation of the development, landfalling process and precipitation characteristics of Rammasun. The high-resolution simulation data could be further analyzed for cloud microphysical characteristics.
In order to further understand the characteristics of different hourly rainfall intensities, the grid points in the 3 km simulation area were categorized into four types (0–5, 5–20, 20–50, 50- mm) based on the hourly rainfall. There was no clear classification for hourly rainfall until now. The four rainfall types was based on the definition of short-duration heavy rainfall events in China (Zhang and Zhai, 2011; Li et al., 2017) and the precipitation grading standards for 3-h heavy rainfall used by CMA. The 0- mm type was the sum of the four types.
The total rainfall and the corresponding numbers of grid points for each type had similar changes over time (Figure 3), while different evolution occurred between different types. From around 0400 UTC 17 July, the radius of the gale circle (Figure 1C), the total rainfall and numbers of grid points (0- mm, Figure 3) in the gale circle began to increase rapidly along with the rapid intensification of Rammasun (Figure 1C).
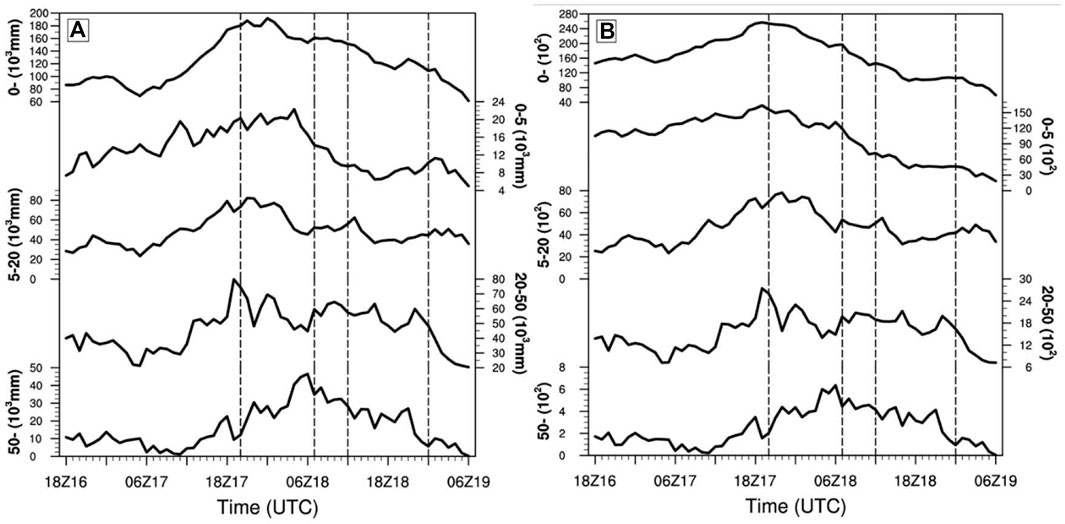
FIGURE 3. Time series of (A) total rainfall (unit: mm) and (B) numbers of grid points of different hourly rainfall intensities in the gale circle. The first vertical dotted line represents the moment when the gale circle began to touch the land. The other three vertical dotted lines correspond to the moments when Rammasun landed in China three times.
Although the radius of the gale circle began to decrease when the main circulation of Rammasun began to touch the land (around 2000 UTC 17 July), the total (0- mm type) numbers of grid points in the gale circle were more than 24,000 from 1700 UTC 17 July to 0000 UTC 18 July, which peaked at 25,711 at 1900 UTC 17 July (Figure 3). Meanwhile, the total (0- mm type) hourly rainfall exceeded 170,000 mm from 1800 UTC 17 July to 0200 UTC 18 July, which peaked at 191,697 mm at 0000 UTC 18 July, indicating that the radius of the gale circle, the overall rainfall and numbers of grid points reached their peak earlier than the intensity of Rammasun (0600 UTC 18 July).
During the first and second landfall, Rammasun continued to weaken. The radius of the gale circle (Figure 1C) and the numbers of grid points (0- mm type) gradually decreased, but the overall rainfall (0- mm type) had no obvious changes, which may be related to the enhancement and maintenance of the precipitation in the 5–20 and 20–50 mm types (Figure 3). In addition, the enhanced intensity of the precipitation over land in the gale circle may also make contribution at some extent.
When Rammasun entered the Beibu Gulf, its weakening trend became slow and the radius of the gale circle did not change much (Figure 1C). The rainfall of the 0–5 and 5–20 mm types remained relatively unchanged, but the one of the 20–50 and 50- mm types showed a decreasing trend, resulting in an overall decrease in the total rainfall (0- mm type) in the gale circle.
It was also worth noting that the peak moments of the rainfall for different types were different. The rainfall of the 50- mm type reached its peak 1 h before the first landfall, while the one of the 5–20 and 20–50 mm types peaked when the gale circle began to touch the land.
In order to make a detailed comparison of different types, Figure 4 showed the percentage of the rainfall and numbers of grid points from different hourly rainfall intensities to the total ones in the gale circle respectively. Generally, the percentage of grid points of the 0–5 mm type was largest and decreased over time, followed by the 5–20 mm type which surpassed the former after the third landfall. The proportions of grid points in the 20–50 mm and 50- mm types mostly showed a increasing trend, but the maximum value of the former was only about 20%. Meanwhile, the 50- mm type had the smallest percentage.
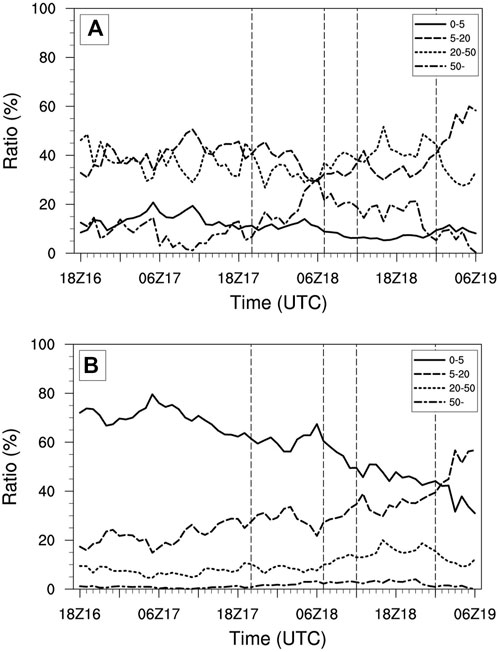
FIGURE 4. It is similar to Figure 3, but for the percentage (unit: %) of the rainfall (A) and numbers of grid points (B) of different hourly rainfall intensities to total rainfall and numbers of grid points in the gale circle respectively
The changes of the proportion of rainfall were significantly different from the one of grid points. The rainfall proportions of the 5–20 and 20–50 mm types accounted for a relatively large part, which fluctuated around 40% mostly, moreover the changes of them were obviously reverse in the latter integration period. The proportions of the 0–5 mm and 50- mm types were generally smaller than the former two types. When Rammasun was located at sea, the proportion of the 0–5 mm type was generally larger than that of the 50- mm type, but the latter began to increase significantly when the main circulation contacted with land and reached its peak before the first landfall (close to 30%), which was equivalent to the 5–20 and 20–50 mm types at that time. This showed that although the rainfall in the gale circle was weaker than the rapid reinforcement phase before the first landfall (Figure 3A), the extremely heavy hourly rainfall (50- mm type) had enhanced significantly compared with other types. This feature was also evident in the evolution of hourly rainfall intensity (Figure 5).
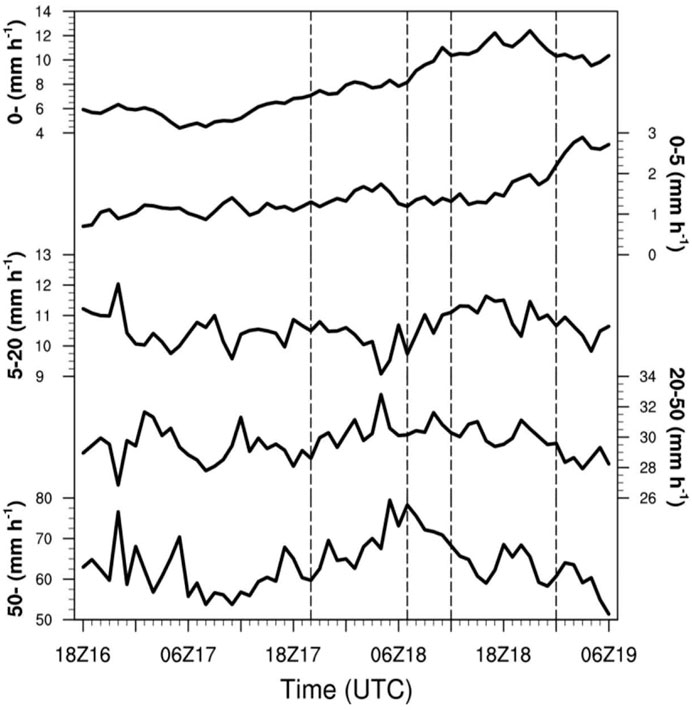
FIGURE 5. It is similar to Figure 3, but for the hourly rainfall intensity (units: mm h−1).
The average hourly rainfall intensity (0- mm) in the gale circle showed a gradual increase trend during the rapid intensification stage of Rammasun and peaked 12.40 mm h−1 at 2100 UTC 18 July when Rammasun was located at the Beibu Gulf. After the three landfalls, Rammasun significantly weakened and the overall hourly rainfall intensity also weakened slightly while that of the 0–5 mm type reached its peak. The changes of the 5–20 mm (9–12 mm h−1) and 20–50 mm type (27–33 mm h−1) were not as significant as the 50- mm type (50–80 mm h−1), whose intensity changed drastically in the early period on the sea and reached the peak (close to 80 mm h−1) before the first landfall.
The rainfall intensity was closely related to the vertical upward movement. Figure 6 showed the height-time evolution of the average vertical velocity of different hourly rainfall intensities in the gale circle. The center of the ascending movement was located in the middle and upper troposphere on the sea (0- mm type). As Rammasun had rapidly enhanced on the coast, the range of vertical ascending motion gradually expanded downward and the intensity gradually increased, but the height of the center of ascending motion still maintained. During the first two landfalls, the ascending movement center became strongest. The strong vertical ascending movement (above 0.4 m s−1) was mainly located above 9 km altitude, and the lower boundary of the vertical ascending movement (above 0.2 m s−1) extended to near 3 km altitude (0- mm type), indicating that the vertical ascending movement in the main circulation of the tropical cyclone was vigorously developed, which corresponded to the increase and peak of the hourly rainfall intensity during this period (Figure 5).

FIGURE 6. The height-time changes of the average vertical velocity (unit: m s−1) of different hourly rainfall intensities in the gale circle. The meanings of the vertical dotted lines are as same as Figure 3.
In general, the stronger the precipitation intensity, the stronger the vertical upward movement. The vertical upward movement of the 0–5 mm type was the weakest, but the concentration and the range of the strong upward movement during the landfall were both significantly larger than that during the oceanic stage. The distribution of the strongest vertical ascending movement (above 0.2 m s−1) in the 5–20 mm type was similar compared to the 0–5 mm type, which corresponded to the changes of the average rainfall intensity (Figure 5). The 20–50 mm type was different from the former two. The average ascending motion was significantly enhanced, and the strongest center was located in the first half of the oceanic stage and on the eve of the first landfall. There was a attenuation thereafter, which was consistent with changes of the corresponding average hourly rainfall intensity (Figure 5).
In contrast to the above three types, the average vertical upward movement of the 50- mm type was significantly enhanced, which the strongest was more than 4 m s−1. During the sea period, the range of 2 m s−1 was distributed from the top of the boundary layer to the upper troposphere, and the changes were also the most dramatic, reflecting the strong vertical movement and violent changes in the extreme rainfall. Compared with the oceanic stage, the vertical extension of the 50- mm type during the landfall period was significantly reduced to the middle and lower troposphere, and the extreme center was located at 5 km altitude, which was the biggest difference from the other three types. The average hourly rainfall intensity peak of the 50- mm type appeared before the first landfall, close to 80 mm h−1, even higher than that during the sea period (close to 77 mm h−1).
Therefore, not only the intensity of vertical ascending movement but also the vertical extension range of strong ascending movement was closely related to the rainfall intensity. The physical reasons were very worthy of detailed exploration, and the investigation required the analysis on different macroscopic and microscopic processes.
The cloud microphysical parameterization scheme used in this paper was the Goddard single-parameter scheme (Tao and Simpson, 1993; Tao et al., 2003; Tao et al., 2014). The main cloud microphysical transformation processes were shown in Tao et al. (2003). The scheme considered seven water substances, namely water vapor (Qv), cloud ice (Qi), snow (Qs), graupel (Qg) or hail (Qh), cloud water (Qc) and rain water (Qr). An option switch was set to select graupel or hail as the third class of ice substances. Graupel was mainly used for precipitation in tropical systems and was selected in this paper.
Water vapor was mainly concentrated in the middle and lower troposphere (Figure 7A). The distribution of water vapor in different types was generally similar, and the differences were mainly located in the near-surface layer. From further analysis in the lower troposphere (Figure 8), water vapor (above 21 g kg−1) was mainly distributed between 0600 UTC 17 July and 0600 UTC 18 July in the 0- mm type, corresponding with the rapid strengthening period of Rammasun (Figure 1C). Water vapor converged significantly toward the circulation center, and the cloud system developed significantly (Figure 1C).
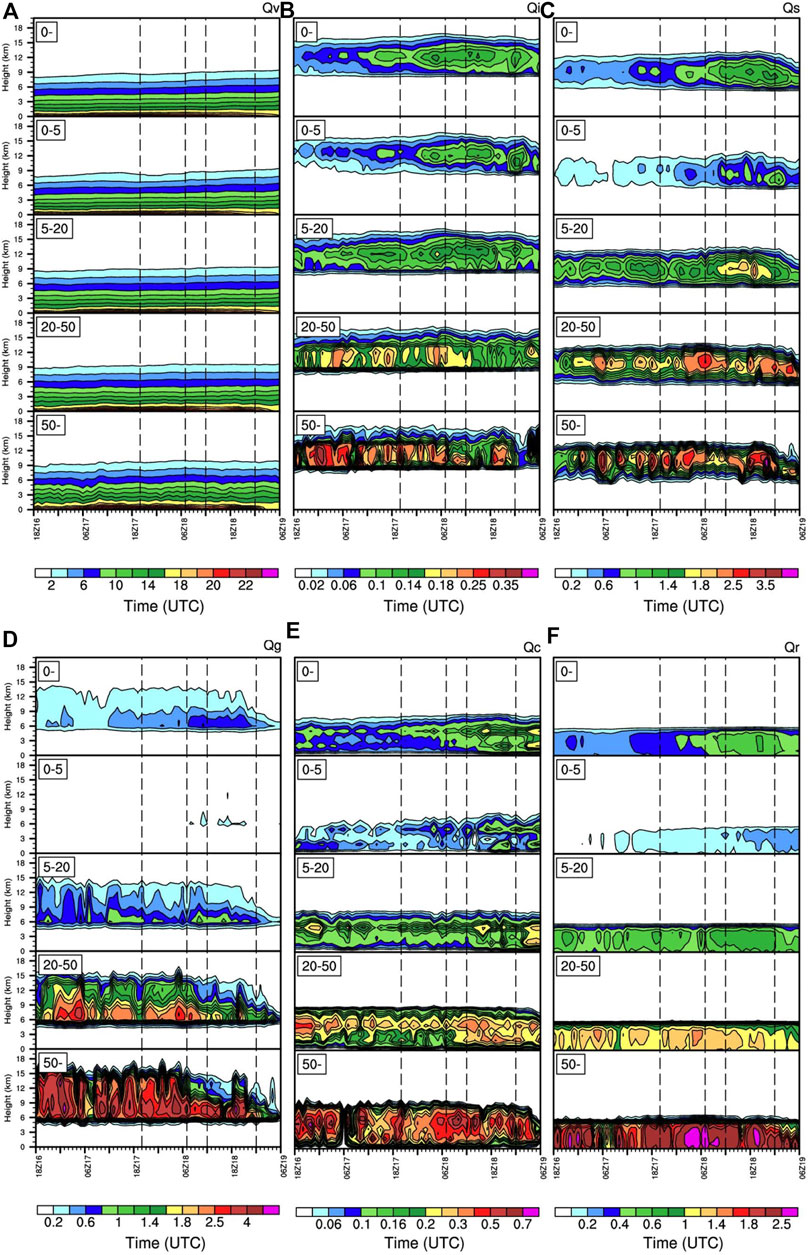
FIGURE 7. It is similar to Figure 6, but for the mixing ratio of (A) water vapor, (B) cloud ice, (C) snow, (D) graupel, (E) cloud water, and (F) rain water (unit: g Kg−1).
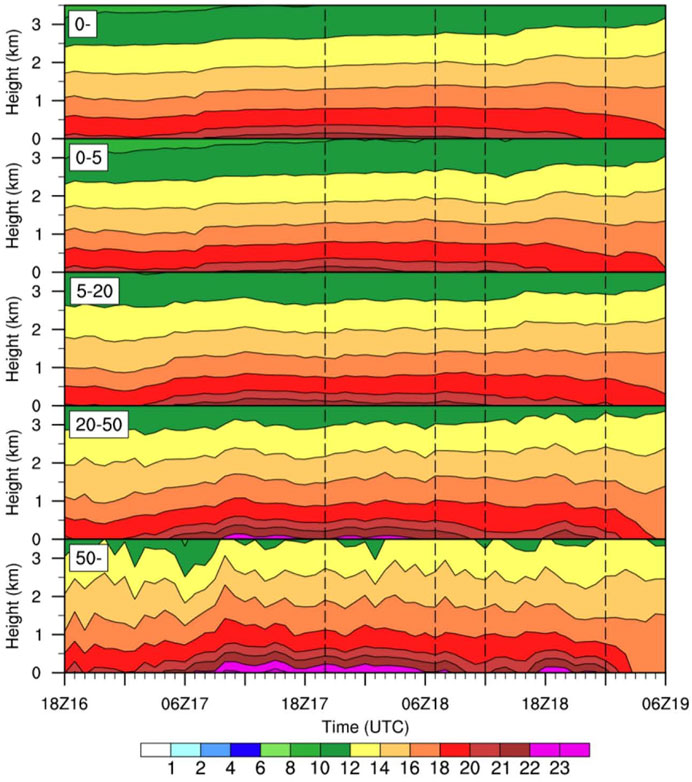
FIGURE 8. It is similar to Figure 7A, but the ordinate is adjusted to 0-3.5 km (lower tropospher, unit: g Kg−1)
Although the vertical distribution of water vapor in each type was similar to the 0- mm type, there were obvious differences in details. The range of water vapor above 18 g kg−1 was gradually expanded vertically from the 0–5 mm type to the 50- mm type, and the maximum value near the ground gradually increased, reflecting significant changes from weak stratified precipitation to extreme convective heavy precipitation. In addition, in the two types (20–50 mm and 50- mm), except for the enhancement period, the center of the second maximum appeared when Rammasun was located on the Beibu Gulf. The weakening of the attenuation trend of Rammasun (Figure 1C), the relatively stable and small change in the size of the gale circle (Figure 1C), the enhancement of sea surface evaporation and the convergence and concentration of water vapor were conducive to the increase of water vapor content (Figure 7A) and the enhancement of the hourly rainfall intensity (Figure 5) in the Beibu Gulf.
Cloud ice (Figure 7B) was mainly distributed in the upper and middle troposphere above 6 km altitude. The vertical distribution of snow (Figure 7C) was slightly lower than that of cloud ice (Figure 7B). The distribution and evolution of the center corresponded well to the center of average vertical ascending motion (Figure 6). However, it was slightly delayed in terms of time, which may be related to the complicated cloud microphysical transformation processes related to snow.
Graupel (Figure 7D) had a wider range of vertical distribution than cloud ice and snow, and its lower boundary of the vertical distribution was lower than the latter (Figure 7C). The content of graupel in weaker precipitation (0–5 and 5–20 mm types) was significantly less than in stronger precipitation (20–50 and 50- mm types). Before the first landfall, along with the significant vertical contraction of the average vertical ascending motion (Figure 6), the distribution of graupel (Figure 7D) also shrinked significantly, which may be related to the fact that the mixing ratio of graupel was relatively large and more sensitive to changes of vertical ascending motion.
Cloud water (Figure 7E) was mainly distributed in the middle and low troposphere, and the lower boundary was close to the ground. Its generation was mainly directly related to the condensation process of water vapor, and had an obvious relationship with the vertical upward movement. The stronger the upward movement (Figure 6), the more cloud water were pushed above the zero-degree layer, forming supercooled water (Figure 7E), and participating in the corresponding mixed-phase microphysical transformation process.
The lower bound of rain water (Figure 7F) was the lowest (to the ground), and the upper bound was mainly located below 6 km altitude. It corresponded well to the vertical upward movement over time (Figure 6). The center of maximum value (above 2.5 g kg−1) of the 50- mm type was mainly located during the first landfall period. The range of vertical movement was significantly reduced to the middle and lower troposphere, and the maximum value of vertical ascending movement (above 2 m s−1) was also slightly lower than that during the sea period (Figure 6). It was an interesting phenomenon worthy of attention. The reason needed to be revealed through detailed analysis of the cloud microphysical transformation processes.
In order to further understand the differences in the cloud microphysical characteristics of different hourly rainfall intensities in the main circulation of Rammasun, this paper selected the relevant simulated physical quantities from 1800 UTC 16 July to 0600 UTC 19 July 2014 to carry out statistical analysis (Figure 9). The total rainfall in the gale circle during this period reached more than 7.61×106 mm, and the average hourly rainfall intensity was 7.52 mm h−1. In terms of different types, grid points in the 0–5 mm type were the most, but its total rainfall was the least. Although grid points of the 50- mm type were significantly less than that of the 0–5 mm type, its total rainfall was slightly larger and its average hourly rainfall intensity was as high as 66.55 mm h−1. The 5–20 mm type had the largest total precipitation, which was about 3 times that of the 50- mm type (about 2.98×106 mm), but the average hourly rainfall intensity (10.55 mm h−1) was significantly lower than the former. The total precipitation of the 20–50 mm type was similar to the 5–20 mm type, while the grid points were about one-third of the latter. The average hourly rainfall intensity (29.79 mm h−1) was also significantly greater than the 5–20 mm type.
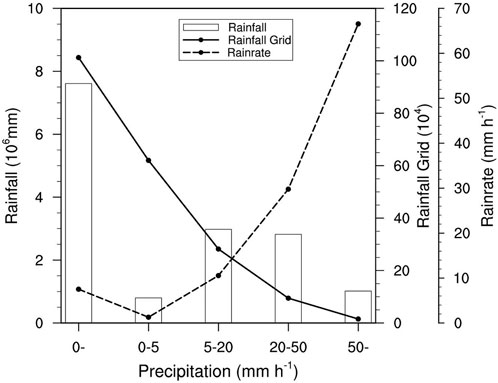
FIGURE 9. The accumulation of total rainfall (histogram, unit: mm), numbers of grid points (solid lines) and the average hourly rainfall intensity (dotted lines, unit: mm h−1) of different hourly rainfall intensities in the gale circle from 1800 UTC 16 July to 0600 UTC 19 July 2014.
The above-mentioned differences in different types were directly related to the differences in the cloud microphysical processes and budget of hydrometeors (Figure 10A-E). The vertical distribution of hydrometeors in different types were generally similar, but the mixing ratios were significantly different (Figure 10B-E). In general, as the rainfall intensity increased, the mixing ratios of snow, graupel, cloud ice, rain water and cloud water all increased, but not by the same amount.
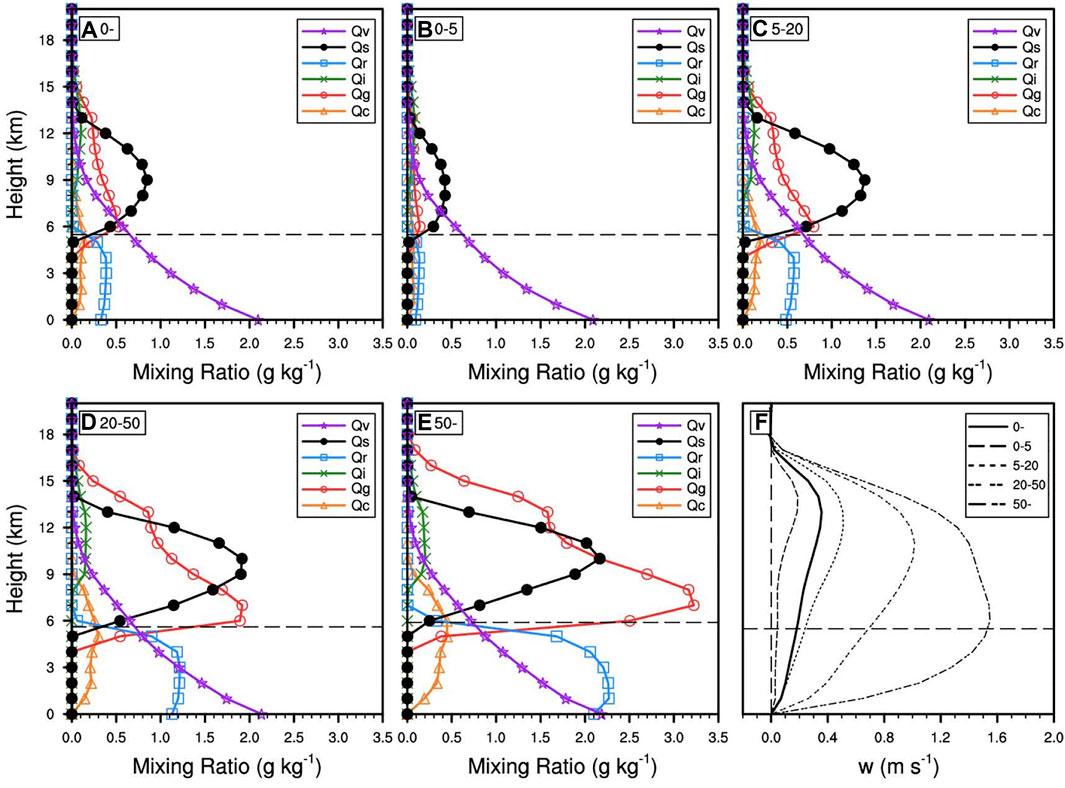
FIGURE 10. The time-averaged (from 1800 UTC 16 July to 0600 UTC 19 July 2014) hydrometeor mixing ratio of different rainfall intensities in the gale circle (A-E) unit: g Kg−1, 10 g Kg−1 for water vapor and (F) the vertical profile of the average vertical velocity (unit: m s−1). The horizontal dashed lines in (A-E) represent the average zero-degree height of grid points in different rainfall types. The horizontal dashed line in (F) is as same as (A)
Specifically, the water vapor content was relatively larger in the 20–50 and 50- mm types. Snow was mainly distributed above the zero-degree layer. As the precipitation intensity increased, the height of the mixing ratio maximum increased slightly related to the continuous increase of vertical ascending motion (Figure 10F). The vertical mixing ratio maximum increased from the 0–5 to 50- mm type by nearly 5 times. Graupel was also mainly distributed above the zero-degree layer, but it was more obvious under the zero-degree layer than snow. Its mixing ratio varied the most among different types and the maximum increased by about 23 times from the 0–5 to 50- mm type, and the peak height was slightly higher in the 20–50 and 50- mm types (especially the latter). Graupel may play an important role in the formation of rain water and the enhancement of precipitation.
The mixing ratio of rain water varied significantly between different types. The maximum value increased by nearly 17 times from the 0–5 to 50- mm type. The variation ranges of the mixing ratio of cloud water and cloud ice were equivalent to snow, and the maximum value only increased by 5.5 times and 2.5 times, respectively. Although the variation of cloud water between different types was relatively small, previous studies (Cui et al., 2014) pointed out that cloud water played an extremely important role in forming precipitation and may have relations with consumption in the formation process of rain water.
The vertical ascending motion of different heights in the troposphere of each type (Figure 10F) had enhanced significantly with the increase of hourly rainfall intensity corresponding to the mixing ratio with hydrometeors (Figure 10B-E). However, it was worth noting that the peak height gradually decreased. The ascending motion peaks of the 0–5, 5–20 and 20–50 mm types were all concentrated in the upper troposphere, while the 50- mm type was significantly different from them. In this type, the ascending motion of each layer in the troposphere was significantly enhanced, but the increase in the middle and lower troposphere was more obvious, exceeding the growth rate of the upper troposphere. The maximum value of this type was formed in the middle and lower troposphere (near 5–6 km altitude). Dynamic conditions would cause more hydrometeors to be uplifted, contributing to the formation of more supercooled water resulting of the significant uplift of cloud water and small rain water (Figure 10E). This was very conducive to the relative movement and interaction of hydrometeors with the enhancement of the collision process. The cloud microphysical processes became more active, and the precipitation intensity increased significantly (Figure 9). These significant changes in the vertical distribution of the average upward velocity of the 50- mm type were consistent with the analysis in Figure 6.
The microphysical flowchart and conversion processes of hydrometeors for the gale circle were shown in Figure 11. The microphysical conversion rates were averaged regionally and vertically in the gale circle under different hourly precipitation intensities. Total water vapor loss rate (WVL) was calculated using the sink terms of water vapor. Most of water vapor (V) was transformed into cloud water (C) through the condensation process (Cnd, 67.31%). Cloud water was mainly consumed by two microphysical transformation methods by Dgacw (accretion of cloud water by graupel) and Pracw (accretion of cloud water by rain water). Among them, the latter (Pracw = 1.88×10⁻⁶ kg kg−1 s−1) was more active than the former (Dgacw = 1.05×10⁻⁶ kg kg−1 s−1) and its relative contribution and absolute magnitude were close to twice the former. There were two main microphysical pathways (Cnd→Pracw and Cnd→Dgacw→Pgmlt) for the formation of rain water. A large amount of water vapor condensed into cloud water (Cnd). Some cloud water was touched by rain water and collected and directly converted into rain water (Pracw), and others were collided with and collected by graupel and converted into graupel (Dgacw), and then converted into rain water through the melting of graupel (Pgmlt), which was consistent with the conclusions of Cui et al. (2014) and Huang and Cui (2015). In addition, the microphysical process of condensation into cloud ice (Dep) was also significant. From the perspective of the final conversion rate of all hydrometeors, most of the water vapor was converted into rain water (2.84×10⁻⁶ kg kg−1 s−1), but a small part was converted into graupel (0.41×10⁻⁶ kg kg−1 s−1) and snow (0.33×10⁻⁶ kg kg−1 s−1). Cloud water (−0.15×10⁻⁶ kg kg−1 s−1) and cloud ice (-0.06×10⁻⁶ kg kg−1 s−1) were relatively small (Figure 11). However, the effect of cloud water was very large and should not be ignored.
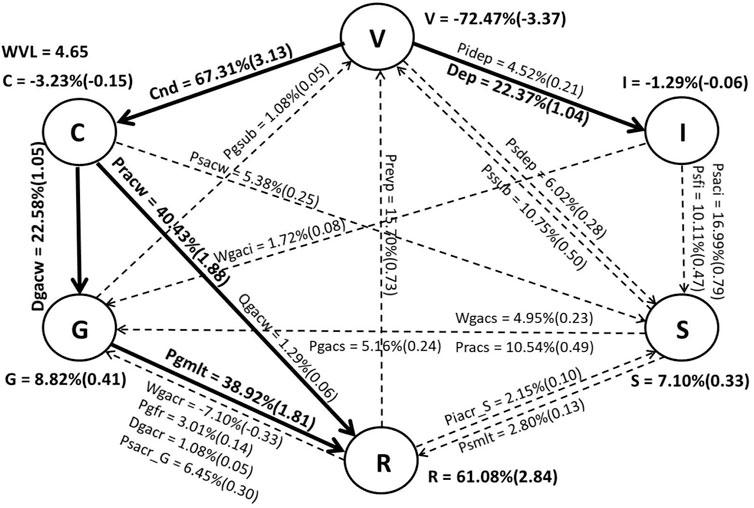
FIGURE 11. Microphysical flowchart for the gale circle in the period of 1800 UTC 16 July to 0600 UTC 19 July 2014. On the right-hand side of each microphysical conversion process notation, the values outside the bracket are the ratio of the vertically cumulative conversion rate to total water vapor loss rate (WVL) (thick solid arrows show ratios greater than 20%, dotted arrows show ratios between 1% and 20%, and values less than 1% are omitted), while the values inside the brackets are the microphysical conversion rates (units: 10-6 Kg Kg−1 s−1). The sum of all the microphysical process tendencies for each species is given by V (water vapor), C (cloud water), R (rain water), I (cloud ice), S (snow), and G (graupel) (due to the small order of magnitude, hail is omitted).
With the increase of hourly rainfall intensity, WVL gradually increased, indicating that the water vapor consumption rate was gradually increasing, and the absolute conversion rate (net formation rate) of rain water (R) also increased significantly (Figure 12). Graupel (G) was only slightly consumed in the 0–5 mm type (−0.03×10⁻⁶ kg kg−1 s−1), while increased in other three types. The absolute conversion rate in the 20–50 mm type (2.41×10⁻⁶ kg kg−1 s−1) was nearly 10 times larger than that in the 5–20 mm type (0.23×10⁻⁶ kg kg−1 s−1), furthermore, in the 50- mm type (9.40×10⁻⁶ kg kg−1 s−1) increased nearly 4 times compared with the 20–50 mm type. The absolute conversion rates of cloud water (C), snow (S) and cloud ice (I) also varied with rainfall intensity, which did not change as much as graupel. The net consumption rate of water vapor and the net growth rate of rain water and graupel gradually increased, which together contributed to the formation of heavy rainfall.
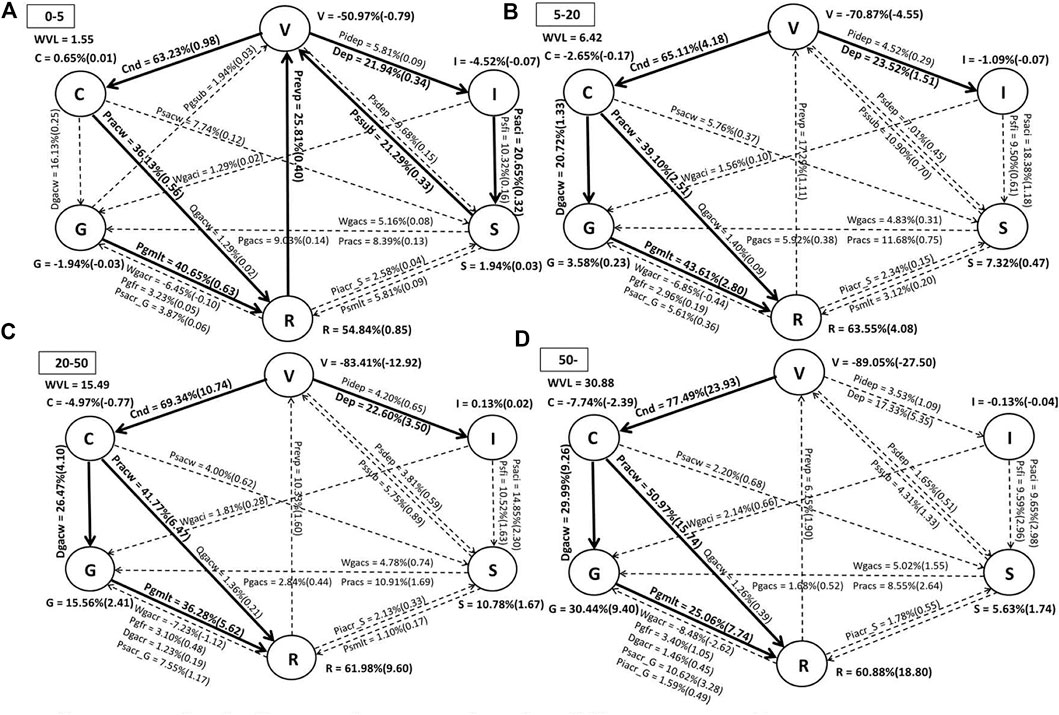
FIGURE 12. It is similar to Figure 11, but for different types (A): 0-5 mm, (B): 5-20 mm, (C): 20-50 mm, and (D): 50- mm).
In addition, it was worth noting that there were obvious differences in the main cloud microphysical transformation processes and relative contributions in different rainfall types. The 0–5, 5–20, 20–50, and 50- mm types had 7, 5, 5 and 4 main (solid arrows) conversion processes respectively. Compared with other types, in the 0–5 mm type, Dgacw was not the main process, and there were several other main transformation processes. As the rainfall intensity increased, the main transformation processes became more concentrated, and the absolute values gradually increased, which was in good agreement with Huang et al. (2016). Cnd, Dgacw, Pracw and Pgmlt increased most significantly, becoming the most important microphysical processes in heavy rainfall, which were most directly related to the formation of rain water, in particular the latter two. As the relative contribution, the ratios of Cnd, Pracw and Dgacw had gradually increased, especially the first two, but the ratios of Pgmlt, Dep, Prevp, Psaci, and Pssub had gradually decreased, especially the first one, which can be seen more clearly from Figure 13. The relative contribution of Pgmlt increased slightly and then decreased significantly from the 20–50 mm type (36.28%) to the 50- mm type (25.06%), while that of Pracw had significantly increased especially from the 20–50 mm type (41.77%) to the 50- mm type (50.97%). The ratios of Prevp, Psaci and Pssub had been lower than 20% from the 5–20 mm type, and Dep had also fallen below 20% in the 50- mm type.
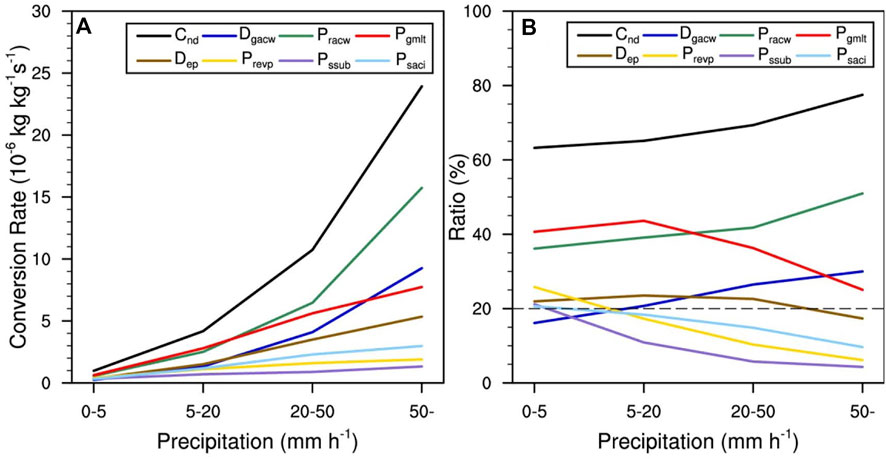
FIGURE 13. Vertically averaged cloud microphysical conversion rates (A), units: 10-6 Kg Kg−1 s−1 and the ratio of the conversion rates to WVL (B), unit: % of different rainfall intensities in the period of 1800 UTC 16 July to 0600 UTC 19 July 2014.
As mentioned earlier in this article, as the precipitation intensity increased, the upward movement of each height gradually increased, but the peak height of the vertical upward movement gradually decreased (Figure 10F). In the 50- mm type, the vertical ascending motion in the lower troposphere was significantly enhanced, surpassing that in the upper troposphere, and the peak height was near the zero-degree layer. The vertical distribution of this ascending motion would cause more hydrometeors to be uplifted, which may be to the disadvantage of Pgmlt and the advantage of the mixing ratio of graupel. The significant uplift of cloud water and small rain water was very conducive to the enhancement of the relative movement and interaction of hydrometeors, especially Pracw. From Figure 6, we can see that before the first landfall, the height of the strong ascending motion of the 50-mm type was significantly reduced, which would greatly contribute to the rapid enhancement of Pracw, resulting in the increase of its relative contribution.
In this study, microphysical differences under different hourly rainfall intensities in the gale circle of Rammasun were investigated by using high-resolution numerical simulation data from the WRF model. The grid points in the 3 km simulation area were categorized into four types (0–5, 5–20, 20–50, and 50- mm) based on hourly rainfall from 1800 UTC 16 July to 0600 UTC 19 July 2014. The major results can be summarized as follows:
During the entire integration period, the total rainfall and grid points of each type had similar changes over time, but the changes were different between different types, such as the peak moments of hourly rainfall. On the eve of the first landfall, extremely hourly heavy precipitation (50- mm type) was significantly enhanced compared to other types. Meanwhile, the range of the upward movement was significantly reduced to the middle and lower troposphere, and the extreme center was located near 5 km altitude. It maintained ascending movement much stronger than the other three types, corresponding to the strongest average hourly rainfall intensity (close to 80 mm h−1). The rainfall in the 5–20 and 20–50 mm types both mostly accounted for around 40% of the total rainfall in the gale circle, while that of the 0–5 and 50- mm types were generally smaller than the former two.
The difference of precipitation intensity was directly related to the difference of cloud microphysical processes in each type. The vertical distribution of hydrometeors in different types was generally similar, but the mixing ratios were obviously different. Generally, with the increase of hourly rainfall intensity, the mixing ratio of snow, graupel, cloud ice, rain water and cloud water all increased, while the mixing ratio of graupel varied the most among different types, followed by rain water. Cloud water and cloud ice had relatively small changes. Graupel may play an important role in the enhancement of precipitation. In addition, the values of vertical ascending motions at different heights in the troposphere of each type increased significantly as the precipitation intensifies, which corresponded well to the mixing ratio of hydrometeors. However, the peak height gradually decreased. The increase in the middle and lower troposphere was more obvious in the 50- mm type, exceeding the growth rate in the upper troposphere.
Most of water vapor (V) was transformed into cloud water (C) through the condensation process (Cnd, 67.31%). Cloud water was mainly consumed by Dgacw and Pracw. With the increase of hourly rainfall intensity, the absolute conversion rates of all major cloud microphysical processes had shown increasing trends, especially the non-uniformity of Cnd, Pracw and Dgacw. Pgmlt also had a significant increase, but its growth trend slowed down from the 20–50 to 50- mm type. Comparing the ratio of the absolute conversion rate of each cloud microphysical process to the total water vapor loss rate (relative contribution), the ratio of Cnd, Pracw and Dgacw gradually increased (especially the first two), but the ratio of Pgmlt, Dep, Prevp, Psaci and Pssub gradually decreased, which was related to the vertical velocity in each type. The increase of upward motion in the middle and lower troposphere (50- mm type) were very conducive to the enhancement of the relative motion and interaction of the hydrometeors, especially the significant enhancement of the collision process such as Pracw, resulting in the increase of its relative contribution.
Through the observation of dual-polarization radar, it was found that there were differences in the microphysical processes of precipitation in the inner rain belt and outer rain belt of tropical cyclones. The transformation process from cloud water to rain water may be more significant in the inner rain belt, while in the outer rain belt, the role of graupel may be more important. This article selects the gale circle focusing on the main circulation of tropical cyclone, but there are other zoning methods, for example, different quadrants, inner core and outer core areas. In the future, different zoning methods and different microphysical parameterization schemes should also be considered in order to research on regional physical processes, providing a deeper understanding of precipitation mechanism. Furthermore, we will analyze more cases to make the conclusions more robust and statistically significant.
The raw data supporting the conclusions of this article will be made available by the authors, without undue reservation.
YX made the whole calculations and analyses of this work, wrote the first draft. XC gave the idea of this work and substantially revised the manuscript. All authors were involved in helpful discussions and contributions to the manuscript.
This work was financially supported by National Natural Science Foundation of China (41705087) and National Basic Research Program of China (2015CB452804).
The authors thank to the anonymous reviewers who provided helpful comments that improved the manuscript greatly.
The authors declare that the research was conducted in the absence of any commercial or financial relationships that could be construed as a potential conflict of interest.
All claims expressed in this article are solely those of the authors and do not necessarily represent those of their affiliated organizations, or those of the publisher, the editors and the reviewers. Any product that may be evaluated in this article, or claim that may be made by its manufacturer, is not guaranteed or endorsed by the publisher.
Chan, K. T. F., and Chan, J. C. L. (2016). Sensitivity of the simulation of tropical cyclone size to microphysics schemes. Adv. Atmos. Sci. 33, 1024–1035. doi:10.1007/s00376-016-5183-2
Chen, J., Sun, H. M., Gao, A. N., Lin, Z. G., and Huang, M. C. (2014). Comparative analysis of intensity changes between super typhoons Rammasun (1409) and Damrey (0518) during the period of entering the Beibu Gulf. Torrential Rain Disasters 33, 392–400. doi:10.3969/j.issn.1004-9045.2014.04.012
Chen, L. S., and Meng, Z. Y. (2001). An overview on tropical cyclone research progress in China during the past ten years. Chin. J. Atmos. Sci. 25, 420–432. doi:10.3878/j.issn.1006-9895.2001.03.11
Chen, S., Qian, Y. K., and Peng, S. (2015). Effects of various combinations of boundary layer schemes and microphysics schemes on the track forecasts of tropical cyclones over the South China Sea. Nat. Hazards (Dordr). 78, 61–74. doi:10.1007/s11069-015-1697-7
Cheng, R., Yu, R. C., Fu, Y. F., and Xu, Y. P. (2009). Numerical research on intensity change and structure feature of Typhoon Rananim near shore. I: Impact of cloud microphysical parameterization on cloud structure and precipitation features. Acta Meteor. Sin. 67, 764–776. doi:10.3321/j.issn:0577-6619.2009.05.009
Cui, X. P., Wang, Y. P., and Yu, H. (2014). Microphysical differences with rainfall intensity in severe tropical storm Bilis. Atmos. Sci. Lett. 16, 27–31. doi:10.1002/asl2.515
Deng, L., Duan, Y. H., Gao, W. H., and Zhang, X. H. (2016). Numerical simulation and comparison of cloud microphysical features of super typhoon Rammasun (2014). Acta Meteor. Sin. 74, 697–714. doi:10.11676/qxxb2016.058
Duan, Y. H., Chen, L. S., Liang, J. Y., Wang, Y., Wu, L. G., Cui, X. P., et al. (2014). Research progress in the unusual variations of typhoon before and after landfalling. Acta Meteor. Sin. 72, 969–986. doi:10.11676/qxxb2014.085
Guo, X., and Tan, Z. M. (2017). Tropical cyclone fullness: A new concept for interpreting storm intensity. Geophys. Res. Lett. 44, 4324–4331. doi:10.1002/2017GL073680
Guo, Y., Tang, S. M., Wang, X., Tang, J., Zhao, B. K., and Zhang, S. (2021). Impact on typhoon precipitation intensity on the applicability of wind profiler radar. J. Trop. Meteor. 37, 268–276. doi:10.16032/j.issn.1004-4965.2021.025
Hua, C., and Liu, Q. J. (2013). Sensitivity of landfalling typhoon structure and precipitation to varying cloud microphysical progresses. J. Trop. Meteor. 29, 924–934. doi:10.3969/j.issn.1004-4965.2013.06.006
Huang, Y. J., and Cui, X. P. (2015). Dominant cloud microphysical processes of a torrential rainfall event in Sichuan, China. Adv. Atmos. Sci. 32, 389–400. doi:10.1007/s00376-014-4066-7
Huang, Y. J., Cui, X. P., and Wang, Y. P. (2016). Cloud microphysical differences with precipitation intensity in a torrential rainfall event in Sichuan, China. Atmos. Ocean. Sci. Lett. 9, 90–98. doi:10.1080/16742834.2016.1139436
Lau, K. M., Zhou, Y. P., and Wu, H. T. (2008). Have tropical cyclones been feeding more extreme rainfall? J. Geophys. Res. 113, D23113. doi:10.1029/2008JD009963
Li, H. Q., Cui, X. P., and Zhang, D. L. (2017). A statistical analysis of hourly heavy rainfall events over the Beijing metropolitan region during the warm seasons of 2007–2014. Int. J. Climatol. 37, 4027–4042. doi:10.1002/joc.4983
Li, X., Davidson, N. E., Duan, Y. H., Tory, K. J., Sun, Z. A., and Cai, Q. B. (2020). Analysis of an ensemble of high resolution WRF simulations for the rapid intensification of Super Typhoon Rammasun (2014). Adv. Atmos. Sci. 37, 187–210. doi:10.1007/s00376-019-8274-z
Liu, S. N., and Cui, X. P. (2018). Diagnostic analysis of rate and efficiency of torrential rainfall associated with Bilis (2006). Chin. J. Atmos. Sci. 42, 192–208. doi:10.3878/j.issn.1006-9895.1704.17148
Pan, Y., Shen, Y., Yu, J. J., and Zhao, P. (2012). Analysis of the combined gauge-satellite hourly precipitation over China based on the OI technique. Acta Meteor. Sin. 70, 1381–1389. doi:10.11676/qxxb2012.116
Pan, Y., Yu, J. J., Liao, J., and Yu, Y. (2011). Assessment on rainfall monitoring of typhoon Morakot by ground-gauged and satellite precipitation products. Meteor. Mon. 37, 564–570. doi:10.7519/j.issn.1000-0526.2011.5.007
Ren, C. P., and Cui, X. P. (2014). The cloud-microphysical cause of torrential rainfall amplification associated with Bilis (0604). Sci. China Earth Sci. 57, 2100–2111. doi:10.1007/s11430-014-4884-6
Sapiano, M. R. P., and Arkin, P. A. (2009). An intercomparison and validation of high-resolution satellite precipitation estimates with 3-hourly gauge data. J. Hydrometeorol. 10, 149–166. doi:10.1175/2008JHM1052.1
Shen, Y., Pan, Y., Yu, J. J., Zhao, P., and Zhou, Z. J. (2013). Quality assessment of hourly merged precipitation product over China. Trans. Atmos. Sci. 36, 37–46. doi:10.3969/j.issn.1674-7097.2013.01.005
Tang, J., Guo, X. L., and Chang, Y. (2019). A numerical investigation on microphysical properties of clouds and precipitation over the Tibetan Plateau in summer 2014. J. Meteorol. Res. 33, 463–477. doi:10.1007/s13351-019-8614-z
Tao, W. K., Lang, S., Zeng, X. P., Li, X. W., Mohr, K., Posselt, D., et al. (2014). The Goddard Cumulus Ensemble model (GCE): Improvements and applications for studying precipitation processes. Atmos. Res. 143, 392–424. doi:10.1016/j.atmosres.2014.03.005
Tao, W. K., Simpson, J., Baker, D., Braun, S., Chou, M. D., Ferrier, B., et al. (2003). Microphysics, radiation and surface processes in the Goddard Cumulus Ensemble (GCE) model. Meteorology Atmos. Phys. 82, 97–137. doi:10.1007/s00703-001-0594-7
Tao, W. K., and Simpson, J. (1993). Goddard cumulus ensemble model. Part I: Model description. Terr. Atmos. Ocean. Sci. 4, 035–072. doi:10.3319/TAO.1993.4.1.35(A)
Wang, X. H., Cui, X. P., and Hao, S. F. (2019a). Diagnostic and numerical study on surface rainfall processes associated with tropical cyclone Soudelor (2015) over the ocean. Chin. J. Atmos. Sci. 43, 417–436. doi:10.3878/j.issn.1006-9895.1804.18118
Wang, X. H., Cui, X. P., Hao, S. F., and Jiang, J. J. (2019b). A diagnostic and numerical study on surface rainfall process of tropical cyclone soudelor (2015) over the ocean: Sensitivity experiments on precipitation response to sea surface temperature change. Chin. J. Atmos. Sci. 43, 1125–1142. doi:10.3878/j.issn.1006-9895.1812.18204
Wu, L. Y., and Lei, X. T. (2012). Preliminary research on the size of inner core and periphery and their relationship with the intensity of tropical cyclones. J. Trop. Meteor. 28, 719–725. doi:10.3969/j.issn.1004-4965.2012.05.011
Xiao, Z. X., Yao, C., Luo, X. L., and Sun, H. M. (2020). A comparative study on the offshore intensification of supertyphoon Rammasun (2014) and typhoon rumbia (2013): The role of summer monsoon. Asia. Pac. J. Atmos. Sci. 12, 405–420. doi:10.1007/s13143-020-00204-3
Xue, Y. D., and Cui, X. P. (2020). Moisture sources and quantitative analyses of source contributions of precipitation associated with Rammasun (1409). Chin. J. Atmos. Sci. 44, 341–355. doi:10.3878/j.issn.1006-9895.1903.18245
Yang, M. J., Braun, S. A., and Chen, D. S. (2011). Water budget of typhoon Nari (2001). Mon. Weather Rev. 139, 3809–3828. doi:10.1175/MWR-D-10-05090.1
Ying, M., Zhang, W., Y, H., Lu, X. Q., Feng, J. X., Fan, Y., et al. (2014). An overview of the China Meteorological Administration tropical cyclone database. J. Atmos. Ocean. Technol. 31, 287–301. doi:10.1175/JTECH-D-12-00119.1
Yu, Z. F., Y, H., Chen, P. Y., Qian, C. H., and Yue, C. J. (2009). Verification of tropical cyclone-related satellite precipitation estimates in mainland China. J. Appl. Meteorol. Climatol. 48, 2227–2241. doi:10.1175/2009JAMC2143.1
Zhang, H., and Zhai, P. M. (2011). Temporal and spatial characteristics of extreme hourly precipitation over eastern China in the warm season. Adv. Atmos. Sci. 28, 1177–1183. doi:10.1007/s00376-011-0020-0
Zhang, X. H., Duan, Y. H., Wang, Y. Q., Wei, N., and Hu, H. (2017). A high-resolution simulation of supertyphoon Rammasun (2014)—Part I: Model verification and surface energetics analysis. Adv. Atmos. Sci. 34, 757–770. doi:10.1007/s00376-017-6255-7
Zhao, D. J., Yu, Y. B., Yin, J. F., and Xu, H. X. (2020). Effects of microphysical latent heating on the rapid intensification of Typhoon Hato (2017). J. Meteorol. Res. 34, 368–386. doi:10.1007/s13351-020-9076-z
Keywords: super typhoon rammasun, cloud microphysical processes, hourly rainfall intensity, melting of graupel, numerical simulation
Citation: Xue Y and Cui X (2023) Microphysical processes under different hourly rainfall intensities in super typhoon Rammasun. Front. Earth Sci. 10:1098797. doi: 10.3389/feart.2022.1098797
Received: 15 November 2022; Accepted: 30 November 2022;
Published: 24 January 2023.
Edited by:
Chenghai Wang, Lanzhou University, ChinaReviewed by:
Chunsong Lu, Nanjing University of Information Science and Technology, ChinaCopyright © 2023 Xue and Cui. This is an open-access article distributed under the terms of the Creative Commons Attribution License (CC BY). The use, distribution or reproduction in other forums is permitted, provided the original author(s) and the copyright owner(s) are credited and that the original publication in this journal is cited, in accordance with accepted academic practice. No use, distribution or reproduction is permitted which does not comply with these terms.
*Correspondence: Xiaopeng Cui, eHBjdWlAbWFpbC5pYXAuYWMuY24=
Disclaimer: All claims expressed in this article are solely those of the authors and do not necessarily represent those of their affiliated organizations, or those of the publisher, the editors and the reviewers. Any product that may be evaluated in this article or claim that may be made by its manufacturer is not guaranteed or endorsed by the publisher.
Research integrity at Frontiers
Learn more about the work of our research integrity team to safeguard the quality of each article we publish.