 Yewei Song
 Jie Guo1,2*
- 1Key Laboratory of Shale Gas and Geoengineering, Institute of Geology and Geophysics, Chinese Academy of Sciences, Beijing, China
- 2Innovation Academy for Earth Sciences, Chinese Academy of Sciences, Beijing, China
- 3College of Earth and Planetary Sciences, University of Chinese Academy of Sciences, Beijing, China
The Himalayan alpine canyon area is characterized by complex engineering geological conditions and abnormal internal and external dynamic geological processes. Severe slope disturbance disasters can be caused by engineering disturbances. In this study, field investigations and theoretical analyses were performed to determine the formation mechanism, spatial distribution law, and controlling factors of engineering disturbance disasters in the Himalayan alpine and canyon areas. A total of 396 engineering disturbance disasters were identified within the scope of the 2,800-km survey line. A geographic information system and mathematical statistical analysis were used to analyze the correlation between engineering disturbance disasters and factors such as the slope, slope aspect, elevation, peak ground acceleration, distance from fault, distance from river, rainfall, lithological changes, and historical earthquake effects. The statistical analysis indicates a good power-law and exponential distribution between the engineering disturbance disaster concentration and the slope and distance from the river, respectively. The slope and distance from the river are the two most important factors in determining the spatial distribution of engineering disturbance disasters; the other factors also influence the distribution to some extent. These factors affect the quality of the slope rock and soil mass, affecting slope stability. The main form of engineering disturbance in the study area is slope cutting. The direct result (increase in slope) and secondary result (decrease in rock mass quality caused by unloading rebound) of slope cutting are the most important factors inducing engineering disturbance disasters. Based on previous research results, factors in engineering disturbance disasters in alpine and canyon areas were evaluated, and the distribution of disturbance disasters along the China–Nepal Railway was predicted. The study area was divided into extremely high-(13.6%), high-(30.4%), medium-(34.1%), and low-susceptibility (22.0%) areas. The research results can provide a theoretical basis for prevention and treatment of engineering disturbance disasters in Himalayan alpine valley areas.
1 Introduction
The complex coupled geological environment of “five highs” (high altitude, high stress, high intensity, high ground temperature, and high water pressure) and “four poles” (extremely intense terrain cutting, extremely active tectonic activity, extremely complex lithological conditions, and extremely significant historical seismic effects) in the study area leads to extremely complex engineering geological conditions. Disasters caused by engineering disturbances frequently occur in this area (Zhan et al., 2018; Li et al., 2021a; Li et al., 2021b). Engineering disturbance disasters on highway slopes in deep canyons and mountainous areas pose a significant threat to the safety of highways and towns in the region and result in significant casualties and economic losses each year (Guzzetti et al., 2012; Tu et al., 2020; Zhang et al., 2020). The newly built China–Nepal Railway begins in Shigatse City in Tibet in the east and ends in Kathmandu, the capital of Nepal (Huang, 2020; Chen, 2021; Meng, 2021). To reduce engineering disturbance disasters caused by engineering construction, a detailed analysis of the distribution law of engineering disturbance disasters is required.
An engineering disturbance disaster is caused by construction or operation of a project, resulting in destruction of rock and soil mass, which endangers lives and the environment. Many researchers have studied the mechanism of engineering disturbance disasters, the risk of a single engineering disturbance disaster, and the impact of engineering construction on the natural environment (Qi et al., 2002; Chen et al., 2012; Troncone et al., 2014; Chang et al., 2015; Yu et al., 2017; Luo et al., 2018; Wang et al., 2018; Qingyun et al., 2019; Luo et al., 2020; Zhang et al., 2020; Wang et al., 2021). Zou et al. (2021) and Qi et al. (2010) analyzed the distribution regularity of seismic landslides in detail and derived statistical laws. The distribution law (development law) of engineering disturbance disasters has not been adequately studied. Previous research indicates that engineering disturbance disasters have a formation mechanism similar to that of natural geological disasters. The frequency of disasters has increased with engineering activities in the study area, but their intensity has decreased somewhat (Zhang et al., 1990).
The susceptibility assessment methods can be divided into deterministic methods and non-deterministic methods. The deterministic method is mainly based on the mechanical principle of disaster and quantitative method. For example, a fast physically-based model based on infinite slopes theory (Medina et al., 2021). The main non-deterministic model are information model, evidence weight model, certainty coefficient model, frequency ratio model, logistic regression model, support vector machine model, random forest model, artificial neural network model and other susceptibility evaluation models (Wang et al., 2019; Tang et al., 2021; Akinci et al., 2021; Wang et al., 2021; Wu et al., 2020; Sun et al., 2020; Bragagnolo et al., 2020). The principles of these susceptibility evaluation models fall into two categories: statistics and machine learning. And machine learning can be divided into statistical machine learning and reinforcement learning. Because its principles are similar, there is no essential difference in susceptibility evaluation models based on statistics and statistical machine learning; However, reinforcement learning evaluation methods do not show obvious advantages in prediction results, and the prediction results are poorly interpretable (Akinci et al., 2021). So, this paper adopts the information model (a typical statistical-based susceptibility evaluation model) as the evaluation method.
The distribution law of engineering disturbance disasters was examined in this study. We performed a spatial statistical analysis of 396 engineering disturbance disasters in the study area and quantitatively measured the impact of different factors. From the research results, the distribution of engineering disturbance disasters along the China–Nepal Railway was predicted using an information model.
2 Geological setting of study area
The study area and the proposed China–Nepal Railway (China section) are located in the south of Shigatse City; the geological background of the south of Shigatse is briefly introduced based on field investigation data and other research. With the movement of the Himalayas in the study area, the Indian plate has continued to squeeze the Eurasian plate, resulting in strong crustal uplift and river incision, which in turn results in denuded, mountainous, sedimentary landforms, and valley erosion. The highest altitude in the study area is 8,848.84 m (southern part of study area); the lowest altitude is 1,478.05 m (northern part of study area). The valley of southern Tibet, which has a relatively flat terrain, is a mid-altitude region. Tectonic uplift and river cutting were the final driving forces for high undulation.
The field survey route passes through two secondary tectonic units, the Brahmaputra suture zone and Himalayan orogenic belt, from the north (east) to the south (west). The northern part of the study area is the collision contact zone between the Indian and Eurasian plates, the Brahmaputra suture zone (ITSZ). The southern part contains the South Tibet Detachment Fault (STDS), dominated by detachment and extension. The study area has four active faults: the Xietongmen north–south active fault (XTMF), northern Himalayan normal fault (BXMLYF), Canda concealed fault (CDF), and Dajiacuo–Pekucuo north–south fault (DPF), and a large-scale thrust nappe structural system comprising the Himalayan thrust nappe (MHT) (Table 1). According to a survey, three of these are seismic faults and two are Holocene inactive faults (Meng, 2021).
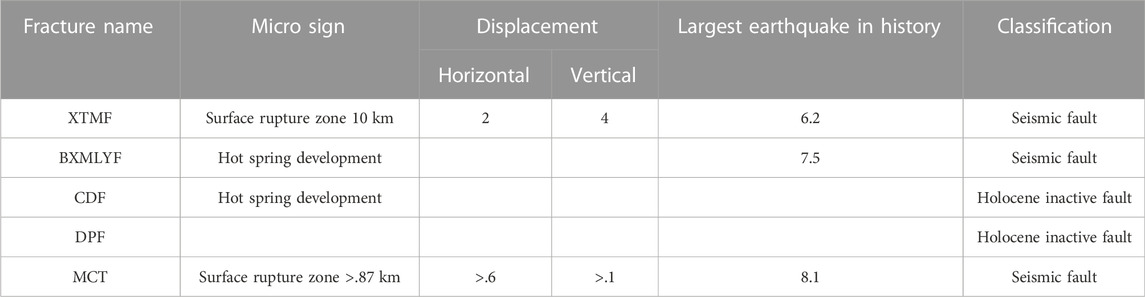
TABLE 1. Fracture properties in study area.
The Tibetan Plateau is a geological museum located in China. From the 1:200,000 geological map of Shigatse City (Figure 1), we observe that the strata in the study area vary from Sinian to Quaternary deposits. The lithology primarily includes sandstone, shale, limestone, slate, schist, granite, and Quaternary deposits. Ophiolite is exposed locally, consistent with the field investigation results. The lithology of the exposed strata along the survey line changes rapidly, with alternating sedimentary, metamorphic, and magmatic rocks.
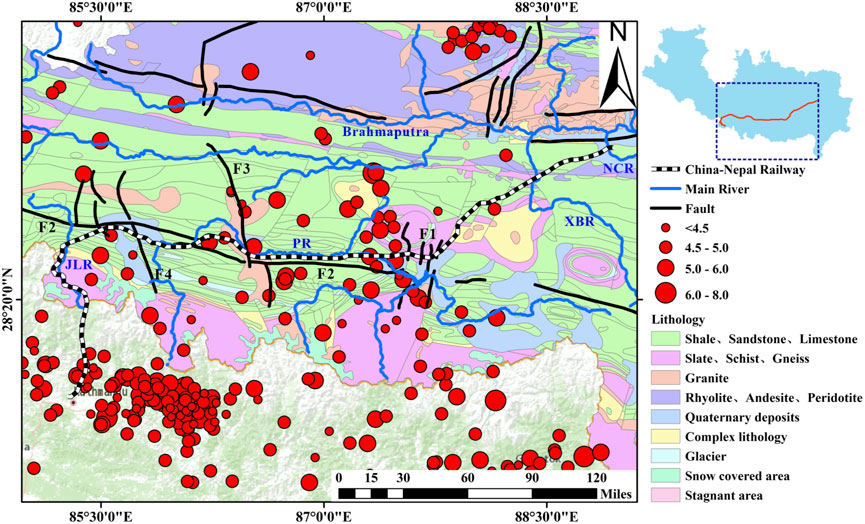
FIGURE 1. Geological map of the study area. F1, JiaGang–DingJie fault; F3, DangReYongCuo–DingRi fault; F4, DingRi fault; JLR, Gyirong River; PR, PengQu River; XBR, XiaBuQu River; NCR, NianChu River.
Except for the Nyalamu hydrological observation station, the average annual rainfall in the study area is generally less than 500 mm; most areas have approximately 300 mm of rainfall, as shown in Figure 2. The annual rainfall is relatively low and concentrated from June to September; thus, slope instability occurs frequently during the flood season. With the low annual precipitation in the northern part of the study area, the vegetation on the slope is mostly sparse herb plants. In the southern part of the study area, the climate is humid and the temperature is suitable; the vegetation is mostly dense shrubs and tall trees. When the slope stability analysis was performed, it was impossible to clarify whether the root-splitting effect of the plants or the slope protection effect had a primary role; thus, the type of slope vegetation was not considered as a factor.
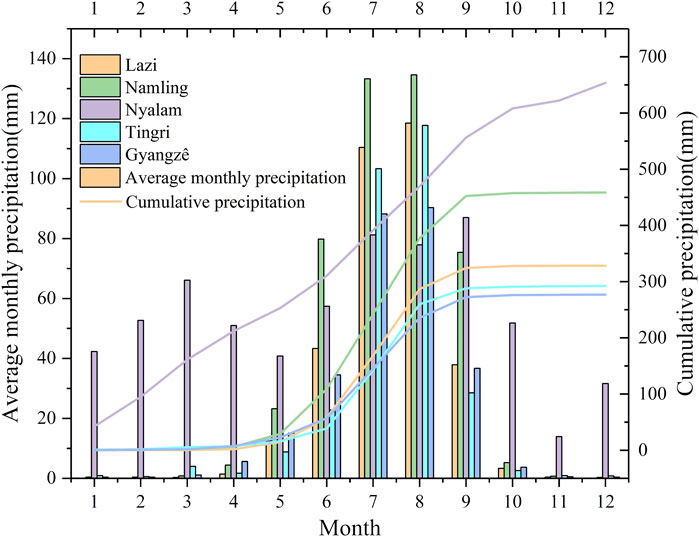
FIGURE 2. Monthly average and cumulative rainfall at hydrological stations in Tibet.
Under the action of strong crustal uplift and river incision, many V-shaped valleys developed in the study area; many steep slopes were formed on both sides of the rivers, including the Brahmaputra and its tributaries, the Pengqu, Gyirong, and Xiabuqu rivers. A field investigation indicated that the road and river are mostly parallel or intersect at a low angle and are affected by artificial slope cutting. Thus, the slopes on both sides of the road are relatively steep; the Pengqu and Gyirong rivers have a similar parallel relationship with the China–Nepal Railway, which is beneficial to project construction but provides terrain conditions for engineering disturbance disasters.
3 Data and methods
This study investigated and statistically analyzed engineering disturbance disasters on the slope along national highways, including G318, G219, and the main roads leading to the border areas (Yadong, Zhangmu, and Gyirong Ports) in the Himalayas. Since September 2020, several field inspections of more than 40 days have been conducted along the national highways in the Himalayas and the valleys. Based on a field survey, supported by remote sensing interpretation, detailed investigation and analysis of 396 engineering disturbance disasters along the National Highway on the Tibetan Plateau were performed. The altitude, lithology, slope height, slope angle, slope aspect, joint fissure, and vegetation distribution characteristics of the disasters were determined. The disaster distribution is shown in Figure 4.
Field investigations are primarily aimed at small-scale disasters (length, width, and height generally less than 100 m). Limited by the resolution of satellite and aerial images (30 m), remote sensing interpretation can only identify large-scale disasters (QuickBird, SPOT5, WorldView). For typical engineering disturbance disasters, unmanned aerial vehicles were used to capture images of the disaster points, and a three-dimensional model of the slope was established to further analyze the slope stability. Several engineering disturbance disasters clustered at one site without boundaries that could be discerned were recorded as one disaster. Thus, the engineering disturbance disasters considered in this study were slightly fewer than the actual engineering disturbance disasters that occurred in the area.
In this study, engineering disturbance disasters primarily refer to geological slope disasters including landslides, collapses (rock falls, rock avalanches), unstable slopes, and debris flows. As this study focuses primarily on the distribution regularity of engineering disturbance disasters, different types of disasters are considered as engineering disturbance disasters for a unified analysis. Collapse disasters are the most frequent, followed by unstable slopes, landslides, and debris flows. Collapse disasters can be further divided into rockfalls and rock avalanches, among which rock falls account for 90%. The frequency and volume of rockfalls follow a normal distribution. This study focuses primarily on engineering disturbance disasters caused by moving soil and rocks; that is, disasters caused by slope cutting and stacking and bridge and tunnel construction. Engineering disturbance disasters can be further divided into rock slope, soil–rock mixture slope, and soil slope engineering disturbance disasters (in descending order of frequency). Most engineering disturbance disasters in this area are caused by unloading rebounds triggered by slope cutting (Figure 3).
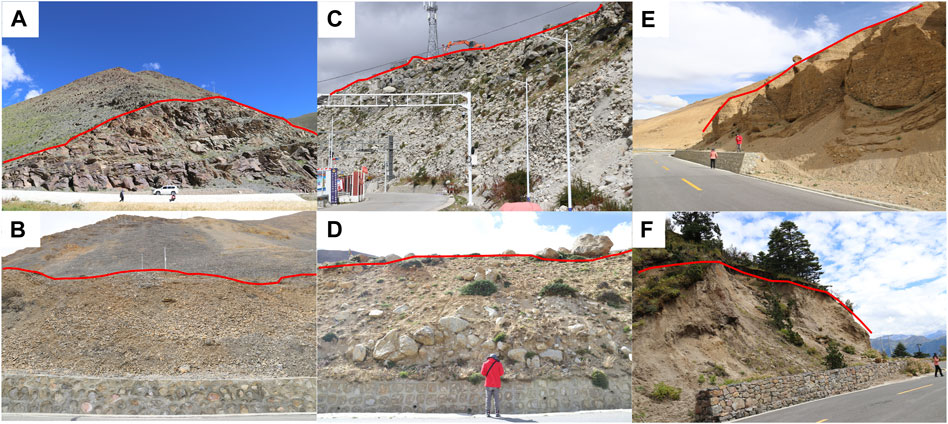
FIGURE 3. (A,B) Rock slope engineering disturbance disaster; (C,D) soil–rock mixture slope engineering disturbance disaster; (E,F) soil slope engineering disturbance disaster.
From the basic information of disaster points, ARCGIS geographic information system (GIS) software was used to quantitatively analyze the spatial distribution regularity of engineering disturbance disasters; data analysis software was used to fit the distribution law. The data sources and resolutions used in the study are presented in Table 2.
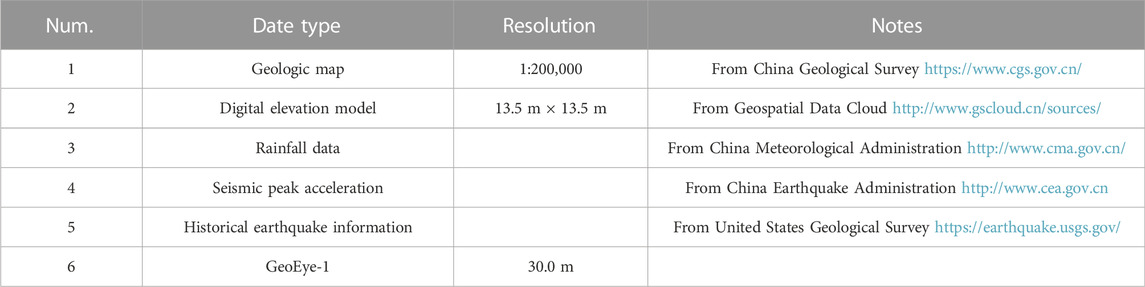
TABLE 2. Source and resolution of data.
With regional differences in the geographical environment, the mechanisms of geological disasters in different regions are complex; disaster susceptibility factors may be controlled by local and geological characteristics. We analyzed the spatial distribution characteristics of engineering disturbance disasters, clarified the spatial relationship between disasters and geological background and inducing factors, and determined the development regularity of engineering disturbance disasters through statistical analysis. To complete a reliable susceptibility map, comprehensive exploration of the relationships between potential influencing factors is essential for understanding and recognizing the key conditioning features of hazard formation and for the construction and operation of the China–Nepal Railway project.
According to the field investigation and previous research, nine evaluation factors were selected as indicators: elevation, gradient, slope aspect, lithology, rainfall, distance from river, distance from fault, intensity of historical earthquake impact, and seismic peak acceleration (the influence of the distance from the highway and engineering disturbance intensity factors were not considered because engineering disturbance disasters are almost all distributed within 30 m on both sides of the highway, mostly caused by cutting slopes, and have essentially the same intensity). Spatial distribution statistics were produced using the index of engineering disturbance disaster concentration (EDDC), expressed as the number of engineering disturbance disasters for each category (Qi et al., 2010). A greater EDDC indicates that a slope is more prone to disasters.
4 Distribution characteristics of engineering disturbance disasters
To obtain the distribution of engineering disturbance disasters, we first analyzed the potential relationship between engineering disturbance disasters and geological background and inducing factors to determine the influence of geological environmental factors. Through statistical analysis of engineering disturbance disasters (396) in Shigatse City, it was observed that engineering disturbance disasters are concentrated in the three ports of Yadong, Zhangmu, and Gyirong (Table 3). The EDDC values for these ports are 153.3, 76.0, and 88.2, respectively, which are far greater than the disaster density elsewhere in Shigatse City.

TABLE 3. EDDC in Shigatse City and three major ports.
4.1 Engineering disturbance disaster distribution with topographic factors
Evaluation factors describing slope morphology such as elevation, slope, and aspect are particularly effective in predicting the spatial distribution of geohazards (Fabbri et al., 2003). Thus, the relationship between common disaster-related factors such as elevation, slope, and aspect and engineering disturbance disasters was considered.
Elevation is a commonly used evaluation factor, primarily because it has a significant influence on topographic attributes, which explains the spatial variability of different landscape processes such as the zonal distribution of vegetation with an increase in altitude. It also has an impact on weathering intensity, rainfall, and terrain relief (Ding et al., 2016). Figure 4 shows the correlation between engineering disturbance disasters and EDDC and slope elevation. The 3,800–4,800 m range has the largest area, followed by 4,800–5,800 m, 2,800–3,800 m, and 1800–2,800 m. Most of the engineering disturbance disasters occurred at 3,800–4,800 m elevation, accounting for 61.3% of the total, as shown in Figure 4B. However, for elevations between 1,800 and 3,800 m, the EDDC is relatively high, significantly exceeding the disaster density of other elevations. This is consistent with the distribution characteristics of seismic landslide disasters in the Qin Ba Mountain area and Ludian, which are concentrated in areas with low elevation (Zhao, 2020; Zou et al., 2021). In lower-elevation areas, the relative elevation difference of the slope is large and the weathering is strong, resulting in more fragmented rock masses. Figure 5 shows the elevation change curve along the Chinese section of the China–Nepal Railway; the elevation fluctuates significantly, providing a terrain basis for the occurrence of disasters.
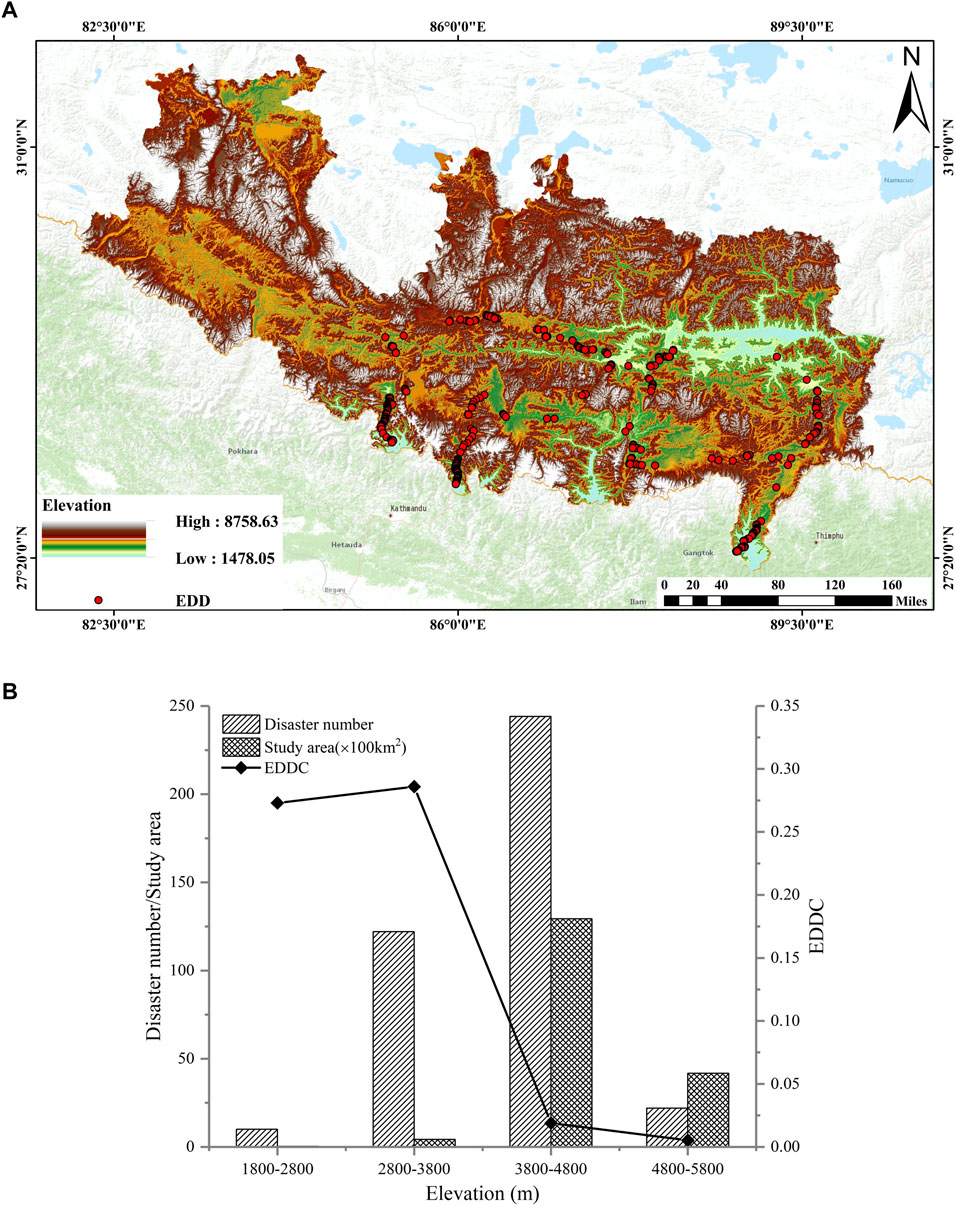
FIGURE 4. (A) Elevation map of the study area; (B) Relationship between engineering disturbance disaster distribution and elevation.
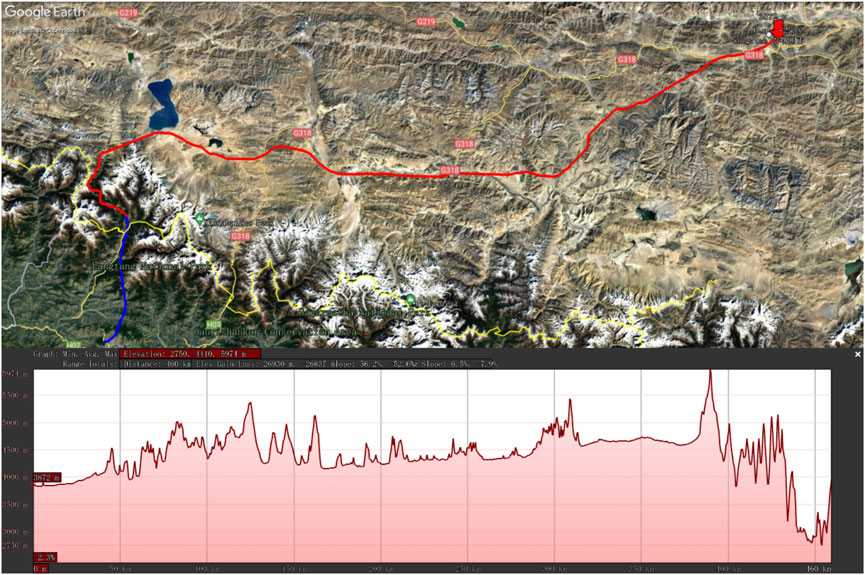
FIGURE 5. Elevation change along China–Nepal Railway.
According to the Mohr–Coulomb strength failure criterion and the effective stress principle, interaction of the slope angle, internal friction angle, cohesion strength, and rock and soil permeability controls the stability of the slope. Steep slopes correspond to higher shear forces, which directly affect slope instability (Niefeslioglu et al., 2008). Figure 6 shows the relationship between engineering disturbance disasters and EDDC and slope gradient. Most of the slope gradients are in the range of 0°–40°; several are in the range of 50°–90°. In Figure 6B, it is observed that the number of engineering disturbance disasters exhibits a linear growth trend with increasing slope, unlike the trend with coseismic landslides (Zou et al., 2021). The number and slope of coseismic landslides generally satisfy a Gaussian distribution because the number of natural slopes and the slope (depending on the natural angle of repose and cohesive strength of the rock mass) also satisfy a Gaussian distribution (Qi et al. al., 2010; Zou et al., 2021). After statistical analysis, Zou et al. (2021) concluded that the cumulative disaster density of Ludian earthquake landslides obeyed the Weibull distribution. In this study, we observed that EDDC has a good exponential distribution relationship with an increase in the slope (exponential distribution function F = .6073e1.1333x, R2 = .9835). Thus, we can conclude that although the occurrence mechanism of natural slope disasters and engineering disturbance disasters is the same, their distribution laws are considerably different.
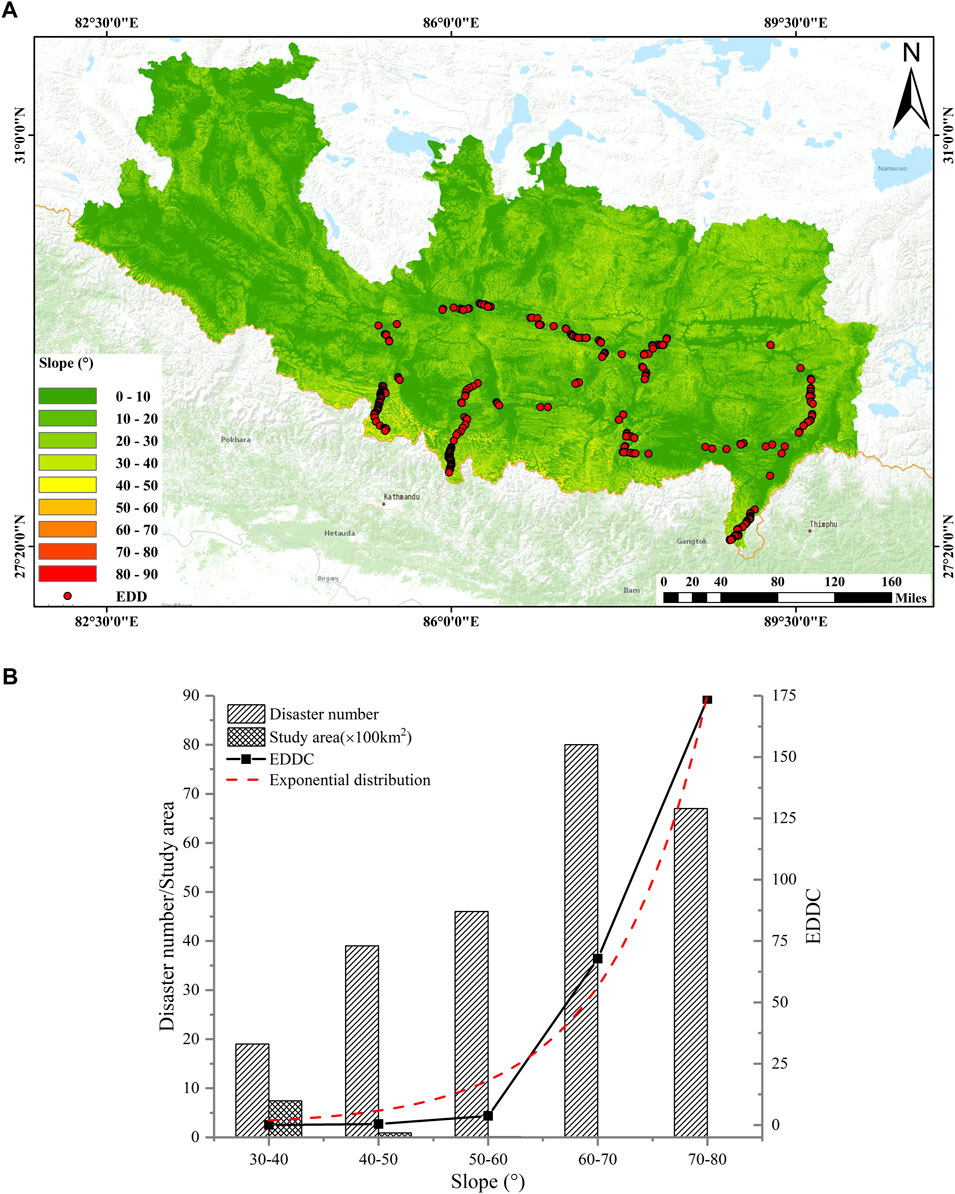
FIGURE 6. (A) Slope gradient map of the study area; (B) Relationship between engineering disturbance disaster distribution and slope.
Aspect has a considerable impact on slope stability; it affects rainfall intensity, vegetation, and temperature, affecting the weathering intensity (Kalantar et al., 2017). Figure 7 shows the relationship between aspect and engineering disturbance disasters and EDDC. The area of each slope direction is evenly distributed. The areas of the four slope types are essentially the same; the sunny-slope area is slightly larger. With the gradual transition from shady slopes to semi-shady, semi-sunny, and sunny slopes, the number of engineering disturbance disasters and EDDC both increase. The EDDC and aspect have a linear distribution (distribution function F = .0143 + .004x, R2 = .9952). The occurrence of engineering disturbance disasters is also affected by aspect, indicating a multi-factor coupling effect.
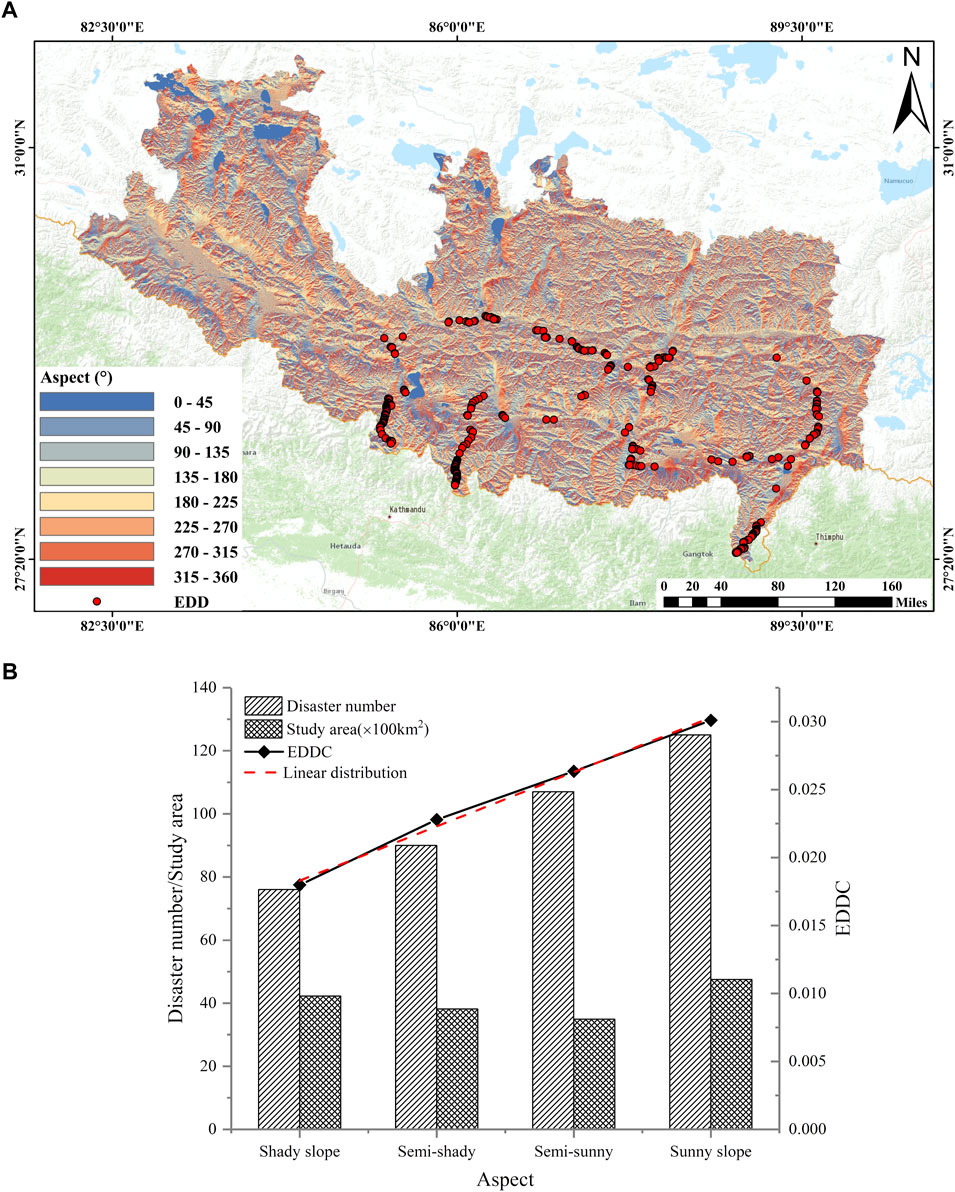
FIGURE 7. (A) Slope aspect map of the study area; (B) Relationship between engineering disturbance disaster distribution and aspect.
4.2 Engineering disturbance disaster distribution with seismological factors
The China Earthquake Administration (http://www.cea.gov.cn/) produced a peak acceleration map of ground motion in China, indicating the horizontal acceleration corresponding to the maximum value of the response spectrum of ground motion acceleration in the region, reflecting the intensity of earthquakes in the region. The seismic factor is an important indicator of slope failure; it indicates the slope stability in two ways. 1) Earthquakes disturb the slope and reduce the strength of the rock mass, and 2) they are an important inducing factor. Under the action of seismic waves, a series of changes occurs, such as the slope resonance and pore pressure increase. With an increase in the earthquake peak acceleration, the number of engineering disturbance disasters and EDDC both increase, as shown in Figure 8. The EDDC distribution indicates a quadratic function. With an increase in PGA, the number of engineering disturbance disasters increases significantly.
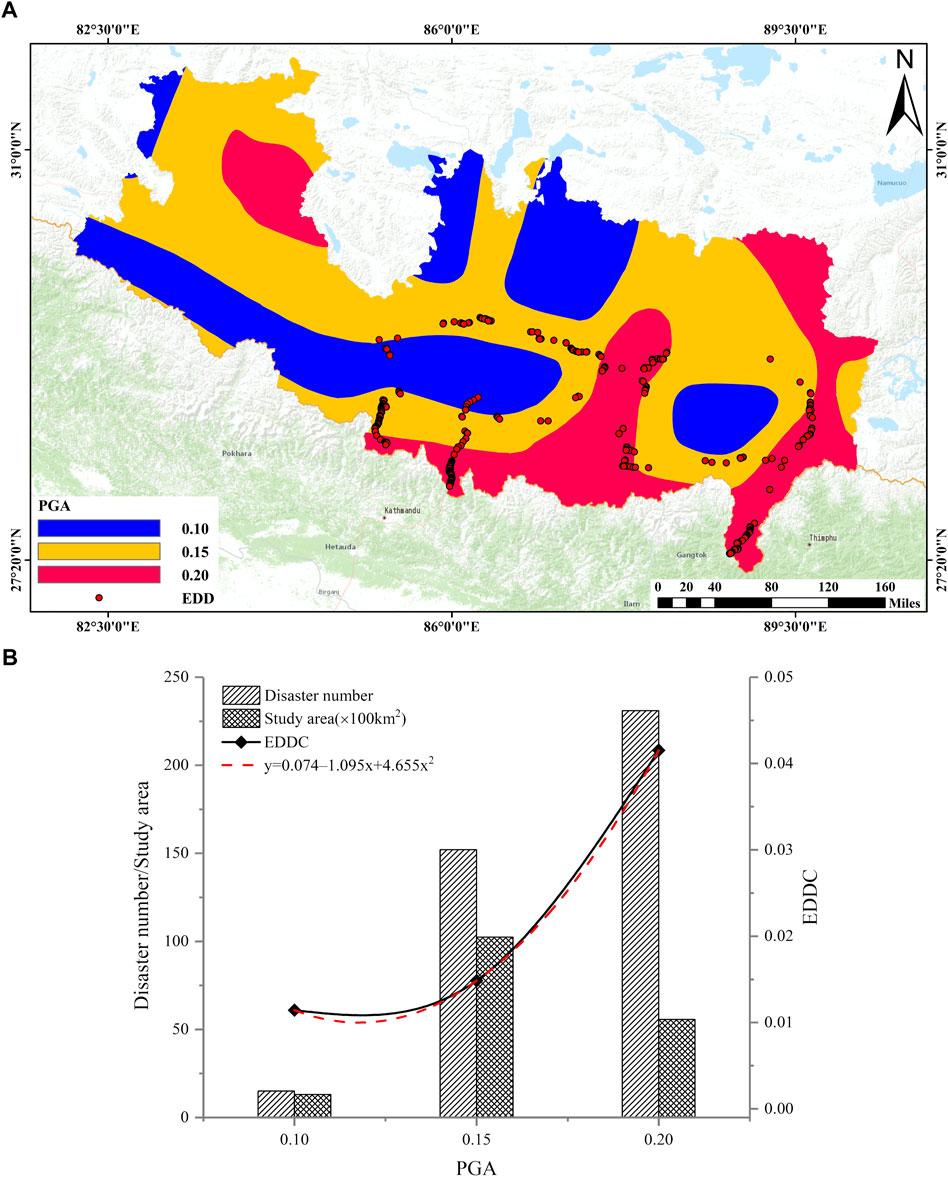
FIGURE 8. (A) PGA map of study area; (B) Relationship between engineering disturbance disaster distribution and PGA.
Figure 9 shows the relationship between engineering disturbance disasters and EDDC and distance from the fault. From the EDDC curve, there is no apparent correlation between EDDC and distance from the fault. Specifically, the distance from the fault has minimal influence on whether the slope is catastrophic; thus, the fault distance is not considered in predicting the distribution of engineering disturbance disasters.
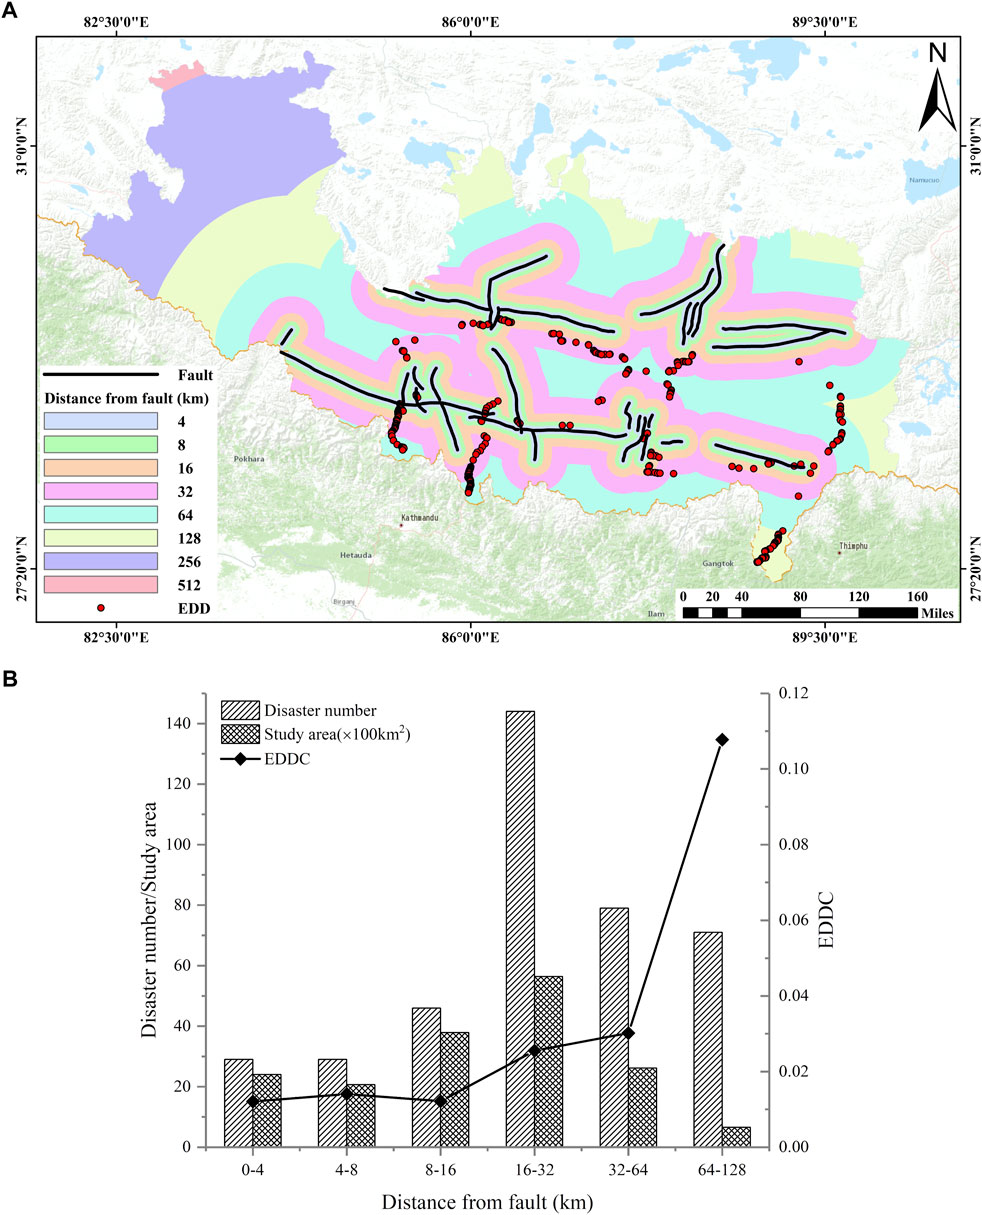
FIGURE 9. (A) Distance from fault map of the study area; (B) Relationship between engineering disturbance disaster distribution and distance from fault.
From GIS and mathematical analysis, considering all earthquakes with a magnitude greater than Mw3.0 from 1970 to 2020 (https://www.usgs.gov/) and the energy intensity and density of historical earthquakes, we established a distribution map of historical earthquake influence intensity in the study area (Figure 10A). The impact distribution map is consistent with historical earthquakes. The influence of historical earthquakes on the slope is primarily manifested in the deterioration of rock mass quality. However, from Figure 10B, it can be seen that there is no significant correlation between historical earthquake effects and EDDC. We conclude that the impact of historical earthquakes on engineering disturbance disasters is relatively low; thus, the impact of historical earthquakes was not considered in predicting the distribution of engineering disturbance disasters.
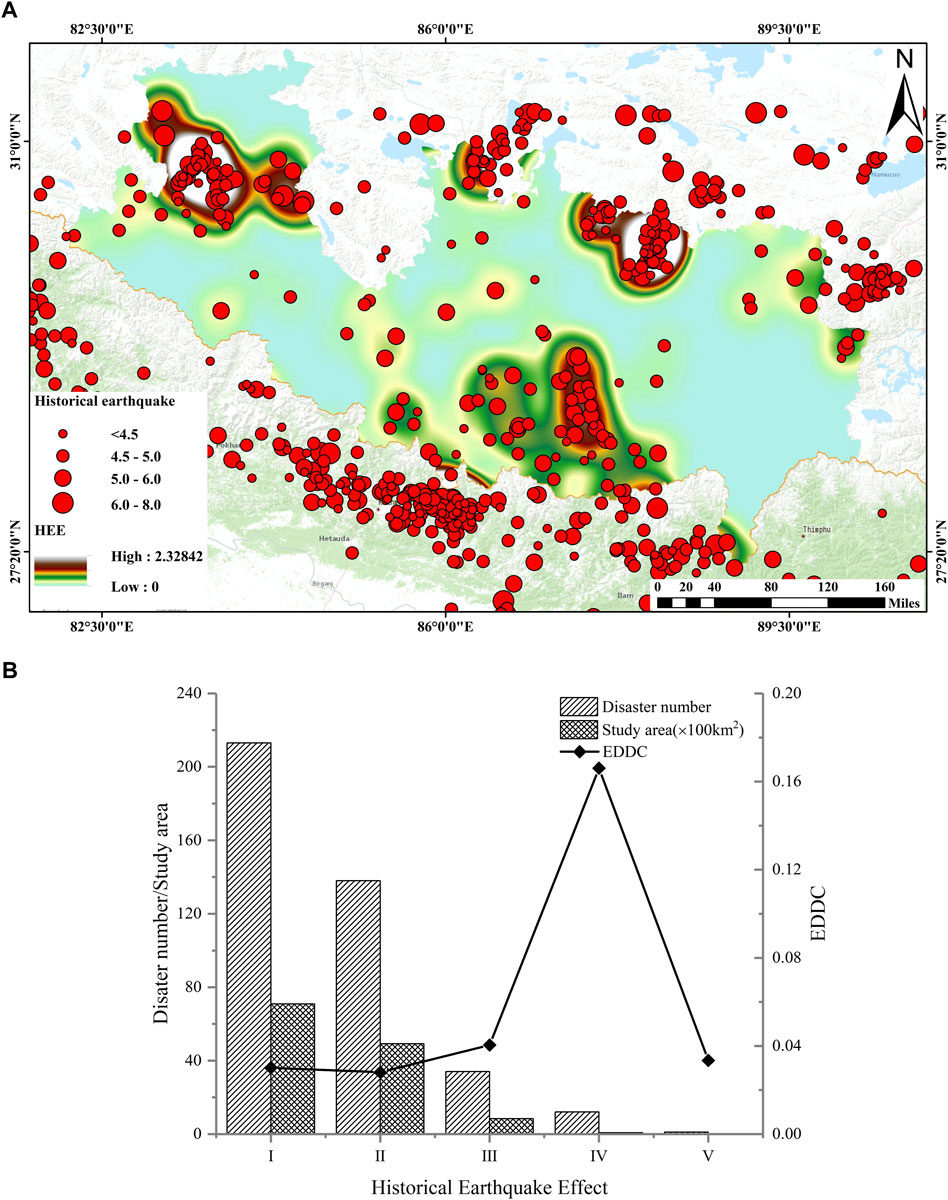
FIGURE 10. (A) Historical earthquake effect map of the study area; (B) Relationship between engineering disturbance disaster distribution and historical earthquake effects.
4.3 Engineering disturbance disaster distribution with geological factors
The strength and permeability of rock masses vary with lithology; many researchers consider lithology as the decisive factor controlling slope stability (Yalcin et al., 2011; Peruccacci et al., 2012). With the complex engineering geological conditions and rapid lithological changes in the study area, the stratum lithology was divided into engineering geological rock groups to better analyze the distribution law of engineering disturbance disasters. According to the strength characteristics of different rock types, the strata in the study area were divided into five groups (Table 4): hard magmatic rock (I), hard sedimentary rock (II), relatively hard metamorphic rock (III), soft sedimentary rock (IV), and Quaternary soft sediments (V).
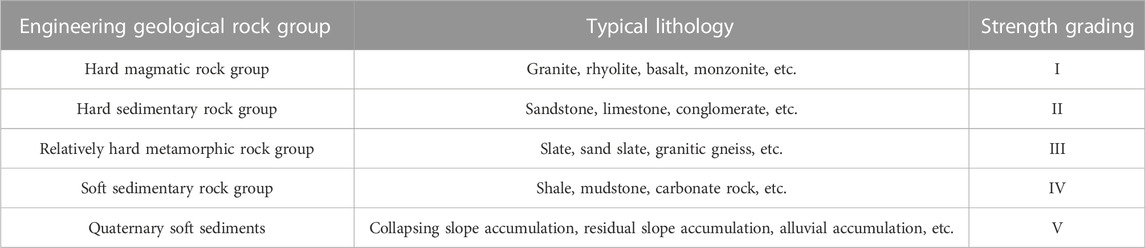
TABLE 4. Specific division principle of stratigraphic lithology.
Figure 11 shows the stratigraphic lithological distribution in the study area. The lithology in the southern part of the study area (the three ports) is primarily slate and granitic gneiss, which are shallow metamorphic rocks that retain some features of the original rock. In the northern part of the study area, the lithology is primarily sandstone, limestone, and shale, with a low degree of metamorphism. A small area contains granitic outcrops. Figure 11B shows the correlation between engineering disturbance disasters and EDDC and lithology. The number of disasters is relatively large, except for the soft sedimentary rock group. Relatively hard metamorphic rock has the most disasters, accounting for 34.2% of the total; there is no apparent correlation between EDDC and rock strength. The EDDC is larger in the relatively hard metamorphic rock group and Quaternary soft sediments, reaching .05923 and .03314, respectively.
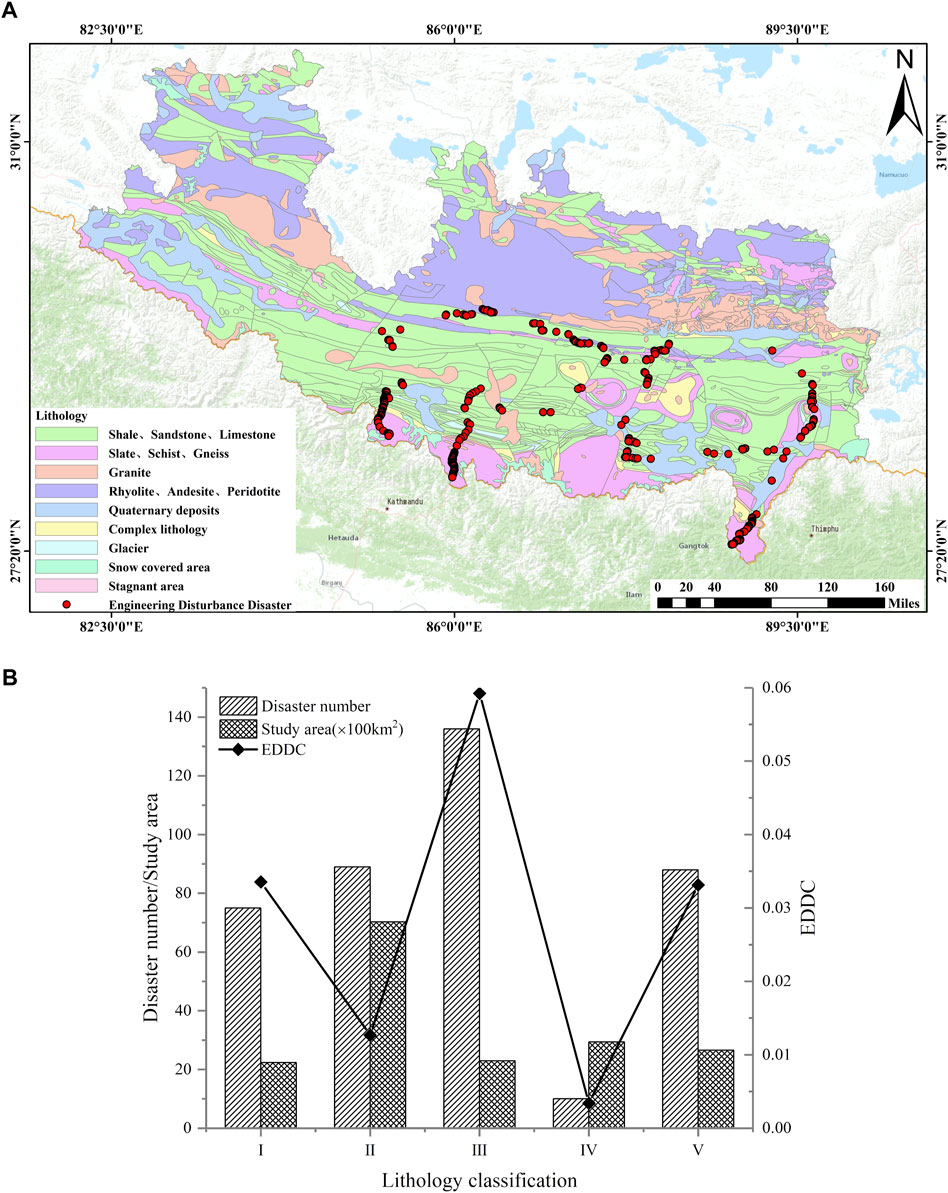
FIGURE 11. (A) Lithological map of the study area; (B) Relationship between engineering disturbance disaster distribution and lithology classification.
4.4 Distribution of engineering disturbance disasters with other factors
In the deep-cut canyon area of the Himalayas, the river system is closely related to slope disasters. Lateral erosion and undercutting of the river destroy the stress balance of the slope body, producing stress concentration at the foot of the slope, which is prone to shear failure (Zou et al., 2021). Figure 12 shows the relationship between engineering disturbance disasters and EDDC and distance from the river. The EDDC exhibits power-law distribution (distribution function F = .09921*x−1.5717, R2 = .9464). Engineering disturbance disasters are concentrated in the first and second groups. In the first group, the EDDC reaches .1007; in the third group, the EDDC rapidly decreases to .0064. Few engineering disturbance disasters occurred beyond the third group, indicating that the distance from the river has a significant influence on the occurrence of engineering disturbance disasters.
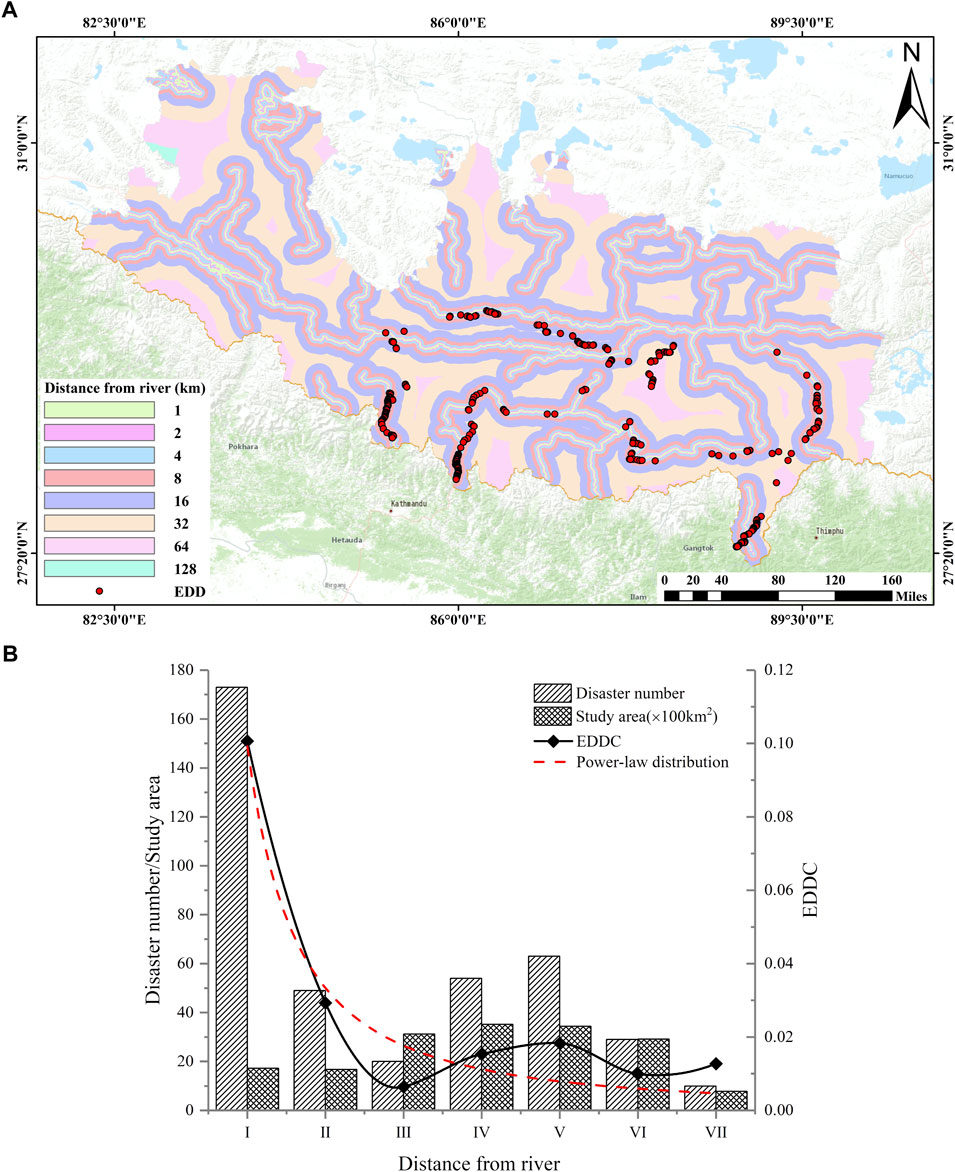
FIGURE 12. (A) Distance from river map of the study area; (B) Relationship between engineering disturbance disaster distribution and distance from river.
Based on data from hydrological stations in the Tibetan region downloaded from the China Meteorological Administration (http://www.cma.gov.cn/), Kriging interpolation was performed on the rainfall data to obtain a rainfall contour map for Tibet, which was graded using the natural discontinuity method. Rainfall in the study area gradually increased from north to south; the number of engineering disturbance disasters also gradually increased. Figure 13 shows the relationship between engineering disturbance disasters and EDDC with rainfall. With an increase in rainfall, the distribution of EDDC indicates a linear function. With an increase in rainfall, the number of engineering disturbance disasters increases sharply. Water primarily affects slope stability in two ways: 1) through deterioration of rock and soil strength: the ice-splitting effect of water reduces the strength of rock and soil, and 2) through increased pore water pressure on the weak structural plane, reducing its shear strength.
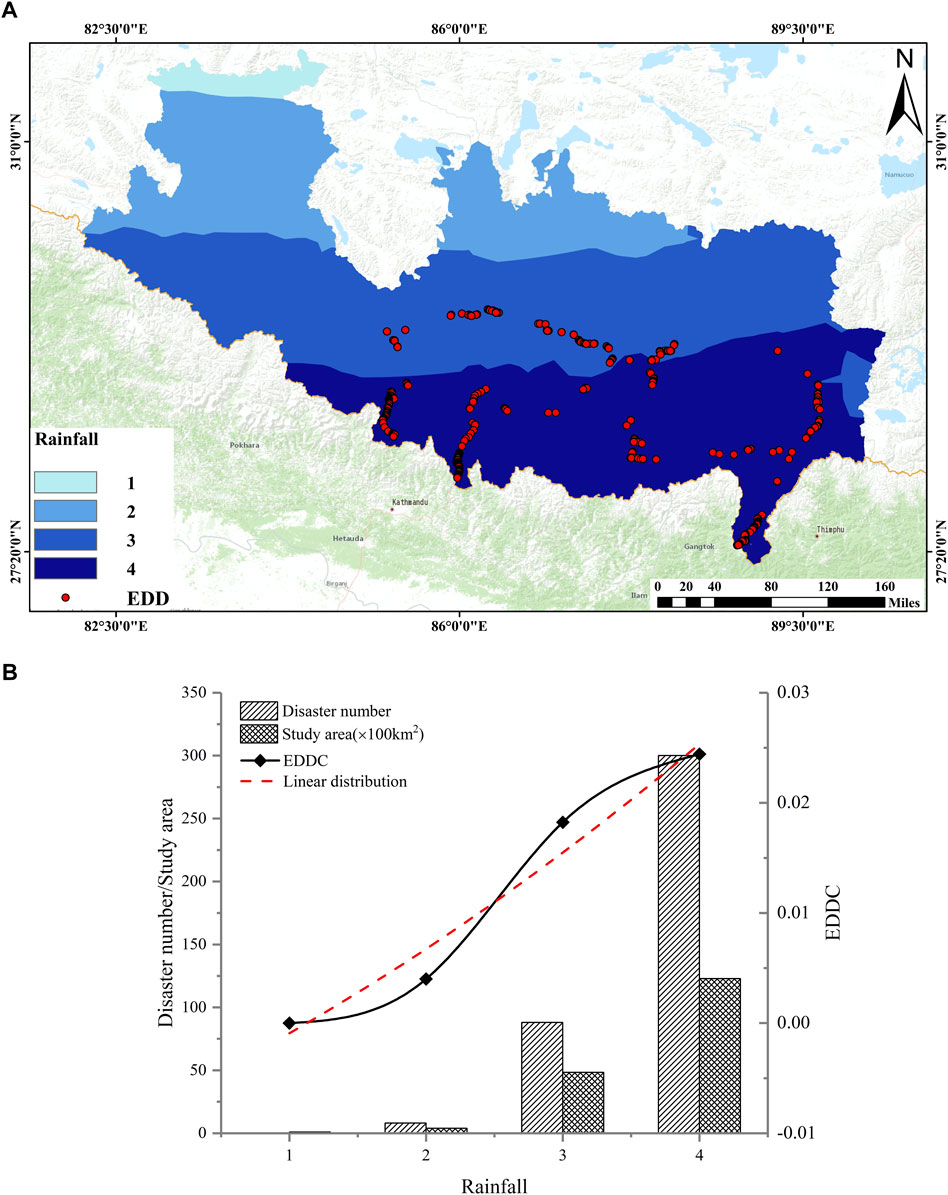
FIGURE 13. (A) Rainfall map of the study area; (B) Relationship between engineering disturbance disaster distribution and rainfall.
5 Susceptibility zoning of China–Nepal engineering disturbance disasters
5.1 Evaluation factor selection principle
Engineering disturbance disasters result from coupling of various factors. To analyze the correlation between the distribution law and different background factors, EDDC was introduced as a measurement factor. Through spatial statistical analysis, we observed a close correlation between the distribution of engineering disturbance disasters in alpine valleys and elevation, slope, slope aspect, PGA, rainfall, distance from river, and lithology (Table 5). Fault activity and earthquakes have less impact on engineering disturbance disasters owing to their long time scale. Thus, the distance from the fault and the impact of historical earthquakes were not considered in predicting the distribution of engineering disturbance disasters along the China–Nepal Railway.
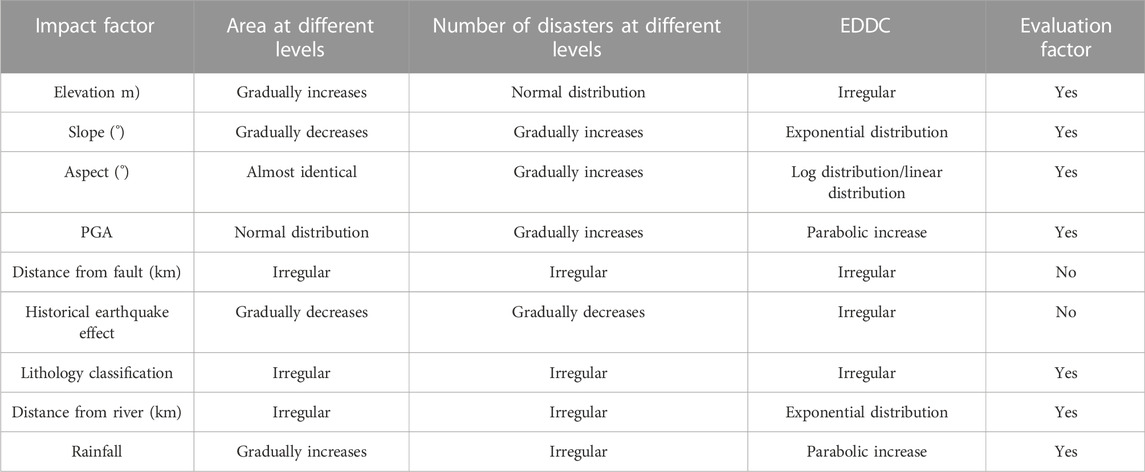
TABLE 5. Summary of the relationship between engineering disturbance disasters and influencing factors.
5.2 Information model
An information model is a statistical method for predicting the distribution of spatial events based on relevant parameters and hazard relationships (Sarkar et al., 2006). It is a statistical analysis and prediction method often used to evaluate susceptibility to geological disasters. The measured parameters of the geological environment of a deformed or damaged slope are converted into information values reflecting the slope stability and extended to adjacent areas according to the analogy principle (Yin and Yan, 1988). The calculation is expressed as
where
5.3 Susceptibility assessment results
A grid calculator was used to superimpose each evaluation factor grid in ArcGIS to obtain the information value of each grid. The natural discontinuity method was used to divide the study area to obtain a susceptibility zone map for engineering disturbance disasters along the China–Nepal Railway (Figure 14). The study area was divided into extremely high-, high-, medium-, and low-susceptibility areas, accounting for 13.6%, 30.4%, 34.1%, and 22.0%, respectively. The extremely high-susceptibility areas are concentrated in Gyirong Town. The reasons are presented as follows: 1) The China–Nepal Railway in the Gyirong County section is almost parallel to the Gyirong River. With strong downward erosion of the river, the slope gradient on both sides of the river is relatively high, which results in deflection of the principal stress of the slope body and produces a stress concentration at the foot of the slope. 2) The lithology of Gyirong Town is primarily metamorphic rocks, such as schist, gneiss (primarily granitic gneiss), and slate, which have low strength, high brittleness, and weak weather resistance. 3) Gyirong Town is 2,800 m above sea level. Affected by the warm and humid air flow of the Indian Ocean, the area has abundant rainfall, lush vegetation, and strong weathering. The high-susceptibility areas are primarily distributed in Dingri and Dingjie Counties. The reasons are presented as follows: 1) In the Dingri and Dingjie County sections, the China–Nepal Railway is relatively close to the river and intersects with the Pengqu River at a low angle; 2) the lithology in this area is primarily sedimentary rocks, mostly shale, sand shale, and mudstone. With the strong tectonic activity and relatively high rainfall in this area, the vegetation is developed and the weathering effect is strong, resulting in fragmentation of the rock mass in this area and reduced shear strength. The evaluation results indicate that the distribution of engineering disturbance disasters is controlled by coupling of factors such as slope, distance from the river, and elevation.
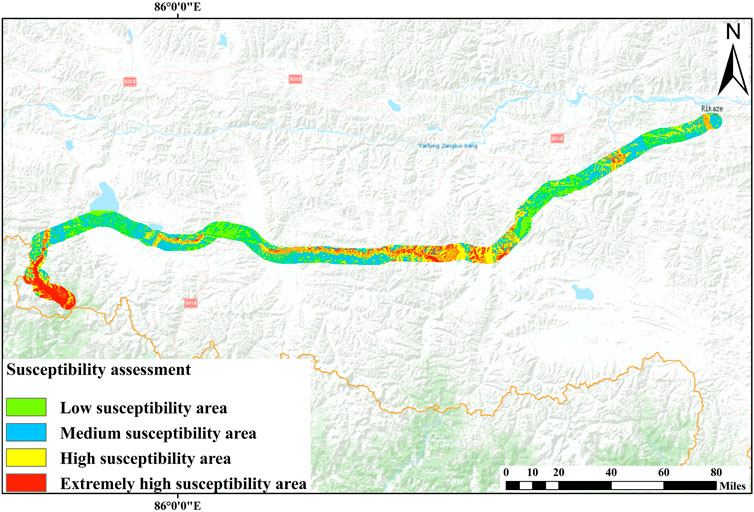
FIGURE 14. Susceptibility zoning map of engineering disturbance disasters along China–Nepal Railway.
6 Discussion
In recent years, researchers have extensively studied the spatial distribution regularity of natural and secondary earthquake disasters. However, research on engineering disturbance disasters is still in its infancy. Human engineering activities have only extended to the Himalayan alpine valley area in recent years. To protect the ecological environment, human lives, and property in this area, multi-scale and multi-level research on engineering disturbance disasters is required. This study investigated engineering disturbance disasters on the main highway slope in the Himalayan Canyon area. From investigation of the engineering geological characteristics of this area, spatial statistical analysis of the development law of engineering disturbance disasters was conducted. The relationship between engineering disturbance disaster distribution and geological structure, earthquake intensity, lithology, elevation, characteristics of geological bodies, and climate environment changes along the China–Nepal Railway was predicted using the engineering geological analogy method. The research results provide a theoretical basis for the prevention and control of road–slope engineering disturbance disasters in plateau canyons. The spatial statistical analysis revealed that the distribution of engineering disturbance disasters generally decreases with an increase in distance from the river, and the probability of engineering disturbance disasters in the adjacent river area increases significantly. The EDDC and distance from the river exhibit a good power-law distribution. The rock mass on both sides of the river is always extremely broken because the strong tectonic movement of the Tibetan Plateau results in strong undercutting of the river, subjecting the bank slope to severe erosion. Thus, the distribution law is different from the distribution law of natural disasters (Zou et al., 2021). The EDDC also has a good exponential distribution with an increase in slope. The slope directly determines stability. A larger slope gradient produces greater shear stress on the slope, reducing slope stability. No noticeable correlation was observed between EDDC and distance from the fault; the EDDC at different distances from the fault may have been affected by the slope gradient and distance from the river (Figure 15). The main inducing factor of engineering disturbance disasters is engineering disturbance; the slope cutting, unloading, and vibration in engineering construction significantly reduce the strength of the rock mass, shielding the influence of faults and earthquakes. Chen et al. (2019) analyzed the impact of land use and land cover change on landslide susceptibility, and concluded that human engineering activities have become the main factors affecting landslide susceptibility, which is consistent with the conclusions of this paper. The essence of the problem is the size of the time scale. The EDDC decreases rapidly with an increase in elevation. At elevations less than 3,800 m, the density of engineering disturbance disasters is relatively high and roughly at the same frequency, primarily owing to the influence of terrain factors and weathering intensity. The relationship between the slope aspect and EDDC is linear, but its variation range is small; thus, the slope aspect has a slight influence on the distribution of engineering disturbance disasters. The EDDC is greatest in metamorphic rocks such as slate and granitic gneiss, and it depends on the strength, permeability, and weathering resistance of the rock itself; the rock strength directly determines the slope stability. The slope, distance from the river, and elevation have a large influence on the distribution of engineering disturbance disasters. Geological disasters are non-linear problems; in future research, a fractal model and fractal dimension theory can be introduced into the spatial statistical analysis of disasters, and the spatial distribution law of engineering disturbance disasters can be studied using existing analysis methods.
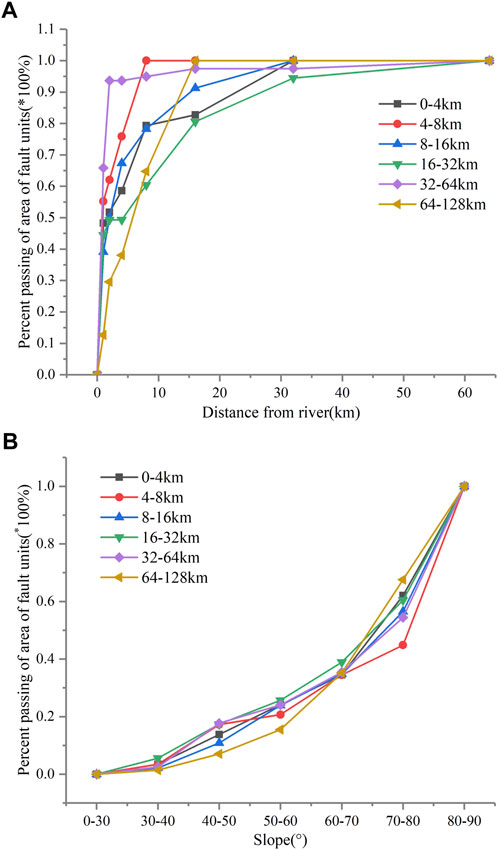
FIGURE 15. Percent passing area of six units of (A) distance from fault system vs distance from river and (B) slope gradient.
The EDDC reflects the quality of regional engineering geological conditions; thus, it is an important indicator for site selection of major projects. Based on the research results, the selection principle of engineering disturbance disaster evaluation indicators in alpine valley areas was determined, and an engineering disturbance disaster susceptibility evaluation system was constructed. Field investigations indicated that although the frequency of engineering disturbance disasters is high, the intensity is low. For some unstable slopes, although an engineering disturbance destroys the stability of the slope, the scale of the disaster is somewhat reduced, consistent with the results of Zhang (1990). We were inspired to reduce the risk of large-scale disasters by actively inducing multiple small-scale disasters. The investigation revealed that the slope structure also influences the failure form of the slope. For example, with the development of discontinuous surfaces, block slopes tend to fail in the form of rock falls and rock avalanches under the effect of engineering disturbances. Eluvium, colluvial, and collapsing accretion layers of slopes tend to produce many shallow landslides and rock falls; slopes with weak structural planes often experience numerous rock block falls.
7 Conclusion
A complete database of 396 engineering disturbance disasters was established from field investigations and interpretation of remote sensing data. Engineering disturbance disasters can be primarily categorized as rock falls, landslides, rock avalanches, and complexes. The relationships between engineering disturbance disasters and geological background, distance from rivers, seismological factors, and lithology were analyzed. Accordingly, the distribution of engineering disturbance disasters along the China–Nepal Railway was predicted. The analysis and prediction results are summarized as follows:
(1) The EDDC exhibits a good exponential distribution with an increase in the slope gradient and distance from the river. Engineering disturbance disasters occur at distances from rivers of less than 4 km and gradients greater than 60°. Compared with the gradient and distance from the river, there is no significant correlation between engineering disturbance disasters and faults, historical earthquake effects, and slope aspect. With an increase in PGA and rainfall, the EDDC exhibits a parabolic increase, indicating that these two factors have an important influence on the distribution of engineering disturbance disasters.
(2) The slope gradient and distance from the river are the two most important factors controlling the spatial distribution of engineering disturbance disasters. Lithology, PGA, rainfall, and slope aspect are closely related to rock mass quality and have an effect on the distribution regularity. The unloading and rebounding effects caused by erosion of the river and slope cutting have an important effect on slope instability. Slope cutting significantly increases the slope gradient and significantly reduces the strength of the rock mass. Engineering disturbance has become an extremely important inducing factor that controls the distribution of engineering disturbance disasters.
(3) From spatial statistical analysis of engineering disturbance disasters, an evaluation factor selection system for engineering disturbance disasters in alpine and canyon areas was constructed, and the distribution of engineering disturbance disasters near the China–Nepal Railway was predicted. The study area was divided into extremely high-, high-, medium-, and low-susceptibilty areas, accounting for 13.6%, 30.4%, 34.1%, and 22.0%, respectively. Extremely high- and high-susceptibilty areas are concentrated in Gyirong Town, Dingri County, and Dingjie County. This is related to the geological background of engineering disturbance disasters, confirming previous research results.
(4) The field investigation indicated that although engineering disturbances induce disasters and increase their frequency, they reduce their scale and provide new concepts in terms of preventing large-scale disasters in the future. The EDDC reflects the engineering geological conditions of a region; thus, it can provide a basis and reference for site selection and route selection of major projects.
Data availability statement
The raw data supporting the conclusion of this article will be made available by the authors, without undue reservation.
Author contributions
Field investigation: YS, JG, JL, and GL; Writing—original draft: YS and FM; Methodology: YS, JG, and FM; Formal analysis: YS, JG, FM, and GL. All authors contributed to the article and approved the submitted version.
Funding
This research was supported by the Second Tibetan Plateau Scientific Expedition and Research Program (Grant no. 2019QZKK0904) and by the National Natural Science Foundation of China (Grant no. U22A20597).
Conflict of interest
The authors declare that the research was conducted in the absence of any commercial or financial relationships that could be construed as a potential conflict of interest.
Publisher’s note
All claims expressed in this article are solely those of the authors and do not necessarily represent those of their affiliated organizations, or those of the publisher, the editors and the reviewers. Any product that may be evaluated in this article, or claim that may be made by its manufacturer, is not guaranteed or endorsed by the publisher.
References
Akinci, H., and Yavuz Ozalp, A. (2021). Landslide susceptibility mapping and hazard assessment in Artvin (Turkey) using frequency ratio and modified information value model. Acta Geophys. 69 (3), 725–745. doi:10.1007/s11600-021-00577-7
Bragagnolo, L., Silva, R. V., and Grzybowski, J. M. V. (2020). Landslide susceptibility mapping with r. landslide: A free open-source GIS-integrated tool based on artificial neural networks. Environ. Model. Softw. 123, 104565. doi:10.1016/j.envsoft.2019.104565
Chang, L., and Hanssen, R. F. (2015). Detection of permafrost sensitivity of the Qinghai–Tibet railway using satellite radar interferometry. Int. J. Remote Sens. 36 (3), 691–700. doi:10.1080/01431161.2014.999886
Chen, Fulong, Lin, Hui, Li, Zhen, Chen, Quan, and Zhou, Jianmin (2012). Interaction between permafrost and infrastructure along the Qinghai–Tibet Railway detected via jointly analysis of C- and L-band small baseline SAR interferometry Remote Sensing of Environment. Remote Sens. Environ. 123, 532–540. doi:10.1016/j.rse.2012.04.020
Chen, L., Guo, Z., Yin, K., Shrestha, D. P., and Jin, S. (2019). The influence of land use and land cover change on landslide susceptibility: A case study in zhushan town, xuan’en county (hubei, China). Nat. Hazards Earth Syst. Sci. 19 (10), 2207–2228. doi:10.5194/nhess-19-2207-2019
Chen. iang, F. Q., Liu., Y. L., and Gao, X. (2021). Application of remote sensing technology to the engineering geological survey for the construction of the China-Nepal railway. Remote Sens. Nat. Resour. 33 (4), 219–226.
Ding, Q., Chen, W., and Hong, H. (2016). Application of frequency ratio, weights of evidence and evidential belief function models in landslide susceptibility mapping. Geocarto Int., 1–21. doi:10.1080/10106049.2016.1165294
Fabbri, A. G., Chung, C.-J. F., Cendrero, A., and Remondo, J. (2003). Is prediction of future landslides possible with a GIS? Nat. Hazards 30 (3), 487–503. doi:10.1023/b:nhaz.0000007282.62071.75
Guzzetti, F., Mondini, A. C., Cardinali, M., Fiorucci, F., Santangelo, M., and Chang, K. T. (2012). Landslide inventory maps: New tools for an old problem. Earth. Sci. Rev. 112 (1-2), 42–66. doi:10.1016/j.earscirev.2012.02.001
Huang, Y., Yao, L., and Li, T. (2020). Engineering effect of the Himalayan orogen and engineering geological zoning of China-Nepal railway.Journal of Engineering Geology. J. Eng. Geol. 28 (2), 421–430. doi:10.13544/j.cnki.jeg.2019-513
Kalantar, B., Pradhan, B., Naghibi, S. A., Motevalli, A., and Mansor, S. (2017). Assessment of the effects of training data selection on the landslide susceptibility mapping: A comparison between support vector machine (SVM), logistic regression (LR) and artificial neural networks (ANN). Geomatics, Nat. Hazards Risk 9 (1), 49–69. doi:10.1080/19475705.2017.1407368
Li, Y., Feng, X., Yao, A., Lin, S., Wang, R., and Guo, M. (2021a). A massive ancient river-damming landslide triggered by buckling failure in the upper Jinsha River, SE Tibetan Plateau. Bull. Eng. Geol. Environ. 80, 5391–5403. doi:10.1007/s10064-021-02293-4
Li, Z., Zhou, F., Han, X., Chen, J., Li, Y., Zhai, S., et al. (2021b). Numerical simulation and analysis of a geological disaster chain in the Peilong valley, SE Tibetan Plateau. Bull. Eng. Geol. Environ. 80 (4), 3405–3422. doi:10.1007/s10064-021-02109-5
Luo, J., Niu, F., Liu, M., Lin, Z., and Yin, G. (2018). Field experimental study on long-term cooling and deformation characteristics of crushed-rock revetment embankment at the Qinghai–Tibet Railway. Appl. Therm. Eng. 139, 256–263. doi:10.1016/j.applthermaleng.2018.04.138
Luo, L., Duan, Q., Wang, L., Zhao, W., and Zhuang, Y. (2020). Increased human pressures on the alpine ecosystem along the Qinghai-Tibet Railway. Reg. Environ. Change 20 (1), 33. doi:10.1007/s10113-020-01616-7
Medina, V., Hürlimann, M., Guo, Z., Lloret, A., and Vaunat, J. (2021). Fast physically-based model for rainfall-induced landslide susceptibility assessment at regional scale. CATENA 201, 105213. doi:10.1016/j.catena.2021.105213
Meng, W., Guo, C, and Mao, B. (2021). Tectonic stress field and engineering influence of China-Nepal railway corridor. Geoscience 35 (1), 167–179. doi:10.19657/j.geoscience.1000-8527.2020.104
Nefeslioglu, H. A., Duman, T. Y., and Durmaz, S. (2008). Landslide susceptibility mapping for a part of tectonic kelkit valley (eastern black sea region of Turkey). Geomorphology 94 (3), 401–418. doi:10.1016/j.geomorph.2006.10.036
Peruccacci, S., Brunetti, M. T., Luciani, S., Vennari, C., and Guzzetti, F. (2012). Lithological and seasonal control on rainfall thresholds for the possible initiation of landslides in central Italy. Geomorphology 139, 79–90. doi:10.1016/j.geomorph.2011.10.005
Qi, Shengwen, Yue, Z. Q., Lee, C. F., Tham, L. G., and Zhou, H. (2002). Estimating the excavation disturbed zone in the permanent shiplock slopes of the Three Gorges Project, China. Int. J. Rock Mech. Min. Sci. (1997). 39 (2), 165–184. doi:10.1016/s1365-1609(02)00015-1
Qi, S. W., Xu, Q., Lan, H. X., Zhang, B., and Liu, J. Y. (2010). Spatial distribution analysis of landslides triggered by 2008.5.12 Wenchuan Earthquake, China. Eng. Geol. 116, 95–108. doi:10.1016/j.enggeo.2010.07.011
Qingyun, Z., Yongsheng, L., Jingfa, Z., and Yi, L. (2019). InSAR technique applied to the monitoring of the Qinghai–Tibet Railway. Nat. Hazards Earth Syst. Sci. 19 (10), 2229–2240. doi:10.5194/nhess-19-2229-2019
Sarkar, S., Kanungo, D., and Patra, A. (2006). GIS based landslide susceptibility mapping - a case study in Indian himalaya in disaster mitigation of debris flows, slope failures and landslides. Tokyo: Universal Academic Press, 617–624.
Sun, D., Wen, H., Wang, D., and Xu, J. (2020). A random forest model of landslide susceptibility mapping based on hyperparameter optimization using Bayes algorithm. Geomorphology 362, 107201. doi:10.1016/j.geomorph.2020.107201
Tang, R.-X., Yan, E.-C., Wen, T., Yin, X.-M., and Tang, W. (2021). Comparison of logistic regression, information value, and comprehensive evaluating model for landslide susceptibility mapping. Sustainability 13, 3803. doi:10.3390/su13073803
Troncone, A., Conte, E., and Donato, A. (2014). Two and three-dimensional numerical analysis of the progressive failure that occurred in an excavation-induced landslide. Eng. Geol. 183, 265–275. doi:10.1016/j.enggeo.2014.08.027
Tu, G., and Deng, H. (2020). formation and evolution of a successive landslide dam by the erosion of river: A case study of the gendakan landslide dam on the lancang river, China. Bull. Eng. Geol. Environ. 79, 2747–2761. doi:10.1007/s10064-020-01743-9
Wang, J., Wang, C., Zhang, H., Tang, Y., Duan, W., and Dong, L. (2021). Freeze-thaw deformation cycles and temporal-spatial distribution of permafrost along the qinghai-tibet railway using multitrack InSAR processing. Remote Sens. 13, 4744. doi:10.3390/rs13234744
Wang, Q., Guo, Y., Li, W., He, J., and Wu, Z. (2019). Predictive modeling of landslide hazards in Wen County, northwestern China based on information value, weights-of-evidence, and certainty factor. Geomatics, Nat. Hazards Risk 10 (1), 820–835. doi:10.1080/19475705.2018.1549111
Wang, Y., Guan, L., Chen, J., and Kong, Y. (2018). Influences on mammals frequency of use of small bridges and culverts along the Qinghai–Tibet railway. China Ecol. Res. 33, 879–887.
Wu, Y., Ke, Y., Chen, Z., Liang, S., Zhao, H., and Hong, H. (2020). Application of alternating decision tree with AdaBoost and bagging ensembles for landslide susceptibility mapping. CATENA 187, 104396. doi:10.1016/j.catena.2019.104396
Yalcin, A., Reis, S., Aydinoglu, A. C., and Yomralioglu, T. (2011). A GIS-based comparative study of frequency ratio, analytical hierarchy process, bivariate statistics and logistics regression methods for landslide susceptibility mapping in Trabzon, NE Turkey. Catena 85 (3), 274–287. doi:10.1016/j.catena.2011.01.014
Yan, T. (1988). Recent advances of quantitative prognoses of landslide in China. Proc. fifth Int. symposium landslides. Lausanne, Switzerland. 2, 1263–1268.
Yin, K., and Yan, T. (1988). Statistical prediction models for slope instability of metamorphosed rocks. In: Proceedings of the fifth international symposium on landslides, Lausanne, Switzerland. 2019. 2: 1269–1272
Yu, H., Song, S., Liu, J., Li, S., Zhang, L., Wang, D., et al. (2017). Effects of the qinghai-tibet railway on the landscape genetics of the endangered przewalski’s gazelle (procapra przewalskii). Sci. Rep. 7 (1), 17983. doi:10.1038/s41598-017-18163-7
Zhan, J., Chen, J., Zhang, W., Han, X., Sun, X., and Bao, Y. (2018). Mass movements along a rapidly uplifting river valley: An example from the upper jinsha river, southeast margin of the Tibetan plateau. Environ. Earth Sci. 77 (18), 634. doi:10.1007/s12665-018-7825-4
Zhang, X., Huang, D., Han, W., and Nie, D. (1990). Human activity and induced geological hazard. J. Geol. hazard control (02), 3–10. In Chinese.
Zhang, Y., Tang, J., Liao, R., Zhang, M., Zhang, Y., Wang, X., et al. (2020). Application of an enhanced BP neural network model with water cycle algorithm on landslide prediction. Stoch. Environ. Res. Risk Assess. 35 (6), 1273–1291. doi:10.1007/s00477-020-01920-y
Zhao, Lixing (2020). Relationship between geological hazards distribution and slope factors in Qin-Ba Mountain area. IOP Conf. Ser. Earth Environ. Sci. 598, 012041. doi:10.1088/1755-1315/598/1/012041
Keywords: engineering disturbance disaster, spatial statistical analysis, disaster concentration, China-Nepal Railway, Tibetan Plateau
Citation: Song Y, Guo J, Ma F, Liu J and Li G (2023) Spatial distribution analysis and application of engineering disturbance disasters in the Himalayan alpine valley. Front. Earth Sci. 10:1098631. doi: 10.3389/feart.2022.1098631
Received: 15 November 2022; Accepted: 05 December 2022;
Published: 16 January 2023.
Edited by:
Zizheng Guo, Hebei University of Technology, ChinaReviewed by:
Tengfei Wang, China University of Geosciences Wuhan, ChinaLuqi Wang, Chongqing University, China
Copyright © 2023 Song, Guo, Ma, Liu and Li. This is an open-access article distributed under the terms of the Creative Commons Attribution License (CC BY). The use, distribution or reproduction in other forums is permitted, provided the original author(s) and the copyright owner(s) are credited and that the original publication in this journal is cited, in accordance with accepted academic practice. No use, distribution or reproduction is permitted which does not comply with these terms.
*Correspondence: Jie Guo, Z3VvamllQG1haWwuaWdnY2FzLmFjLmNu