 Pan Wang
 Tongcheng Han
 Li-Yun Fu
94% of researchers rate our articles as excellent or good
Learn more about the work of our research integrity team to safeguard the quality of each article we publish.
Find out more
ORIGINAL RESEARCH article
Front. Earth Sci., 27 January 2023
Sec. Solid Earth Geophysics
Volume 10 - 2022 | https://doi.org/10.3389/feart.2022.1098466
This article is part of the Research TopicRock Physics of Unconventional ReservoirsView all 11 articles
Calcite cement is widely existing in sandstones and can significantly affect the elastic and electrical properties of sandstones. Accordingly, understanding the effects of calcite cement on the elastic and electrical rock properties is of key importance for the accurate characterization of sandstone reservoirs through seismic and electromagnetic surveys. To obtain such knowledge, we design and implement dedicated laboratory experiments to investigate the effects of calcite cement and porosity on the P- and S-wave velocities and electrical resistivity of synthetic calcite-cemented sandstones made using a new recipe. The experimental results show that elastic velocities and electrical resistivity generally decrease with increasing porosity when the content of the calcite cement keeps constant, whereas the elastic and electrical rock properties exhibit complex variation with cement content in sandstones with approximately the same porosity. Analyses and interpretation of the experimental data indicate that the elastic and electrical rock properties are affected jointly by porosity, the content and distribution of the calcite cement, as well as the microstructure of the pore space resulting from the different axial stress employed for the consolidation of the rock samples. The results have revealed the mechanisms of how porosity and calcite cement affect the elastic and electrical properties of calcite-cemented sandstones, and provided a theoretical basis for the accurate characterization of sandstone reservoirs through seismic and electromagnetic surveys.
Sandstones are ideal hydrocarbon reservoirs and contain more than half of the conventional oil and gas found globally (Tanner et al., 1991). As an important cementation type of sandstones, calcite cement widely exists in sandstones formed in various depth and sedimentary environments (Morad et al., 2010; Ajdukiewicz and Larese, 2012; Wang et al., 2016). The content and distribution of calcite cement can significantly affect the elastic and electrical properties of calcite-cemented sandstones (Jarrard et al., 2000; Tang et al., 2016), and therefore understanding how and why calcite cement affects the elastic and electrical rock properties is of key importance for the successful interpretation of the exploration data acquired by seismic and electromagnetic surveys, the most widely employed and most effective methods for the characterization of sandstone reservoirs (Wang, 2001; Constable, 2010).
Many experimental studies have been implemented to understand the effects of calcite cement on the elastic and electrical properties of sandstones, and most of the studies are based on natural sandstones (Jarrard et al., 2000; Tang et al., 2016; Wang et al., 2020). However, due to the fact that natural sandstones are with varying mineral compositions, porosity, cement type and distribution, and grain sizes (Wang, 2001; Al-Tahini et al., 2007), the use of natural sandstones makes it difficult to reveal the impact of a specific factor on the physical rock properties. As a result, the amount of calcite cement is only found to generally improve the rock velocity and resistivity, while the quantitative improvement of the elastic and electrical rock properties with the calcite cement content remains far from being reveled through the use of natural sandstones. Unlike natural sandstones, the rock parameters can be easily controlled in artificial rocks, and therefore artificial sandstones have been widely employed for the understanding of the effects of petrophysical parameters on the elastic and electrical rock properties (Sherlock and Siggins, 2004; Ding et al., 2015; Si et al., 2016).
In current experimental studies for the understanding of the effects of calcite cement on the physical properties of synthetic rocks, the artificial sandstones are manufactured predominantly using the calcite in situ precipitation system (CIPS, see Ismail et al., 2002a for more details) and the microbially induced carbonate precipitation (MICP) method (Konstantinou et al., 2021). CIPS depends on flushing a mixture of chemical solutions through a porous medium, leading to precipitation of calcite due to the reaction of the solution ingredients (Kucharski et al., 1997; Ismail et al., 2002a, b; Palmén et al., 2016). In a different way, bacteria are first introduced to the medium in MICP and then a cementation solution consisting of urea and a calcium source is supplied in the form of injections, and the bacterial urease activity builds up calcium carbonate cementation around the particles (Dejong et al., 2006; Harkes et al., 2010; Muynck et al., 2010; Qian et al., 2010; Konstantinou et al., 2021).
These methods can be applied to making calcite-cemented artificial rocks that are with customized petrophysical and physical properties, closely resembling those of natural sandstones (Kucharski et al., 1997; Ismail et al., 2002a; Sherlock and Siggins, 2004; Yasuhara et al., 2012; Konstantinou et al., 2021). However, it can be difficult to control precisely the porosity, and the content and distribution of the calcite cement in the samples made using these methods. Accordingly, the difference in the rock porosity, which can be dominant in some physical rock properties like electrical resistivity, has usually been ignored in the experimental investigations of the variation of physical properties with cement content (Sherlock and Siggins, 2004). Moreover, the calcite cement in current artificial sandstones is generally less than 10%, whereas natural calcite-cemented sandstones usually contain a wider cement range between 5% and 30% (Morad, 2009; Zhao et al., 2014; Wang et al., 2015, 2016), making synthetic sandstones not representative of natural rocks.
This work aims to investigate quantitatively the effects of calcite cement and porosity on the P- and S-wave velocities and electrical resistivity of synthetic calcite-cemented sandstones. We first present a new method for making calcite-cemented sandstones and prepare two groups of synthetic samples with cement content keeps constant and porosity varies in one group, and porosity is kept approximately the same and cement content is different in the other group. We then measure the P- and S-wave velocities and electrical resistivity of the samples with full brine saturation at bench-top conditions. The effects of varying cement content and porosity on the elastic and electrical properties of the artificial sandstones are finally analyzed in combination with their microstructures.
On basis of understanding the diagenesis of natural sandstones with calcite cement, we present a way to make calcite-cemented sandstone samples from simple inorganic ingredients (i.e., sand grains, Ca(OH)2 powder and CO2 gas) to best resemble natural sandstones in terms of mineral composition, and the type and content of cement. The manufacturing of the samples follows four main steps, i.e., pre-preparation of the raw materials, mixing of the ingredients, and consolidation and cementation of the mixture.
Different sized sand grains were employed to make the grain distribution of the synthetic samples better resemble that of natural rocks, and to make the porosity of the samples as low as possible. The sand grains were chosen with sizes of 0.3 mm, 0.18 mm, 0.135 mm, 0.075 mm, 0.038 mm and 0.013 mm, respectively. We washed the sand grains in 0.1 mol/L hydrochloric acid for 1 h to dissolve existing carbonate minerals and heated the washed grains in an oven at the temperature of 60 °C for about 8 h to make sure they were completely dry.
We first mixed the washed and dried sand grains with weight ratio of 5:3.3:1.8:1.4:0.8:1 from large to small sizes, and then added a small amount of distilled water to the grains (with a weight ratio of 1:25 to the sand grains) and mixed evenly to make sure the sand grains were evenly moisturized. The Ca(OH)2 powder with a predetermined weight was finally added into and fully mixed with the sand-water mixture so as to form Ca(OH)2 coated sand grains. The weight ratio of the different sized sand grains was chosen to mimic that of a tight sandstone acquired from the Ordos Basin, China. The sand to water weight ratio was determined as an optimal for the water to fully moisturize the sand grains so that the Ca(OH)2 powder can evenly coat them, without leaving much water for the Ca(OH)2 powder to agglomerate and hence most of the generated calcite is acting as cement.
The mixture was packed into a cylindrical mould made of stainless steel with a diameter of 5 cm, and an axial stress of up to 70 MPa was applied for up to 4 h to compact and consolidate the mixture.
The consolidate mixture was placed into a sealed core-holder and CO2 gas with the pressure of up to 0.9 MPa was added to react with Ca(OH)2 to form the calcite cement. This process took up to 2 weeks to ensure all the Ca(OH)2 powder has reacted so that the cement content has reached its predetermined value. During the cementation period, the sample was taken out of the core-holder every 24 h and heated at the temperature of 60 °C for 2 h to reduce the generated water. The reduction of the redundant water was to make sure it was not blocking the pore network so that the CO2 gas could better get into the sample to react with Ca(OH)2.
Two groups of sandstones were made using the method above, each with a varying petrophysical parameter. Samples in Group A had the same cement content but with different porosity, and samples in Group B were with approximately the same porosity but their cement content varied. These samples were made to investigate respectively the effects of porosity and cement content on the elastic and electrical properties of the calcite-cemented sandstones. The content of calcite cement was controlled by adding different weights of Ca(OH)2 powder into the sand grains, and the different porosity was achieved applying varying axis stresses during the consolidation of the sand-Ca(OH)2 mixture.
The samples in Group A were made with calcite cement of 20 wt% (weight percentage of calcite in the whole dry sample). This cement content was reached by controlling 15.6 wt% of the Ca(OH)2 powder in the sand-Ca(OH)2 mixture, and by applying a consolidation stress of 15, 20, 30, 40 and 70 MPa, respectively, the porosity of the samples was varied. On the other hand, the calcite cement in the Group B samples was made to vary between 10 wt% to 30 wt% at an interval of 5 wt% (the corresponding weight percentage of Ca(OH)2 powder in the sand-Ca(OH)2 mixture is 7.6, 11.6, 15.6, 19.8 and 24.1 wt%, respectively). Since quartz and calcite are close in density, keeping the density of the final samples the same will guarantee the samples have approximately the same porosity, provided that the weight of the dry samples is not changing. Therefore, the same porosity of the samples in Group B was achieved by compressing to the same height of the sand-Ca(OH)2 mixture, which was prepared to make sure the weight of the formed samples was the same.
Typical thin section images (as illustrated in Figure 1) of the formed samples show that the sand grains are generally coated by the precipitated calcite, resembling the commonly existing distribution of calcite in natural calcite-cemented sandstones (Morad, 2009). The mineral composition, porosity and permeability of the samples are tabulated in Table 1, from which it can be seen that the porosity of the samples in Group A varies between 0.1519 and 0.2218, and the porosity difference in Group B is less than 0.01. The precise control of the cement content and porosity forms the basis for the following investigation of their impact on the elastic and electrical properties of the calcite-cemented sandstones.
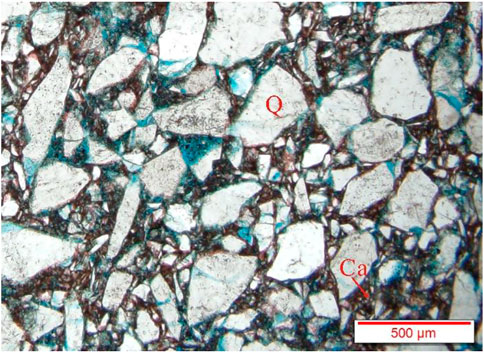
FIGURE 1. Microscopic characteristics of a typical manufactured calcite-cemented sandstone. The letters Ca and Q in the image stand for calcite and quartz, respectively. The pore space is filled with blue casting.
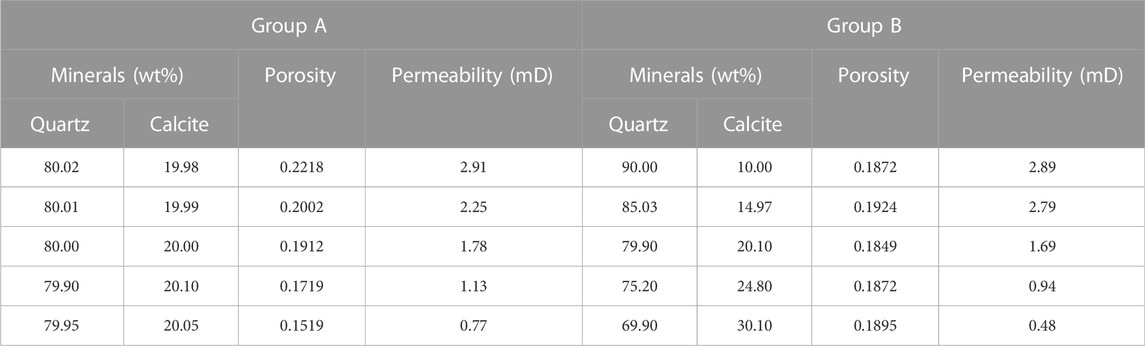
TABLE 1. Mineral composition, porosity and permeability of the artificial sandstones.
The artificial sandstone samples were cut into cylindrical cores with diameter of 1 inch and length of about 5 cm, with the two ends of each sample carefully polished to be parallel to within ±0.01 mm, to reduce errors in the length measurements and to enhance the contact between the samples and the transducers. The core samples were dried in an oven at the temperature of 60 °C for 48 h, vacuumed to −0.1 MPa for more than 12 h, and then saturated with 35 g/L brine (made from distilled and deaired water and NaCl) at a pressure of 20 MPa for 12 h to make sure the samples are fully saturated with the brine.
After full brine saturation of the samples, they were loaded into the joint elastic-electrical rig described by Han et al. (2020a), where P- and S-wave velocities and electrical resistance were simultaneously measured at the confining pressure of 5 MPa and pore pressure of the atmosphere pressure. The measured resistance was employed to calculate the rock resistivity through the length and diameter of the samples. Frequencies of the elastic and electrical measurements were about 500 kHz and 1 kHz, respectively, with the errors estimated to be approximately ±0.8% and ±1.2% for P- and S-wave velocities, respectively, and approximately ±0.2% for electrical resistivity (Han et al., 2020a). The measurements were made in a laboratory with the temperature controlled at 22°C ± 1 °C to minimize the effects of varying temperature on the experimental results.
Figure 2 shows the effects of porosity on the P- and S-wave velocities and electrical resistivity of the samples with the same content of calcite cement in Group A. Both the velocities and the resistivity reduce with increasing porosity. This is expected because more brine is needed to saturate the samples with greater porosity, and since brine has lower elastic moduli and resistivity than the mineral grains have, greater amount of brine will lead to decreasing velocities and resistivity.
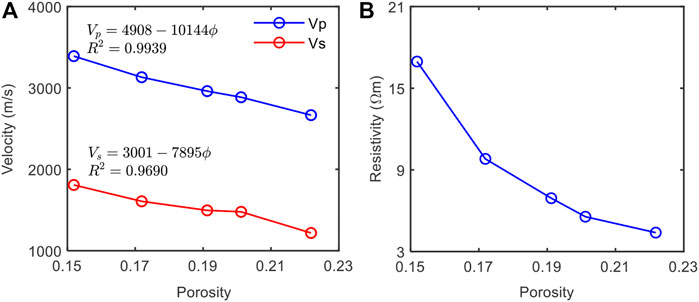
FIGURE 2. Effects of porosity on (A) the P- and S-wave velocities and (B) resistivity of the artificial samples with the same amount of calcite cement.
In addition to showing the decreasing velocities and resistivity with porosity, Figure 2 also illustrates that the decrease of the velocities tends to be linear, and can be best fitted by
where Vp and Vs are the P- and S-wave velocities in m/s, ϕ is the porosity, and the squared correlation coefficients for Vp and Vs are R2 = 0.9939, and R2 = 0.9690, respectively. The linear dependence of velocities on porosity is similar with that found in natural sandstones (Han et al., 1986; Al-Tahini et al., 2007). However, the content of calcite cement in our samples keeps constant, which may be different from natural sandstones that are having varying types and content of cement. Therefore, although a similar linear variation of velocities with porosity is obtained in our artificial sandstones and in natural sandstones, the reasons that cause this linear variation can be different. A deep investigation of such reasons can help to better reveal how velocities are affected, but this is not the main focus of this work.
Unlike the linearly decreasing velocities, the reduction of electrical resistivity with porosity tends to show an exponential trend, as shown in Figure 2B. The exponentially decreasing resistivity with porosity is understandable because according to Archie’s equation (Archie, 1942), the variation of resistivity with porosity is controlled by the cementation exponent, and if cementation exponent keeps unchanged, resistivity will show exponential dependence on porosity. Archie’s equation is given as
where R0 is the resistivity of a rock that is fully saturated with a brine of the resistivity Rw, ϕ is the rock porosity, and m is the cementation exponent, which implicitly represents the “connectedness” of the pore network for the transportation of hydraulic and electrical flow (Glover, 2009), and depends on the physical microstructural properties of fractal porous media (Wei et al., 2015; Cai et al., 2017). A greater m indicates a more complex pore structure of the rock.
It should be noted that the above explanation of the exponential dependency of resistivity on porosity is based on the assumption that the cementation exponent of the samples is not changing. This, however, may not be the case in our samples because different axial stresses are employed to consolidate the samples to achieve different porosity, and the difference in the applied stresses may lead to a variation in the microstructure and hence cementation exponent of the samples. Therefore, we will proceed to investigate whether the microstructure varies between the samples in Group A.
To obtain the microstructure, we invert from the measured velocities and resistivity to get the pore aspect ratio and the cementation exponent of the samples (Mavko et al., 2009; Han et al., 2021), through the employment of the differential effective medium (DEM) model (Berryman, 1995), and the equation of Archie (Archie, 1942), respectively. In the inversion, the bulk and shear moduli of quartz are taken to be 37 GPa and 44 GPa, respectively, and the elastic moduli of calcite are assumed to be 76.8 GPa and 32 GPa, respectively. Using these elastic parameters, the bulk and shear moduli of the mineral grains in the samples are determined to be 44.82 GPa and 41.64 GPa, respectively using the arithmetic average. The bulk modulus and resistivity of the brine saturating the samples are 2.25 GPa and 0.2132 Ω m, respectively. Densities are taken to be 2.65 g/cm3 for the quartz, 2.71 g/cm3 for the calcite and 1.035 g/cm3 for the brine. The effective grain moduli obtained using the arithmetic average will not fully reflect the effects of calcite as the cement (Dvorkin et al., 1994; Han et al., 2013). However, because the samples in Group A have the same calcite content, neglecting their cement effects will still effectively convey the varying trend of the pore aspect ratio with porosity determined from the DEM model.
Figure 3 shows the obtained pore aspect ratio and cementation exponent with varying porosity of the samples, and the comparison between the measured velocities and those modeled using the inverted pore aspect ratio based on the DEM model is shown in Figure 4. It can be seen from Figure 3 that pore aspect ratio increases and cementation exponent decreases with increasing porosity, indicating the microstructure of the samples is changing with porosity resulting from the variation in the applied consolidation stress. In addition to showing the general trend of the varying microstructure, Figure 3 also illustrates the variation differs in different porosity ranges. In the low porosity range (ϕ < 0.1719), the increase in the pore aspect ratio is relatively slow, whereas the cementation exponent that represents the “connectedness” of the pore network reduces dramatically. This may be due to the opening of the pore throats with lower consolidation stress (i.e., higher porosity). When porosity improves from 0.1719 to 0.2002, the pore aspect ratio increases significantly and the cementation exponent keeps dramatic decreasing. This might result from the rapid opening of the intergranular pores and the dilation of the pore throats with lowering consolidation stress. When porosity further increases, although the obtained pore aspect ratio still significantly increases, the reduction in the cementation exponent becomes slow. A possible cause of this microstructure variation can be that the lowering of the consolidation stress only enlarges the pore shape but does not generate new pore throats to connect the neighboring pores.
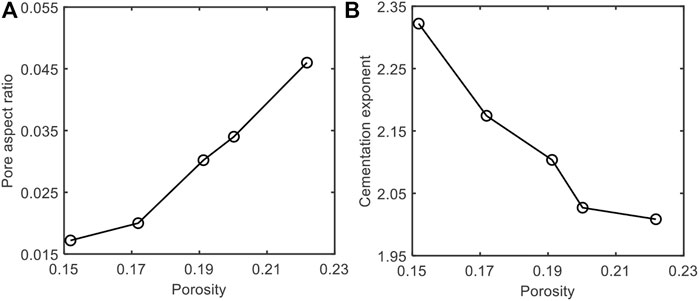
FIGURE 3. Variation of the (A) pore aspect ratio inverted from P- and S-wave velocities and (B) cementation exponent obtained from resistivity with porosity of the samples.
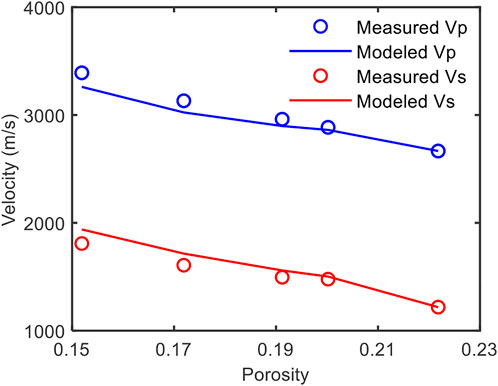
FIGURE 4. Comparison between the measured P- and S-wave velocities and those modeled using the inverted pore aspect ratio in Figure 3A based on the DEM model. The minor discrepancy between the measured and modeled velocities is possibly due to the averaged elastic moduli employed for the mineral grains.
The variation in the pore structure offered above to explain the determined pore aspect ratio and cementation exponent with porosity can be confirmed from the thin section images of the samples with different porosity, as shown in Figure 5. In the sample with low porosity, the high consolidation stress compresses the grains to contact each in the way of line contact, and the pores are dominated by residual intergranular pores filled with the calcite cement. The pore throats that connect the residual intergranular pores are low in diameter and the coordination number (the number of pore throats connected to each pore) is low leading to poor connectivity of the pore network (Figure 5A). These characteristics result in the low aspect ratios of the pores and the complex microstructure (i.e., great cementation exponent) of the samples. With an increase in porosity, both the diameter of the bridging pore throats and the coordination number increase, improving the connectivity of the pore network (Figures 5B–D), and leading to increasing effective pore aspect ratio and reducing complexity of the microstructure (i.e., decreasing cementation exponent). With further increase in porosity (Figures 5D,E), the decreasing consolidation stress weakly enlarges the diameter of the pore throats, and therefore the effective pore aspect ratio keeps increasing. However, the coordination number stabilizes at about 3, indicating the microstructure and the cementation exponent tend to be stable.
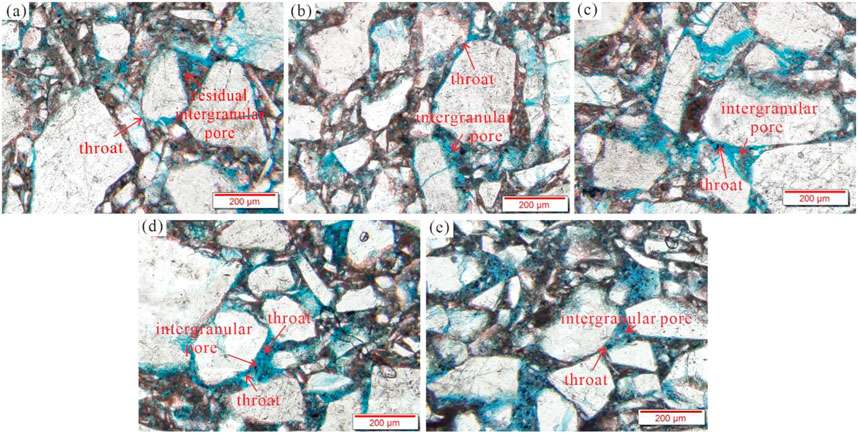
FIGURE 5. Typical thin section images of the samples with same cement content but with different porosity. Images (A) and (B) are respectively corresponding to the samples with porosity of 15.19% and 17.19%, and show that the majority of the pores are residual intergranular pores with poor connectivity. Images (C), (D), and (E) are for the samples with porosity of 19.12%, 20.02%, and 22.18%, respectively, illustrating the pores are dominantly intergranular pores with good connectivity.
The quantitative and visual analyses of the microstructures not only reveal the difference in the samples apart from their porosity, but also help to better interpret the variation of the elastic and electrical properties with porosity. It is understandable that increasing porosity will lead to decreasing velocities and resistivity. However, to make the samples with increasing porosity, a lowering consolidation stress was applied, resulting in increasing pore aspect ratio and reducing cementation exponent. Since pores with higher aspect ratio will make a rock more resistive to compression, the increase in the pore aspect ratio alone will increase the velocities of the samples. Therefore, the observed decreasing velocities with porosity suggests that the effects of increasing porosity on reducing the rock velocities prevail over the effects of the increasing pore aspect ratio (as a result of the lowering consolidation stress) on improving the rock velocities. On the other hand, increasing porosity will reduce the rock resistivity, and the reducing cementation exponent with increasing porosity will further decrease the rock resistivity by enhancing the connectivity of the pore network. Therefore, the observed variation of the elastic and electrical rock properties with porosity in the Group A samples with the same content of calcite cement is a combined result of the varying porosity and the applied consolidation stress that causes the variation in the porosity.
Having studied the effects of porosity on the elastic and electrical properties of the samples in Group A with the same amount of calcite cement, we proceed to investigate the effects of cement content on the elastic and electrical properties of the artificial samples with approximately the same porosity (varying between 0.1849 and 0.1924) in Group B.
The variation of the measured elastic and electrical properties with cement content of the samples is shown in Figure 6. When porosity keeps almost the same, P- and S-wave velocities first weakly reduce and then gradually increase with increasing cement content until cement content reaches about 25 wt% when the increase in the velocities becomes weaker. In a different way, resistivity reduces first and decreases again after an increase in the middle range of cement content. The complex variation of the elastic and electrical properties with cement content is in great contrast with the expected increase of the physical properties with increasing cement content (Jarrard et al., 2000). A possible cause of the contrast is the difference in porosity of the samples, as indicated in Figure 6B. Although efforts have been made to confine the porosity difference to within 0.01, according to the effects of porosity on the elastic and electrical properties obtained in the previous section, such a small porosity difference may still impact significantly the physical and especially the electrical rock properties. Therefore, the small divergence in the porosity may cover up the effects on cement content on the measured rock properties.
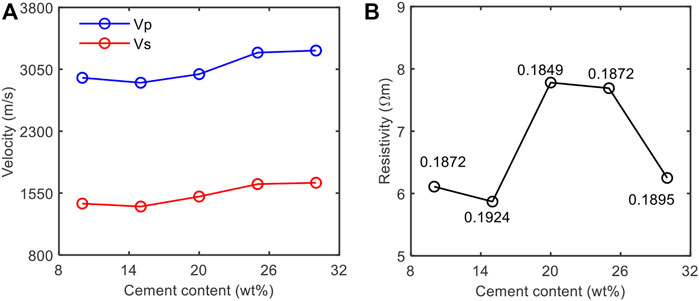
FIGURE 6. Effects of cement content on the (A) P- and S-wave velocities and (B) resistivity of the rock samples with approximately the same porosity.
We eliminate the impact of the different porosity by calculating, using Archie equation (Archie, 1942), the cementation exponent of the samples that is independent of porosity, as shown in Figure 7. The determined cementation exponent is not showing a monotonous variation with cement content, but instead first increases and then decreases, forming a bell-shaped correlation with the increasing cement content. This obtained relationship is not consistent with previous studies that have found strong correlation between cementation exponent and the content of cement in sandstones (e.g., Glover, 2009). This inconsistency is possibly due to the fact that the microstructure (and hence cementation exponent) of our samples is not purely affected by the content of cement. Additional, the different consolidation stress employed to arrive at the same porosity of the samples (lower stresses are associated with the samples with greater content of calcite cement) may also contribute to the microstructure and cementation exponent of the samples. The increasing cementation exponent with cement content for the samples with cement content less than about 25 wt% indicates the impact of the increasing cement content that improves cementation exponent overwhelms the influence of the lowering consolidation stress that reduces cementation exponent. Similarly, the significant reduction of the cementation exponent when cement content exceeds about 25 wt% implies the effects of the lowering consolidation stress on simplifying the microstructure (reducing cementation exponent) prevail over that of the increasing cement content on complicating the microstructure (improving cementation exponent).
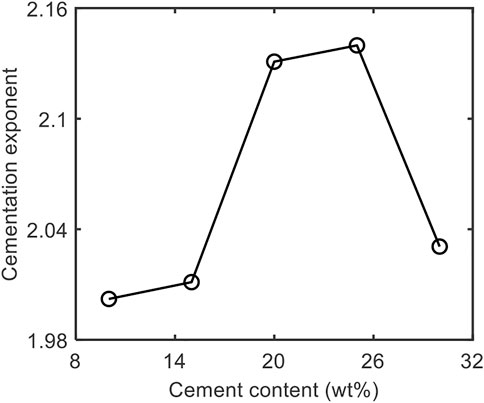
FIGURE 7. Relationship between cementation exponent and cement content of the samples with approximately the same porosity.
The variation in the microstructure of samples that can be jointly affected by the different cement content and consolidation stress can be observed from the thin section images, as illustrated in Figure 8. For the samples with cement content between 10 wt% and 20 wt% (Figures 8A–C), the rock structures are supported by the sand particles, and the calcite cement fills in the enlarging intergranular pores due to the lowering consolidation stress, forming the pores that are dominated by intergranular pores and residual intergranular pores. The pore throats in these samples become gradually narrowing due to the filling and blocking of the calcite cement, making the connectivity of the pores through the throats worse, and hence the microstructure becomes more and more complicated. When the cement content increases from 20 wt% to 25 wt% (Figure 8D), the rock structure turns from sand supporting to predominantly cement supporting with the sand grains floating in the calcite cement. The pores consist mainly of residual intergranular pores and micropores between the precipitated calcite grains, and the connectivity of the pore throats continues to reduce due to the uninterrupted filling and blocking of the calcite cement, making the pore structure increasingly complex. For the samples with cement content greater than about 25 wt% (Figures 8E,F), the rock structure is still supported by the calcite cement, but the pores are dominated by micropores between calcite grains. According the ‘potential connectivity’ theory proposed by Li (2013), the accumulation of the micropores will significantly improve the pore connectivity, leading to a dramatic reduction in the complexity of the pore structure.
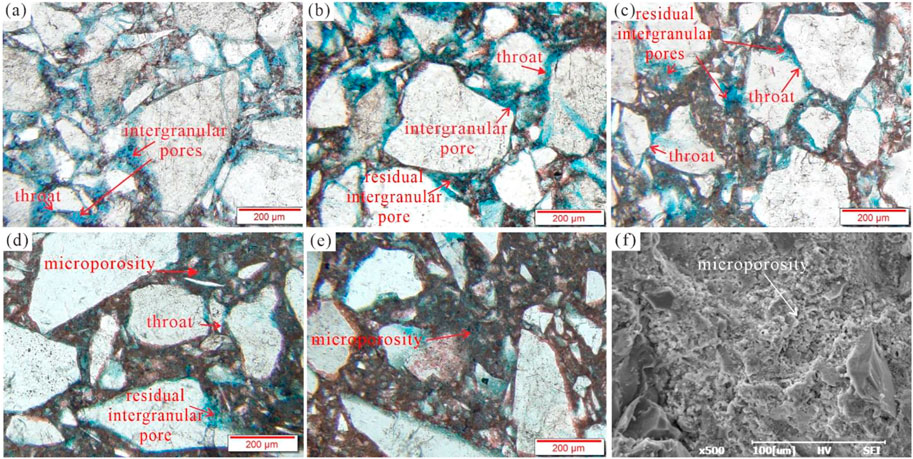
FIGURE 8. Typical thin section and scanning electron microscope (SEM) images of the samples with different cement content but with approximately the same porosity. Image (A): cement content is 10 wt%, the structure is supported by the particles and the pores are dominated by intergranular pores. Image (B): cement content is 15 wt%, the structure is supported by the particles and the pore system consists of intergranular pores and residual intergranular pores. Image (C): cement content is 20 wt%, the structure is supported by the particles and the pore system mainly includes intergranular pores and residual intergranular pores. Image (D): cement content is 25 wt%, the structure is supported by the cement and the pore system consists of residual intergranular pores and micropores. Image (E): cement content is 30 wt%, the structure is supported by the cement. Image (F): SEM image showing the development of micropores.
It can be clear from the comprehensive analyses offered above that the variation in both porosity and microstructure (cementation exponent) of the samples will impact their elastic and electrical properties, and the microstructure is closely related to the cement content and the applied consolidation stress. Increasing porosity will reduce the elastic velocities and electrical resistivity, and on the other hand the increasing cement content and its associated reduction in the consolidation stress will respectively improve and reduce the cementation exponent, the increase in which shows strong positive correlation with the elastic and electrical rock properties (Glover, 2009; Han et al., 2020b). Since the above three parameters (i.e., porosity, cement content and cementation exponent) affect the physical properties in different ways, the obtained experimental results can be difficult to be explained directly from the variation in these parameters, but can help to infer their different contributions to the elastic and electrical properties.
Specifically, the weak reduction in the velocities and resistivity of the samples with calcite content increasing from 10 wt% to 15 wt% implies the contribution of the increasing porosity to reducing the elastic and electrical properties is dominant over the effects on increasing cementation exponent (for samples with calcite content less than about 25 wt%, the cementation exponent is dominated by the increasing cement content in comparison with the lowering consolidation stress) on improving the physical rock properties. When the cement content increases from 15 wt% to about 20 wt%, the improvement in the velocities and resistivity of the samples indicates the electrical properties are more subject to the porosity whereas the contribution of porosity to the elastic properties is less significant than that of the cementation exponent. For the samples with cement content increasing from 20 wt% to 25 wt%, their rapidly increasing velocities and weakly decreasing resistivity suggests the impact of increasing cementation exponent on improving the velocities prevails over the influence of increasing porosity on reducing the velocities, whereas the impact of increasing cementation exponent on improving the resistivity is overwhelmed by the effects of the increasing porosity on reducing the resistivity. The porosity increases and the cementation exponent decreases in the samples with cement content exceeding about 25 wt% (as illustrated in Figure 6, Figure 7), and therefore their elastic and electrical properties should both reduce. The experimental results confirm the expected resistivity reduction, but show unexpected weak improvement in the elastic velocities. This might be possibly due to the fact that rock structure has changed from sand supporting to calcite supporting (as shown in Figure 8E). Since the elastic velocities of calcite are greater than that of sand, the increase in the calcite content may have covered up the combined effects of reducing consolidation stress and increasing porosity on decreasing the rock velocities.
We have studied quantitatively the effects of calcite cement and porosity on the P- and S-wave velocities and electrical resistivity of artificial calcite-cemented sandstones made using a new recipe. The experimental results demonstrate that the velocities reduce approximately linearly and the resistivity decreases exponentially with increasing porosity when the calcite cement content keeps constant in the samples. By contrast, the elastic and electrical properties are complexly affected by the cement content if porosity of the samples is roughly the same. Interpretation and analyses of the experimental results illustrate that the elastic and electrical rock properties are a combined result of porosity, the content and distribution of the calcite cement, as well as the microstructure of the samples caused by the variation in the applied consolidation stress. For the samples with cement content less than about 25 wt%, the calcite cement distributes mainly in the intergranular pores, and the elastic and electrical properties are affected predominantly by porosity, with the variation in the microstructure being the second order influencing parameter. On the other hand for the samples with greater content of calcite cement, the calcite turns to be the structure-supporting mineral, and therefore its impact on the microstructure becomes to play the dominant role over porosity in affecting the elastic and electrical properties. The results have revealed the mechanisms of how porosity and calcite cement affect the elastic and electrical properties of calcite cemented sandstones, and provided a theoretical basis for the accurate characterization of sandstone reservoirs through seismic and electromagnetic surveys.
The raw data supporting the conclusion of this article will be made available by the authors, without undue reservation.
PW and TH conceive this research. PW implements the experiments, prepares the figures and writes the manuscript. TH reviews and supervises the manuscript. The co-author L-YF is involved in the discussion of the manuscript. All authors finally approve the manuscript and thus agree to be accountable for this work.
The research is supported by the National Natural Science Foundation of China (41821002, 42174136, 41874151), the Shandong Provincial Natural Science Foundation, China for distinguished young scientists (ZR2021JQ14), the Fundamental Research Funds for the Central Universities (22CX07004A), and the Science and Technology Fund Projects of PetroChina Company Limited (2021DJ1803).
The authors declare that the research was conducted in the absence of any commercial or financial relationships that could be construed as a potential conflict of interest.
All claims expressed in this article are solely those of the authors and do not necessarily represent those of their affiliated organizations, or those of the publisher, the editors and the reviewers. Any product that may be evaluated in this article, or claim that may be made by its manufacturer, is not guaranteed or endorsed by the publisher.
Ajdukiewicz, J. M., and Larese, R. E. (2012). How clay grain coats inhibit quartz cement and preserve porosity in deeply buried sandstones: Observations and experiments. AAPG Bull. 96 (11), 2091–2119. doi:10.1306/02211211075
Al-Tahini, A. M., Sondergeld, C. H., and Rai, C. S. (2007). Effect of cementation on ultrasonic velocities in sandstones. Geophysics 72 (2), E53–E58. doi:10.1190/1.2431327
Archie, G. E. (1942). The electrical resistivity log as an aid in determining some reservoir characteristics. Trans. AIME. 146, 54–62. doi:10.2118/942054-G
Berryman, J. G. (1995). “Mixture theories for rock properties,” in Rock physics and phase relations. Editor T. J. Ahrens (New York, NY, USA: Am. Geophys. U), 205–208. doi:10.1029/RF003p0205
Cai, J., Wei, W., Hu, X., and Wood, D. A. (2017). Electrical conductivity models in saturated porous media: A review. Earth-Sci. Rev. 171, 419–433. doi:10.1016/j.earscirev.2017.06.013
Constable, S. (2010). Ten years of marine CSEM for hydrocarbon exploration. Geophysics 75 (5), 75A67–75A81. doi:10.1190/1.3483451
Dejong, J. T., Fritzges, M. B., and Nüsslein, K. (2006). Microbially induced cementation to control sand response to undrained shear. J. Geotech. Geoenviron. Eng. 132 (11), 1381–1392. doi:10.1061/(asce)1090-0241
Ding, P., Di, B., Wei, J., Li, X., and Deng, Y. (2015). Experimental research on the effects of crack density based on synthetic sandstones contain controlled fractures. Chin. J. Geophys.-Chinese Ed. 58 (4), 1390–1399. doi:10.6038/cjg20150425
Dvorkin, J., Nur, A., and Yin, H. Z. (1994). Effective properties of cemented granular materials. Mech. Mat. 18 (4), 351–366. doi:10.1016/0167-6636(94)90044-2
Glover, P. (2009). What is the cementation exponent? A new interpretation. Geophysics 28 (1), 82–85. doi:10.1190/1.3064150
Han, D. H., Nur, A., and Morgan, D. (1986). Effects of porosity and clay content on wave velocities in sandstones. Geophysics 51 (11), 2093–2107. doi:10.1190/1.1442062
Han, T., Liu, S., Fu, L. Y., and Yan, H. (2021). Understanding how overpressure affects the physical properties of sandstones. Geophysics 86 (2), MR203–MR210. doi:10.1190/GEO2020-0776.1
Han, T., Liu, S., Xu, D., and Fu, L. Y. (2020a). Pressure-dependent cross-property relationships between elastic and electrical properties of partially saturated porous sandstones. Geophysics 85 (3), MR107–MR115. doi:10.1190/GEO2019-0477.1
Han, T., Wei, Z., and Fu, L. Y. (2020b). Cementation exponent as a geometric factor for the elastic properties of granular rocks. Geophysics 85 (6), MR341–MR349. doi:10.1190/geo2020-0250.1
Han, X., Guo, J., Li, F. B., Yang, L., and Tang, J. (2013). Modified acoustic velocity model for basal cemented loose sandstone based on contact cement theory. J. China Univ. Pet. Ed. Nat. Sci. 37 (04), 76–82. doi:10.3969/j.issn.1673-5005.2013.04.011
Harkes, M. P., Paassen, L., Booster, J. L., Whiffin, V. S., and Loosdrecht, M. C. M. V. (2010). Fixation and distribution of bacterial activity in sand to induce carbonate precipitation for ground reinforcement. Ecol. Eng. 36 (2), 112–117. doi:10.1016/j.ecoleng.2009.01.004
Ismail, M. A., Joer, H. A., Randolph, M. F., and Meritt, A. (2002a). Cementation of porous materials using calcite. Géotechnique 52 (5), 313–324. doi:10.1680/geot.52.5.313.38709
Ismail, M. A., Joer, H. A., Sim, W. H., and Randolph, M. F. (2002b). Effect of cement type on shear behavior of cemented calcareous soil. J. Geotech. Geoenviron. Eng. 128 (6), 520–529. doi:10.1061/(asce)1090-0241
Jarrard, R. D., Niessen, F., Brink, J. D., and Bücker, C. (2000). Effects of cementation on velocities of siliciclastic sediments. Geophys. Res. Lett. 27, 593–596. doi:10.1029/1999GL008429
Konstantinou, C., Biscontin, G., Jiang, N. J., and Soga, K. (2021). Application of microbially induced carbonate precipitation to form biocemented artificial sandstone. J. Rock Mech. Geotech. Eng. 13 (3), 579–592. doi:10.1016/j.jrmge.2021.01.010
Kucharski, E., Price, G., Li, H. Y., and Joer, H. A. (1997). Engineering properties of CIPS cemented calcareous sand. Proc. 30th Int. Geol. Cong. 23, 449–460. doi:10.1201/9780429087813-46
Li, N. (2013). Introduction to logging interpretation of China marine carbonate rocks (in Chinese). Beijing, China: Science Press.
Mavko, G., Mukerji, T., and Dvorkin, J. (2009). The rock physics handbook: Tools for seismic analysis of porous media. 2nd ed. Cambridge, UK: Camb. Univ. Press. doi:10.1016/j.ijrmms.2011.08.002
Morad, S., Al-Ramadan, K., Ketzer, J. M., and Ros De, L. F. (2010). The impact of diagenesis on the heterogeneity of sandstone reservoirs: A review of the role of depositional facies and sequence stratigraphy. AAPG Bull. 94 (8), 1267–1309. doi:10.1306/04211009178
Morad, S. (2009). Carbonate cementation in sandstones: Distribution patterns and geochemical evolution. New jersey, NJ, USA: Blackwell Publishing Ltd. doi:10.1002/9781444304893.ch1
Muynck, W. D., Belie, N. D., and Verstraete, W. (2010). Microbial carbonate precipitation in construction materials: A review. Ecol. Eng. 36 (2), 118–136. doi:10.1016/j.ecoleng.2009.02.006
Palmén, A., Larsson, S., Axelsson, M., and Price, G. (2016). Low-temperature calcite precipitation in sand using CIPS. Proc. ICEG. Ipv. 169 (1), 1–6. doi:10.1680/grim.14.00009
Qian, C., Pan, Q., and Wang, R. (2010). Cementation of sand grains based on carbonate precipitation induced by microorganism. Sci. China-Technol. Sci. 53 (8), 2198–2206. doi:10.1007/s11431-009-3189-z
Sherlock, D. H., and Siggins, A. F. (2004). The development of synthetic CIPS sandstones for geophysical research. ASEG Extend. Abs 2003 (2), 1–5. doi:10.1071/aseg2003ab159
Si, W., Di, P., Wei, J., and Li, Q. (2016). Experimental study of water saturation effect on acoustic velocity of sandstones. J. Nat. Gas. Sci. Eng. 33, 37–43. doi:10.1016/j.jngse.2016.05.002
Tang, X., Song, Y., Fu, J., Li, Q., Fu, C., Xu, S., et al. (2016). Conductance mechanism and conduction model for tight shale-rich and calcite-rich sands. Chin. J. Prog. Geophys. 31 (4), 1660–1669. doi:10.6038/pg20160434
Tanner, R. S., Udegbunam, E. O., McInerney, M. J., and Knapp, R. M. (1991). Microbially enhanced oil recovery from carbonate reservoirs. Geomicrobiol. J. 9 (4), 169–195. doi:10.1080/01490459109385998
Wang, J., Cao, Y., Liu, K., Liu, J., Xue, X., and Xu, Q. (2016). Pore fluid evolution, distribution and water-rock interactions of carbonate cements in red-bed sandstone reservoirs in the Dongying Depression, China. Mar. Pet. Geol. 72, 279–294. doi:10.1016/j.marpetgeo.2016.02.018
Wang, B., Chen, X., Chen, J., Yao, J., and Tan, K. (2020). Elastic characteristics and petrophysical modeling of the Jurassic tight sandstone in Sichuan Basin. Chin. J. Geophys.-Chinese Ed. 63 (12), 4528–4539. doi:10.6038/cjg20200346
Wang, J., Cao, Y., Liu, H., and Gao, Y. (2015). Formation conditions and sedimentary model of over-flooding lake deltas within continental lake basins: An example from the paleogene in the jiyang subbasin, bohai bay basin. Acta Geol. sin.-engl. Ed. 89 (01), 270–284. doi:10.1111/1755-6724.12410
Wang, Z. (2001). Fundamentals of seismic rock physics. Geophysics 66 (2), 398–412. doi:10.1190/1.1444931
Wei, W., Cai, J., Hu, X., and Qi, H. (2015). An electrical conductivity model for fractal porous media. Geophys. Res. Lett. 42 (12), 4833–4840. doi:10.1002/2015GL064460
Yasuhara, H., Neupane, D., Hayashi, K., and Mitsu, O. (2012). Experiments and predictions of physical properties of sand cemented by enzymatically-induced carbonate precipitation. Soils Found. 52 (3), 539–549. doi:10.1016/j.sandf.2012.05.011
Keywords: calcite-cemented artificial sandstones, porosity, cement, velocity, resistivity
Citation: Wang P, Han T and Fu L-Y (2023) Elastic and electrical properties of calcite-cemented artificial sandstones based on a new manufacturing method. Front. Earth Sci. 10:1098466. doi: 10.3389/feart.2022.1098466
Received: 15 November 2022; Accepted: 09 December 2022;
Published: 27 January 2023.
Edited by:
Lidong Dai, Institute of Geochemistry (CAS), ChinaReviewed by:
Genyang Tang, China University of Petroleum, ChinaCopyright © 2023 Wang, Han and Fu. This is an open-access article distributed under the terms of the Creative Commons Attribution License (CC BY). The use, distribution or reproduction in other forums is permitted, provided the original author(s) and the copyright owner(s) are credited and that the original publication in this journal is cited, in accordance with accepted academic practice. No use, distribution or reproduction is permitted which does not comply with these terms.
*Correspondence: Tongcheng Han, aGFudGNAdXBjLmVkdS5jbg==
Disclaimer: All claims expressed in this article are solely those of the authors and do not necessarily represent those of their affiliated organizations, or those of the publisher, the editors and the reviewers. Any product that may be evaluated in this article or claim that may be made by its manufacturer is not guaranteed or endorsed by the publisher.
Research integrity at Frontiers
Learn more about the work of our research integrity team to safeguard the quality of each article we publish.