 Jing Ba
 Fulin Guo
 José M. Carcione
 Davide Gei
- 1School of Earth Sciences and Engineering, Hohai University, Nanjing, China
- 2National Institute of Oceanography and Applied Geophysics—OGS, Trieste, Italy
P-wave anelasticity (attenuation and dispersion) of hydrate-bearing sediments depends on several factors, namely the properties of the mineral components, hydrate content and morphology, and fluid saturation. Anelasticity is analyzed with a triple-porosity model (stiff pores, clay micropores and hydrate micropores), by considering hydrate as an additional solid skeleton. We relate the hydrate volume ratio, porosity and radii of the hydrate inclusion and clay mineral to the P-wave velocity and attenuation. The model takes wave-induced local fluid flow (mesoscopic loss) at the grain contacts into account. The results are compared with those of a double-porosity and load-bearing models, and verified with well-log data from Offshore Drilling Program sites 1247B and 1250F, and data reported in Nankai Trough, Japan. Model results and data show a good agreement.
Introduction
Gas hydrate is an ice-like crystalline medium with a microporous structure composed of gas and water molecules that are formed at low temperature, high pressure and certain gas saturation (Sloan, 1990). Identification of hydrate reservoirs in engineering applications worldwide mainly relies on seismic exploration techniques. The existence of hydrates highly affects the acoustic wave velocity and attenuation. Generally, hydrate-bearing sediments show high compressional (P-) and shear (S-) wave velocities. These velocities and attenuation are usually adopted to estimate the presence of hydrates (Waite et al., 2009). With the increasing hydrate content, the wave velocity increases. Moreover, the morphology and distribution of hydrate also have an effect on the velocities (Ecker et al., 1998; Ecker et al., 2000). However, the relation between attenuation and hydrate content is more complex, as it is associated with mechanisms due to different microporous hydrate forms (Best et al., 2013).
Rock physics is an effective approach to describe the quantitative relation between the rock microstructure and the wave properties. A suitable model associated with the hydrate morphology could be helpful to improve the accuracy in the estimation of hydrate content (Pan et al., 2019). In fact, the hydrate-bearing sediment is a three-phase porous medium, composed of a rock frame saturated with a fluid (usually water) and hydrates (Liu et al., 2021). Biot (1962) considered wave propagation in fully saturated porous media including anisotropy and viscoelasticity, and a loss mechanism related to the differential motion between the frame and the fluid. Stoll and Bryan. (2009) was the first to systematically apply Biot’s theory to marine sediments. Carcione and Gei (2004) proposed a Biot-type theory of two solids and one fluid, in which hydrate is considered as a second skeleton (frame) and water is the pore fluid—grain cementation and friction between the two frames have been considered (see also, Carcione et al. (2005); Gei and Carcione (2003); Gei et al. (2022)). This model has also been used by Guerin and Goldberg (2005).
On the other hand, Ba et al. (2011); Ba et al. (2016) proposed a double-porosity model to describe attenuation due to local fluid flow between soft and stiff pores (mesoscopic or microscopic loss). For the same purpose, Zhang et al. (2017) presented an alternative model based on the triple-porosity structure of sand, gravel and mudstone while, Zhang et al. (2016) applied the BISQ (Biot/squirt) model specifically to marine unconsolidated hydrate-bearing sediments. They found that wave velocity and attenuation increase with increasing hydrate content, in agreement with some measurement data (Chand and Minshull, 2004; Guerin and Goldberg, 2005; Matsushima, 2006), and that porosity has a weak effect on attenuation. Zhan et al. (2022) discussed and compared the feasibility and limitations of existing rock physics models. The combination of different models may be more conducive to explaining the mechanism of attenuation.
Attenuation also depends on the hydrate morphology and microstructure (Priest et al., 2009), as shown by laboratory measurements, including local viscous fluid flow related to the microporous structure of hydrate containing gas and water (Best et al., 2013). Leurer and Brown (2008) proposed a model to explain the viscoelasticity generated by local fluid flow in the presence of clay at grain contacts. Marín-Moreno et al. (2017) developed the hydrate-bearing effective sediment model (HBES) to analyze various loss mechanisms, including those caused by squirt flow in microporous hydrate, viscoelasticity of the hydrate frame and Biot global flow. They analyzed the effect of hydrate morphology on attenuation by comparing results between sediments with and without hydrates. Sahoo et al. (2019) performed high-precision ultrasonic pulse-echo measurements of wave velocity and attenuation in hydrate-bearing sediments. Li et al. (2015) studied the effect of clay content on the mechanical properties of these sediments by applying the tests of multi-stage loading triaxial compression and hydrate decomposition. On the basis of six microscopic hydrate morphologies, Pan et al. (2019) obtained rock-physics templates (RPTs), based on an amplitude-variation with offset (AVO) analysis, and predicted hydrate content, porosity and clay content of permafrost-associated hydrate-bearing sediments at Mount Elbert, North Slope of Alaska.
The hydrate distribution in the pore space is important. In the formation process, gas hydrate is present in different forms due to the influence of the geological setting, formation pressure and geothermal gradient. Ecker et al. (1998) proposed three types of hydrate distributions, namely, grain-contact cementing, grain coating and absent in the grain contacts. Dai et al. (2004) proposed six distributions: grain-contact cementing, grain coating, supporting matrix/grains, pore-filling, matrix and inclusions, and nodules/fracture fillings. Zhan and Matsushima. (2018) considered four distributions: grain-contact cementing, grain coating, load-bearing and pore-filling (Schicks et al., 2006). Three microscopic distribution patterns of hydrates, namely pore filling, contact or encapsulated cementation and load-bearing hydrates, are discussed by Waite et al. (2009).
Understanding the effect of anelasticity on the acoustic properties is not clear, mainly because attenuation behaves differently at different frequency bands. Here, we consider the local fluid flow between stiff pores, hydrates, and clay, based on a triple-porosity model (Zhang et al., 2017). In addition to the double-porosity model, the new model considers the effects of clay micropores. The results agree with log data, providing an effective approach to model the P-wave anelasticity mechanisms of hydrate-bearing sediments.
The model
We consider the main frame or skeleton containing intergranular pores as the host phase, hydrate and clay as two different types of multi-pore inclusions, and describe the hydrate-bearing sediments with a triple-porosity model. It has been observed that hydrate can cement the mineral grain and contributes to the solid skeleton or being part of pore-filling material. Cementation decreases the porosity and increases the bulk modulus of the skeleton. Figure 1 shows three cases where hydrate is 1) part of the pore infill; 2) part of the frame; 3) cementing the grains. We consider the case in panel 2).
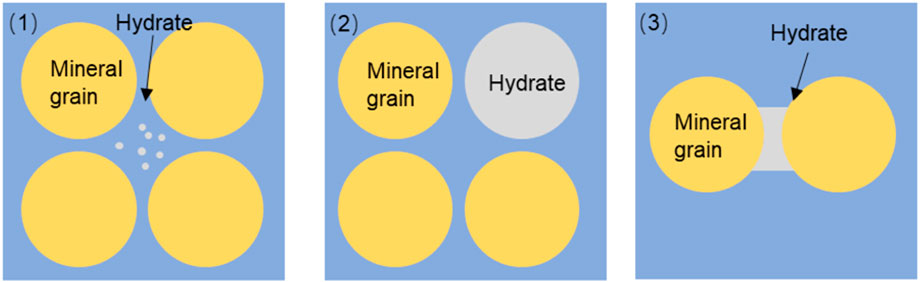
FIGURE 1. Scheme showing the three hydrate morphologies.
In this case, the hydrate-bearing sediment can be regarded as a composite of three skeletons: rock (minerals), hydrate and clay. Basically, hydrate and clay reduce the bulk porosity and combine with the minerals as shown in Figure 2, and then the resulting frame is saturated.
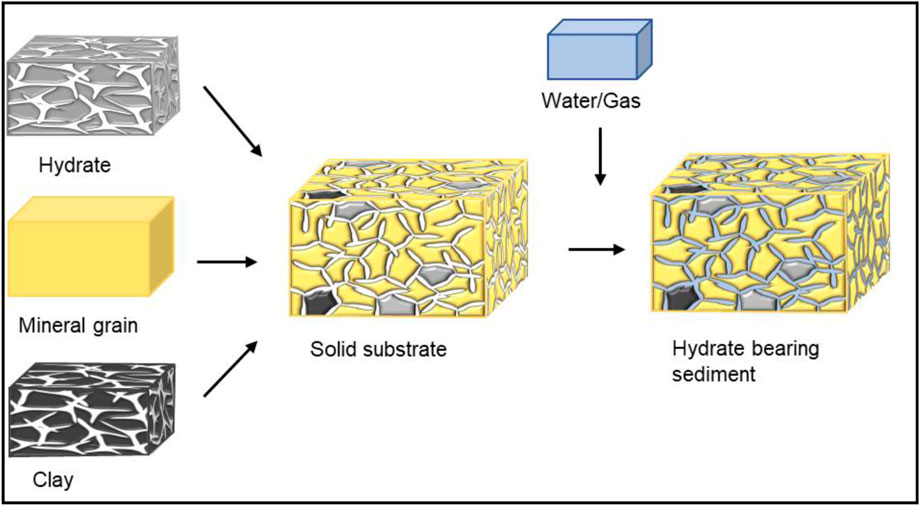
FIGURE 2. Diagram showing hydrate as part of the solid frame (skeleton).
As stated above, the understanding on wave-loss mechanisms of hydrate-bearing sediments is still limited (Best et al., 2013). Figure 3 shows the mechanisms considered in our triple-porosity model, i.e., local fluid flow between the rock skeleton and hydrate and clay frames, and the classical Biot global flow (Zhang et al., 2022).

FIGURE 3. Attenuation mechanisms of the triple-porosity model.
Properties of fluid
If hydrate is part of the frame, the pore fluid is a mixture of water and free gas, such that its effective bulk modulus is (Wood, 1955; Wood et al., 2000; Liu et al., 2017)
where
The effective density of the fluid is
where
Properties of solid phase (composite mineral)
According to the Hill average (Hill, 1952), the moduli of the solid phase considering the presence of hydrate are (Helgerud et al., 1999; Ecker et al., 2000)
where
Properties of the frame
Let us define the volume ratios, local porosities and absolute porosities of the host phase made of quartz and calcite, hydrate skeleton and clay skeleton as
The porosity of the host phase is
where
Compared to the Hashin-Shtrikman upper bound, the Hashin-Shtrikman lower bound is appropriate for estimating the elastic moduli of submarine sediments, where the soft components (clay or soft minerals) are majorly distributed surrounding the stiff grains. The dry-rock elastic moduli are obtained by the modified Hashin-Shtrikman lower bound (Ecker et al., 1998; Dvorkin et al., 1999; Helgerud et al., 1999)
where
where
Properties of the saturated sediment
There are two approaches to relate the hydrate content to the P-wave velocity. One method is the use of empirical relations, such as the time-average equation (Wyllie et al., 1958) and Lee weighted equation (Lee et al., 1996; Lee and Collett, 2009), by combining the Wood and time-average equations (Helgerud et al., 1999). Other approaches are poroelasticity and effective medium theories (Helgerud et al., 1999). These methods involve input parameters which are difficult to be obtained in actual applications (Hu et al., 2010).
The double-porosity theory considers that in the process of seismic wave propagation, the micropore structure of the hydrate phase induces a local flow between these micropores and the stiff pores and causes energy loss and velocity dispersion (see Figure 4). This theory, however, ignores the presence of clay, which may also cause flow (Wang et al., 2021). The inclusion of clay leads to the triple-porosity model (see red arrow in Figure 4).
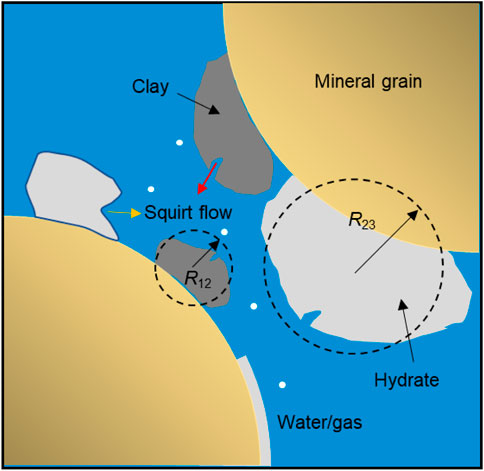
FIGURE 4. Schematic diagram of the proposed triple-porosity model.
Zhang et al. (2017) developed a theory to model the properties of a saturated medium, where the local fluid-flow mechanisms, responsible for wave attenuation and dispersion, are considered. Based on Hamilton’s principle, the dynamical equations can be obtained from the strain energy, kinetic energy and dissipation potential of a triple-porosity medium. The differential equations of motion, extended to the case of hydrate-bearing sediments, are
where
Example
The minerals are calcite, quartz, clay and hydrate, with volume fractions of f1 = 4%, f2 = 70%, f4 = 20% and f3 = 6%, respectively. The rock porosity with hydrate formation is
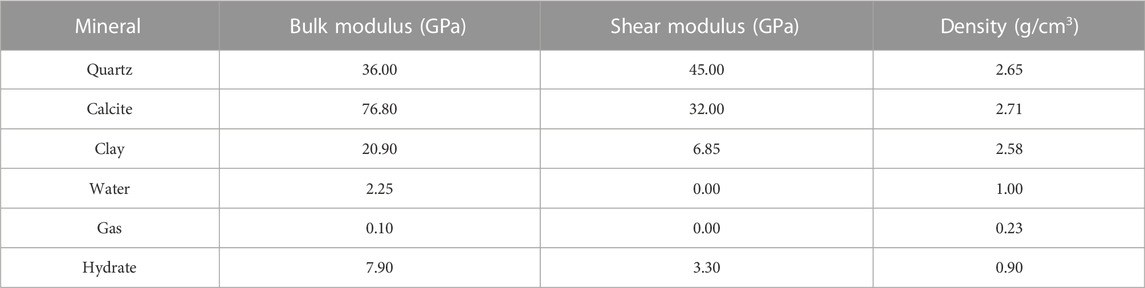
TABLE 1. Properties of the phases (Helgerud et al., 1999).
The energy loss caused by the fluid flow depends on the radius of the hydrate inclusions with micropores. Figure 5 shows the results of the double-porosity theory (clay is considered part of the host phase and hydrate is an inclusion), where we can observe a single inflection point and attenuation peak. With increasing radius of these inclusions, the local fluid-flow attenuation peak moves to the low frequencies. The global fluid-flow peak, occurring at high frequencies, is much weaker, almost negligible.
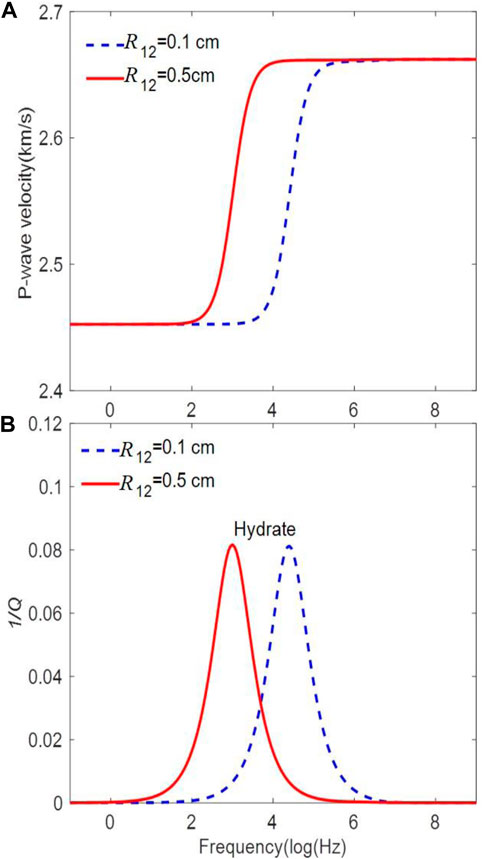
FIGURE 5. Frequency dependence of the P-wave velocity (A) and attenuation (B) corresponding to the double-porosity model with two radii of the hydrate inclusions.
On the other hand, Figure 6 shows the results of the triple-porosity theory, which exhibits the two local fluid-flow mechanisms, between the stiff pores and the soft pores of clay and hydrate phases. The global Biot peak is also present. The clay inclusion radius is
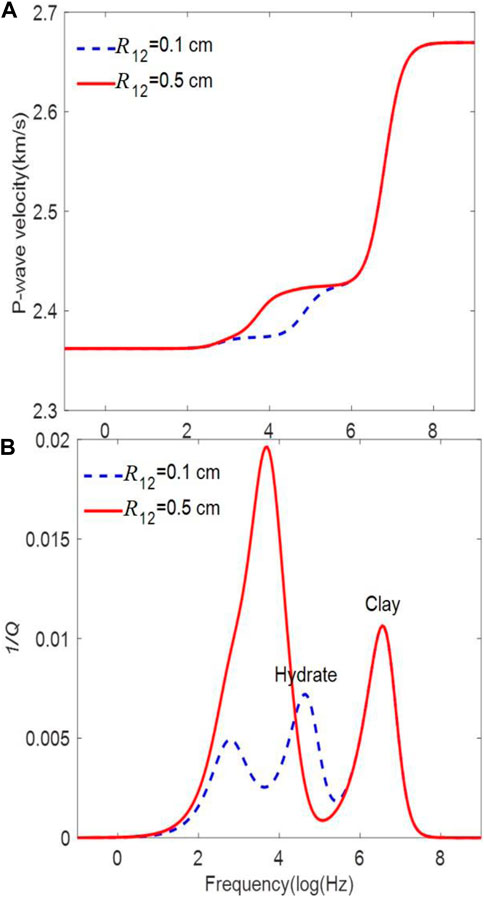
FIGURE 6. Frequency dependence of the P-wave velocity (A) and attenuation (B) corresponding to the triple-porosity model with two radii of the hydrate inclusions.
Figures 7A, B show the P-wave velocity and dissipation factor as a function of frequency for different clay inclusion radii, respectively. Changes can be observed at high frequencies. When the peaks are close, higher attenuation is observed.
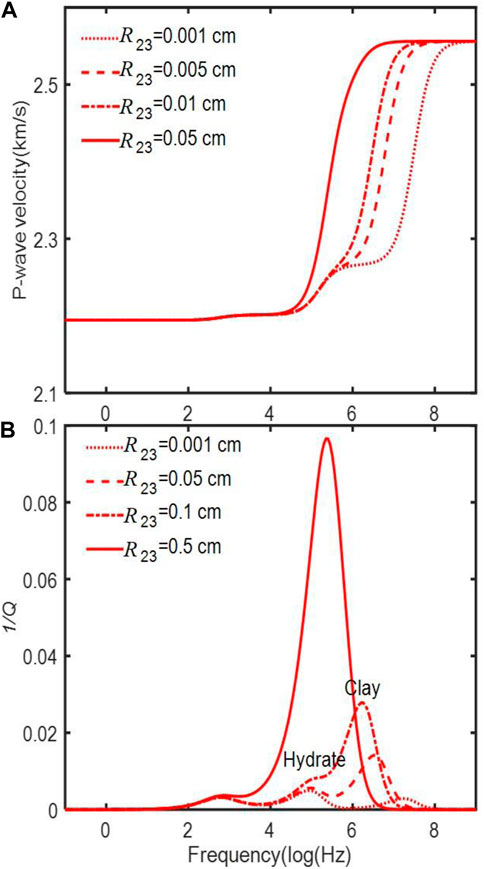
FIGURE 7. Effect of the clay inclusion radius on the P-wave velocity dispersion (A) and attenuation (B). The radius of the hydrate inclusion is
Figures 8A, B show the P-wave velocity and dissipation factor as a function of frequency for different hydrate inclusion radii, respectively, where we can see differences at middle frequencies.
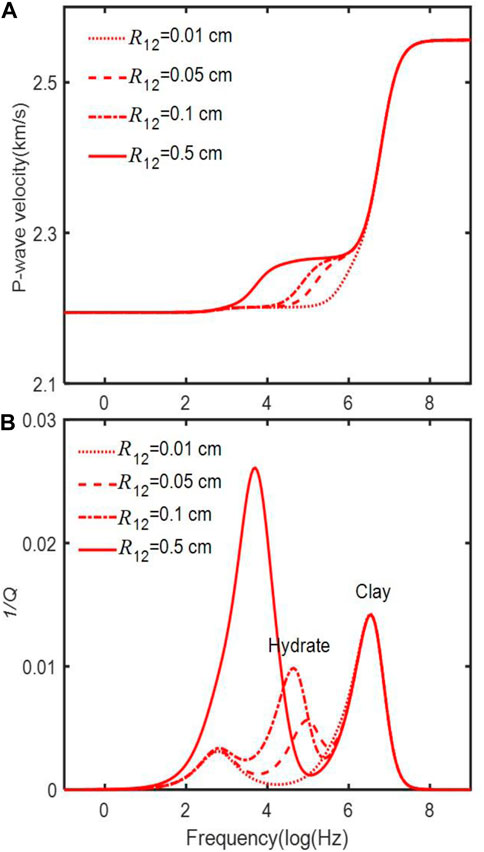
FIGURE 8. Effect of the hydrate inclusion radius on the P-wave velocity dispersion (A) and attenuation (B). The radius of the clay inclusion is
Figures 9A, B show the P-wave velocity and dissipation factor as a function of frequency for different porosities, respectively, where we can see that increasing porosity enhances the loss due to the local flow related to clay and the global flow.
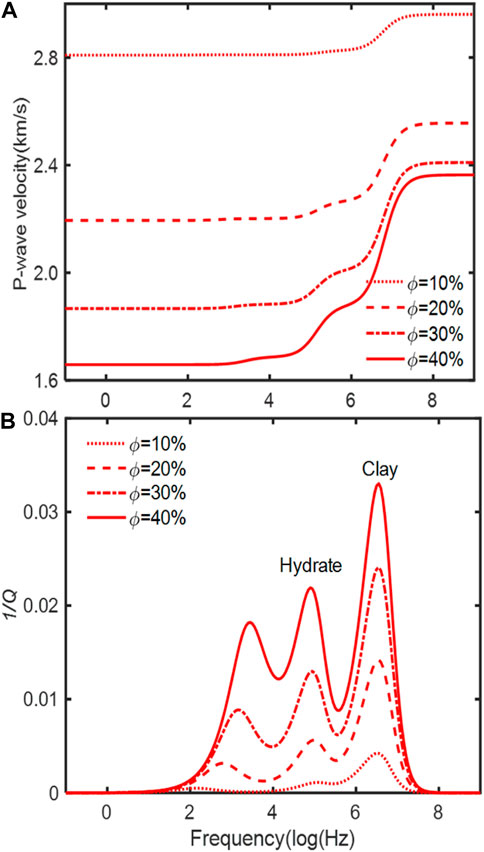
FIGURE 9. Effect of porosity on the P-wave velocity dispersion (A) and attenuation (B). The radius of the hydrate inclusion is
Finally, Figures 10A, B show the P-wave phase velocity and dissipation factor as a function of frequency for different hydrate volume ratios, respectively. With the increase of hydrate volume ratio, the P-wave anelasticity due to the hydrate inclusions increase, while those of the clay local flow and global flow decrease. The hydrate volume ratio has no apparent effect on the characteristic frequencies of the peaks.
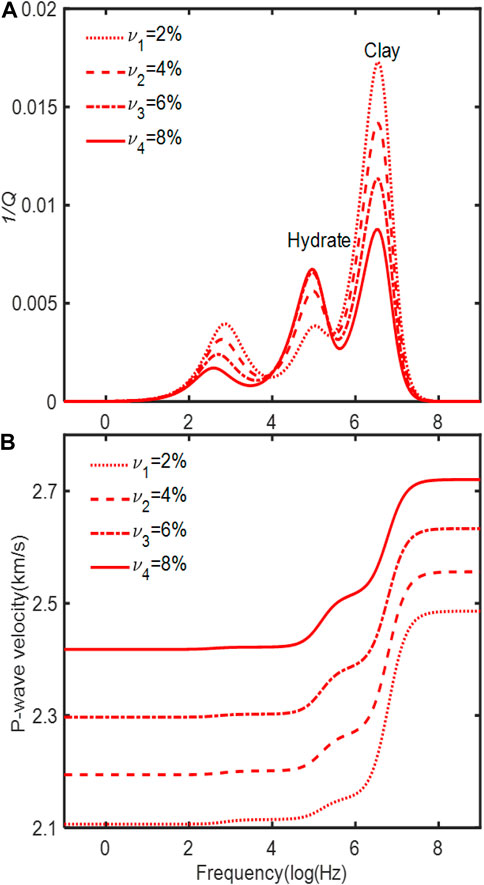
FIGURE 10. Effect of the hydrate volume ratios on the P-wave velocity dispersion (A) and attenuation (B). The radius of the hydrate inclusions is
Comparison with well-log data
The Offshore Drilling Program (ODP) drilled through a gas hydrate stabilization zone on the Cascadia edge off Oregon, providing information on the physical properties of hydrate-bearing sediments. The present model is applied to log data of wells 1247B and 1250F of the ODP204 cruise by Pan et al. (2019) and to data obtained by Zhan and Matsushima. (2018) in the Nankai Trough, in Japan.
ODP data
Figures 11A, B show the theoretical and measured (symbols) P-wave velocities as a function of porosity and hydrate saturation, where
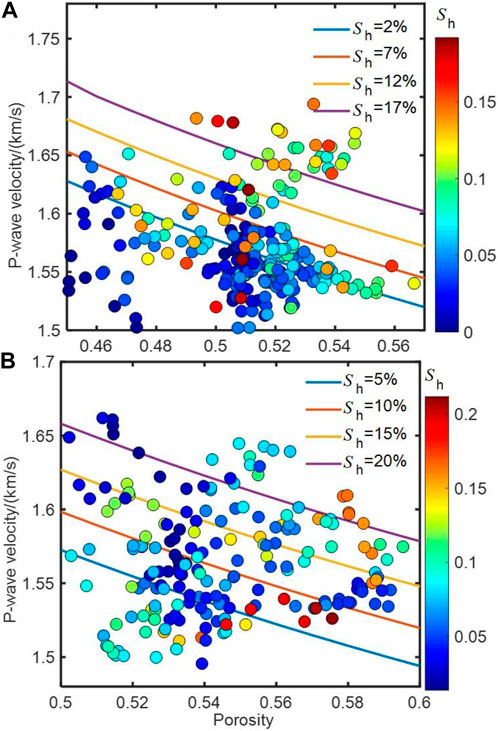
FIGURE 11. Measured P-wave velocity (symbols) as a function of porosity for different hydrate saturations in wells 1247B (A) and 1250F (B) compared to the model results (solid lines).
Figures 12A, B shows the P-wave velocity as a function of the hydrate saturation in the two wells. In well 1247B the porosity range is
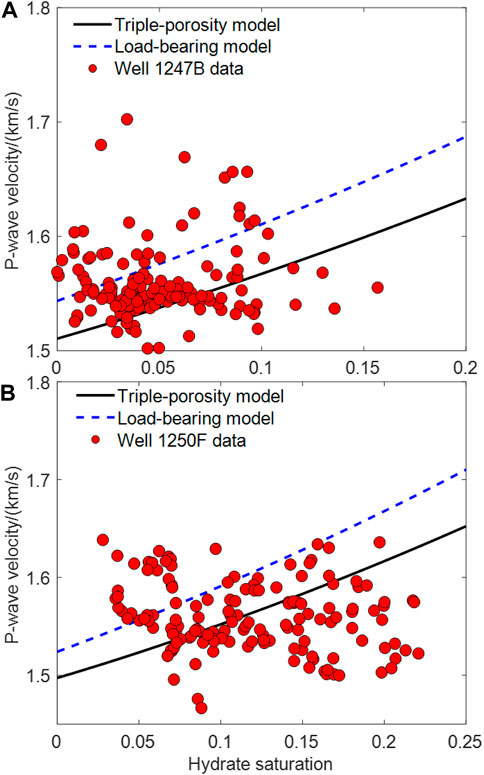
FIGURE 12. Measured P-wave velocity data (symbols) compared to the results of the triple-porosity and load-bearing models varying with hydrate saturation in Wells 1247B (A) and 1250F (B).
Nankai-trough data
We consider the sonic-log and VSP data obtained by Zhan and Matsushima. (2018) in the Nankai Trough, Japan. The frequency is 14 kHz, the strata rock porosity is approximately in the range of
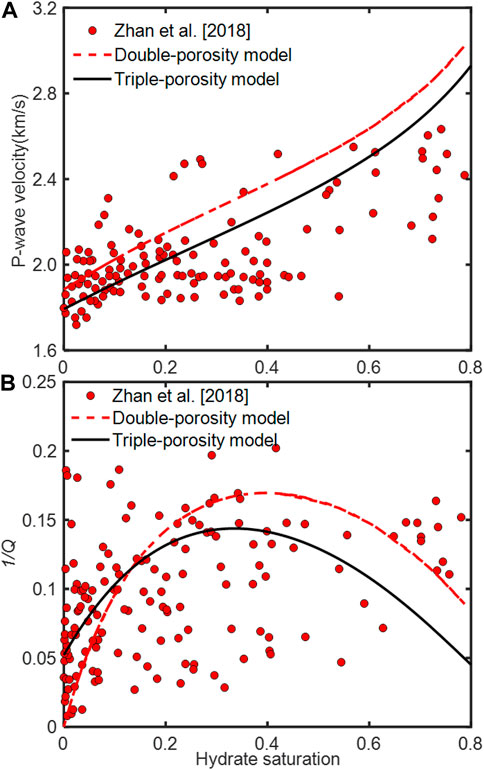
FIGURE 13. Measured P-wave velocity (A) and dissipation factor (B) (symbols) compared to the results of the double- and triple-porosity models.
Conclusion
The mechanisms of wave propagation in hydrate-bearing sediments are analyzed by using a triple-porosity model. Specifically, we obtain the P-wave velocity and attenuation as a function of frequency, inclusion radius of the clay and hydrate phases, porosity, and hydrate volume ratio. The model considers three attenuation mechanisms, namely, two due to local fluid flow between the rock frame and clay and hydrate inclusions (mesoscopic loss) and the classical global Biot loss. Local flow effects dominate at low (seismic) frequencies. Well-log data from ODP204 site and offshore Japan are compared to the model predictions, which show a good agreement.
Data availability statement
The original contributions presented in the study are included in the article/supplementary material, further inquiries can be directed to the corresponding author.
Author contributions
JB: modeling, writing and verification. FG: modeling and writing. JC: writing and verification. DG: writing and verification.
Funding
The authors were grateful to the support of the Jiangsu Innovation and Entrepreneurship Plan, research funds from SINOPEC Key Laboratory of Geophysics, Jiangsu Province Science Fund for Distinguished Young Scholars (BK20200021), and National Natural Science Foundation of China (41974123).
Conflict of interest
The authors declare that the research was conducted in the absence of any commercial or financial relationships that could be construed as a potential conflict of interest.
Publisher’s note
All claims expressed in this article are solely those of the authors and do not necessarily represent those of their affiliated organizations, or those of the publisher, the editors and the reviewers. Any product that may be evaluated in this article, or claim that may be made by its manufacturer, is not guaranteed or endorsed by the publisher.
References
Ba, J., Carcione, J. M., Cao, H., Du, Q. Z., Yuan, Z. Y., and Lu, M. H. (2012). Velocity dispersion and attenuation of P waves in partially-saturated rocks: Wave propagation equations in double-porosity medium. Chinese J. Geophys. 55, 219–231. doi:10.6038/j.issn.0001-5733.2012.01.021
Ba, J., Carcione, J. M., and Nie, J. X. (2011). Biot-Rayleigh theory of wave propagation in double-porosity media. J. Geophys. Res. 116, B06202. doi:10.1029/2010jb008185
Ba, J., Zhao, J., Carcione, J. M., and Huang, X. X. (2016). Compressional wave dispersion due to rock matrix stiffening by clay squirt flow. Geophys. Res. Lett. 43, 6186–6195. doi:10.1002/2016gl069312
Best, A. I., Priest, J. A., Clayton, C. R. I., and Rees, E. V. L. (2013). The effect of methane hydrate morphology and water saturation on seismic wave attenuation in sand under shallow sub-seafloor conditions. Earth Planet. Sci. Lett. 368, 78–87. doi:10.1016/j.epsl.2013.02.033
Biot, M. (1962). Generalized theory of acoustic propagation in porous dissipative media. J. Acoust. Soc. Am. 34, 1254–1264. doi:10.1121/1.1918315
Carcione, J. M., and Gei, D. (2004). Gas-hydrate concentration estimated from P- and S-wave velocities at the Mallik 2L-38 research well, Mackenzie Delta, Canada. J. Appl. Geophy. 56, 73–78. doi:10.1016/j.jappgeo.2004.04.001
Carcione, J. M., Gei, D., Rossi, G., and Madrussani, G. (2005). Estimation of gas-hydrate concentration and free-gas saturation at the Norwegian-Svalbard continental margin. Geophys. Prospect. 53, 803–810. doi:10.1111/j.1365-2478.2005.00502.x
Carcione, J. M. (2022). Wave fields in real media. Theory and numerical simulation of wave propagation in anisotropic, anelastic, porous and electromagnetic media. 4th Edn. Amsterdam: Elsevier.
Chand, S., and Minshull, T. A. (2004). The effect of hydrate content on seismic attenuation: A case study for mallik 2L-38 well data, mackenzie delta, Canada. Geophys. Res. Lett. 31, L14609. doi:10.1029/2004gl020292
Dai, J., Xu, H., Snyder, F., and Dutta, N. (2004). Detection and estimation of gas hydrates using rock physics and seismic inversion: Examples from the northern deepwater Gulf of Mexico. Lead. Edge 23, 60–66. doi:10.1190/1.1645456
Dvorkin, J., Prasad, M., Sakai, A., and Lavoie, D. (1999). Elasticity of marine sediments: Rock physics modeling. Geophys. Res. Lett. 26, 1781–1784. doi:10.1029/1999gl900332
Ecker, C., Dvorkin, J., and Nur, A. M. (2000). Estimating the amount of gas hydrate and free gas from marine seismic data. Geophysics 65, 565–573. doi:10.1190/1.1444752
Ecker, C., Dvorkin, J., and Nur, A. M. (1998). Sediments with gas hydrates: Internal structure from seismic AVO. Geophysics 63, 1659–1669. doi:10.1190/1.1444462
Gei, D., and Carcione, J. M. (2003). Acoustic properties of sediments saturated with gas hydrate, free gas and water. Geophys. Prospect. 51, 141–158. doi:10.1046/j.1365-2478.2003.00359.x
Gei, D., Carcione, J. M., and Picotti, S. (2022). “Seismic rock physics of gas-hydrate bearing sediments,” in World atlas of submarine gas hydrates in continental margins. Editor J. Mienert (Springer), 55–63.
Guerin, G., and Goldberg, D. (2005). Modeling of acoustic wave dissipation in gas hydrate-bearing sediments. Geochem. Geophys. Geosyst. 6, Q07010. doi:10.1029/2005gc000918
Helgerud, M. B., Dvorkin, J., Nur, A., Sakai, A., and Collett, T. (1999). Elastic-wave velocity in marine sediments with gas hydrates: Effective medium modeling. Geophys. Res. Lett. 26, 2021–2024. doi:10.1029/1999gl900421
Hill, R. (1952). The elastic behaviour of a crystalline aggregate. Proc. Phys. Soc. A 65, 349–354. doi:10.1088/0370-1298/65/5/307
Hu, G. W., Ye, Y. G., Zhang, J., Liu, C. L., Diao, S. B., and Wang, J. S. (2010). Acoustic properties of gas hydrate–bearing consolidated sediments and experimental testing of elastic velocity models. J. Geophys. Res. 115, B02102. doi:10.1029/2008JB006160
Lee, M., Hutchinson, D., Collett, I., and Dillon, W. P. (1996). Seismic velocities for hydrate-bearing sediments using weighted equation. J. Geophys Res. 101, 20347–20358. doi:10.1029/96jb01886
Lee, M. W., and Collett, T. S. (2009). Gas hydrate saturations estimated from fractured reservoir at Site NGHP-01-10, Krishna-Godavari Basin, India. J. Geophys. Res. 114, B07102. doi:10.1029/2008JB006237
Leurer, K. C., and Brown, C. (2008). Acoustics of marine sediment under compaction: Binary grain-size model and viscoelastic extension of Biot’s theory. J. Acoust. Soc. Am. 123, 1941–1951. doi:10.1121/1.2871839
Li, C., Feng, K., and Liu, X. (2015). Retracted article: Analysis of P-wave attenuation in hydrate-bearing sediments in the shenhu area, south China sea. Mar. Geophys. Res. 36, 357. doi:10.1007/s11001-014-9241-9
Liu, J., Liu, J, P., Cheng, F., Wang, J., and Liu, X, X. (2017). Rock-physics models of hydrate-bearing sediments in permafrost, Qilian Mountains, China. Appl. Geophys. 4 (1), 31–39. doi:10.1007/s11770-017-0608-y
Liu, L., Zhang, X., and Wang, X. (2021). Wave propagation characteristics in gas hydrate-bearing sediments and estimation of hydrate saturation. Energies 14 (4), 804. doi:10.3390/en14040804
Marín-Moreno, H., Sahoo, S. K., and Best, A. I. (2017). Theoretical modeling insights into elastic wave attenuation mechanisms in marine sediments with pore-filling methane hydrate. J. Geophys. Res. Solid Earth 122, 1835–1847. doi:10.1002/2016jb013577
Matsushima, J. (2006). Seismic wave attenuation in methane hydrate-bearing sediments: Vertical seismic profiling data from the Nankai Trough exploratory well, offshore tokai, central Japan. J. Geophys. Res. 111, B10101. doi:10.1029/2005jb004031
Pan, H. J., Li, H. B., Grana, D., Zhang, Y., Liu, T., Geng, C., et al. (2019). Quantitative characterization of gas hydrate bearing sediment using elastic-electrical rock physics models. Mar. Petroleum Geol. 105, 273–283. doi:10.1016/j.marpetgeo.2019.04.034
Priest, J. A., Rees, E. V. L., and Clayton, C. R. I. (2009). Influence of gas hydrate morphology on the seismic velocities of sands. J. Geophys. Res. 114, B11205. doi:10.1029/2009jb006284
Sahoo, S. K., North, L. J., Marín-Moreno, H., Minshull, T. A., and Best, A. I. (2019). Laboratory observations of frequency-dependent ultrasonic P-wave velocity and attenuation during methane hydrate formation in Berea sandstone. Geophys. J. Int. 219, 713–723. doi:10.1093/gji/ggz311
Schicks, J. M., Naumann, R., Erzinger, J., Hester, K. C., Koh, C. A., and Dendy Sloan, E. (2006). Phase transitions in mixed gas hydrates: Experimental observations versus calculated data. J. Phys. Chem. B 110 (23), 11468–11474. doi:10.1021/jp0612580
Stoll, D., and Bryan, G. (2009). Wave attenuation in saturated sediments. J. Acoust. Soc. Am. 47, 1440–1447. doi:10.1121/1.1912054
Waite, W. F., Santamarina, J. C., Cortes, D. D., Dugan, B., Espinoza, D. N., Germaine, J., et al. (2009). Physical properties of hydrate-bearing sediments. Rev. Geophys. 47, RG4003. doi:10.1029/2008rg000279
Wang, W., Ba, J., Carcione, J. M., Liu, X., and Zhang, L. (2021). Wave properties of gas-hydrate bearing sediments based on poroelasticity. Front. Earth Sci. (Lausanne) 9, 640424. doi:10.3389/feart.2021.640424
Wood, A. W., Holbrook, W., and Hoskins, H. (2000). In situ measurements of P-wave attenuation in the methane hydrate-and agas-bearing sediments of the Blake Ridge. Proc. Odp. Sci. Results 164, 265–272. doi:10.2973/odp.proc.sr.164.246.2000
Wyllie, M. J., Gregory, A. R., and Gardner, G. H. F. (1958). An experimental investigation of factors affecting elastic wave velocities in porous media. Geophysics 23, 459–493. doi:10.1190/1.1438493
Zhan, L., Liu, B., Zhang, Y., and Lu, H. (2022). Rock physics modeling of acoustic properties in gas hydrate-bearing sediment. J. Mar. Sci. Eng. 10, 1076. doi:10.3390/jmse10081076
Zhan, L. S., and Matsushima, J. (2018). Frequency-dependentP-wave attenuation in hydrate-bearing sediments: A rock physics study at Nankai Trough, Japan. Geophys. J. Int. 214, 1961–1985. doi:10.1093/gji/ggy229
Zhang, R. W., Li, H. Q., and Wen, P. F. (2016). The velocity dispersion and attenuation of marine hydrate-bearing sediments. Chin. J. Geophys. 59 (9), 3417–3427. doi:10.6038/jcg20160924
Zhang, L., Ba, J., and Yin, W. (2017). Seismic wave propagation equations of conglomerate reservoirs: A triple-porosity structure model. Chin. J. Geophys. 60 (3), 1073–1087. doi:10.6038/cjg20170320
Zhang, L., Ba, J., and Carcione, J. M (2021). Wave propagation in infinituple-porosity media. Geophysical Research: Solid Earth 126, e2020JB021266. doi:10.1029/2020JB021266
Appendix A: The explicit expressions of the elastic parameters are (Zhang et al., 2017)
where
and
where
The tortuosities of the three phases are
Then, the density parameters are
where
Appendix B
A plane-wave analysis is performed by substituting a time harmonic kernel
where
where
Keywords: triple-porosity theory, attenuation, rock physics model, hydrate, dispersion
Citation: Ba J, Guo F, Carcione JM and Gei D (2023) P-wave anelasticity in hydrate-bearing sediments based on a triple-porosity model. Front. Earth Sci. 10:1097550. doi: 10.3389/feart.2022.1097550
Received: 14 November 2022; Accepted: 01 December 2022;
Published: 04 January 2023.
Edited by:
Lidong Dai, Institute of geochemistry (CAS), ChinaReviewed by:
Zhen Li, Chengdu University of Technology, ChinaBoye Fu, Beijing University of Technology, China
Copyright © 2023 Ba, Guo, Carcione and Gei. This is an open-access article distributed under the terms of the Creative Commons Attribution License (CC BY). The use, distribution or reproduction in other forums is permitted, provided the original author(s) and the copyright owner(s) are credited and that the original publication in this journal is cited, in accordance with accepted academic practice. No use, distribution or reproduction is permitted which does not comply with these terms.
*Correspondence: Jing Ba, amJhQGhodS5lZHUuY24=