 Xinmiao Fu
 Jinjie Song
 Yihong Duan
- 1State Key Laboratory of Severe Weather, Chinese Academy of Meteorological Sciences, Beijing, China
- 2Nanjing Joint Institute for Atmospheric Sciences, Chinese Academy of Meteorological Sciences, Nanjing, China
This study investigates the relationship between El Niño-Southern Oscillation (ENSO) and overland accumulated cyclone energy (ACE) of tropical cyclones (TCs) over the western North Pacific (WNP). We find that there is only a weak correlation between ENSO and overland ACE during 1979–2019, compared to the significant relationship between ENSO and basinwide ACE over the WNP as reported in previous publications. Overland ACE is generally smaller in El Niño and La Niña years than that in neutral years, which mainly results from lower landfall frequency and shorter duration after landfall. Relative to neutral years, overland ACE is lower over almost the entire China mainland in both El Niño and La Niña years, which can be related to the changes in the formation and movement of landfalling TCs. During El Niño and La Niña years, fewer landfalling TCs form over the western WNP, mainly resulting from reduced 850-hPa humidity, which leads to a less chance of TCs making landfall over China mainland. In addition, the eastward (westward) shift of the western Pacific subtropical high in El Niño (La Niña) years steers more TCs to make landfall over the southern (northern) China.
1 Introduction
Tropical cyclone (TC) is a strong atmospheric vortex with a warm-core and low-pressure structure generating over the tropical or subtropical ocean. TCs can induce severe disasters such as heavy precipitation, strong wind, rainstorm, storm surge, mudslide and landslide, leading to huge losses of human lives and property. Zhang et al. (2009) found that an annual average of 7 TCs made landfall over China mainland and Hainan Island, causing a direct economic loss of 28.7 billion yuan (RMB in 2006) and 472 deaths.
There has been growing interest on the changes in TC activity over various ocean basins influenced by the El Niño-Southern Oscillation (ENSO) phenomenon, which is a coupled atmosphere-ocean mode of climate interannual variability in the tropical Pacific (Gary 1984; Chan 1985; Chu P S 2004; Camargo et al., 2010; Patricola et al., 2018). Many studies have investigated the relationship between ENSO and various TC metrics, such as genesis location, frequency, intensity, etc. First, ENSO plays an important role in the interannual change of TCs genesis location over the western North Pacific (WNP). During strong El Niño (La Niña) years, the average genesis location of WNP TCs tends to be southeastward (northwestward) (Chan, 2000; Chia and Ropelewski, 2002; Wang and Chan, 2002). Second, Chan (2000) suggested that TC frequency over the South China Sea (SCS) tended to be below (above) normal in El Niño (La Niña) years. Wang and Chan (2002) noted that the influence of ENSO on WNP TC frequency was more significant during strong ENSO events than during moderate-to-weak ENSO events. The insignificant influence of moderate-to-weak ENSO was related to the offset between the southeast-northwest dipolar migration in the TC genesis position. Third, ENSO has a significant regulatory effect on WNP TC intensity. Wang and Chan (2002) pointed out that during strong El Niño years, as more TCs formed over the southeastern quadrant of the WNP, they were more likely to develop for a longer time over water before making landfall and subsequently to reach a higher intensity.
Moreover, ENSO can significantly modulate the accumulated cyclone energy (ACE) of WNP TCs. ACE is usually used to represent the overall TC activity, which is proportional to the kinetic energy produced by TCs (Bell et al., 2000). The WNP ACE index is significantly positively correlated with various ENSO indices, because TCs in El Niño years are averagely stronger and have longer lifetimes than those in La Niña years (Camargo and Sobel,2005; Chan,2007; Ryan,2011). According to Camargo and Sobel (2005), WNP ACE exhibited an obvious east-west spatial pattern between El Niño and La Niña years. ACE values during El Niño years increased over most of the WNP, reaching a maximum at 20°N, 140°E. During La Niña years, ACE values were higher over the east of the Philippines and the SCS. This feature related to the aforementioned ENSO-induced shift in WNP TC genesis position. As Chan (2007) suggested, ENSO could influence both the formation and development of TCs by modulating the local dynamic and thermodynamic conditions. During El Niño years, greater (lower) relative vorticity in lower (upper) troposphere, smaller vertical wind shear (VWS) and larger 1,000-500-hPa moist static energy were all favorable for TC formation over the eastern part of the WNP. Once formed in this region, TCs tended to have longer lifetimes over water and were more likely to develop to a higher intensity, leading to a higher ACE.
Besides, there are also studies on the relationship between WNP ACE and other ocean/atmosphere climate modes. For instance, Ryan (2011) reported a tight relationship between WNP ACE and the Pacific Decadal Oscillation. Song et al. (2022) found that WNP ACE was significantly negatively correlated with the simultaneous Pacific-North American pattern (PNA) index, which could modulate TC frequency, duration and intensity. Note that the aforementioned studies all focused on the change in the basinwide ACE over the WNP, which was primarily obtained based on TC samples over water. By contrast, few studies have investigated the ACE changes over land. It is also unknown on the relationship between ENSO and overland ACE over the WNP.
The remainder of this study is organized as follows. Section 2 introduces the data and the methodology used. Section 3 and Section 4 describe the temporal and spatial relationship between ENSO and overland ACE, respectively. Section 5 analyzes the changes in large-scale environmental conditions influenced by ENSO. The conclusion is given in section 6.
2 Data and methodology
Landfalling TC data are obtained from the China Meteorological Administration’s Shanghai Typhoon Institute (CMA-STI), which compiles TC data based on a relatively large number of station observations over China mainland. The CMA-STI dataset contains TC position (latitude and longitude), maximum sustained 2-min wind speed and minimum sea level pressure for every 6 hours.
Given the poor quality of TC data in the pre-satellite era, the period of 1979–2019 is considered here. TC season is defined from May to December (MJJASOND), which is the same as Lee et al. (2007) and Yang et al. (2012). Monthly atmospheric variables, including 850-hPa relative humidity, 850-200-hPa VWS, 850-hPa relative vorticity and 200-hPa divergence are archived from the National Centers for Environmental Prediction (NCEP)–National Center for Atmospheric Research (NCAR) reanalysis (Kalnay et al., 1996). Monthly ENSO indices (Niño 1+2, Niño-3, Niño-3.4 and Niño-4 sea surface temperature anomalies) are obtained from the United States Climate Prediction Center (CPC).
Consistent with Camargo and Sobel (2005) and Goddard and Dilley (2005), El Niño and La Niña years are defined based on the average Niño-3.4 index during MJJASOND (Figure 1). Approximately 25% of the total 41-year with the largest (smallest) values of Niño-3.4 index are defined as El Niño (La Niña) years, while the remaining years are defined as neutral years. Finally, we identify ten El Niño years (1982, 1987, 1991, 1994, 1997, 2002, 2004, 2006, 2009 and 2015) and ten La Niña years (1984, 1985, 1988, 1995, 1998, 1999, 2000, 2007, 2010 and 2011) (Figure 1).
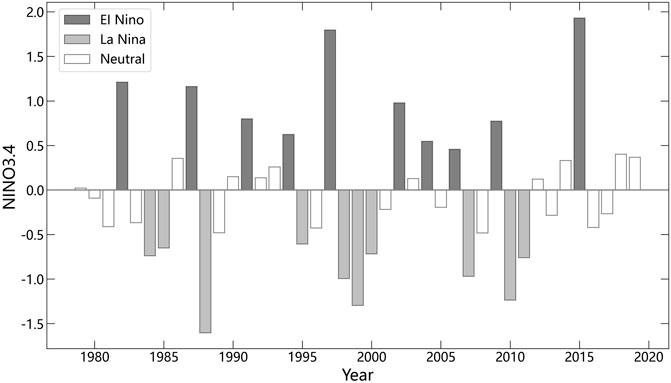
FIGURE 1. Annual variation of Niño-3.4 sea surface temperature anomaly (unit: °C) during May-December in the period 1979-2019.
The global land 1-km base elevation is used to identify overland TC records, by checking whether the TC center is over land or over water. Here, we focused on TC records over China mainland, accounting for about 90% of all over-land WNP TC samples. Consistent with Bell et al. (2000), ACE is calculated by adding up the sum of the squares of the 6-hourly maximum sustained 2-min wind speeds in the CMA-STI dataset, which can be shown as:
where m is the total number of landfalling TCs, n is the overland duration for a certain TC and u is the 6-hourly maximum sustained wind overland. Since the calculation of ACE does not include tropical depressions in Bell et al. (2000), we only use TC records with an intensity of at least 17.2 m/s.
3 Temporal relationship between ENSO and overland ACE
3.1 ENSO and ACE
Figure 2 shows the annual series of ACE over China mainland in the period 1979-2019. Among all years, 1998 (La Niña) is the year with the lowest ACE, while 2018 (neutral) is the year with the highest ACE. In general, higher ACE values occur in neutral years, while ACE values are relatively lower not only in El Niño years but also in La Niña years. ACE values in 10 out of 21 neutral years are above the 75th percentile, while only ACE values in three neutral years are below the 25th percentile. In comparison, only one La Niña year and three El Niño years exhibit ACE values above the climatological (1979–2019) median.
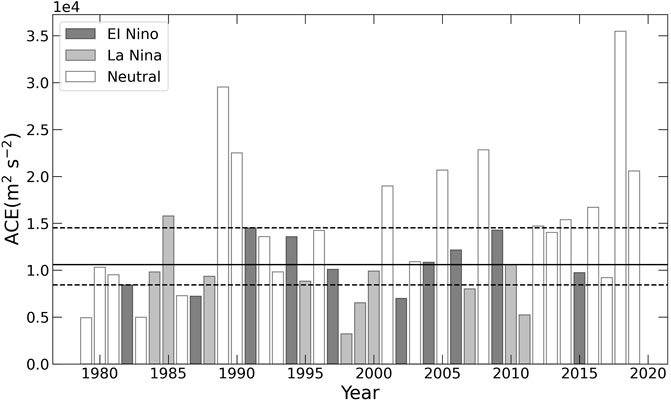
FIGURE 2. Annual variation of ACE over China mainland during May-December in the period 1979-2019. The horizontal dashed lines show the 25th and 75th percentiles, while the horizontal solid line denotes the median.
Figure 3 depicts several features of the ACE distribution including the mean, median, 75th and 25th percentiles, and individual extreme values. Interestingly, the distribution of ACE in El Niño years is quite similar to that in La Niña years. It means that overland ACE does not show significant discrepancy between El Niño and La Niña years, which is different from the obvious modulation of ENSO on WNP ACE as reported by previous studies (e.g., Camargo and Sobel, 2005). The entire distribution of ACE in neutral years is integrally shifted to larger values, which is consistent with the phenomenon shown in Figure 2. It is worth noting that ACE distributions shift to lower values in both El Niño and La Niña years than those in neutral and all years. Based on a Student’s t-test, the ACE values in neutral years are significantly different from those in both El Niño (p=0.02) years and La Niña (p<0.01) years. This feature is distinct from the result in Camargo and Sobel (2005), which found that the distribution of WNP ACE in El Niño and La Niña years were shifted to larger and smaller values, respectively, while their difference was statistically significant.
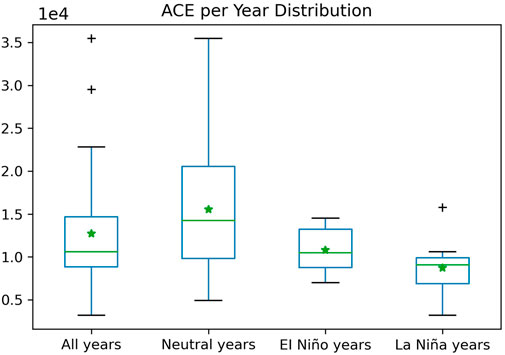
FIGURE 3. Boxplot of ACE per year in all years, neutral years, El Niño years and La Niña years. The boxes show the 25th and 75th percentiles, the lines in the boxes mark the median, the asterisks (*) mark the mean, and the crosses mark the extreme outliers.
Furthermore, Table 1 shows the correlations of overland ACE during MJJASOND with simultaneous ENSO indices in the period 1979-2019. Consistent with the above analysis, there is no obvious correlation between overland ACE and all ENSO indices. Specifically, overland ACE is weakly correlated with the most frequently used Niño-3.4 index (r=0.06). By contrast, as shown in Camargo and Sobel (2005) and Chen (2007), the basinwide ACE over the WNP was strongly correlated with these ENSO indices (Niño-1+2, Niño-3, Niño-3.4 and Niño-4). This conflict implies that the influence of ENSO on ACE over land is somewhat different from that on ACE over the entire WNP.

TABLE 1. Correlations of ACE during May-December with simultaneous Niño-1+2, Niño-3, Niño-3.4 and Niño-4 sea surface temperature anomalies in the period 1979-2019. Asterisks represent correlation coefficient significant at the 95% level based on Student’s t-test.
3.2 ENSO and ACE components
Table 2 depicts the correlations of overland ACE with landfall frequency, mean duration and mean intensity in the period 1979–2019. We find that the change in overland ACE exhibits a high correlation with the changes in mean duration (r=0.92) and landfall frequency (r=0.67). By contrast, the correlation coefficient between mean intensity and overland ACE is only 0.02, implying a minor impact of the intensity on overland ACE. By comparison, Camargo and Sobel (2005) found that all these three factors were significantly correlated with ACE over the entire WNP. Wang and Song (2010) reported that ENSO events from July to September had an obvious effect on the activity of TCs hitting China. The frequency of landfalling TCs during El Niño (La Niña) years was less (above) than normal, while the mean intensity of TCs was stronger (weaker). Zhang et al. (2018) found that during ENSO neutral years, the track density TCs landfalling over China was the highest, while the frequency of landfalling TCs was above average.

TABLE 2. Correlations of ACE during May-December with its three components (landfall frequency, mean duration and mean intensity) in 1979–2019. Asterisks represent correlation coefficient significant at the 95% level based on Student’s t-test.
Moreover, the distributions of landfall frequency and mean duration for all years and different ENSO years are examined in Figures 4A,B. Similar to the distribution of overland ACE, the frequency of landfalling TCs and the mean duration over land in neutral years are both generally greater than those in El Niño and La Niña years. It confirms that the higher overland ACE in neutral years results from the greater number of landfalling TCs and the longer duration over land. However, the medians of mean intensity in different ENSO years are comparable, with no significant difference (Figure 4C). As described in Table 2, there is only a minor correlation between overland ACE and mean intensity. The above results further imply that the annual change in overland ACE is jointly influenced by the changes in landfall frequency and mean overland duration, while mean intensity has only a minor impact.
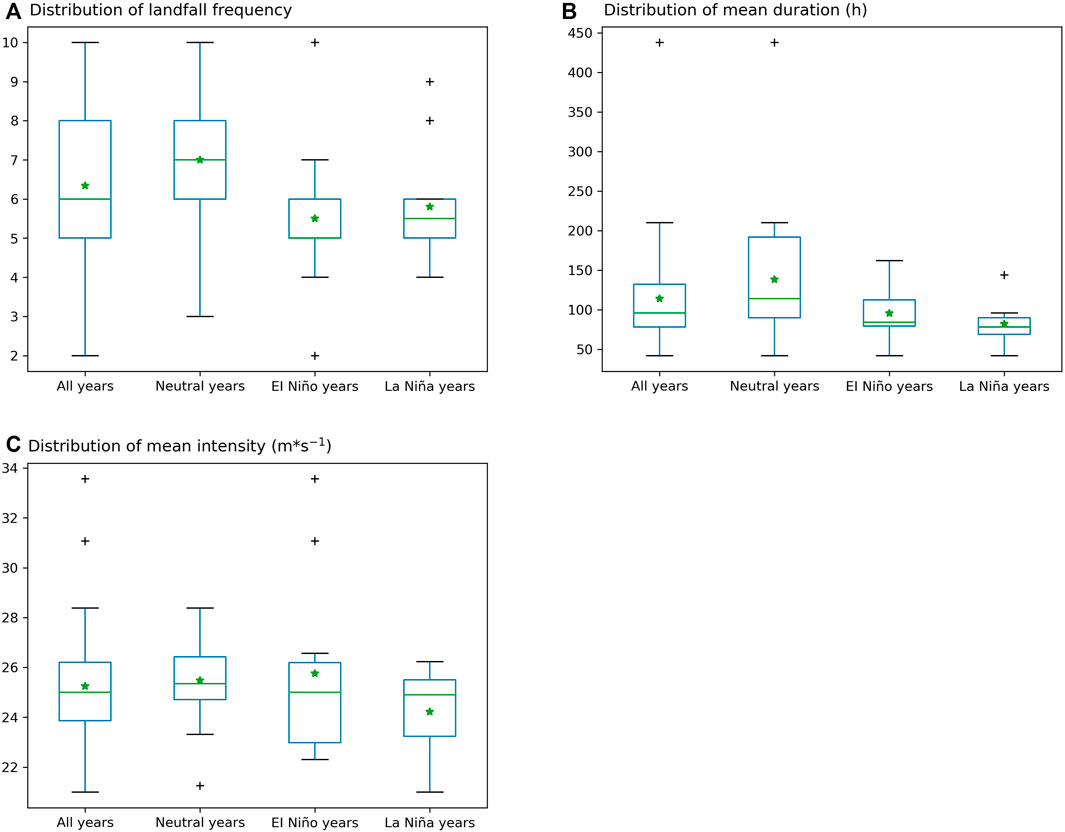
FIGURE 4. Boxplots of (A) landfall frequency (B) mean duration (C) mean intensity in all years, neutral years, El Niño years and La Niña years. The boxes show the 25th and 75th percentiles, the lines in the boxes mark the median, and the asterisks (*) mark the mean.
4 Spatial relationship between ENSO and overland ACE
4.1 ENSO and ACE
To show the spatial distribution, overland ACE is counted over individual 5°×5° grids. Compared to neutral years, gridded overland ACE values in El Niño years are relatively lower over almost the entire coastal regions of East Asia and Southeast Asia, except some small regions of Southeast and Northeast China (Figure 5A). The maximum ACE reductions are observed over Guangxi and Guangdong, with a magnitude of more than 500 m2s-2. Similarly, gridded overland ACE values in La Niña years is generally lower than those in neutral years, except some regions of North China. The maximum ACE decrease is shown in Taiwan, with a magnitude of more than 1,500 m2s-2. Besides, Figure 5C depicts the spatial difference in ACE between El Niño and La Niña years, with an obvious north-south dipolar distribution. Generally, overland ACE values are greater south of 30°N and smaller north of 30°N in El Niño years than in La Niña years. North of 30°N, the total overland ACE value in La Niña years is 6,443 m2s-2 higher than that in El Niño years, with a relative increase of 44%. In comparison, south of 30°N, the total overland ACE value in La Niña years is 26,115 m2s-2 lower than that in El Niño years, with a relative decrease of 36%. Moreover, as depicted in Figure 5D, the overland ACE values in neutral years is higher than that in non-neutral (El Niño and La Niña) years over the entire coastal regions of East Asia and Southeast Asia.
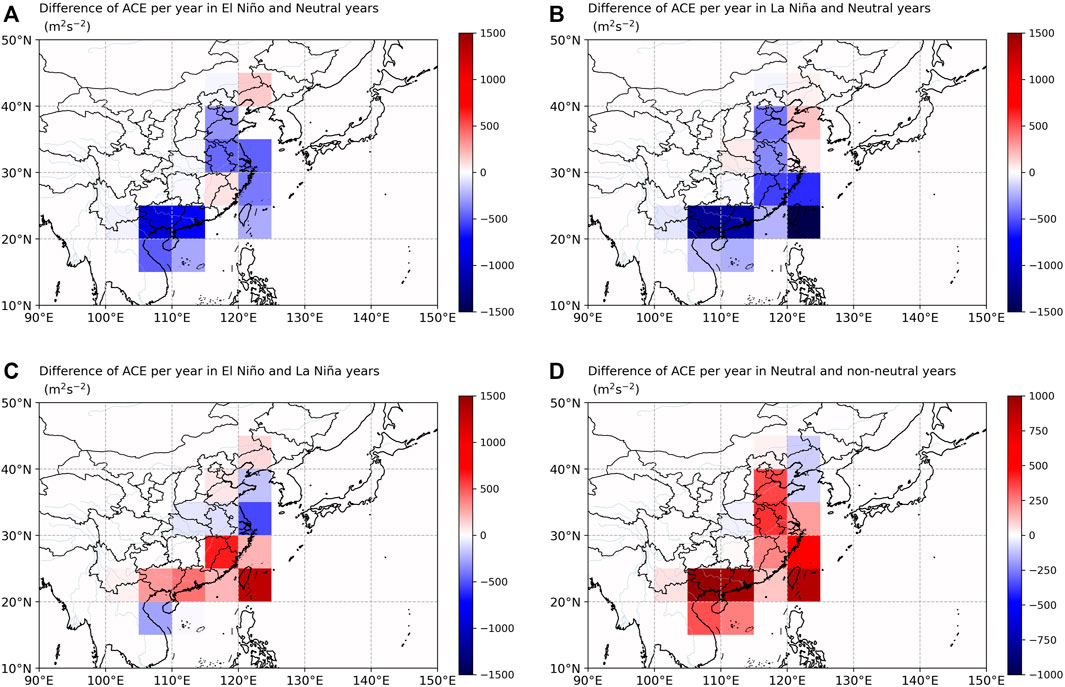
FIGURE 5. Spatial differences in overland ACE for (A) El Niño years versus neutral years, (B) La Niña years versus neutral years, (C) El Niño years versus La Niña years and (D) Neutral years versus non-neutral years.
4.2 ENSO and TC track density
Figure 6 represents the spatial distribution of overland TC track density, which exhibits a similar pattern to the overland ACE as shown in Figure 5. During El Niño and La Niña years, overland TC track density is generally smaller in comparison to neutral years. The pattern correlation coefficients between ACE and track density are all above 0.82 (significant at the 95% level) during different ENSO years. This confirms the aforementioned strong correlation of mean duration with ACE. As shown in Figure 6C, compared to La Niña years, overland track density is generally larger south of 30°N and lower north of 30°N in El Niño years, which show a similar pattern to Figure 5C. This means that overland TC activity is enhanced (suppressed) south (north) of 30°N in El Niño years than in La Niña years. Similarly, Figure 6D also shows a similar pattern to Figure 5D. Compared to El Niño and La Niña years, the overland track density in neutral years is the highest, which is consistent with Zhang et al. (2018).
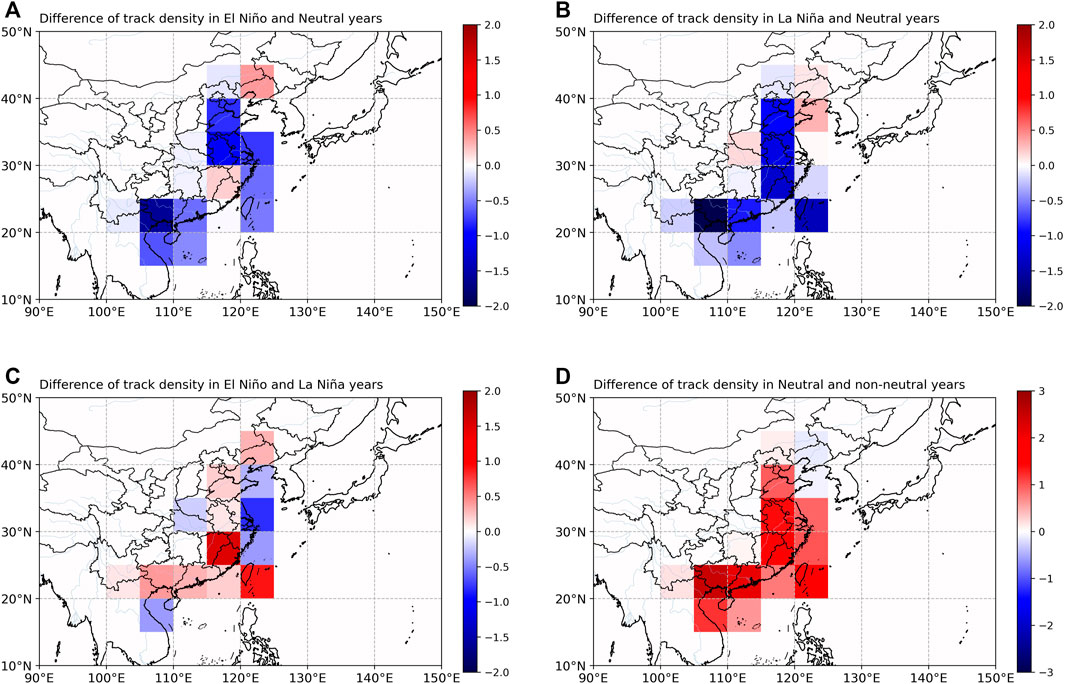
FIGURE 6. Spatial differences in overland track density for (A) El Niño years versus neutral years, (B) La Niña years versus neutral years, (C) El Niño years versus La Niña years and (D) Neutral years versus non-neutral years.
Figure 7 further shows the spatial distribution of the entire track density for all landfalling TCs over the WNP. Here, the entire track density is obtained based on all TC 6-h records from genesis to dissipation, which includes TC samples not only over land but also over water. TCs landfalling over China mainland form more frequently over the western WNP (Figure 7B). Compared with neutral years, the entire track density of landfalling WNP TCs is lower (greater) over the western (eastern) WNP in El Niño years (Figure 7C). TCs are more likely to generate over the eastern WNP and subsequently to exhibit a recurving trajectory over the open sea. This leads to fewer TCs hitting China in El Niño years than in neutral years. By comparison, the track density in La Niña years is generally lower over the entire WNP relative to neutral years, except over small regions west of Taiwan and northwest of the Philippines (Figure 7D). Due to the general suppression of TC activity over the WNP, fewer TCs strike China in La Niña years than in neutral years. The above features of anomalous TC track densities in El Niño and La Niña years are consistent with Lin et al. (2020). Additionally, relative to La Niña years, WNP TCs tend to more (less) frequently make landfall at China south (north) of 30°N in El Niño years (Figure 7E). As shown in Camargo et al. (2007), there were less TCs hitting the northern China (Cluster A) and more TCs hitting the southern China (Cluster B) in El Niño years than in La Niña years. The entire track density (both over land and over water) in neutral years is generally higher over almost the whole WNP relative to non-neutral years, especially in Taiwan (Figure 7F).
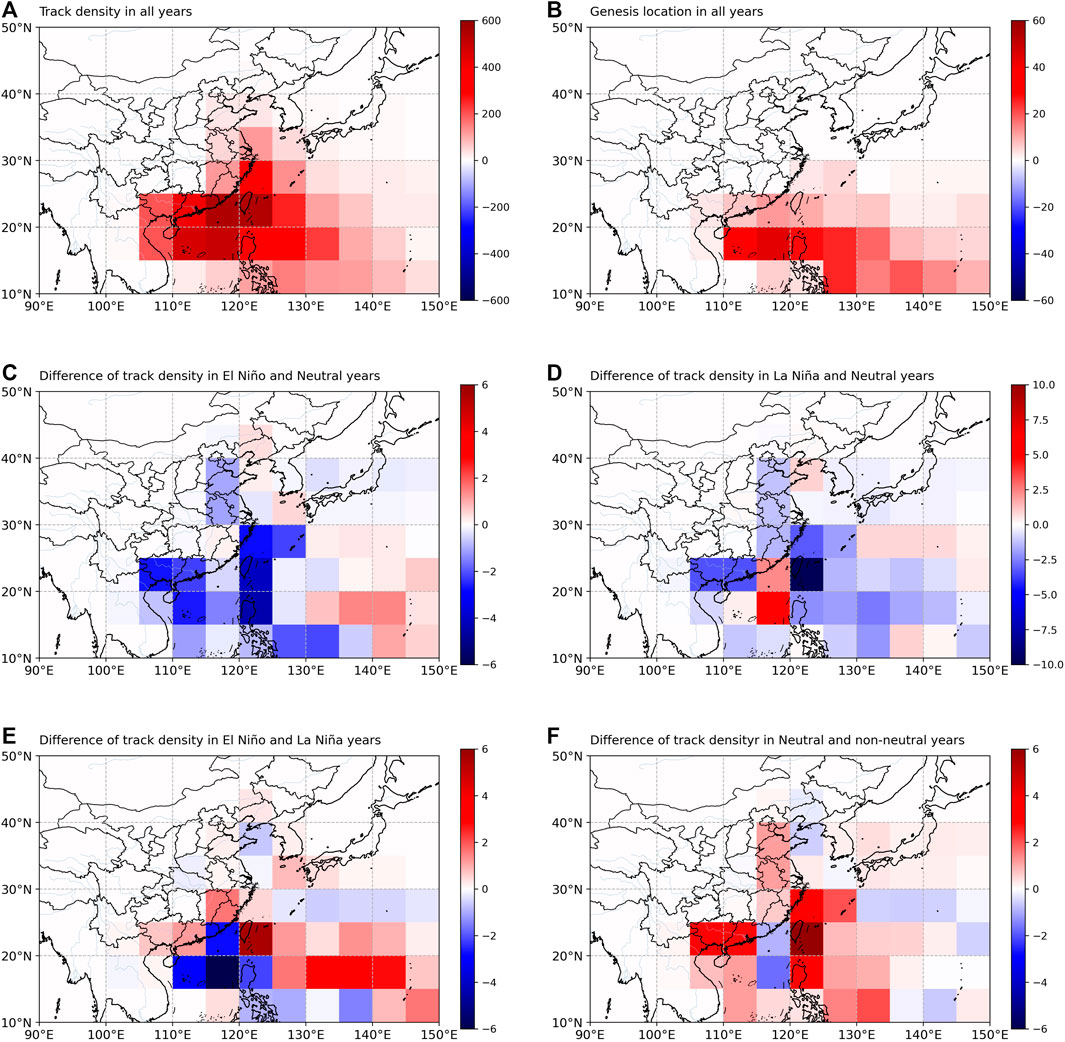
FIGURE 7. Spatial differences in overall track density of landfalling TCs for (A) all years, (C) El Niño years versus neutral years, (D) La Niña years versus neutral years, (E) El Niño years versus La Niña years and (F) Neutral years versus non-neutral years. And spatial differences in genesis location of landfalling TCs for all years (B).
5 Environmental conditions
Figures 8–10 show the differences in environmental conditions among different years. During El Niño years, enhanced TC activity over the eastern WNP (east of 130°E).
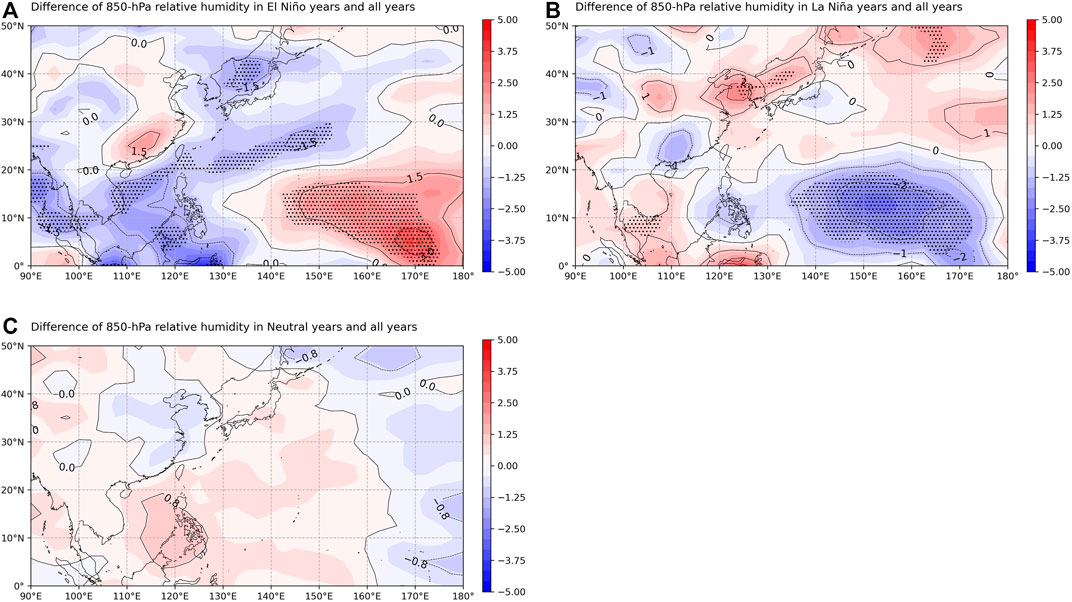
FIGURE 8. Difference of 850-hPa relative humidity during May to December in (A) El Niño (B) La Niña years and (C) Neutral years relative to the climatology of 1979–2019. Dots denote differences significant at 95% confidence based on Student’s t-test.
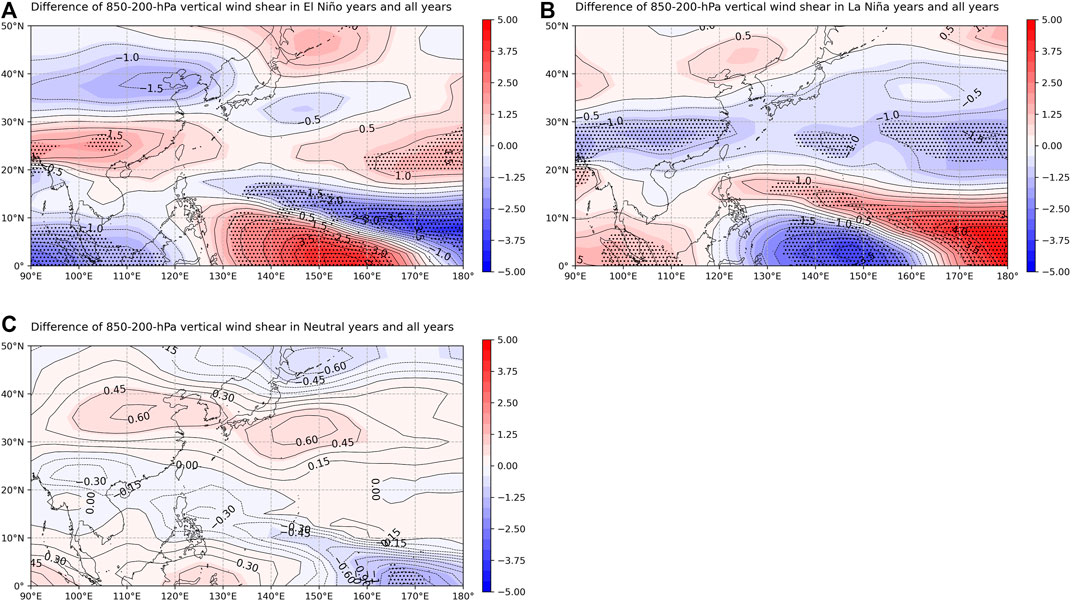
FIGURE 9. Same as Figure 8, but for 850-200-hPa vertical wind shear.
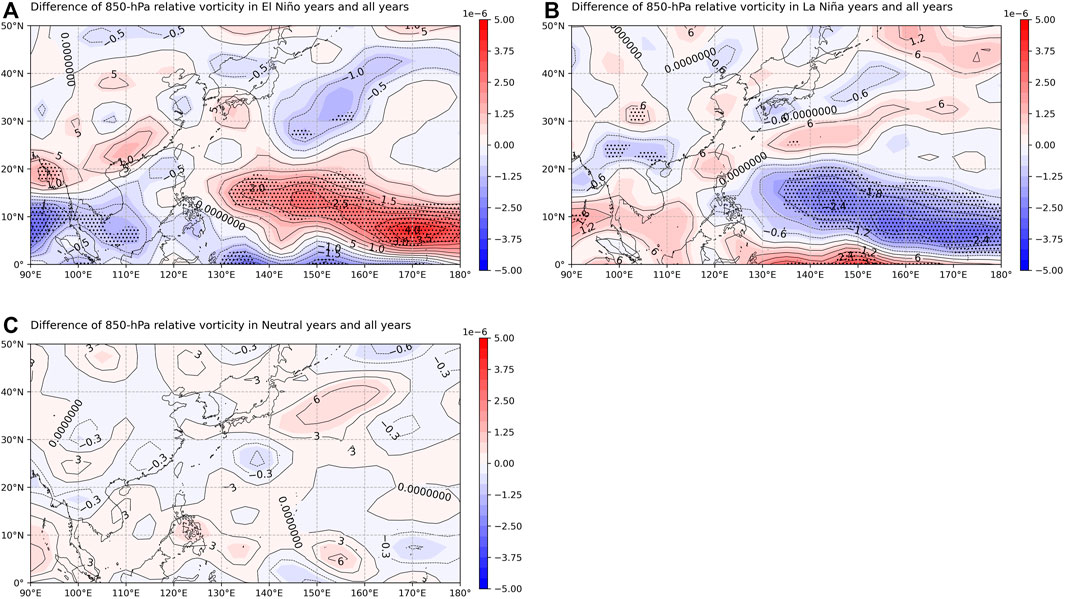
FIGURE 10. Same as Figure 8, but for 850-hPa relative vorticity.
Can be linked to higher 850-hPa relative humidity, larger 850-hPa relative vorticity and smaller 850-200-hPa VWS (significantly at the 95% confidence level), while suppressed TC activity over the western WNP (west of 130°E) is mainly caused by lower 850-hPa relative humidity. In contrast, during La Niña years, there are significantly lower 850-hPa relative humidity, smaller 850-hPa relative vorticity and higher 850-200-hPa VWS over most of the WNP, resulting in basinwide suppression of TC activity. Additionally, during neutral years, there are higher 850-hPa relative humidity, smaller 850-200-hPa VWS over the western WNP, which is favorable for the development of landfalling TCs over the WNP.
Environmental conditions have an effect on not only the genesis of TCs, but also on the movement and maintenance of TCs. As depicted in Figure 7B, TCs forming over the western WNP are more likely to make landfall over China mainland. Compared with neutral years, the number of TCs generated over the western WNP are relatively lower in both El Niño and La Niña years, which leads to fewer TCs making landfall over China mainland. Compared with neutral years, 500-hPa geopotential height shows a dipolar pattern over the WNP during El Niño years, with negative values at 140°-160°E and positive values at 90°-130°E (Figure 11A). It indicates that the western Pacific subtropical high migrates eastward during El Niño years, while weaker northerlies are hard to prevent the northward movement of TCs, which causes more TCs making landfall over south of 30°N. In contrast, 500-hPa geopotential height has a distinct positive center over the region of 130°–150°E in La Niña years (Figure 11B), the western Pacific subtropical high migrates westward, which steer more TCs to move northward. In sum, the changes in large-scale circulation induce the north-south difference in overland ACE between El Niño and La Niña years. In addition, the 500-hPa geopotential height exhibits minor changes in neutral years, which has a limited effect on TCs making landfall over China mainland.
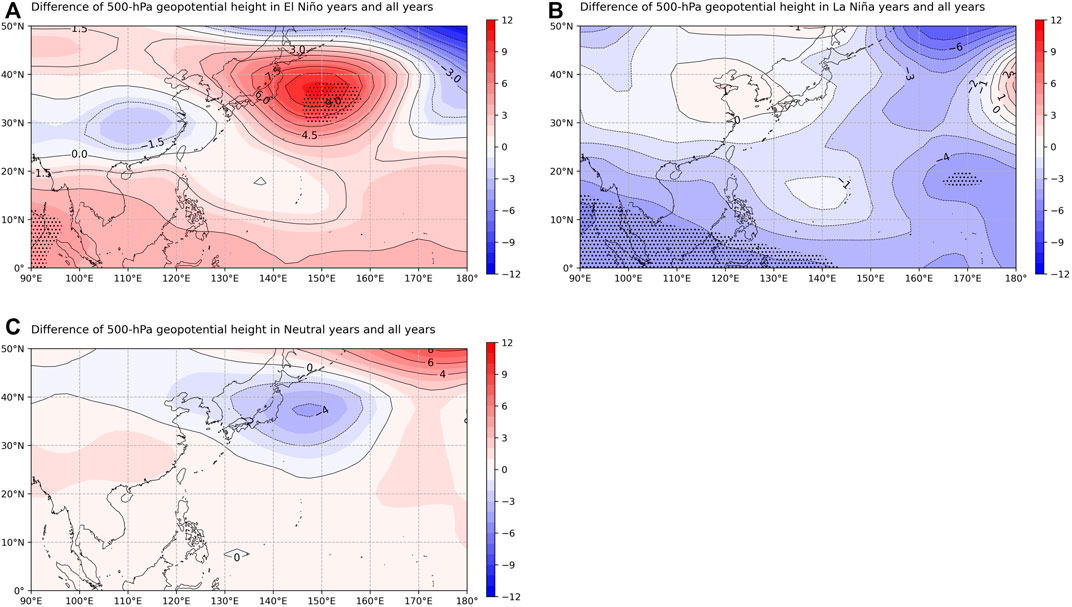
FIGURE 11. Same as Figure 8, but for 500-hPa geopotential height.
6 Conclusion
This study finds that there is no significant correlation between ENSO and overland ACE in China mainland during 1979–2019, which is quite different from the significant modulation of ENSO on basinwide ACE over the WNP as documented in previous publications. Our results found that overland ACE shifts to lower values in both El Niño and La Niña years when compared with those in neutral and all years, which is consistent with the changes in the distributions of TC frequency and mean duration after landfall. By contrast, the mean intensity does not exhibit notable changes between different ENSO years.
Compared with neutral years, the values of ACE are relatively lower in both El Niño and La Niña years over almost the entire China mainland, which exhibit significant correlations with the patterns of TC track density. Furthermore, the difference of overland ACE exhibits an obvious north-south dipolar pattern between El Niño and La Niña years. Compared with neutral years, the entire track density of landfalling WNP TCs is lower (greater) over the western (eastern) WNP in El Niño years, which is related to unfavorable (favorable) environmental conditions. Over the eastern WNP, enhanced (suppressed) TC activity is linked to higher (lower) 850-hPa relative humidity, smaller (larger) 850-200-hPa VWS, larger (smaller) 850-hPa relative vorticity and greater (smaller) 200-hPa divergence in El Niño (La Niña) years. Over the western WNP, reduced TC activity is primarily induced by lower 850-hPa relative humidity in El Niño and La Niña years. Moreover, 500-hPa geopotential height in El Niño (La Niña) years is lower (higher) over the eastern WNP and higher (lower) over the western WNP. The eastward (westward) western Pacific subtropical high steers more TCs make landfall over the south (north) of 30°N. By comparison, the overland ACE and track density in neutral years are highest over the entire coastal regions of East Asia and Southeast Asia, which is associated with higher 850-hPa relative humidity and lower 850-200-hPa VWS. Chan and Liu, 2004, Gray, 1984, Klotzbach, 2006, Lu et al., 2021, Maue, 2011, Ying et al., 2014.
Data availability statement
The original contributions presented in the study are included in the article/Supplementary Material, further inquiries can be directed to the corresponding author.
Author contributions
XF, JS, and YD contributed to conception and design of the study. XF organized the database and performed the statistical analysis. XF wrote the first draft of the article. JS and YD revised the article. All authors contributed to manuscript revision, read, and approved the submitted version.
Funding
We are very grateful to two reviewers for their valuable comments on an earlier manuscript. This work was jointly funded by the National Natural Science Foundation of China (61827901, 42175007 and 41905001).
Conflict of interest
The authors declare that the research was conducted in the absence of any commercial or financial relationships that could be construed as a potential conflict of interest.
Publisher’s note
All claims expressed in this article are solely those of the authors and do not necessarily represent those of their affiliated organizations, or those of the publisher, the editors and the reviewers. Any product that may be evaluated in this article, or claim that may be made by its manufacturer, is not guaranteed or endorsed by the publisher.
References
Bell, G. D., Michael, S. H., Schnell, C. R., Higgins, W. R., Lawrimore, J., Kousky, V. E., et al. (2000)., 81, s12–s50. doi:10.1175/1520-0477(2000)81[s1Climate assessment for 1999, Bull. Amer. Meteor. Soc.,
Camargo, S. J., Emanuel, K. A., and Sobel, A. H. (2007b). Use of a Genesis potential index to diagnose ENSO effects on tropical cyclone Genesis. J. Clim. 20, 4819–4834. doi:10.1175/jcli4282.1
Camargo, S. J., Robertson, A. W., Gaffney, S. J., Smyth, P., and Ghil, M. (2007a). Cluster analysis of typhoon tracks. Part II: Large-scale circulation and ENSO. J. Clim. 20, 3654–3676. doi:10.1175/jcli4203.1
Camargo, S. J., Sobel, A. H., Barnston, A. G., and Klotzbach, P. J. (2010). The influence of natural climate variability on tropical cyclones, and seasonal forecasts of tropical cyclone activity. Glob. Perspect. Trop. cyclones Sci. Mitig.,11 325–360. doi:10.1142/9789814293488_0011
Camargo, S. J., and Sobel, A. H. (2005). Western North Pacific tropical cyclone intensity and ENSO. J. Clim. 18, 2996–3006. doi:10.1175/jcli3457.1
Chan, J. C. (2007). Interannual variations of intense typhoon activity. Tellus 59, 455–460. doi:10.1111/j.1600-0870.2007.00241.x
Chan, J. C., and Liu, K. S. (2004). Global warming and Western North Pacific typhoon activity from an observational perspective. J. Clim. 17, 4590–4602. doi:10.1175/3240.1
Chan, J. C. (1985). Tropical cyclone activity in the northwest Pacific in relation to the El Niño/Southern Oscillation phenomenon. Mon. Wea. Rev. 113, 599–606. doi:10.1175/1520-0493(1985)113<0599:tcaitn>2.0.co;2
Chan, J. C. (2000). Tropical cyclone activity over the Western North Pacific associated with El Niño and La Niña events. J. Clim. 13, 2960–2972. doi:10.1175/1520-0442(2000)013<2960:tcaotw>2.0.co;2
Chia, H. H., and Ropelewski, C. F. (2002). The interannual variability in the Genesis location of tropical cyclones in the northwest Pacific. J. Clim. 15, 2934–2944. doi:10.1175/1520-0442(2002)015
Chu, P. S. (2004). ENSO and tropical cyclone activity. Hurricanes typhoons Past, present, potential,45 297–332.doi:10.1002/9781119548164.ch17
Goddard, L., and Dilley, M. (2005). El Niño: Catastrophe or opportunity. J. Clim. 18, 651–665. doi:10.1175/jcli3277.1
Gray, W. M. (1984). Atlantic seasonal hurricane frequency. Part I: El Niño and 30 mb quasi-biennial oscillation influences. Mon. Wea. Rev. 112, 1649–1668. doi:10.1175/1520-0493(1984)112<1649:ashfpi>2.0.co;2
Kalnay, E., Kanamitsu, M., Kistler, R., Collins, W., Deaven, D., Gandin, L., et al. (1996). The NCEP/NCAR 40-year reanalysis project. Bull. Amer. Meteor. Soc. 77, 437–471. doi:10.1175/1520-0477(1996)077<0437:tnyrp>2.0.co;2
Klotzbach, P. J. (2006). Trends in global tropical cyclone activity over the past twenty years (1986–2005). Geophys. Res. Lett. 33, L10805. doi:10.1029/2006gl025881
Lee, W. J., Park, J. S., and Kwon, H. J. (2007). A statistical model for prediction of the tropical cyclone activity over the Western North Pacific. Asia-Pac. J. Atmos. Sci. 43, 91–99.
Lin, I., Camargo, S. J., Patricola, C. M., Boucharel, J., Chand, S., Klotzbach, P., et al. (2020). ENSO and tropical cyclones. El Niño South. Oscillation a Changing Clim.,12 377–408. doi:10.1002/9781119548164.ch17
Lu, X., Yu, H., Ying, M., Zhao, B., Zhang, S., Lin, L., et al. (2021). Western North pacific tropical cyclone database created by the China meteorological administration. Adv. Atmos. Sci. 38, 690–699. doi:10.1007/s00376-020-0211-7
Maue, Ryan N. (2011). Recent historically low global tropical cyclone activity. Geophys. Res. Lett. 38, L4803. doi:10.1029/2011gl047711
Patricola, C. M., Camargo, S. J., Klotzbach, P. J., Saravanan, R., and Chang, P. (2018). The influence of ENSO flavors on Western North Pacific tropical cyclone activity. J. Clim. 31, 5395–5416. doi:10.1175/jcli-d-17-0678.1
Song, J., Klotzbach, P. J., and Duan, Y. (2022). On the relationship between Western North Pacific tropical cyclone accumulated cyclone energy and the Pacific-North American pattern. Int. J. Climatol. 42, 6373–6383. doi:10.1002/joc.7594
Wang, B., and Chan, J. C. (2002). How strong ENSO events affect tropical storm activity over the Western North Pacific. J. Clim. 15, 1643–1658. doi:10.1175/1520-0442(2002)015
Wang, X., and Song, W. (2010). Studies on relationships between ENSO and landfalling tropical cyclones in China. J. Trop. Meteor. 16, 189–194. doi:10.3969/j.issn.1006-8775.2010.02.011
Yang, L., Du, Y., Xie, S., and Wang, D. (2012). An interdecadal change of tropical cyclone activity in the South China Sea in the early 1990s. Chin. J. Ocean. Limnol. 30, 953–959. doi:10.1007/s00343-012-1258-9
Ying, M., Zhang, W., Yu, H., Lu, X., Feng, J., Fan, Y., et al. (2014). An overview of the China Meteorological Administration tropical cyclone database. J. Atmos. Ocean. Technol. 31, 287–301. doi:10.1175/jtech-d-12-00119.1
Zhang, Q., Gu, X., Li, J., Shi, P., and Singh, V. P. (2018). The impact of tropical cyclones on extreme precipitation over coastal and inland areas of China and its association to ENSO. J. Clim. 31, 1865–1880. doi:10.1175/jcli-d-17-0474.1
Keywords: El Niño-southern oscillation, accumulated cyclone energy, tropical cyclones, western north pacific, overland
Citation: Fu X, Song J and Duan Y (2023) On the relationship between ENSO and overland accumulated cyclone energy of landfalling tropical cyclones over the western North Pacific. Front. Earth Sci. 10:1097233. doi: 10.3389/feart.2022.1097233
Received: 13 November 2022; Accepted: 09 December 2022;
Published: 26 January 2023.
Edited by:
Ping Huang, Institute of Atmospheric Physics (CAS), ChinaReviewed by:
Tao Feng, Hohai University, ChinaChao Wang, Nanjing University of Information Science and Technology, China
Copyright © 2023 Fu, Song and Duan. This is an open-access article distributed under the terms of the Creative Commons Attribution License (CC BY). The use, distribution or reproduction in other forums is permitted, provided the original author(s) and the copyright owner(s) are credited and that the original publication in this journal is cited, in accordance with accepted academic practice. No use, distribution or reproduction is permitted which does not comply with these terms.
*Correspondence: Jinjie Song, c29uZ2ppbmppZUBxcS5jb20=