 Jun Zhang
 Wenhao Xiao2
94% of researchers rate our articles as excellent or good
Learn more about the work of our research integrity team to safeguard the quality of each article we publish.
Find out more
ORIGINAL RESEARCH article
Front. Earth Sci. , 04 January 2023
Sec. Geohazards and Georisks
Volume 10 - 2022 | https://doi.org/10.3389/feart.2022.1095297
An unsuspected fault in front of a roadway is a key hidden disaster-causing factor that can result in major accidents in coal mines; therefore, the accurate advanced detection of faults is important for the safe coal mining. However, existing seismic advanced detection methods are difficult to execute because of the narrow space limits of roadways. Therefore, on the basis of the generalized theory of scattered waves and the scenes of advanced detections in roadways, we construct a new and superior advanced detection method using scattered waves. In this method, a virtual equivalent survey line perpendicular to the roadway strike is established to reconstruct scattered wave records and a polarization filter function is built to dynamically and accurately extract different types of scattered waves in the target area. An analysis of numerical simulations indicates the following. 1) The true reflection position of a fault in front of a rock roadway is closely related to its dip, and the proposed method can accurately extract and image the scattered multiwaves generated at the true reflection position to identify the inclination of the fault, which can avoid the arc-shaped illusion problem caused by the false reflection signal. 2) Under the condition that the scattered waves at the breakpoint of a broken coal seam are significantly disturbed by the coal seam waveguide effect, the fault inclination of the coal roadway can be determined by the joint imaging and interpretation on the reflected channel wave of the hanging wall breakpoint and the scattered wave of the footwall breakpoint. A field study was performed to verify the effectiveness of the proposed method. The results indicate that this method can effectively identify the position and inclination of faults and provide an effective new means for the accurate detection of faults in front of coal mine roadways.
A roadway is a key channel of coal mine production. 76% of major accidents in coal mines occur in the stage of roadway excavation, and a fault is a key hidden disaster-causing factor. Therefore, the accurate advanced detection of faults is a major national demand for ensuring the coal basic mining.
The means of roadway advanced detections mainly include the seismic wave method, direct current method, transient electromagnetic method and geological radar method, in which the seismic wave method has become the most widely used because of its large detection distance and high resolution (Li et al., 2019). Reflected-wave is the most widely used seismic wave in advanced detections. In reflected-wave methods, linear observation systems are usually arranged on the sides of roadways, and a Radon transform and two-dimensional Fourier transform are used to extract the reflected waves in front of roadways. Finally, a diffraction migration imaging is performed to achieve the prediction of geological structures within 100 m in front of roadways (Liu et al., 2006; Liang and Song, 2009; Shen et al., 2009). In addition, reflected wave advanced detection technologies for tunnels are also used in mine roadways, mainly including the negative apparent velocity method, TSP, HSP, TRT, TST, ISIS, TGP, etc. (Bohlen et al., 2007; Lüth et al., 2008; Chen J. L et al., 2014; Esmailzadeh et al., 2018). Compared with the tunnel advanced detection (Luo et al., 2020; Liu et al., 2022), the reflected-wave received in small observation apertures of coal mine roadways is difficult to identify the position of true reflections (Chen F. et al., 2014), and its imaging with a lack of vertical resolution is ineffective in identifying the fault inclination (Wang and Huag, 2022).
Main energies of mine seismic waves will be bound in coal seams, and interfere to form strong channel waves (Krey, 1963; Dresen and Rüter, 1994). Channel waves will reflect or scatter when encountering the geological structures in coal seams, which can be used to detect the geological structures in front of coal roadways (Teng et al., 2019; Guo et al., 2020). The numerical simulation study shows that (Essen et al., 2007; Yang et al., 2016; Ji et al., 2018), the reflected channel wave is one of the characteristic waves of the fault in front of coal roadways, but it does not have the response ability of fault inclinations (Jiang et al., 2018). Diffracted/Scattered waves have an obvious advantage over reflected waves in the high-resolution imaging (Zhang and Zhang, 2014; Xi and Huang, 2020; Zhao et al., 2020), which can effectively identify discontinuous geological bodies such as pinch out points, intrusive bodies and irregular salt domes (Rad et al., 2018), and is suitable for the small-scale fault detection in coal mines. Under the background of obvious difference in wave-impedance between coal seams and surrounding rocks, the diffracted/scattered wave of the coal seam breakpoint in front of the roadway is characterized by the strong energy and easy identification (Yang and Chen, 2010; Wang et al., 2019). In the space limitation of the driving roadway, the advanced detection arranging observation systems on the side wall or the roof and floor of roadways along the roadway trend is in essence to image targets in the non-coverage range of the survey line. Therefore, using diffracted/scattered wave for advanced detection is more in line with the theoretical and practical situation.
Therefore, on the basis of the generalized theory of scattered waves and the scenes of advanced detections in coal mine roadways, we construct a new advanced detection method that has the abilities of the vector extraction and improved equivalent offset imaging of scattered waves. And seismic numerical models of faults in front of the rock roadway and coal roadway are established respectively to study the scattered wave field characteristics. Then the method in this paper is used to image the true reflection position of the fault in the rock roadway model and the coal seam breakpoint of fault in the coal seam roadway model. Finally, a field study was performed to verify the effectiveness of the proposed method. The results indicate that this method can effectively identify the position and inclination of faults and provide an effective new means for the accurate detection of faults in front of coal mine roadways.
On the basis of the Huygens–Fresnel principle, the signal of a scatter point can be obtained at each receiving point when a seismic wave is excited on the surface. As shown in Figure 1A, in the equivalent offset migration (EOM) method (Bancroft and Geiger, 1994; Bancroft et al., 1998), the double-square-root equation of the time t of the seismic wave propagating from a source point S to a scattering point SP at a depth Z0 and then to the receiver point R can be converted into a single-square-root equation by assuming the existence of a self-excited self-receiving point E. For the convenience of calculation, we define the midpoint of S and R as M, CSP represents the projection of the underground common scattering point on the ground, t0 is the zero-offset two-way travel time of the scattering point, he is the equivalent offset, E is the juxtaposed equivalent source point and equivalent receiving point, and te is the travel time from E to SP. At this time, the equivalent offset he, which is the distance from E to the ground projection of the underground common scattering point (CSP), is
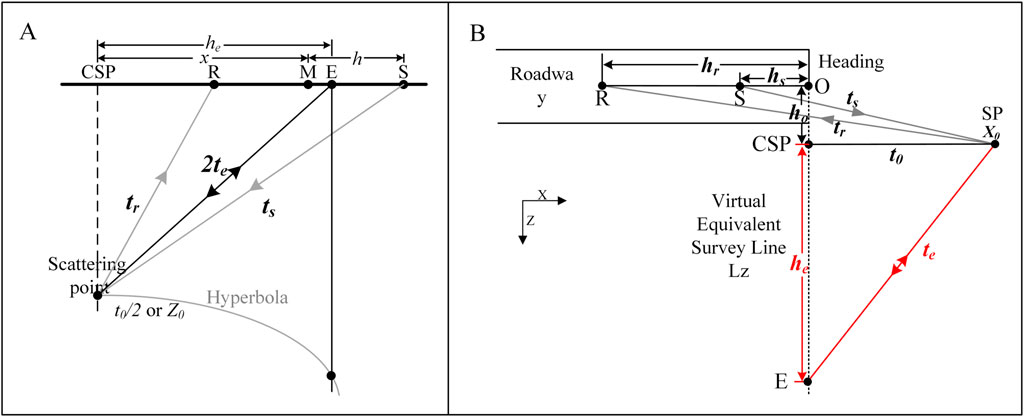
FIGURE 1. Schematic diagram of equivalent offset. (A) Conventional diagram; (B) Improved diagram.
In Eq. 1, h is the distance between S and M, x is the distance from M to CSP, and vmig represents the root-mean-square velocity at the scattering point.
Then, the scattered waves can be mapped from the input traces to the CSP gathers by using Eq. 1 to extract the scattered waves to the maximum theoretical extent without any loss of reflected waves (Zhang et al., 2021). Finally, we can use Kirchhoff integral summation on the gathers to complete the EOM scattered-wave imaging. This method, with its characteristics of a low requirement for signal to noise ratio and high folds of the scattered waves, is superior for detecting small-sized faults in front of roadways.
In roadway advanced detection, the survey line arranged along the roadway strike causes the detection direction and the survey line direction to not meet a conventional two-dimensional relationship. Therefore, on the basis of the concept of equivalent offset, a virtual equivalent survey line perpendicular to the roadway strike is established and the seismic records are reorganized without time shifting to make the detection direction perpendicular to the survey line direction. This method should expand the limited detection space of mine roadways and improve the acquisition ability of the effective scattered waves in front of a roadway.
In a roadway space of a uniform medium, the drivage direction is defined as X, the horizontal direction is defined as Y, and the direction perpendicular to the roof and floor is defined as Z. As shown in Figure 1B, taking the XZ-plane as an example, an equivalent virtual survey line LZ perpendicular to the roadway strike with X as the detection direction is established to convert the seismic records received in the roadway into records received on the virtual survey line. To facilitate calculations, the virtual survey line LZ (−L, L) is defined as being located at the heading position of the roadway (the dotted line in Figure 2), where the intersection point O of LZ and the shot-receiver line is the zero point (Figure 2 only shows the (0, L) section of LZ). If there is a scattering point SP at X0 in front of the virtual survey line, the travel time of the seismic wave from the source point S to the receiving point R is the total travel time t of the seismic scattered wave. Then,
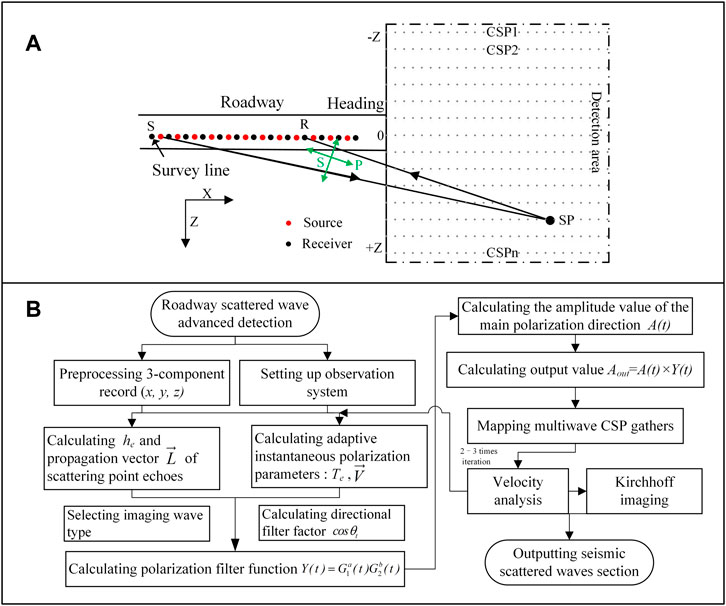
FIGURE 2. Roadway scattered-wave advanced detection method. (A) Detection model in front of a roadway; (B) Basic flow chart.
In Eq. 2, hs is the distance from the source point S to point O, hr is the distance from the receiving point R to point O, the CSP point is the projection of SP on the equivalent virtual line, and ho is the distance from point O to the CSP point. There is a self-excited self-receiving point E on the equivalent virtual survey line such that the two-way travel time to the scattering point SP is equal to the total travel time, that is, t = 2 te. Then,
In Eq. 3, he is the equivalent offset of the scattering point on the virtual survey line and t0 is the vertical one-way travel time from the scattering point to the virtual survey line. It can be seen that he is
Eq. 4 above is the improved equivalent offset formula and can be used to formulate the EOM method suitable for roadway advanced detection by substituting it into Eq. 1.
The adaptive instantaneous polarization analysis method (Diallo et al., 2006) based on the Hilbert transform can select an accurate and dynamic covariance calculation time window using the instantaneous frequency characteristics of the signal and can then obtain the instantaneous polarization parameters of each sampling point in the three-component (X, Y, Z) seismic records. The detailed procedure for solving the covariance matrix is given in the reference just cited and will not be repeated in detail in this paper. Below is a list of the relevant equations of the polarization parameters when using the adaptive instantaneous polarization analysis method.
1) Major ellipsoid-ratio
2) Polarization coefficient
3) Major polarization azimuth angle
4) Major polarization dip angle
5) Major polarization direction
Different types of seismic waves in different directions are mixed in working faces. To accurately image the seismic scattered waves in working faces, it is necessary to extract specific types of seismic signals at specific locations. To this end, a polarization filtering function with a spatial direction filtering attribute is constructed by Eq. 2:
For this function,
For a known scattering point in space, it is evident that the propagation direction vector of the seismic echo signal at a receiving point is
It is evident that the above filter function can reduce the influence of non-linear interference waves and improve the signal-to-noise ratio of seismic records. In addition, the way its filtering characteristics change with the spatial position of the imaging points and the type of imaging wave can improve the filtering accuracy and enable vector extraction of the wavefield to a certain extent.
In keeping with the conventional observation system of current roadway advanced detection methods, the seismic scattered-wave detection model can be established as shown in Figure 2A (taking the XZ-plane as an example). The actual survey line is arranged on the roadway floor or the side wall, where the X-direction is aligned with the front of the roadway, the Y-direction is in the horizontal direction cutting across the roadway, and the Z-direction is the direction perpendicular to the plane of the roadway. The XZ section of the detection area is located in front of the roadway heading. The virtual survey line starts from −Z to +Z, and the actual survey line is located at Z = 0. The CSP gathers with X in the depth direction are arranged at a certain interval on the virtual survey line. At this time, the propagation direction of the seismic echoes from any scattering point and the polarization direction of the theoretical P and S waves can be expressed by the two-dimensional vector in the XZ-plane.
On the basis of the above detection model, the improved equivalent offset formula and polarization filter function for roadway advanced detection can be dynamically combined to first map the CSP gathers of the detection area to enable the dynamic extraction of scattered waves of different types and in different directions. Then, the velocity analysis and Kirchhoff migration of the CSP gathers of the different types of scattered waves in the detection area can be performed to enable tunnel scattered wave advanced detection. It should be noted that the velocity is usually unknown. At this time, we can first set the initial velocity v0 (usually referring to the velocity of direct waves) to map the CSP gathers and perform velocity analysis. Then the multiple iterations of mapping CSP gathers are carried out by using the values of velocity analysis. In the case of uncomplicated formation, a stable velocity profile can be obtained by 2-3 iterations (Bancroft et al., 1998) which can not only provide accurate velocity information for migration imaging, but also improve the accuracy of mapping the CSP gathers. Then, each gather can output a stacked trace using Kirchhoff pre-stack migration based on the velocity profile. Finally, all the stacked traces are combined to form a seismic profile. A basic flowchart of this method is shown in Figure 2B.
The numerical simulations were performed using the high-order staggered grid finite difference method. A two-dimensional model of a 60° dip fault in a rock roadway with a size of 300 m × 200 m was established, as shown in Figure 3, where X is the roadway drivage direction and Z is the vertical direction of the roof and floor. We referred to the lithology of common coal measure strata to obtain realistic petrophysical parameters for the model, as shown in Table 1. The seismic survey line was arranged at X = 50–100 m and Z = 100 m. A total of 26 receivers with 2-m intervals and a single source were installed to achieve wave acquisition Table 2. The source was located at point (50, 100), and the horizontal direction in front of the survey line intersected with the fault at X = 150 m. A mesh size of 0.2 m × 0.2 m, with Rick wavelets of 200 Hz and a sampling rate of 10 kHz, was applied in the simulations with a recording length of 150 m. A high-order, staggered-grid, finite-difference scheme was used for elastic-wave forward modeling (Xia et al., 2004).
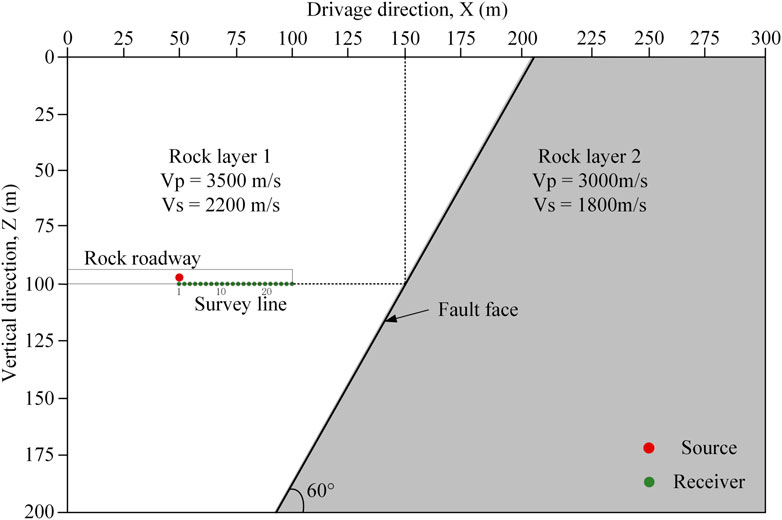
FIGURE 3. Model of a 60° dip fault in a rock roadway.
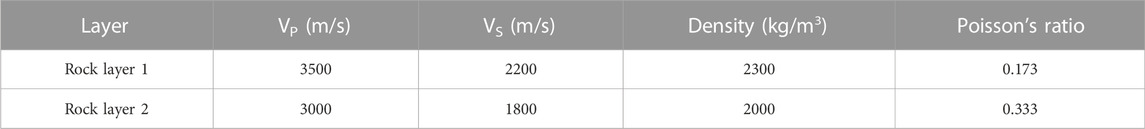
TABLE 1. Petrophysical parameters of the 60° dip fault model.
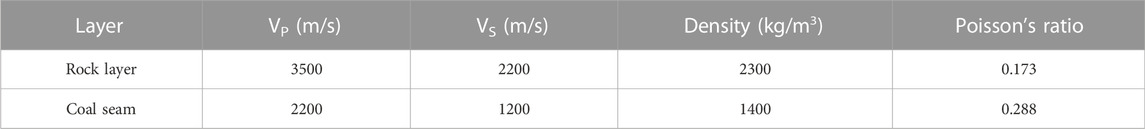
TABLE 2. Petrophysical parameters of the faulted coal seam model.
Figure 4 shows snapshots of the simulated wavefield of the above model. The following can be observed. 1) At 40 m, the incident P wave is converted into PP and PS scattered waves on the fault plane, while the fault scattered waves ahead and below the side (the red circle in the figure) cannot be received by the survey line. 2) At 55 m, the incident S wave is converted into SP and SS scattered waves on the fault plane, and the SP wave with a fast propagation velocity overlaps the previous PS wave. 3) In advanced detection, the groups of wave signals received by different receivers are actually signals of multiple different scattering points and the collection of these scattering points constitutes the true reflection position of the front fault.
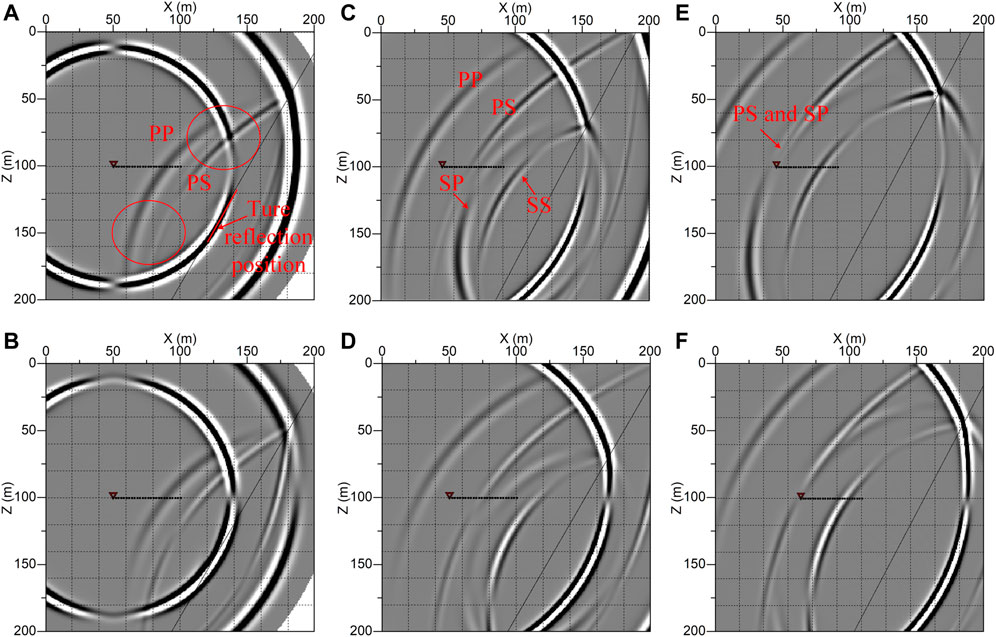
FIGURE 4. Snapshots of the rock roadway 60° dip fault model. (A) 40 ms X-component; (B) 40 ms Z-component; (C) 55 ms X-component; (D) 55 ms Z-component; (E) 65 ms X-component; (F) 65 ms Z-component.
Figures 5A,B shows synthetic records of the X- and Z-components obtained from the simulation. The signal primarily contains four groups of waves: the PP, PS, SP, and SS waves. The actual propagation direction of a scattered wave has a certain angular relationship with the X- and Z-components, resulting in the energy of the P and S waves of the same component being close. Compared with the PP and SS waves, the weaker converted PS and SP waves are completely superimposed into a single group of waves on receivers far from the fault position (the PS wave disappears in the X-component and the SP wave disappears in the Z-component).
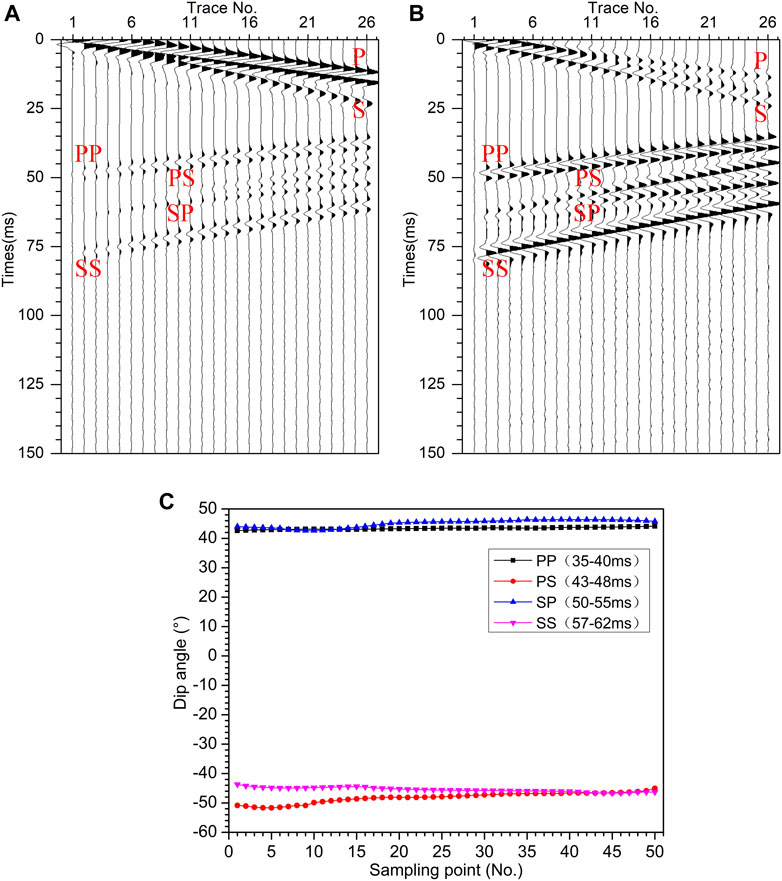
FIGURE 5. Synthetic records of the rock roadway 60° dip fault model. (A) The records of X-component; (B) The records of Z-component; (C) Polarization dip angles of the records at receiver No. 26.
In the analysis of wavefield characteristics, it is shown that the four kinds of waves in this model are linear polarized waves. Therefore, the differences in the main polarization direction of the signal are primarily reflected in the polarization dip angle. The polarization dip angle of the No. 26 receiver was obtained using the adaptive instantaneous polarization analysis method. The results of the four types of wave signals with a time window of 5 m (i.e., 50 sampling points) are shown in Figure 5C. The PP wave is located in the interval of 35–40 m, the PS wave is located in the interval of 43–48 m, the SP wave is located in the interval of 55–55 m, and the SS wave is located in the interval of 57–62 m. The polarization dip angles of the PP and SP waves have good stabilities and are located in the range of 43–47°, indicating the direction of the main echoes in front of the fault, that is, the true reflection position. The stability of the polarization dip angles of the SS wave is better than that of the PS wave, which is located between −43° and −47°. The polarization inclinations of the signals in the anterior part of the PS waves fluctuate to some extent, which is speculated that this is caused by the interference of the PP waves. The polarization dip angle difference between the S and P waves is close to 90°, which conforms to the theoretical polarization characteristics. In summary, this polarization analysis method has the ability to dynamically and accurately identify the direction and type of wave signal and can provide a basis for wavefield vector separation. It is evident that the directional filter factor G2 in the polarization filter function constructed in this paper helps to extract the target imaging wave in the target direction.
The conventional EOM scattered-wave imaging method was used to map and image the CSP gathers. A total of 51 CSP gathers were arranged with a spacing of 2 m from Z = −50 m − +50 m, a maximum equivalent offset distance of 150 m, an equivalent offset step of 2 m, and a root mean square velocity vmig equal to the P wave velocity of the model. In Figure 6, the red dotted line indicates the actual position of the fault in the model. The imaging effect is poor as a result of the multi-wave signals. In addition to the coincidence of the imaging position of the PP wave with the actual position of the fault, there is still obvious converted-wave and SS-wave imaging in the section, which results in incorrect assessments of the location and number of faults. Furthermore, there are obvious arc illusions in the imaging, which make it impossible to distinguish the true reflection position and inclination of the fault.
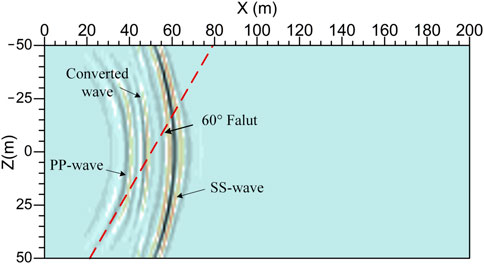
FIGURE 6. Conventional EOM section of the rock roadway 60° dip fault model.
The method proposed in this paper is used for model imaging. Since the PS and SP converted waves of the model are relatively weak and mixed, only the vector extraction and imaging of P- and S-wave are performed here. Firstly, the CSP gathers of different types of scattered waves are vectorially extracted using the same mapping parameters. In order to extract linearly polarized P waves and S waves, the polarization strength factor G1 is derived using the value of Te. Figure 7 are the P-wave and S-wave CSP (PCSP and SCSP) gathers of the model respectively. As shown in the figure, affected by polarization filtering, only the PP scattered waves in the PSCP 41 gather that are located at the true reflection position of the fault are obvious, while the interference signals in the other gathers (PCSP 11 and PCSP 26) located at false reflection position of the fault are obviously suppressed. The same situation exists in the S-wave CSP gathers, in which the target wave is well extracted.
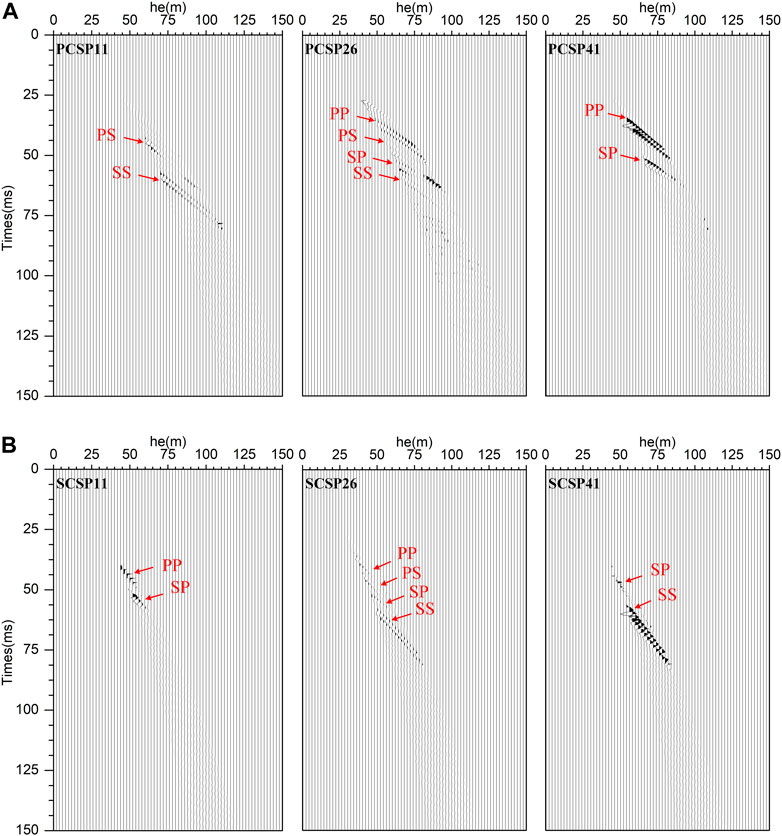
FIGURE 7. CSP gathers of the fault model. (A) P waves; (B) S waves.
Kirchhoff migration imaging was performed for the above CSP gathers, as shown in Figure 8. This figure shows that the imaging of the two waves can indicate the true reflection position of the fault model correctly and that the false reflection signal is suppressed to avoid the arc-shaped illusion problem. The imaging results can effectively help determine the inclination of the fault and its true exposure position in front of the roadway.
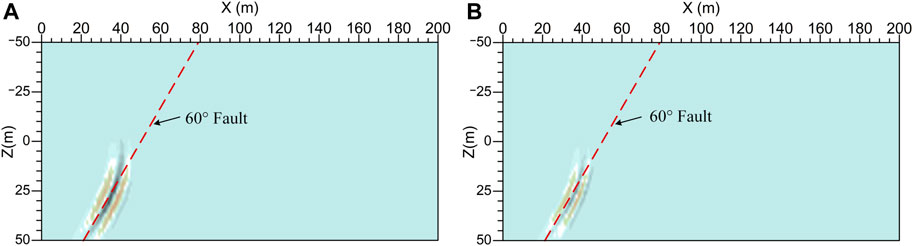
FIGURE 8. Multi-wave sections of the 60° dip roadway fault model. (A) Section of PP waves; (B) Section of SS waves.
Faults in front of coal roadways cause a disconnection of the coal seam, such that a model of the faulted coal seam needs to be established. As shown in Figure 9, the thickness of the coal seam was 5 m, with the hanging wall of the coal seam located at X = 0–150 m and Z = 95–100 m and the footwall of the coal seam located at X = 127–300 m and Z = 135–140 m. The survey line was arranged on the coal seam floor along X = 0–50 m and Z = 0 m, and a source was installed at (0, 100). The coal seam simulation used parameters consistent with those in the previous simulation except that the recording length was 220 m.
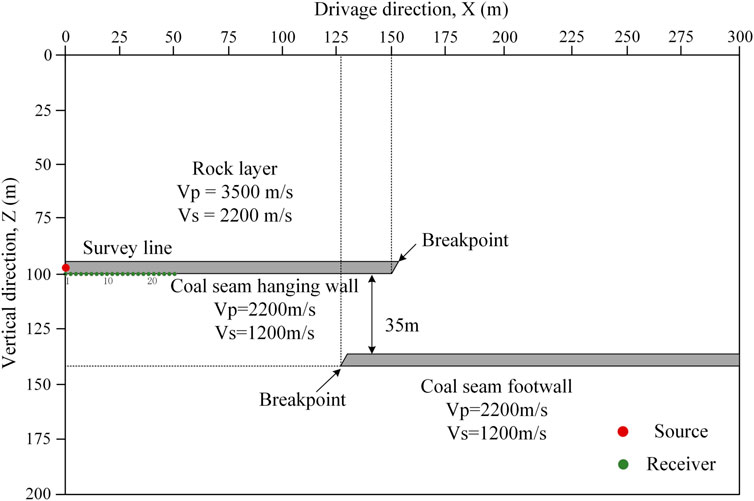
FIGURE 9. Model of the faulted coal seam.
Figure 10 shows wavefield snapshots of different components at different times for the model. The existence of the coal seam and its breakpoints render the wavefield complex. The following can be observed. 1) At 75 m, the PP wave and the converted wave of the footwall are relatively clear, while the wave of the hanging wall is weak and difficult to directly distinguish because of the influence of the channel wave. 2) At 105 m, the SS waves of the hanging wall and the footwall appear and produce interference superposition in the coal seam to form a group of signals with a long wave train. 3) At 150 m, channel waves with different phase velocities are reflected at the breakpoint of the hanging wall and return to the receivers in turn. Overall, the scattered body waves, especially the P wave, at the breakpoint of the footwall are obvious; however, the scattered body waves at the breakpoint of the hanging wall are seriously affected by the coal seam. Meanwhile, the reflected channel wave of the hanging wall is obvious and has the ability to image the hanging wall.
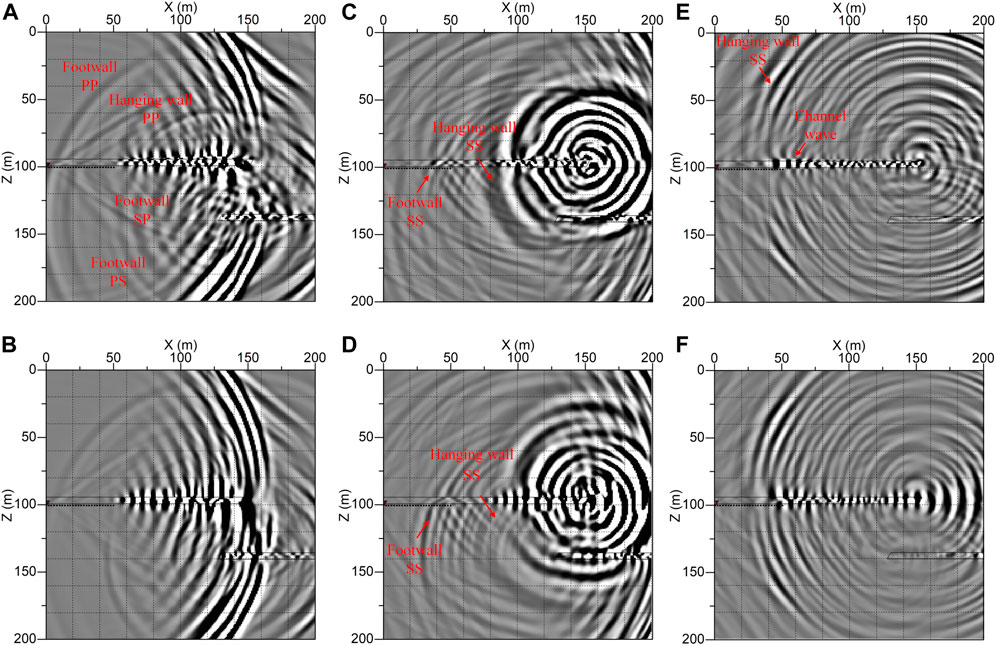
FIGURE 10. Snapshots of the advanced faulted coal seam model. (A) 75 ms X-component; (B) 75 ms Z-component; (C) 105 ms X-component; (D) 105 ms Z-component; (E) 150 ms X-component; (F) 150 ms Z-component.
Figure 11 shows a synthetic record of the X- and Z-components of the model. Combining the snapshots and the actual model, the signals in the record can be divided into nine groups of signals that are identified in the figure: ① the direct P wave; ② the direct S wave; ③ the direct channel wave with a long propagating wave train and strong energy; ④ the PP wave scattered by the breakpoint of the footwall of the coal seam; ⑤ the PP wave scattered by the breakpoint of the hanging wall of the coal seam; ⑥ the mixed converted wave of the footwall; ⑦ and ⑧ the SS waves scattered by the breakpoints of the footwall and hanging wall, respectively, which show characteristics of a long propagating wave train and high separation difficulty under the influence of the coal seam; and ⑨ the reflected channel wave generated at the breakpoint of the hanging wall, which shows low-velocity, strong-energy, and long-duration characteristics.
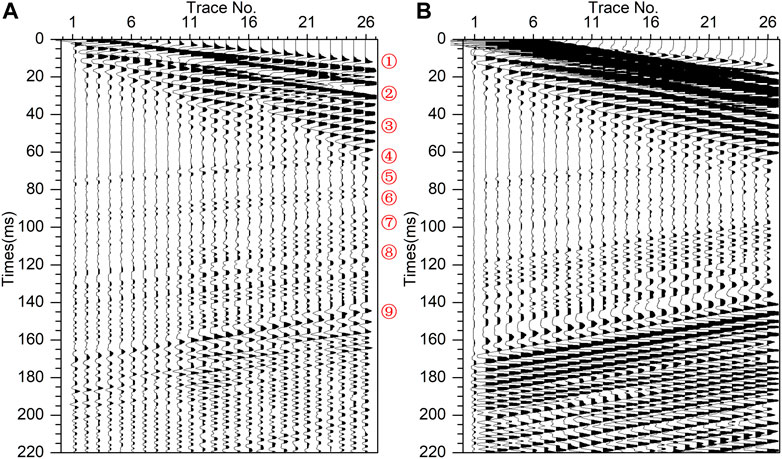
FIGURE 11. Synthetic records of the advanced faulted coal seam model. (A) X-component; (B) Z-component.
On the basis of the above analysis, the scattered body waves of the footwall breakpoint appear to be well-suited to imaging while the body waves of the hanging wall breakpoint are difficult to use for imaging. However, the obvious reflected channel wave of the hanging wall breakpoint can remedy the above imaging defect.
A polarization analysis was performed on the record of receiver No. 10, and Figure 12 shows the results for the polarization dip angles in the signal during four different periods. As shown in Figure 12A, the period of 68–80 m contains the PP wave generated at the breakpoints of the hanging wall and footwall, in which the dip angle of the footwall signal is stable at 15–20° and the dip angle of the hanging wall signal is stable near −6°. The polarization dip angle of the footwall signal is more consistent with the model parameter than that of the hanging wall signal, which is significantly disturbed by the coal seam. Figure 12B shows the result of the mixed converted waves during the period of 86–98 m. Using the differences in the polarization dip angle, it can be determined that, during this period, the signal, which is difficult to distinguish in the wavefield, is a converted wave dominated by the SP wave generated at the footwall breakpoint. Figure 12C shows the result during the period of 103–115 m. The polarization dip angles of the SS waves generated at the footwall and hanging wall are approximately −70° and 80°, respectively. They differ by approximately 90° from the dip angles of the PP waves of the hanging wall and footwall, respectively, shown in Figure 12A, which conforms to the polarization characteristics of the P and S waves. As shown in Figure 12D, the polarization dip angles of the signal during the period of 157–169 m fluctuate greatly, indicating that this period consists of the reflected Rayleigh channel wave which is generated by interference of P-SV wave under point source. Consequently, the existence of a coal seam inevitably leads to a further complexity of the wave signals; regardless, the adaptive instantaneous polarization analysis method still has the ability to accurately identify the characteristics of the signals at each sampling point. It is evident that the directional filter factor G2 in the polarization filter function constructed in this paper helps to extract the target imaging wave in the target direction.
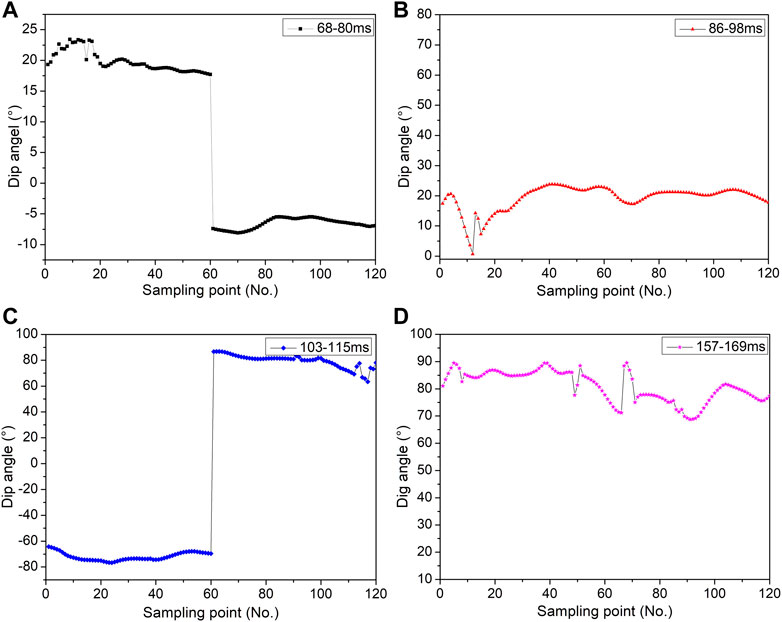
FIGURE 12. Polarization parameters of the receiver No.10 in the model. (A) 68–80 m; (B) 86–98 m; (C) 103–115 m; (D) 157–169 m.
Figure 13 shows the CSP gathers of the P, S, and C (channel) waves mapping by the method purposed in this paper with the same parameters in the previous model, in which PCSP 55 and SCSP 55 are both located at Z = 35 m (i.e., the position of the footwall breakpoint of the faulted coal seam) and CCSP (channel-wave CSP) 36 is located at Z = 0 m (i.e., the position of the hanging wall breakpoint of the faulted coal seam). At PCSP 55, the wave signals are suppressed except for the PP wave of the footwall. In addition, the signal of the breakpoint of the hanging wall is weak because the gather is not located at the breakpoint. The same situation exists at SCSP 55. The coal seam channel wave can only respond to the breakpoint of the hanging wall; therefore, the channel wave is obvious at CCSP 36, which is located at the breakpoint of the hanging wall. In addition, it is should be noted that the polarization strength factor G1 is derived using the value of 1-Te when extracting non-linear polarized channel waves.
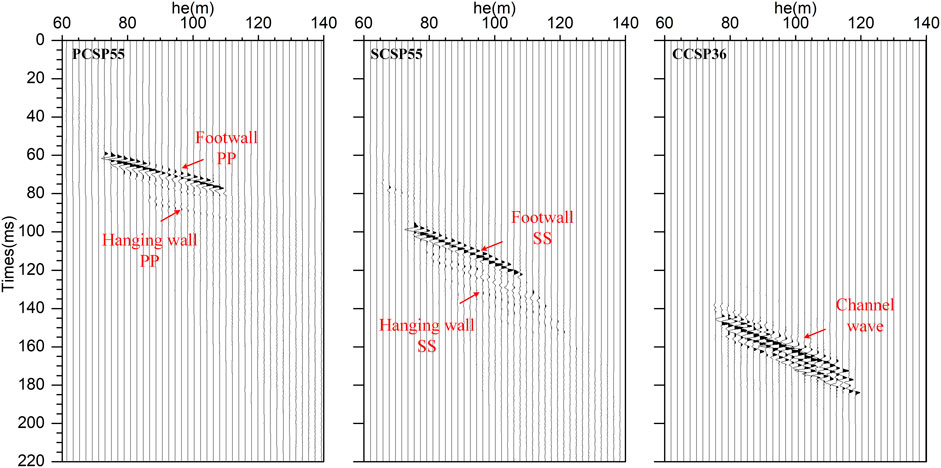
FIGURE 13. Multi-wave CSP gathers of the faulted coal seam model.
Figure 14 shows the multi-wave sections of the faulted coal seam model obtained by the proposed scattered-wave advanced detection method. It shows that the PP and SS waves can correctly image the two breakpoints of the faulted coal seam, while the breakpoint imaging of the hanging wall is not as good as that of the footwall because of the low-quality scattered wave generated at the hanging wall. Meanwhile, the inaccurate polarization characteristics of the signals under the interference of coal seams make the arc-drawing imaging phenomenon in this model more obvious than that in the rock roadway model. In addition, even without an envelope calculation, the channel wave can image the breakpoint of the hanging wall well, which can compensate for the disadvantages associated with using scattered body waves to image the breakpoint of the hanging wall. In summary, the method proposed in this paper can satisfactorily complete vector extraction and imaging both of the body waves and the channel waves in the complex wavefield of a mine roadway. Furthermore, the fault inclination can be inferred from the imaging results of different types of waves generated at the breakpoints of the hanging wall and footwall.

FIGURE 14. Multi-wave sections of the faulted coal seam model. (A) Section of PP waves; (B) Section of SS waves; (C) Section of channel waves.
The Yilan Coal Mine, in its construction period, is driving three rock roadways at the −580 mining level. During the driving process, several faults were continuously exposed, which seriously affected the driving safety and the layout of the first mining face. Therefore, a field study was conducted in one of the rock roadways to determine the distribution of the fault within 100 m in front of the roadway and to provide guidance for the safe and efficient construction of roadways. Figure 15A shows the site layout of the field study. Ten sources in hole with 2-m intervals and two receivers with 5-m intervals were arranged on the right side of the roadway at a height of 1.5 m above the floor. The source in each hole is excited with 200 g explosives in sequence. The S10 source was placed 1 m from the heading and the R2 receiver was placed 63 m from the S1 source to ensure a sufficient offset and to avoid the impact of the roadway acoustic wave. The three components X, Y, and Z of the geophone were consistent with the observation system in Figure 15A, in which the X-component points in the heading direction, the Y-component points in the horizontal direction, and the Z-component points in the vertical direction of the roof and floor. A sampling rate of 10 kHz and a sampling time length of 200 m were used for the data acquisition in the field study.
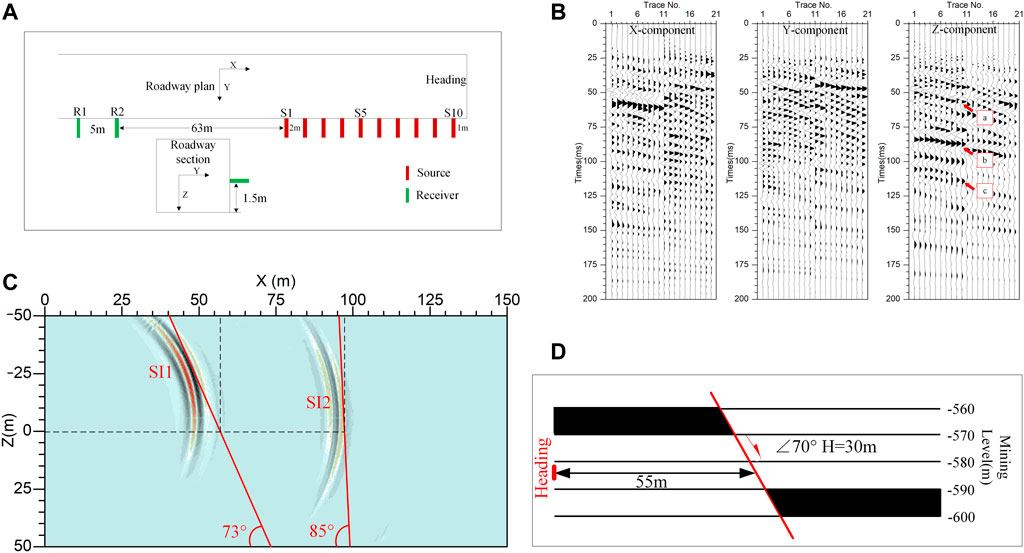
FIGURE 15. Field Study in Yilan Coal Mine. (A) Site layout. (B) Three-component records with τ-p transform. (C) Section of SV scattered waves in the field study. (D) Geological section of the roadway in the field study.
After preprocessing, including filtering and denoising of the acquired data, the τ–p transform was used to preliminarily extract the wave signals in front of the roadway, as shown in Figure 15B. There are three groups (a, b, and c in the figure) of negative apparent velocity characteristic signals in the Z-component and the arrival time of the first group signal (a in the figure) coincides with the heading position of the roadway. Therefore, the SV wave in this record is highly developed and can be used as the target wave for imaging. A total of 51 CSP gathers were arranged with an interval of 2 m, a maximum equivalent offset distance of 100 m, an equivalent offset step of 2 m, and with root mean square velocities vmig of 3.5 m/ms for the P waves in accordance with the direct wave velocities empirically observed. As shown in Figure 15C, the depth section obtained by the proposed method has two strong wave-impedance interfaces (SI), SI1 and SI2, in the section, with the SI1 interface located above the roadway level. On the basis of the imaging position and roadway space, SI1 is speculated to be an anti-dip fault with a dip angle of 73° and is expected to be exposed 57 m in front of the roadway. The SI2 interface is located in front of the roadway and is inferred be an approximately vertical fault with a dip angle of 85°; this fault is expected to be exposed 97 m in front of the roadway. It should be noted that we only use the tangent of the imaging interface as the inferred value of the fault dip.
Figure 15D shows the geological section of the actual exposure after roadway excavation, in which the roadway was driven at the −580 mining level. The geological section shows that there is a reverse fault with a dip angle of 70° and a throw of 30 m located 55 m in front of the heading of the detection day. Referencing Figure 15C, this fault corresponds to the SI1 interface in the imaging section with a position deviation of only 2 m and a dip deviation of only 3°. In addition, according to the field excavation records, the roof of the roadway was broken at a position 95–98 m in front of the heading of the detection area, which corresponds well to the SI2 interface in the imaging section. The verification results therefore indicate that the proposed roadway scattered-wave advanced detection method can effectively identify the horizontal position and inclination of faults and can provide an effective safety guidance for actual roadway excavations.
The EOM method is an applicable scattered-wave migration imaging method proposed by Bancroft (Bancroft and Geiger, 1994; Bancroft et al., 1998), and the detailed derivation and application method can refer to the references given in this paper. Therefore, in view of the unique setting of the roadway and based on the concept of EOM, this paper derives a new and innovative equivalent offset formula that meets the requirements of advanced detection in mine roadways by establishing an equivalent virtual survey line perpendicular to the roadway strike.
Although the instantaneous polarization analysis method adopted in this paper can accurately obtain the polarization parameters at each point, there may be a sudden change or overflow of the instantaneous frequency value given complex signals, which may cause abnormal changes in the polarization parameters and affect the extraction effect of the target wave. Therefore, in practical applications, constraints are required according to the possible signal polarization characteristics of the detection target to ensure that abnormal values do not affect the final result. In this paper, the polarization dip mutation of five consecutive signal sampling points is treated as the effective true value, otherwise polarization dip mutation is treated as an invalid abnormal value and the average value of the polarization parameters of the two points before and after it is taken as a substitute.
A coal seam channel wave is a unique wave propagating in a coal seam that responds significantly to a coal seam fault with a drop greater than half the coal thickness and therefore plays an important role in mine detection. However, a channel wave characterized by low velocity and strong energy will significantly cover the effective window of the body wave, making it difficult for the conventional imaging method to account for the above two types of waves. In this paper, we use the high sensitivity of channel waves to detect the breakpoint of the hanging wall of a fault and use the scattered body waves generated by the breakpoint of the footwall to detect the footwall of the fault, enabling detection of the position and inclination of coal roadway faults via body waves and channel waves.
In an advanced detection of a fault in a rock roadway, the difference of lithology on both sides of the fault will affect the amplitude of the secondary scattered waves on the fault plane. When the lithological difference is small, the scattered wave of the fault plane is weak. In this case, it is evident that the method constructed in this paper which is superior in the extraction of scattered wave can improve the ability to identify lithological interfaces. However, due to the influence of the noise and the signal attenuation, scattered waves generated by interfaces with small wave impedance differences may not be received in the field. Therefore, we suggest to adopt an acquisition mode of high frequency and high sensitivity in field applications. The spatial resolution of seismic scattered waves is determined by the wavelength. But in the advanced detection of faulted coal seams, the scattered wave is essentially generated by faulted coal seams. Even if the fault drop is small, the faulted coal seam extending in front of roadways, is a non-uniform whole with significant differences from the surrounding rock, which is still large enough to be distinguished by the seismic wave of conventional wavelength. Therefore, the drop of a fault will not significantly affect the detection effect at this time.
One characteristic wave associated with faults in front of a roadway is scattered waves; the full space effect of a roadway leads to the mixing of different types of waves in different directions, such that a wavefield separation method with vector characteristics is essential. Accordingly, this paper proposed a new and superior advanced detection method using scattered waves and performed corresponding numerical model and field studies. The following results were found.
1) In the method proposed in this paper, a virtual equivalent survey line perpendicular to the roadway strike is established to reconstruct scattered wave records, and a polarization filter function is built to dynamically and accurately extract different types of scattered waves in the target area. Accordingly, it has vector extraction and high-precision imaging abilities.
2) In the numerical simulations, under the limited observation space of the roadway, the true reflection position of the fault is not located in front of the rock roadway. The method in this paper can accurately extract the scattered wave of the true reflection position of the fault to solve the problem of arc-shaped false images caused by an insufficient imaging aperture and therefore determine the fault inclination of the rock roadway.
3) Significant seismic wave scattering phenomenon occur at the breakpoints of both the hanging wall and the footwall of coal seams. However, because of the waveguide characteristic of coal seams, the imaging effect of the scattered body waves of the hanging wall is poor. At this time, this defect can be compensated for using the reflected channel waves propagating in the coal seam of the hanging wall. So we proposed to determine the inclination of faulted coal seams using the joint imaging and interpretation on the reflected channel wave of the hanging wall breakpoint and the scattered wave of the footwall breakpoint.
In summary, the results show that the method can effectively identify the positions and inclinations of faults and therefore provide a new and superior method for the accurate detection of faults in front of coal mine roadways. However, considering the complexity the complexity and actual wavefields in roadway cavities, further studies concerning its applicability, anti-interference capabilities and resolution for faults are still needed to improve its application value.
The original contributions presented in the study are included in the article/Supplementary Material, further inquiries can be directed to the corresponding author.
JZ contributed to conception and methodology of the study. CL and WX performed the data curation and visualization. JZ and CL wrote the first draft of the manuscript. SL and JZ reviewed and edited the manuscript. All authors contributed to manuscript revision, read, and approved the submitted version.
This work was supported by the National Key Research and Development Program (2022YFC3003302 and 2021YFC2902003) and the Fundamental Research Funds for the Central Universities (6142414200613).
The authors declare that the research was conducted in the absence of any commercial or financial relationships that could be construed as a potential conflict of interest.
All claims expressed in this article are solely those of the authors and do not necessarily represent those of their affiliated organizations, or those of the publisher, the editors and the reviewers. Any product that may be evaluated in this article, or claim that may be made by its manufacturer, is not guaranteed or endorsed by the publisher.
Bancroft, J. C., and Geiger, H. D. (1994). Equivalent offsets and CRP gathers for pre-stack migration. 64th. Ann. Intern. Mtg. Soc. Exp. Geophys. Expand. Abstr., 672–675.
Bancroft, J. C., Geiger, H. D., and Margrave, G. F. (1998). The equivalent offset method of prestack time migration. Geophysics 63 (6), 2042–2053. doi:10.1190/1.1444497
Bohlen, T., Lorang, U., Rabbel, W., Müller, C., Giese, R., Lüth, S., et al. (2007). Rayleigh-to-shear wave conversion at the tunnel face-From 3D-FD modeling to ahead-of-drill exploration. Geophysics 72 (6), T67–T79. doi:10.1190/1.2785978
Chen, J. L., Li, F., Peng, S. P., and Sun, X. Y. (2014). Research progress and development direction on advanced detection in mine roadway working face using geophysical methods. J. Appl. Geophys. 39 (8), 1742–1750. doi:10.13225/j.cnki.jccs.2014.9007
Cheng, F., Liu, J. P., Qu, N. N., Mao, M., and Zhou, L. M. (2014). Two-dimensional pre-stack reverse time imaging based on tunnel space. J. Appl. Geophys. 104, 106–113. doi:10.1016/j.jappgeo.2014.02.013
Diallo, M. S., Kulesh, M., Holschneider, M., Kurennaya, K., and Scherbaum, F. (2006). Instantaneous polarization attributes based on an adaptive approximate covariance method. Geophysics 71 (5), 99–104. doi:10.1190/1.2227522
Dresen, L., and Rüter, H. (1994). Seismic coal exploration, part B: In-seam seismics. Oxford, UK: Pergamon Press.
Esmailzadeh, A., Mikaeil, R., Shafei, E., and Sadegheslam, G. (2018). Prediction of rock mass rating using TSP method and statistical analysis in Semnan Rooziyeh spring conveyance tunnel. Tunn. Undergr. Sp. Tech. 79, 224–230. doi:10.1016/j.tust.2018.05.001
Essen, K., Bohlen, T., Friederich, W., and Meier, T. (2007). Modelling of Rayleigh-type seam waves in disturbed coal seams and around a coal mine roadway. Geophys. J. Int. 170 (2), 511–526. doi:10.1111/j.1365-246X.2007.03436.x
Guo, Y. J., Ju, Y. Y., Fan, X. J., and Zhang, J. H. (2020). Progress in research of in-seam seismic exploration. Coal Geol. Explor. 48 (2), 216–277. doi:10.3969/j.issn.1001-1986.2020.02.032
Ji, G. Z., Wei, J. C., Yang, S. T., Li, X. F., Bai, J. L., and Sui, Y. S. (2018). Three-component polarization migration of channel waves for prediction ahead of coal roadway. J. Appl. Geophys. 159, 475–483. doi:10.1016/j.jappgeo.2018.09.028
Jiang, J. P., He, L., Zhu, P. M., Zhang, Q., and Teng, J. W. (2018). TVSP method for reconnaissance beyond coal roadway based on in-seam seismic waves: A feasibility study. Chin. J. Geophys. 61 (9), 3865–3875. doi:10.6038/cjg2018L0146
Krey, T. C. (1963). Channel waves as a tool of applied geophysics in coal mining. Geophysics 28 (5), 701–714. doi:10.1190/1.1439258
Li, S. C., Ren, Y. X., Liu, L. B., Xu, X. J., Liu, B., and Zhang, Q. S. (2019). Reverse time migration of seismic forward-prospecting data in tunnels based on beamforming methods. Rock Mech. Rock Eng. 52 (9), 3261–3278. doi:10.1007/s00603-019-01763-2
Liang, Q. H., and Song, J. (2009). Advanced detection theory and experimental research of multi-wave and multi-component seismic exploration in mine. J. Cent. South Univ. (Sci. Tec.) 40 (5), 238–244. CNKI:SUN:ZNGD.0.2009-05-038.
Liu, B., Wang, J. S., Ren, Y. X., Guo, X., Chen, L., and Liu, L. B. (2022). Decoupled elastic least-squares reverse time migration and its application in tunnel geologic forward prospecting. Geophysics 87 (1), EN1–EN19. doi:10.1190/GEO2020-0875.1
Liu, S. D., Guo, L. Q., and Zhang, P. S. (2006). Experiment and application study of fore detecting by MSP method for geological structure in laneway. Chin. J. Eng. Geophys. 3 (6), 437–442. doi:10.3969/j.issn.1672-7940.2006.06.004
Lu, X. L., Hu, X. Q., Xu, Z. Y., Liao, X., Liu, L. H., and Fu, Z. H. (2022). Tunnel concealed karst cave joint detection by tunnel Seismic and transient electromagnetic. Lithosphere 1, 2827582. doi:10.2113/2022/2827582
Luo, S., Lu, G. Y., Zhu, Z. Q., and Xia, C. Z. (2020). Vector P-and S-wave pre-stack reverse-time migration for tunnel spaces. Near Sur. Geophys. 18 (6), 683–695. doi:10.1002/nsg.12121
Lüth, S., Giese, R., Otto, P., Krüger, K., Mielitz, S., Bohlen, T., et al. (2008). Seismic investigations of the piora basin using S-wave conversions at the tunnel face of the piora adit (gotthard base tunnel). Int. J. Rock Mech. Min. Sci. 45 (1), 86–93. doi:10.1016/j.ijrmms.2007.03.003
Rad, P. B., Schwarz, B., Gajewski, D., and Vanelle, C. (2018). Common-reflection-surface-based prestack diffraction separation and imaging. Geophysics 83 (1), S47–S55. doi:10.1190/GEO2016-0445.1
Shen, Y. H., Li, Q. C., and Feng, H. (2009). Migration imaging for tunnel reflected-wave seismic prediction ahead. J. China Coal Soc. 34 (3), 298–304. CNKI:SUN:MTXB.0.2009-03-003.
Teng, J. W., Li, S. Y., Jia, M. K., Lian, J., Liu, H. L., Liu, G. D., et al. (2019). Research and application of in seam seismic survey technology for disaster-causing potential geology anomalous body in coal seam. Acta Geol. Sin. Engl. Ed.) 94 (1), 10–26. doi:10.1111/1755-6724.14372
Wang, B., and Huag, L. Y. (2022). A polarization migration velocity model building method for geological prediction ahead of the tunnel face. Front. Earth Sci. 8, 857984. doi:10.3389/feart.2022.857984
Wang, B., Huang, L. Y., Liu, S. D., Zhou, F. B., Jin, B., Sun, H. C., et al. (2019). Polarization migration of multi-component seismic data for survey in the tunnel of mountain cities. J. Environ. Eng. Geophys. 24 (4), 569–578. doi:10.2113/JEEG24.04.569
Xi, X., and Huang, J. Q. (2020). Location and imaging of scatterers in seismic migration profiles based on convolution neural network. Chin. J. Geophys. 63 (2), 687–714. doi:10.6038/cjg2020M0490
Xia, F., Dong, L. G., and Ma, Z. T. (2004). The numerical modeling of 3-D elastic wave equation using a high-order, staggered-grid, finite difference scheme. Appl. Geophys. 1 (1), 38–41. doi:10.1007/s11770-004-0028-7
Yang, S. T., and Chen, J. L. (2010). Numerical simulation of fore detecting with seismic in coal roadway and study of wave field characteristics. J. China Coal Soc. 35 (10), 1633–1637. doi:10.1360/972010-741
Yang, S. T., Wei, J. Q., Cheng, J. L., Shi, L. Q., and Wen, Z. J. (2016). Numerical simulations of full-wave fields and analysis of channel wave characteristics in 3-D coal mine roadway models. Appl. Geophys. 13 (4), 621–630. doi:10.1007/s11770-016-0582-9
Zhang, J. F., and Zhang, J. J. (2014). Diffraction imaging using shot and opening-angle gathers: A prestack time migration approach. Geophysics 79 (2), S23–S33. doi:10.1190/GEO2013-0016.1
Zhang, J., Liu, S. D., Yang, C., Liu, X., and Wang, B. (2021). Detection of urban underground cavities using seismic scattered waves: A case study along the xuzhou metro line 1 in China. Near Sur. Geophys 19 (1), 95–107. doi:10.1002/nsg.12132
Keywords: roadway advanced detection, fault, seismic imaging, scattered wave, coal mine
Citation: Zhang J, Xiao W, Li C and Liu S (2023) Advanced detection for faults in front of coal mine roadways using seismic scattered waves. Front. Earth Sci. 10:1095297. doi: 10.3389/feart.2022.1095297
Received: 11 November 2022; Accepted: 09 December 2022;
Published: 04 January 2023.
Edited by:
Tianshou Ma, Southwest Petroleum University, ChinaReviewed by:
Jing Bi, Guizhou University, ChinaCopyright © 2023 Zhang, Xiao, Li and Liu. This is an open-access article distributed under the terms of the Creative Commons Attribution License (CC BY). The use, distribution or reproduction in other forums is permitted, provided the original author(s) and the copyright owner(s) are credited and that the original publication in this journal is cited, in accordance with accepted academic practice. No use, distribution or reproduction is permitted which does not comply with these terms.
*Correspondence: Shengdong Liu, bWlhMjAxN0BhbGl5dW4uY29t
Disclaimer: All claims expressed in this article are solely those of the authors and do not necessarily represent those of their affiliated organizations, or those of the publisher, the editors and the reviewers. Any product that may be evaluated in this article or claim that may be made by its manufacturer is not guaranteed or endorsed by the publisher.
Research integrity at Frontiers
Learn more about the work of our research integrity team to safeguard the quality of each article we publish.