 Zhuo Chen
 Huiqi Ren
 Huijun Ning2
- 1College of Civil Engineering and Mechanics, Xiangtan University, Xiangtan, China
- 2Institute of Defense Engineering, AMS, PLA, Luoyang, China
The flow field characteristics of blast simulators with the explosive-driven method and compression-driven method have been extensively investigated; however, limited effort has been made to the flow field in blast simulators combined-driven by explosive charge and compressed gas. In this paper, the finite volume method governed by the Navier–Stokes equation based on an explosive detonation and k-omega SST turbulence equation was used to analyze the flow field characteristics of blast simulators with three kinds of drive methods, namely, explosive-driven method, compression-driven method, and combined-driven method. The results show that the numerical method could simulate the flow field characteristics of the blast simulators with the explosive-driven method and compression-driven method accurately by comparing to the experimental data. Also, the influence of air turbulence on the explosion flow field cannot be neglected in the case of long running time. It is obtained that the combined-driven method could increase the pressure peak value of shock waves and extends positive pressure duration effectively, owing to the interaction of the shock waves generated from the explosive detonation and the rarefaction wave formed by rupturing the diaphragm. The first overpressure peak value, the second overpressure peak value, and the positive pressure duration obtained by the combined-driven method of 5 kg TNT and 0.3 MPa compressed gas were 1.669 times, 2.172 times, and 2.308 times more than those obtained by the explosive-driven method of 5 kg TNT, respectively. The maximum overpressure and positive pressure duration obtained by the combined-driven method of 5 kg TNT and 0.3 MPa compressed gas were 2.56 times and 1.162 times more than those obtained by the compression-driven method of 0.3 MPa compressed gas, respectively. Moreover, various shock wave environments could be simulated by controlling the charge mass of explosive charge and the initial pressure of compressed gas.
1 Introduction
At present, many important economic targets are threatened by typhoons and accidental explosions (Sun and Wang, 2019; Hua et al., 2020). Engineering structures are subject to strong impact loads when faced with such disasters (Li and Ma, 2018; He et al., 2022). A blast simulator is a shock tube that can be used to simulate shock waves on the ground and can perform dynamic impact tests on most ground engineering structures. It is of great significance for the anti-explosive impact protection of ground targets and evaluation of the destructive ability of natural disasters. There are three drive methods to obtain the shock wave for the test, namely, explosive-driven method, compression-driven method, and combined-driven method, by explosive charge and compressed gas (Ren et al., 2014).
Many studies have been carried out on the explosion flow field of explosive-driven blast simulators and similar devices. Li et al. (2019) and Kong et al. (2021) investigated the flow field evolution and the shell response of explosive vessels when subjected to the explosion of a central charge. Wang et al. (2021a) studied the propagation law of explosion waves in an explosion vessel under negative pressure and obtained the explosion wave parameters at different vacuum degrees. It was found that the lower the initial ambient pressure, the faster the propagation speed of the explosion wave. Yao et al. (2012) simulated the dynamic response process of the thick-walled driver tube subjected to internal cylindrical charge explosion with the finite element software ANSYS/LS-DYNA. The paper then investigated the explosion flow field in the tube and the dynamic response of the tube. Stewart (2019) designed a conical shock tube that can simulate a large free-field explosion with a small amount of explosives.
The flow field in compression-driven shock tubes also has been extensively investigated. Mukhambetiyar et al. (2017) numerically analyzed the effects of the initial pressure, tube diameter, viscous boundary, and wall boundary condition on the flow field of the micro shock tube. The thickness and material of the diaphragm also influence the flow characteristics of the shock tube (Schulz and Skews, 2020; Singh et al., 2020; Sardarzadeh and Zamani, 2021). Isaac and Jagadeesh (2020) conducted blast loading experiments on metal plates with a conical shock tube driven by compressed gas. The results showed that the device can be used as an alternate technique to safely carry out impulsive loading experiments. Whalley and Skews (2018) studied the flow field which results from an expansion wave entering a cavity from an upstream tube and the focusing effect which occurs. Luan et al. (2018) simulated the flow field of a shock tube with a small exit nozzle. Dey et al. (2018) used a shock tube to investigate the interaction between the shock wave and three objects, namely, cone, sphere, and circular disc. Barik et al. (2020) used a shock tube and studied the effect of bending pre-strain and pressure on the forming behavior of AA5052−H32 sheets. Gan et al. (2020) demonstrated the advanced blast simulator that could generate a far-field blast environment accurately and suit high-precision and repeatable explosion testing of various building components. Kochavi et al. (2020) designed a blast simulator that could simulate the damage to biological models from the blast environment generated by 3.5 kg of spherical TNT. Diao et al. (2020) investigated the effect of vibration on the dynamic calibration of pressure sensors based on a shock tube system.
The aforementioned studies have played a good role in promoting the study of the flow field of blast simulators. However, the experimental and numerical research projects are limited to the single drive method, and no turbulence model was added to consider the effect of air turbulence on the blast flow field. Ren et al. (2014) designed a large blast simulator and proposed that the blast simulator could accurately simulate various explosion environments with the multi-barrel explosive-driven method, multiple-diaphragm compression-driven method, and combined-driven method by explosive charge and compressed gas. It is believed that the blast simulator combined-driven by an explosive charge and compressed gas could control the positive pressure duration and pressure peak value to simulate the air shock wave generated from the explosion of various weapons by changing the initial pressure and charge mass. However, he did not investigate further the evolution of the flow field in combined-driven blast simulators. From the current research situation, the understanding of the flow field evolution mechanism of the combined-driven blast simulator is not deep enough, and there are few studies on the influence of air turbulence on the blast flow field. In this paper, the Navier–Stokes (NS) equation based on explosive detonation and k-omega SST turbulence equation was used to consider the effects of air turbulence. The flow fields of the blast simulator with three different drive methods were simulated separately by using the finite volume method. The accuracy of the numerical method in simulating the flow field of the blast simulator was verified. The unsteady flow field characteristics in the blast simulator with the three drive methods are analyzed. The influence mechanism of the charge mass and initial pressure of the driver section on the overpressure peak value and positive pressure duration was revealed.
2 Computational model and numerical method
2.1 Computational model
The schematic of the computational model and mesh of the blast simulator is depicted in Figure 1. The explosion chamber of the device is 20 m long and 3 m in diameter, the length of the transition section is 4.5 m, and the experiment section is 30 m long and 2.36 m in diameter. The explosives are arranged in the explosion chamber and then detonated to form a shock wave if using the explosive-driven method. If the compression-driven method is chosen, the explosion chamber and transition section are filled with compressed gas, and the shock wave can be formed by rupturing the diaphragm between the transition and the experiment section. The sum of the explosion chamber and the transition section can be regarded as the driver section. The combined-driven method can be achieved by combining both methods.
FIGURE 1. Schematic of a computational model and mesh. (A) Computational model. (B) Mesh.
The mesh discretization of the device’s interior and exit areas is carried out. The axis of the closed end of the explosion chamber was defined as the coordinate origin. The inner wall of the blast simulator is modeled as a no-slip boundary on which wall functions are activated for turbulent kinetic energy and specific dissipation rate. A continuous wall function based on Spalding’s law (Spalding, 1961) switching between low- and high-Reynolds numbers is implemented for the turbulent viscosity. The initial values for turbulent kinetic energy and specific dissipation rate in the computational domain are specified as small values approaching 0. The outlet is defined as a non-reflecting boundary. The initial values for pressure and temperature in the computational domain are set to 101,325 Pa and 288.15 K, respectively.
2.2 Numerical method
In this paper, the numerical simulations were performed using the blastFoam solver developed based on OpenFoam (Heylmun et al., 2019). BlastFoam could simulate the activation of energetic materials and support modeling multi-material detonation (Jiang et al., 2022). The N-S equation is composed of the continuity equation, the momentum equation, and the energy equation, which could be expressed by the following formulas:
where ρ is the mixture density, V is the mixture velocity, z is the axial coordinate, r is the radial coordinate, w is the axial velocity, u is the radial velocity, E is the total energy, h is enthalpy, and p is the pressure. αA and ρA are the volume fraction and density of the air phase, respectively. αT and ρT are the volume fraction and density of the TNT phase, respectively. qr and qz are the respective radial and axial heat fluxes.
The TNT phase includes the solid TNT and detonation product of TNT. The solid TNT adopts the Birch–Murnaghan equation (Murnaghan, 1944), and the pressure of the solid TNT is
where pref is the reference pressure and ρref is the reference density. κ and κ0 are constants, i.e., κ=9.6e9 and κ0=6.6.
The detonation product of a TNT charge adopts the Jones–Wilkins–Lee (JWL) equation of state (Lee and Tarver, 1980), and the pressure of the detonation product is
where V0 is the specific volume; e is the initial specific internal energy; and A, B, R1, R2, and ωT are constants, i.e., A=527.28e9, B=6.3e9, R1=4.71, R2=1.07, and ωT =0.29.
The energy released during the reaction of solid TNT into TNT burst products could be expressed by the following formulas:
where x is the coordinate of the grid center, xdet is the coordinate of the detonation point, and vdet is the detonation velocity.
The air adopts the ideal gas equation of state (Luccioni et al., 2009), and the pressure of the air is
where γ is the ratio of the specific heat, and p and ρA are the pressure and density of air, respectively.
To simulate the viscous flow field of air, the k-omega SST turbulence model by Menter (1994) is used, which is expressed by the following formulas,
where k is the turbulent kinetic energy, ω is the specific dissipation rate, μ is the molecular viscosity, μt is the turbulent viscosity, Pk is the generation of turbulent kinetic energy due to mean velocity gradients, and F1 is the blending functions. β1, β2, β*, σk1, σk2, σω1, and σω2 are constants, i.e., β1=0.075, β2=0.0828, β*=0.09, σk1=0.85, σk2=1, σω1=0.5, and σω2=0.856.
The first-order time derivative term adopts the second-order Runge–Kutta method by Spiteri and Ruuth (2002). The flux scheme is the Kurganov scheme by Kurganov and Tadmor (2000). The interpolation scheme from the cell center to the surface center is cubic interpolation. In addition, the gradient scheme is cellMDLimited leastSquares 1.0, the surface normal gradient scheme is corrected, and the Laplacian scheme is Gauss linear-corrected.
3 Verification of the numerical method
3.1 Verification of the discretization schemes
The one-dimensional shock tube problem is selected to verify the accuracy of the discretization schemes. The JWL equation of state parameters for the detonation product are defined as A=8.545e11, B=2.05e10, ωT=0.25, R1=4.6, R2=1.35, and ρT=1840 kg/m3. The initial condition is
Figure 2 shows the pressure, density, and velocity in space at the moment of 0.012 ms. The numerical solutions agree well with the exact solutions. The results show that the discretization schemes have a good ability to capture the shock and discontinuity.
FIGURE 2. Comparison of numerical solutions and exact solutions. (A) Pressure. (B) Density. (C) Velocity.
3.2 Verification of the numerical model with an explosive-driven method
As shown in Figure 3, the experiment used the method of the combination of detonating cord and TNT charge. The total length of the detonating cord is 10 m. The mass of the TNT block is 0.2 kg, and the density is 1630 kg/m3. The total mass of the TNT charge is 5 kg. The TNT blocks were evenly arranged on the 5-m detonating cord. The detonation point was located on the left end of the TNT charge and 10 m from the closed end wall of the explosion chamber. The pressure sensor was arranged in the experiment section at 6.8 m from the exit of the transition section. The turbulence and wall boundary layer might affect the flow field of the explosive-driven blast simulator. Case 1 and Case 2 were calculated separately to study the flow field in the blast simulator using the inviscid model and the k-omega SST model under the same 5 kg charge mass.
FIGURE 3. Combination of the detonating cord and TNT charge.
The overpressure histories of the simulation and experiment are shown in Figure 4, and the overpressure peak value and relative error are listed in Table 1, specifically. The first overpressure peak value of case 1 and case 2 matches well with the experimental result, and the relative errors are 0.7% and 2.8%, respectively. However, compared with the experimental result, the second overpressure peak value is higher and the time for the second shock wave to reach the sensor is faster by case 1, and the relative error of the peak value is 35.5%. The second peak value by case 2 is in better agreement with the test results, and the relative error is just 4.3%, that means the turbulence of air has little effect on the shock wave intensity in a short time. Nonetheless, the air turbulence expends the energy of shock waves and airflow constantly with the increase of time. Therefore, the second overpressure peak value of case 1 is higher than the experimental result. It could be verified that the numerical method in this paper could simulate the flow field of the blast simulator with the explosive-driven method accurately and the addition of the k-omega SST model could effectively improve the accuracy of the calculation.
FIGURE 4. Overpressure history of the experiment and simulation.
TABLE 1. Results of the experiment and simulation with the explosive-driven method.
3.3 Verification of a numerical model with the compression-driven method
To validate the applicability of the numerical method used to simulate the flow field of the compression-driven shock tube, the results of the simulations and experiments (Wang et al., 2021b) were compared. The shock tube is 2.1 m in length, and both ends are closed walls. The driver section was filled in high-pressure gas, and the driven section was filled in low-pressure gas. The shock wave could be formed by breaking the diaphragm. The initial pressure in the driver section and driven section of case 3 is 0.3595 MPa and 0.0895 MPa, respectively. The initial pressure in the driver section and driven section of case 4 is 0.5687 MPa and 0.0887 MPa, respectively. The initial temperature in the shock tube of case 3 and case 4 is 285 k and 282 k, respectively.
The speed of shock wave at 2.2 ms and 2 ms in case 3, case 4, and experiments are listed in Table 2. The relative error of the wave velocity of case 3 and case 4 is 0.49% and 2%, respectively. Therefore, the numerical method in this paper could simulate the flow field of the blast simulator with the compression-driven method accurately.
TABLE 2. Results of the experiment and simulation with the compression-driven method.
In conclusion, the numerical method in this paper could not only simulate the explosion flow field in a blast simulator driven by explosives but also calculate the flow field in a blast simulator driven by compressed gas. Considering the effects of air turbulence by adding the k-omega SST model could improve the accuracy of the blast flow field effectively. Therefore, the numerical method could be used to simulate the flow field in a combined-driven blast simulator.
4 Analysis of a flow field in the blast simulator with three drive methods
As shown in Table 3, 15 cases have been simulated to study the flow field of the blast simulator under three drive methods by using the computational model and numerical method in this paper. The TNT charge was set to a continuous column, and the distance between the closed wall and the charge is 10 m. The diameter of the charge is 40 mm, and the charge could be changed by adjusting the length of the column. The detonation of the TNT charge and the rupture of the diaphragm at t=0 m are observed in cases 11–18. The gauging point 1 and gauging point 2 were arranged in the experiment section. Gauging point 1 is 6.8 m from the exit of the transition section, and gauging point 2 is 5 m from the exit of the experiment section.
TABLE 3. Initial condition of simulated cases with three drive methods.
4.1 Explosive-driven method
Cases 5–7 simulated the flow field of the blast simulator with the explosive-driven method, and three conditions with the charge amount of 3 kg, 5 kg, and 7 kg were selected. Figure 5 shows the time evolutions of overpressure of case 6, Figure 6 shows the time history of the overpressure at the gauging point 1 and gauging point 2 of cases 5–7, respectively. It could be seen that the blast wave was reflected back and forth on the inner wall, and each reflection created a shock wave that propagated to each side. Because of the change in the cross area of the transition section, the left reflected shock wave was formed when the right blast wave reached the transition section. The left reflected shock wave generated a reflected shock wave when it reached the wall of the closed end, and the reflected wave reached the measuring point 1 at 159 ms. Therefore, the third peak appeared on the overpressure–time curve which represents the passage of this shock wave. A right strong shock wave was formed at 21 m after multiple right shock waves passed through the transition section. The strong right shock wave reached probe 1 at 35 ms and formed the first wave peak on the overpressure–time curve. Also, a right reflected shock wave was generated when the left blast wave reached the closed end of the explosion chamber at 18.5 ms. The second peak appeared on the overpressure history when the right reflected shock wave reached the gauging point at 82 ms. Then, a left rarefaction wave was formed after the right shock wave arrived and diffracted at the exit of the device at 89 ms, which caused the pressure inside the device to drop continuously. At last, two left shock waves were formed at the exit of the experiment section and moved toward the interior of the device when the pressure in the blast simulator was lower than the pressure of the external environment. It could be seen that two weak shock waves were propagating upstream at 215 ms, and the fourth and fifth peaks appeared on the overpressure–time curve at measuring point 1.
FIGURE 5. Time evolutions of case 6 (explosive-driven method). (A) 0.5 ms. (B) 1.5 ms. (C) 3 ms. (D) 8 ms. (E) 18.5 ms. (F) 21 ms. (G) 35 ms. (H) 82 ms. (I) 89 ms. (J) 215 ms.
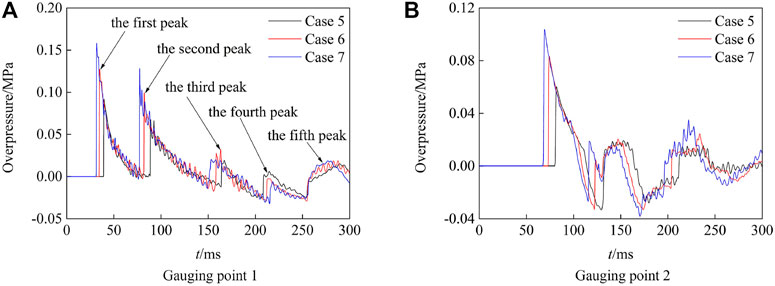
FIGURE 6. Overpressure history with the explosive-driven method. (A) Gauging point 1. (B) Gauging point 2.
The positive pressure duration at the gauging point 1 is taken as the sum of the positive pressure duration of the first and second shock waves since the intensity of the third, fourth, and fifth shock waves is weak. It could be obtained that increasing the charge of TNT can improve the peak value and extend the positive pressure duration; however, the difference in the positive pressure duration between case 6 and case 7 is small. This is because the downward section of the first and second shock waves of cases 5–7 is approximate, and the second shock wave arrived at probe 1 when the pressure peak was decreasing to the negative pressure if the TNT charge exceeds 5 kg. Therefore, the positive pressure duration at probe 1 was increased due to improving the velocity magnitude of the first shock wave if the charge mass is higher than 5 kg. The contrast of Figures 6A, B shows that the farther the gauging point from the detonation point, the faster the rarefaction wave reaches the gauging point, the lower the overpressure peak value of the gauging point, and the shorter the positive pressure duration.
4.2 Compression-driven method
Cases 8–10 simulated the flow field of the blast simulator with the compression-driven method, and the initial pressure in the driver section was 0.2 MPa, 0.3 MPa, and 0.4 MPa. Figure 7 shows the time evolution of overpressure of case 9, and Figure 8 shows the overpressure history of cases 8–10 at the probe. It could be seen that the right shock wave and left rarefaction wave were generated by breaking the diaphragm. The overpressure increased rapidly when the right shock wave reached the probes. Then, the right compression wave reached the probes that were formed when the left rarefaction wave passed through the transition section. Therefore, there is a slow rising segment on the overpressure–time curve. A right reflected rarefaction wave was formed when the left rarefaction reached the closed end of the explosion chamber at 72 ms and propagated to the measuring point 1 at 145 ms. A left rarefaction wave reached probe 1 at 187 ms that was subsequently formed when the right shock wave propagated to the exit of the experiment section. Hence, the overpressure from the platform segment at probe 1 decreased constantly to the negative pressure.
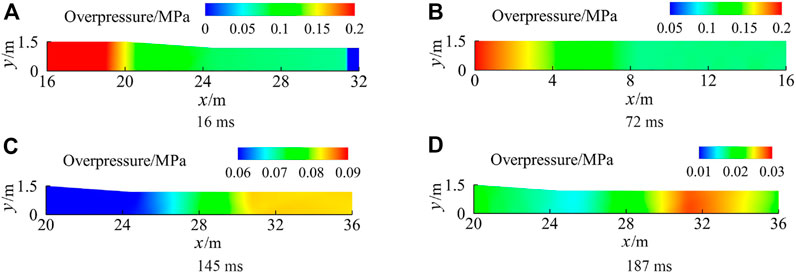
FIGURE 7. Time evolutions of case 9 (compression-driven method). (A) 16 ms. (B) 72 ms. (C) 145 ms. (D) 187 ms.
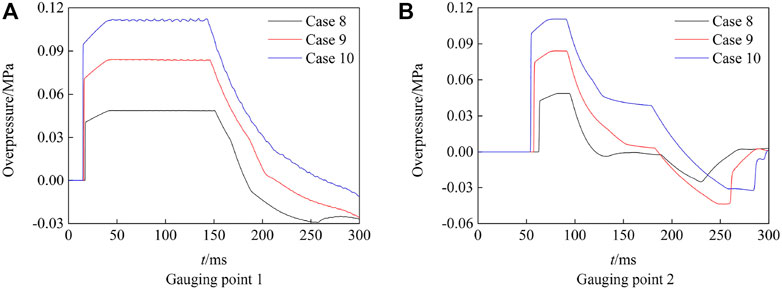
FIGURE 8. Overpressure history with the compression-driven method. (A) Gauging point 1. (B) Gauging point 2.
It could be obtained that increasing the pressure of compressed gas could improve the overpressure of the flow field and extend the positive pressure duration in this blast simulator under the compression-driven method. The comparison with Figures 8A, B shows that the closer the location away to the exit of the blast simulator, the shorter the time of the platform segment of the overpressure-time curve, and the shorter the positive pressure duration. However, the overpressure of the platform segment at probe 1 and probe 2 has little change. Hence, it should control the suitable time of the platform segment and positive pressure duration by adjusting the location of the target in the experiment section to simulate the triangle waveform generated by explosion.
4.3 Combined-driven method
Cases 11–19 simulated the flow field of the blast simulator with the combined-driven method, where the charge is 3 kg, 5 kg, and 7 kg, and the initial pressure is 0.2 MPa, 0.3 MPa, and 0.4 MPa. Figure 9 shows the wave system contour on the axis of space-time of case 15, Figure 10 shows the time evolutions of the overpressure of case 15, and Figure 11 shows the overpressure–time curve of case 11–19. The right shock wave and right compression wave generated by breaking the diaphragm were the first to reach probe 1. The dashes in Figure 9 represent the velocity magnitude of the shock wave and reflected shock wave before they met the rarefaction wave. The intensity of the shock waves was improved after the shock waves met the rarefaction wave. The right blast wave reached probe 1 at 37.5 ms and generated the first peak on the overpressure–time curve. The reflected shock wave reached probe 1 at 87.5 ms and formed the second overpressure peak on the overpressure–time curve. At last, the right reflected rarefaction wave and the left rarefaction wave formed from the exit of the experiment section reached probe 1 in return, which caused the overpressure at probe 1 to decrease gradually to the negative pressure.
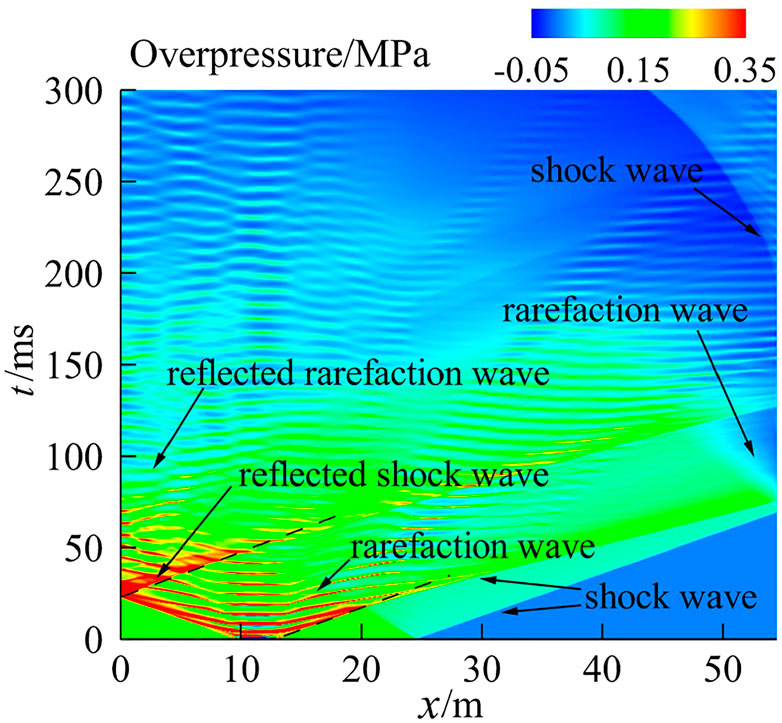
FIGURE 9. Wave system contour of space-time of case 15 (combined-driven method).
FIGURE 10. Time evolutions of case 15 (combined-driven method). (A) 1.5 ms. (B) 15 ms. (C) 37.5 ms. (D) 87.5 ms.
FIGURE 11. Overpressure history with the combined-driven method. (A) Gauging point 1 (Case 11–13). (B) Gauging point 2 (Case 11–13). (C) Gauging point 1 (Case 14–16). (D) Gauging point 2 (Case 14–16). (E) Gauging point 1 (Case 17–19). (F) Gauging point 2 (Case 17–19).
The comparison with the overpressure histories of measuring point 1 and measuring point 2 in Figure 11 shows that the closer the exit of the device, the lower the overpressure peak value, the shorter the positive pressure duration, and the shorter the slow rising segment. The blast wave had caught up with the shock wave generated by breaking the diaphragm before it reached probe 2 in case 17. Therefore, there is no slow-rising segment on the overpressure history of probe 2. It could be obtained that the pressure peak value is related to the charge mass and the initial pressure of the driver section, and the positive pressure duration could be improved primarily by increasing the initial pressure.
The overpressure and positive pressure duration of cases 5–19 are listed in Table 4 specifically. In contrast to the numerical results of cases 5–10, the explosive-driven method has a shorter positive pressure duration than the compression-driven method; however, it could get the triangle waveform to simulate weapon explosion. In contrast to case 6 and case 15, the combined-driven method increases the first and second peaks by 66.9% and 117.2%, respectively, and the duration of a positive pressure is prolonged by 130.8% under the same 5 kg charge. Comparing case 9 and case 15, the combined-driven method increases the maximum overpressure by 156%, and the duration of a positive pressure is prolonged by 16.2% under the same initial gas pressure of 0.3 MPa. It could be concluded that the combined-driven method can effectively improve the pressure peak value, solve the problem of the short positive pressure duration using the explosive-driven method, and can also make up for the defect of the platform section of the pressure waveform in the experiment section with the compression-driven method. Moreover, various pressure waveforms can be obtained by adjusting the charge and the initial pressure in the driver section to simulate different explosion environments.
TABLE 4. Results of cases at gauging point 1 with three drive methods.
5 Conclusion
The present paper validated the effectiveness of the numerical method with the explosive-driven method and compression-driven method and studied the characteristics of the flow field in a blast simulator with three drive methods by using the finite volume method governed by the N-S equation based on the explosive detonation and k-omega SST turbulence equation. The results are as follows:
1) the numerical method and physical model could accurately simulate the flow field characteristics in the blast simulators with the explosive-driven method and compression-driven method. The calculated results are in good agreement with the experimental results. The results show that it is necessary to consider the influence of the air turbulence, owing to the fact that they can reduce the intensity of shock waves and the velocity magnitude of the jet stream constantly with the increase of experimental time in the blast simulator. Therefore, the numerical method can be used to simulate the flow field in a combined-driven blast simulator.
2) The explosive-driven method could improve the pressure peak value of the shock wave in the experiment section effectively by increasing the charge; however, the positive pressure duration is shorter than that of the compression-driven method. The overpressure of the whole waveband and positive pressure duration could be improved by increasing the initial pressure of the driver section with the compression-driven method, but there is a platform segment in the pressure waveform of the experiment section. It should control the suitable time of a platform segment and positive pressure duration by adjusting the location of the target in the experiment section to approximately simulate the triangle waveform generated by weapon explosion.
3) The intensity of the right blast waves was enhanced after they met the left rarefaction wave in the blast simulator with the combined-driven method. Therefore, the overpressure peak value was improved and the positive pressure duration was extended further. Also, the combined drive could make up for the shortages of the explosive-driven method and compression-driven method. The first overpressure peak value, the second overpressure peak value, and positive pressure duration obtained by the combined-driven method of 5 kg TNT and 0.3 MPa compressed gas were 1.669 times, 2.172 times, and 2.308 times more than those obtained by the explosive-driven method of 5 kg TNT, respectively. The maximum overpressure and positive pressure duration obtained by the combined-driven method of 5 kg TNT and 0.3 MPa compressed gas were 2.56 times and 1.162 times compared to those obtained by the compression-driven method of 0.3 MPa compressed gas, respectively. Moreover, the combined drive could simulate various blast environments by controlling the charge and initial pressure.
The current work systematically analyzed the unsteady flow field in the blast simulator with three drive methods, which could provide technical support for the design similar to a shock tube and disaster prevention of engineering structures.
Data availability statement
The original contributions presented in the study are included in the article/supplementary material; further inquiries can be directed to the corresponding author.
Author contributions
Conceptualization: HN, methodology: SZ, software: ZC, validation: ZC, formal analysis: HN, investigation: HR, resources: ZL, data curation: ZC, writing: ZC, writing—review and editing: HR, visualization: ZC, supervision: KH, project administration: HR, and funding acquisition: ZC.
Funding
This paper is supported by the Postgraduate Scientific Research Innovation Project of Xiangtan University (XDCX2019B105).
Conflict of interest
The authors declare that the research was conducted in the absence of any commercial or financial relationships that could be construed as a potential conflict of interest.
Publisher’s note
All claims expressed in this article are solely those of the authors and do not necessarily represent those of their affiliated organizations, or those of the publisher, the editors, and the reviewers. Any product that may be evaluated in this article, or claim that may be made by its manufacturer, is not guaranteed or endorsed by the publisher.
References
Barik, S. K., Narayanan, R. G., and Sahoo, N. (2020). Forming response of AA5052–H32 sheet deformed using a shock tube. T NONFERR METAL. Soc. 30, 603–618. doi:10.1016/S1003-6326(20)65239-6
Dey, S., Murugan, T., and Chatterjee, D. (2018). Numerical visualization of blast wave interacting with objects. J. Appl. Fluid Mech. 11, 1201–1206. doi:10.29252/jafm.11.05.28240
Diao, K., Yao, Z., Wang, Z., Liu, X., Wang, C., and Shang, Z. (2020). Investigation of vibration effect on dynamic calibration of pressure sensors based on shock tube system. Measurement 149, 107015. doi:10.1016/j.measurement.2019.107015
Gan, E. C. J., Remennikov, A. M., Ritzel, D., and Uy, B. (2020). Approximating a far-field blast environment in an advanced blast simulator for explosion resistance testing. Int. J. Prot. Struct. 11, 468–493. doi:10.1177/2041419620911133
He, Y., Liu, Y., Wu, M., He, Y., and Fu, J. (2022). Observational study of typhoon effects on the oval-shaped 330 m high Zhuhai Center Tower. J. Build. Eng. 60, 105135. doi:10.1016/j.jobe.2022.105135
Heylmun, J., Vonk, P., and Brewer, T. (2019). blastFoam 2.0 user guide. Texas: Synthetik Applied Technologies, LLC.
Hua, X. G., Xu, K., Wang, Y. W., Wen, Q., and Chen, Z. Q. (2020). Wind-induced responses and dynamic characteristics of a super-tall building under a typhoon event. Smart Struct. Syst. 25, 81–96. doi:10.12989/sss.2020.25.1.081
Isaac, O. S., and Jagadeesh, G. (2020). Impulse loading of plates using a diverging shock tube. Exp. Mech. 60, 565–569. doi:10.1007/s11340-019-00573-5
Jiang, C., Pan, J., Zhu, Y., Li, J., and Quaye, E. K. (2022). Development and verification of a high-speed compressible reactive flow solver in OpenFOAM. J. Comput. Sci. 63, 101780. doi:10.1016/j.jocs.2022.101780
Kochavi, E., Gruntman, S., Ben-Dor, G., Sherf, I., Melrovich, E., Amir, B., et al. (2020). Design and construction of an in-laboratory novel blast wave simulator. Exp. Mech. 60, 1149–1159. doi:10.1007/s11340-020-00650-0
Kong, X., Wang, Z., Kuang, Z., Zhou, H., Zheng, C., and Wu, W. (2021). Experimental study on the mitigation effects of confined-blast loading. Explos. Shock Waves 41, 062901. doi:10.11883/bzycj-2020-0193
Kurganov, A., and Tadmor, E. (2000). New high-resolution central schemes for nonlinear conservation laws and convection—diffusion equations. J. Comput. Phys. 160, 241–282. doi:10.1006/JCPH.2000.6459
Lee, E. L., and Tarver, C. M. (1980). Phenomenological model of shock initiation in heterogeneous explosives. Phys. Fluids 23, 2362–2372. doi:10.1063/1.862940
Li, J., and Ma, D. (2018). The studies for building failure characteristics of the extraordinarily fire explosion accident in Tianjin Port. KSCE J. Civ. Eng. 22, 718–724. doi:10.1007/s12205-017-1339-6
Li, Z., Wang, S., Jiang, H., Zhang, Y., and Yuan, J. (2019). Experimental studies on characteristics of explosion pressure loading cylinder apparatus. Explos. Shock Waves 39, 14–21. doi:10.11883/bzycj-2018-0327
Luan, Y., Olzmann, M., and Magagnato, F. (2018). Simulation of a shock tube with a small exit nozzle. J. Therm. Sci. 27, 34–38. doi:10.1007/s11630-018-0981-8
Luccioni, B., Ambrosini, D., Nurick, G., and Snyman, I. (2009). Craters produced by underground explosions. Comput. Struct. 87, 1366–1373. doi:10.1016/J.COMPSTRUC.2009.06.002
Menter, F. R. (1994). Two-equation eddy-viscosity turbulence models for engineering applications. AIAA J. 32, 1598–1605. doi:10.2514/3.12149
Mukhambetiyar, A., Jaeger, M., and Adair, D. (2017). CFD modelling of flow characteristics in micro shock Tubes. J. Appl. Fluid Mech. 10, 1061–1070. doi:10.18869/acadpub.jafm.73.241.27474
Murnaghan, F. D. (1944). The compressibility of media under extreme pressures. Proc. Natl. Acad. Sci. U. S. A. 30, 244–247. doi:10.1073/PNAS.30.9.244
Ren, H., Wang, S., Zhou, S., and Wang, W. (2014). “Development and application of a large blast-wave simulator,” in Proceedings of the 16th Chinese National Symposium on Shock Waves, Luoyang, China, 10–22.
Sardarzadeh, F., and Zamani, J. (2021). Experimental study of a disk diaphragm thickness influence on a planar shock wave formation and position during its propagation in a gas shock tube. Exp. Tech. 45, 497–508. doi:10.1007/s40799-020-00412-6
Schulz, J., and Skews, B. (2020). Shock tube exit flow fields through thin membranes. J. Vis. (Tokyo). 23, 215–229. doi:10.1007/s12650-020-00627-0
Singh, A., Satheesh Kumar, A., and Kannan, B. T. (2020). Experimental investigation of diaphragm material combinations in a small-scale shock tube. Aircr. Eng. Aerosp. Technol. 93, 42–50. doi:10.1108/AEAT-07-2019-0148
Spalding, D. B. (1961). A single formula for the “law of the wall”. ASME. J. Appl. Mech. 28, 455–458. doi:10.1115/1.3641728
Spiteri, R. J., and Ruuth, S. J. (2002). A new class of optimal high-order strong-stability-preserving Time discretization methods. SIAM J. Numer. Anal. 40, 469–491. doi:10.1137/S0036142901389025
Stewart, J. B. (2019). Approximating a free-field blast environment in the test section of an explosively driven conical shock tube. Shock Waves 29, 355–360. doi:10.1007/s00193-018-0811-7
Sun, F., and Wang, G. (2019). Investigation of an accidental explosion caused by reaction runaway of a mixture containing copper acetylide and butynediol. J. Loss Prev. Process Ind. 62, 103967. doi:10.1016/j.jlp.2019.103967
Wang, Z., Ren, H., Zhang, H., Li, X., and Zhang, H. (2009). Ultrasonic nebulization extraction coupled with headspace single drop microextraction and gas chromatography-mass spectrometry for analysis of the essential oil in Cuminum cyminum L. Prot. Eng. 31, 72–77. doi:10.1016/j.aca.2009.05.030
Wang, Q., Lu, J., Li, Z., Lin, C., Li, X., Cheng, Y., et al. (2021a). Propagation law of explosion wave in columnar explosion tank under vacuum conditions. Acta Armamentarii 42, 1250–1256. doi:10.3969/j.issn.1000-1093.2021.06.015
Wang, D., Zhang, Z., Liang, J., Heng, Y., and Li, G. (2021b). Numerical simulation of viscous flow field in shock tube. J. Wuhan Univ. Technol. 45, 492–498. doi:10.3963/j.issn.2095-3844.2021.03.018
Whalley, M., and Skews, B. (2018). Expansion wave propagation into a cavity. J. Appl. Fluid Mech. 11, 507–517. doi:10.29252/jafm.11.02.28017
Keywords: combined-driven method, blast simulator, shock wave, numerical simulation, unsteady flow
Citation: Chen Z, Ren H, Ning H, Zhou S, Long Z and Huang K (2023) Analysis of flow field in a blast simulator combined-driven by explosive charge and compressed gas. Front. Earth Sci. 10:1094415. doi: 10.3389/feart.2022.1094415
Received: 10 November 2022; Accepted: 07 December 2022;
Published: 09 January 2023.
Edited by:
Zizheng Guo, Hebei University of Technology, ChinaReviewed by:
Mahar Hamid, Universiti Malaya, MalaysiaShuxin Deng, Nanjing University of Science and Technology, China
Copyright © 2023 Chen, Ren, Ning, Zhou, Long and Huang. This is an open-access article distributed under the terms of the Creative Commons Attribution License (CC BY). The use, distribution or reproduction in other forums is permitted, provided the original author(s) and the copyright owner(s) are credited and that the original publication in this journal is cited, in accordance with accepted academic practice. No use, distribution or reproduction is permitted which does not comply with these terms.
*Correspondence: Huiqi Ren, MjAxODMxNTcwMTI5QHNtYWlsLnh0dS5lZHUuY24=