- 1State Key Laboratory of Coal Mine Disaster Dynamics and Control, Chongqing University, Chongqing, China
- 2School of Resources and Safety Engineering, Chongqing University, Chongqing, China
Reasonable roadway layout timing can effectively reduce the deformation of the rock surrounding the roadway and relieve mining and excavation tension. To analyze the mine pressure behavior of the gob-side entry at the edge of a goaf and the roof stability along the strike direction in the middle of a goaf, field observations and particle flow discrete element numerical simulation (PFC) method were performed. The results showed that deformation of the surrounding rock mainly occurred because of roof-to-floor convergence, caused mainly by floor heave. The mechanical behaviors of the rock mass, such as elasticity, fracture, and post-peak softening, could be simulated using the model of a jointed rock mass generated by rigid block elements in the PFC method. Considering the length of the violent and reduced roof activity zones and the activity duration as the indices to determine the basic stability of the goaf, the basic stability distance of the tested goaf edge was 135 m after coal seam mining, and the basic stability time was 27 days. The basic stable distance in the middle of the goaf was 183.4 m after coal seam mining, and the basic stability time was 37 days.
1 Introduction
After coal seam mining, the original rock stress balance state around a mined-out area is disturbed, resulting in a redistribution of the surrounding rock stress, which causes the deformation, failure, and movement of rock strata that develops to the surface (Kuang et al., 2019). The movement of the overlying strata is the immediate cause of unstable goaf and roof activity and significantly affects the characteristics of the mine pressure of the working face and roadway (Sun et al., 2019; Sun et al., 2020). The mutual disturbance between coal seams is particularly severe in the mining of close-distance coal seam groups. After the upper coal seam is mined, the integrity of the rock surrounding the lower adjacent roadway is destroyed, making it extremely difficult to control the surrounding rock. The National Coal Mine Safety Supervision Bureau’s “Preventing Mining and Excavation Replacement Tension: Interim Measures” lists insufficient goaf and roof stability time as major hidden dangers during coal seam group mining near a roadway. Therefore, to ensure the safe mining of close-distance coal seam groups and to release the tension of mining and excavation replacement, it is important to study the stability characteristics of goafs and roofs.
Research on the stability of mined-out areas has mainly focused on the influence of surface subsidence on buildings and structures, while relevant research results provide little guidance for underground production practices (Li et al., 2016; Ren et al., 2022). The stability of the goaf and roof is reflected in the supporting effect of the caving zone on the roof and the compaction effect of the movement of overlying strata on the caving zone. Therefore, the bearing capacity of the caving zone and the movement law of the overlying strata are key factors affecting the stability characteristics of a goaf and roof (Arasteh et al., 2022). Research results of the compression deformation characteristics of caving zones showed that the stress–strain curve is exponential (Li et al., 2019; Li et al., 2020), indicating that the bearing capacity of the caving zone increases exponentially with an increased load of the overlying strata, and the influence of the overburden stress on the caving zone gradually weakens. Therefore, goafs are gradually stabilized behind the working face and the goaf and roof stability can be characterized by the changing trend of abutment pressure of the caving zone and the movement characteristics of the roof strata. After fracture of the main key stratum, the subsidence of the surface gradually reaches its maximum value under geological conditions and enters a full subsidence state. Therefore, the fracture of the main key stratum and full subsidence of the surface can be used as the basis for judging whether the roof activity is stable (Hu et al., 2015). Chen and Liu (2012) studied the size effect of a mined-out area and showed that when the width and height of the mined-out area were fixed, the stability of the roof decreased gradually with increasing mined-out area length and then remained almost unchanged. Hu and Li (2012) applied a Bayesian discriminant method to distinguish the degree of danger of a goaf. This method has significance for the analysis and judgment of goaf stability but requires a large amount of sample data. Deng et al. (2012) suggested that the void caused by rock fracture induced by mining is the main cause of residual subsidence in a goaf. Yang et al. (2019) studied the instability mechanism of key strata in overlying strata using a microseismic monitoring method and reported much higher energy generated by a fracture of the main key strata than that of the subkey strata, indicating that the main key strata are the controlling factors of roof activity. According to the strata control theory (Li et al., 2018), key strata fracture and movement control the subsidence of the ground surface, thus determining the goaf and roof stability.
The results of previous studies have mainly focused on the mechanical properties of caving zones and the movement law of overlying strata. However, few studies have investigated the stability characteristics of goafs and roofs. Therefore, this study analyzed the characteristics of mine pressure behavior in gob-side entry through the observation of on-site mining pressure. The particle flow discrete element numerical simulation (PFC) method was used to establish the stratum model of a jointed rock mass, and the movement law and stability characteristics of a goaf were analyzed.
2 Research background
The 1295 working face of the Xuyong No.1 coal mine of the Sichuan Coal Group was selected as the research background. The coal mine is located in Zhengdong Town, Xuyong County, Sichuan Province. The coal-bearing strata in the mining area are from the Upper Permian Longtan Formation. The coal seams in the mining area are C19, C20, and C24 from the top to bottom. The average interlayer spacing of C19 and C20 is 2.7 m, which indicates an ultra-close-distance coal seam. The average interlayer spacing of C20 and C24 is 11.9 m, which indicates a close-distance coal seam. The average thicknesses of C19, C20, and C24 are 0.9 m, 1.0 m, and 1.1 m, respectively. If the actual average coal thickness is taken as the mining height, the height of the working face is very small, which is not conducive to the mining operation of workers and will significantly reduce the mining efficiency. In 2017, the mining company implemented safe and efficient high-power mining shearers and adopted a fully mechanized bottom-breaking mining method to increase the average mining height of the working face from 1.2 m to 1.5 m. As a result, the mining efficiency increased from 6.79 t/worker to 16.9 t/worker.
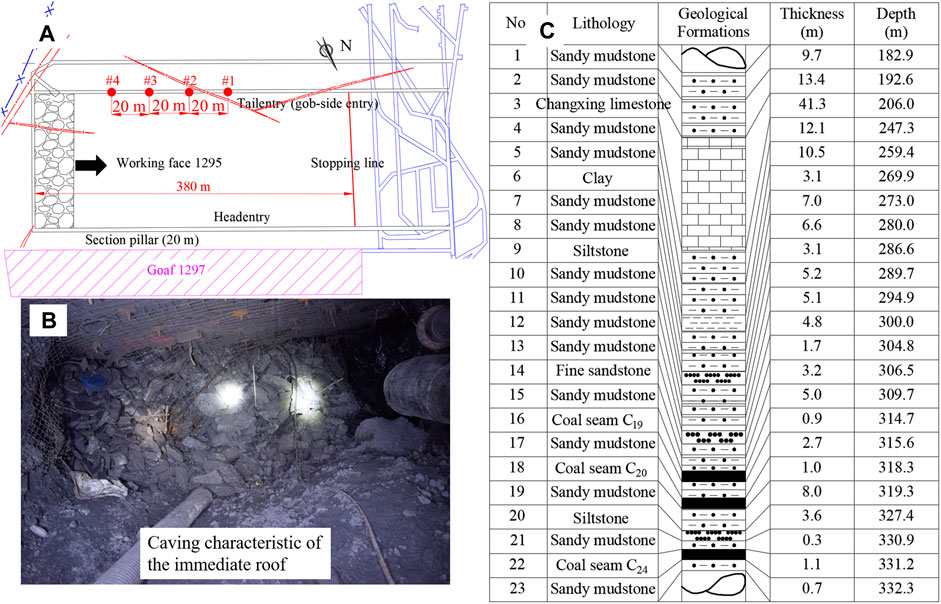
The 1295 working face of the mine comprises a first layer of C19 in 12 districts. The strike-retreating longwall mining method was used for the working face. The goaf was managed using a natural caving method. The average overburden depth, dip length, strike length, dip angle, and mining height of the working face are 314.7 m, 165 m, 380 m, 24°, and 1.5 m, respectively. To the east of the working face is the isolated coal pillar of districts 12 to 11, to the south is the mine boundary coal pillar, to the west is the protective coal pillar of the center rise in the 12 districts, and to the north is goaf 1297, which has been mined out. The 1295 tailgate is a gob-side entry with roof cutting, and the roadway is a special-shaped section with a width of 3.6 m, middle height of 2.5 m, and net section of 9 m2. The supporting method is a bolt–mesh–anchor combination. The length of the roof bolt is 2.2 m, the spacing is 1 m × 1 m, the length of the anchor cable is 6.3 m, and the anchorage method is end-anchor. The support methods in the gob-side roadway include a single hydraulic prop, I-steel, and full-section shotcrete.
The geological column of the 1295 working face is shown in Figure 1A. The immediate roof of C19 is 5-m-thick dark-gray sandy mudstone and is a Class I unstable roof, which caves during mining (Figure 1C). According to the calculated 1.3 bulking coefficient, the entire immediate roof caves and fills the goaf. The basic roof is fine sandstone with a thickness of 3.2 m. The tensile strength of the fine sandstone is 3.2 MPa, and the density is 3050 kg/m3. Based on the fixed beam and cantilever beam calculation methods of material mechanics, the initial and periodic fracture step distances of the basic roof are 26.1 m and 10.7 m, respectively. An in situ mine pressure observation showed initial and periodic fracture step distances of 25.5 m and 11.3 m, respectively. The fine sandstone layer is sandy mudstone with a thickness of 16.8 m. The sandy mudstone had a low strength, with joints and fissures in the rock mass. It moves synchronously with the fine sandstone of the basic roof as weak strata. The fine sandstone and overlying weak strata form the first rock beam of the basic roof, which plays a major role in the strata behavior of a coal face. A 3.1-m siltstone is present above the first rock beam of the basic roof. The siltstone strength is higher than that of the sandy mudstone; therefore, the second rock beam of the basic roof comprises siltstone and overlying weak strata, which affects the strata behavior of the working face. The main key strata of the roof controlling the surface deformation are 41.3-m-thick Changxing limestone.
3 Characteristics of the strata behavior in the gob-side roadway
3.1 Displacement variation characteristics of the roadway surface
Four mine pressure observation points were arranged in the 1295 tailgate. The points were #1, #2, #3, and #4 from the opening of the roadway to the inside, with an average spacing between observation points of 20 m. Point #4 was 53.6 m from the coal wall of the working face, the advancing length was 52.2 m, and the remaining length was 327.8 m. The positions of the points are shown in Figure 1B. The mine pressure observation equipment included a total positioning station and multi-point displacement meter. The relative displacement of the roadway surface was measured using the cross-distribution point method.
In the early and late stages of mine pressure observation, the total positioning station was used to measure the roof elevation of the roadway, and the relative displacements of the roof and floor were measured using the cross-point method. The comparison results are presented in Table 1. During the two measurements of the total positioning station, the roof cumulative subsidences of points #1, #2, #3, and #4 were 26 mm, 126 mm, 98 mm, and 116 mm, respectively, and the amount of floor heave was 76 mm, 376 mm, 295 mm, and 349 mm, respectively. The respective amount of floor heave was 2.92, 2.98, 3.01, 3.01 times the roof subsidence with an average of 2.98, indicating that the relative approach of the roadway roof and the floor was mainly floor heave.
Figure 2 shows the relative displacement variation characteristics of the roof and floor and the ribs of the four mine pressure observation points. The abscissa in the figure represents the advancing length of the working face during the mine pressure observation period. The position indicated by the arrow indicates that the current position of the working face coincides with that point, while the direction indicated by the arrow indicates the advancing direction of the working face. Figures 2A, B show that the relative displacements of the roof and floor at different measuring points increased slowly with the advance of the working face, then increased sharply, and finally increased slowly. In the early stage of rock pressure observation, points #1 and #2 were 120.2 m and 102.6 m from the coal wall, respectively. The influence of mining on the surrounding rock of the roadway was minor, and the relative displacement of the roof and floor of the roadway increased slowly. Points #3 and #4 were 70.2 m and 53.6 m from the coal wall, respectively. The influence of mining stress on the surrounding rock appeared gradually, and the growth rate of the relative displacement of the roof and floor was higher than that at points #1 and #2. When the measuring points of #1, #2, #3, and #4 were 38 m, 31 m, 26 m, and 28 m from the coal wall, respectively, the relative displacement growth rate began to increase significantly. After the coal face passed through the measuring points, the growth rate of roof-to-floor convergence did not decrease immediately but increased further, indicating a more intense impact of the goaf roof activity on the roadway surrounding rock. After the mining of the working face passed through the measuring points, the growth rate of the convergence of the roof and floor began to decrease, and the curve gradually became moderate. This indicated that the influence of the roofing activity of the goaf on the roadway along the goaf was governed by the distance between the coal wall of the working face and the measuring points. The cumulative relative displacements of #1, #2, #3, and #4 were 404 m, 798 m, 552 m, and 694 mm, respectively.
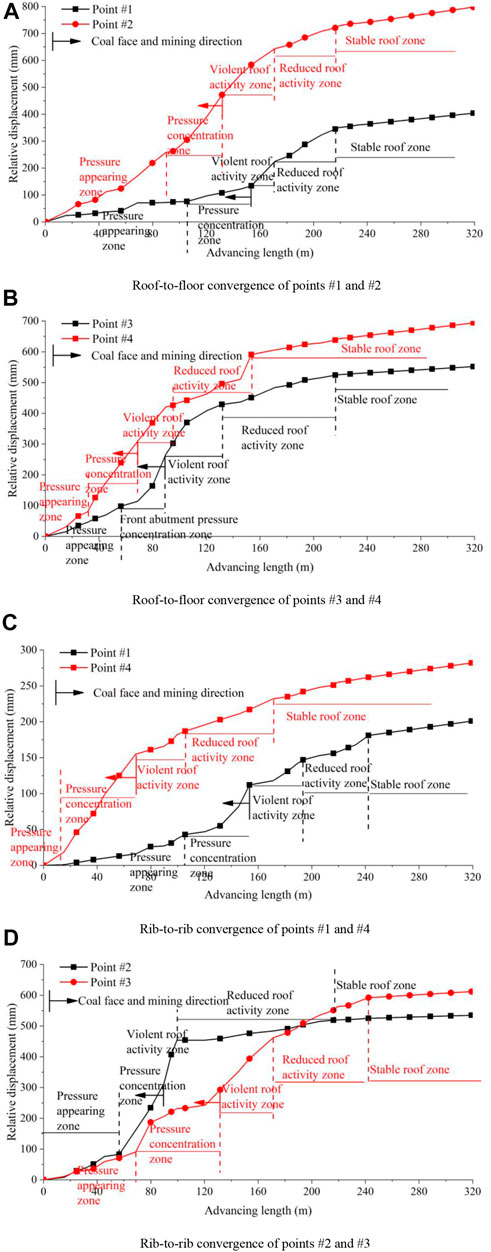
FIGURE 2. Relative displacement variation characteristics of the roof-to-floor and the rib. (A) Roof-to-floor convergence of points #1 and #2. (B) Roof-to-floor convergence of points #3 and #4. (C) Rib-to-rib convergence of points #1 and #4. (D) Rib-to-rib convergence of points #2 and #3.
Figures 2C, D present the various characteristics of the relative rib displacement. The characteristics of the side of the roadway were basically the same as those of the roof and floor, all of which first increased slowly, then sharply, and finally increased slowly. The cumulative relative displacements of points #1, #2, #3, and #4 were 181 m, 592 m, 525 m, and 262 mm, respectively, and the convergences of the roof and floor were 2.2, 1.3, 1.2, and 2.7 times that of the rib and 1.85 times on average.
The aforementioned analysis showed that the various characteristics of the relative displacements of the roof, floor, and rib were significantly related to the relative position relationship between the coal face and a point. Therefore, according to the influencing characteristics of the mining disturbance on the rock pressure behavior of the roadway, the characteristics of the relative displacement variation during the mining of the working face were divided into five zones: pressure appearance, pressure concentration, violent roof activity, reduced roof activity, and stable roof zones. From the partition characteristics of the roadway strata behavior, the influence range of the front abutment pressure of the working face and the roof movement of the goaf on the roadway surrounding rock could be determined.
After translation and obtaining the average convergences of the roof, floor, and rib as shown in Figure 2, the average cumulative convergence of the roof, floor, and rib of the roadway were obtained, as shown in Figure 3. The coordinate origin in the figure indicates the coal wall, while the black arrow indicates the mining direction of the working face. As shown, the average cumulative convergence of the roof, floor, and rib slowly increased, then sharply increased, and finally slowly increased. Therefore, the variation characteristics of the convergence were also divided into the pressure appearance, pressure concentration, violent roof activity, reduced roof activity, and stable roof zones. The amounts of roadway affected by the front abutment pressure in the pressure concentration zone for the roof–floor and rib–rib were 32 m and 50 m, respectively, and the amounts affected by the roof violent activity of the goaf and roof were 67 m and 23 m, respectively. The durations of influence were 44 days and 15 days, respectively. The roof–floor and rib–rib lengths of the roofing reduction activity zone of the goaf were 68 m and 92 m, respectively, with durations of 45 days and 64 days, respectively. The statistical results of the convergence characteristic partition table of the roadway roof, floor, and ribs are listed in Table 2.
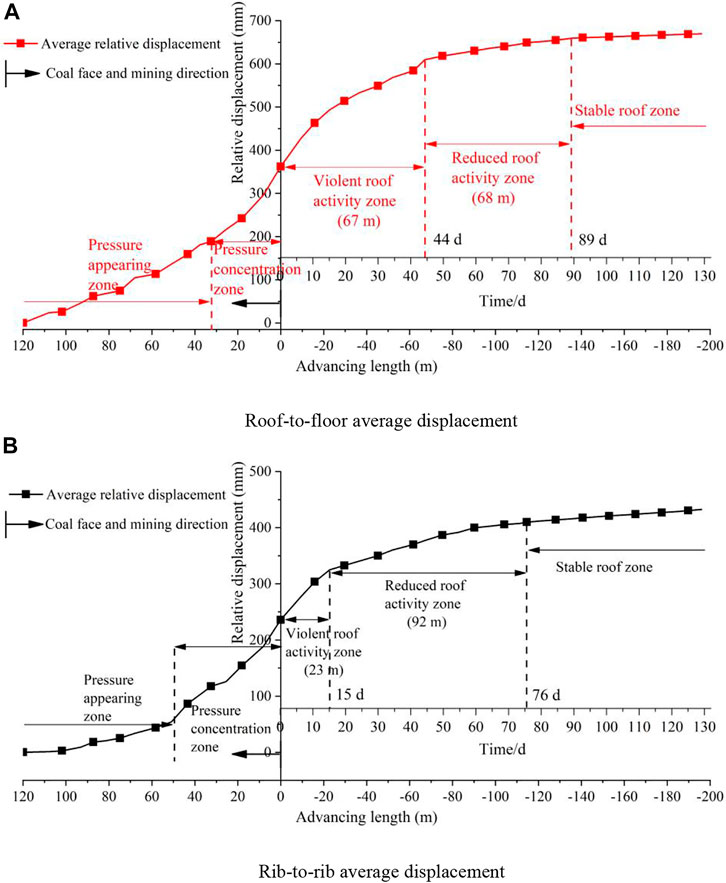
FIGURE 3. Average displacement variation characteristics. (A) Roof-to-floor average displacement. (B) Rib-to-rib average displacement.
3.2 Displacement variation characteristics of the roof strata in the roadway
A multipoint displacement meter was used to measure the displacement variation characteristics of the roadway roof strata. The base point depths of the multipoint displacement meter were 2 m, 4 m, 6 m, 8 m, and 10 m. The characteristics of the displacement variation of the roof strata were indirectly reflected by measuring the changes in the exposed length of the wire rope. Assuming that the exposed length of the wire rope is Li (i is the base-point number), each measurement is the value after L changes. L represents the exposed length of the wire rope after the relative displacement of the strata at the base point and the roadway surface. Because of the relative displacement between the roadway surface and the roof stratum at the base point, and because the displacement of the surface is usually larger than that of the deep rock stratum, L decreases continuously. The relative displacement variation of the roof strata is the difference between the exposed length of the wire rope measured in two adjacent times, expressed as ΔL = L0 ˗ L1, where L0 and L1 represent the exposed length of the wire rope at the first and second measurements, respectively, and ΔL represents the relative displacement variation of the surrounding rock at the base point and the roadway surface. Assuming that the subsidence of the rock stratum at the base point is Δl and the subsidence of the roadway surface is ΔLS, then Δl = ΔLS ˗ ΔL. During roof subsidence, the interlayer rock strata between the roadway surface and the base point are separated and may cause the subsidence value above the separation position to be greater than that of the roadway surface, leading to an increase in the exposed length L of the base point, ΔL ˂ 0. If ΔL ˃ 0, the subsidence value of the rock stratum at the base point is less than that of the roadway surface. If ΔL = 0, the subsidence value is equal to that of the roadway surface. Therefore, when the subsidence of the roadway surface is determined, that of the rock strata at each base point of the roof can also be determined.
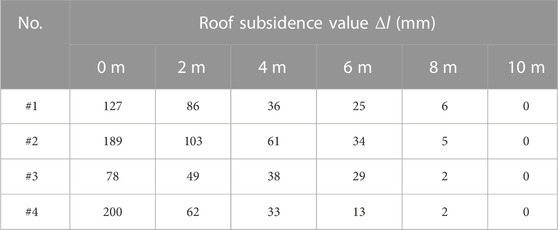
Figure 4 shows the variation in the relative displacement of the rock strata 8 m and 10 m from the roof. The differences in the relative displacement of rock strata at 8 m and 10 m at each observation point were small, and the variation law was the same, indicating minor relative movement of the rock strata at 8 m and 10 m. According to the loose circle theory of roadway surrounding rock (Wang et al., 2020), the thickness of a loose circle of soft rock is usually 2.16 m, and the strata displacement outside the loose circle is typically small. Therefore, the possibility of subsidence of a rock mass at a roof base point 10 m deep is small and can be regarded as a fixed point and as the reference zero point for the displacement conversion of the other points. Thus, the cumulative variation of the exposed length of the wire rope at 10 m is the subsidence of the roadway surface, and the subsidence value of the roof strata at each measuring point can be obtained. As shown in Table 3, the subsidence of the roof decreased with increasing height, and the subsidence of the roadway surface was the largest. The maximum subsidences of the roadway surface at points #1, #2, #3, and #4 were 127 mm, 189 mm, 78 mm, and 200 mm, respectively. According to the cumulative convergence of the roof and floor, the floor heaves of the roadway were 277 mm, 609 mm, 474 mm, and 494 mm, respectively. The floor heaves were 2.18, 3.22, 6.08, and 2.47 times those of the roof subsidences with an average of 3.49-fold increase, indicating that the convergence of roof and floor occurred mainly due to floor heave, consistent with the measurement results from the total positioning station.
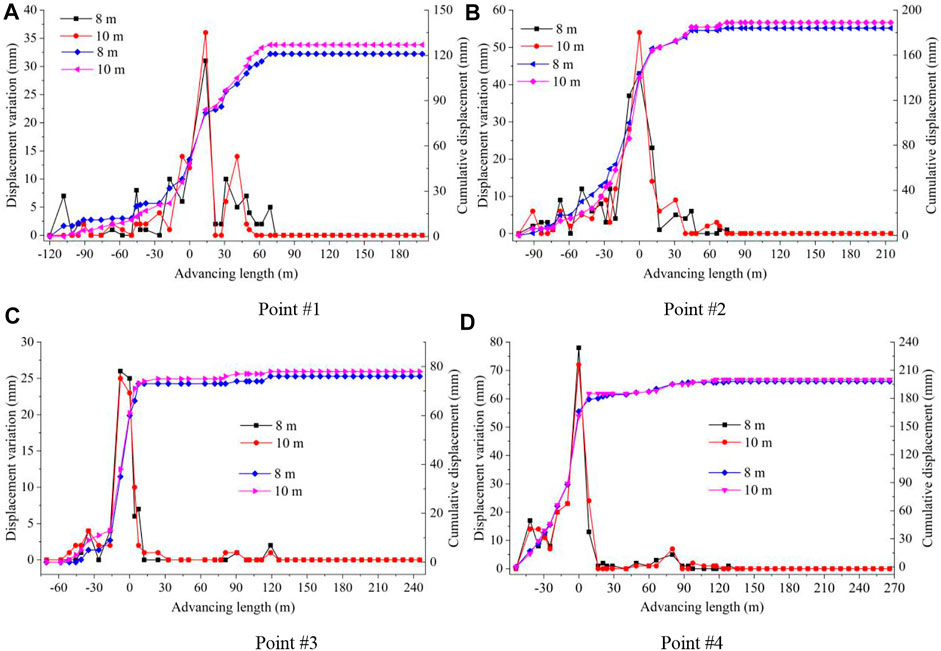
FIGURE 4. Relative displacement variations in rock strata at 8 m and 10 m from the roof. (A) Point #1. (B) Point #2. (C) Point #3. (D) Point #4.
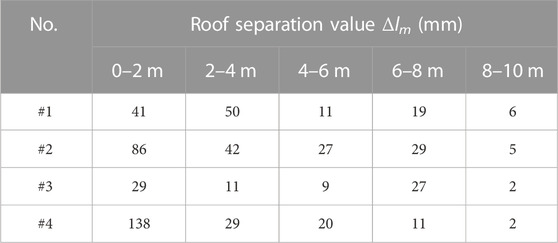
Roof separation is defined as the difference in fracture time and subsidence between two adjacent strata owing to the difference in physical and mechanical properties of rock masses (Xie et al., 2016). Roof separation is mainly manifested in the difference in subsidence value between two rock strata. The roof separation is defined as Δlm = Δlk ˗ Δli, where Δlk and Δli are the subsidence of the lower and upper rock strata, respectively. According to the subsidence of each roof strata, the roof separation is calculated as shown in Table 4. The roof separation was compared to the critical value of Δlm = 30 mm to determine whether the separation was significant. Table 4 demonstrates that the possibility of significant separation of rock strata at 0–4 m at points #1 and #2 was large, while that above 4 m it was small. Moreover, the possibility of significant separation at 0–2 m at points #3 and #4 was greater. The possibility of significant separation of rock strata within 2 m of the roof in the Xuyong No.1 coal mine is large, while the length of the roadway roof bolt is 2.2 m. The significant roof separation in the bolt anchorage range may increase the failure probability of the bolt. Therefore, the length of the roof bolt must be increased.
Figure 5 shows the various characteristics of the subsidence value of the roof strata. With the mining of the working face, the roof subsidence value first increased slowly, then sharply, and finally slowly. The subsidence value decreased with increased roof height. The roof subsidence speed was fast during the working face mining through the measuring point. When the measuring point lagged behind the working face for a certain distance, the roof strata subsidence gradually became stable, indicating that the roof had entered a relatively stable state. Table 5 is the partition table of roof subsidence law obtained by statistics showing lengths of violent goaf roof and reduced activity zones of 14 m and 94 m, with durations of 9 days and 63 days, respectively.
According to the key stratum theory (Li et al., 2018), after the mining of a working face, the basic roof is broken by O-X, a masonry beam structure is formed along the advancing direction of the working face, and an arc triangular block is formed along the tendency direction. Under the support of the caving zone, the arc triangular block gradually reaches equilibrium and stabilizes the surface displacement of the gob-side entry and roof strata. The fractures of the overlying strata gradually increase with time. The movement of the overlying strata affects the stability characteristics of the middle of the goaf and the block equilibrium structure at the edge of the goaf, thus affecting the behavioral characteristics of the roadway mine pressure. Therefore, the stability of a goaf edge can be estimated based on the gob-side entry stability. The characteristics of the displacement variation of the roadway surface and roof strata showed that the roof gradually became stable after experiencing severe and slow subsidence corresponding to the violent roof activity and reduced roof activity zones in Figures 3, 5. Therefore, the length and duration of the violent roof activity and reduced roof activity zones after mining were considered the stable distance and time of the goaf edge. As shown in Tables 2, 5, the maximum stable distance of the goaf and roof obtained by comprehensive analysis of the convergence of the roof, floor, and rib was 135 m after mining, with a stable time of 89 days. The stable time without considering the disruption in production of the working face was 27 days (5 m/d). According to a comprehensive analysis of the displacement change of the roof strata, the stability distance of the goaf and roof was 108 m, with a stability time of 72 days. The time without considering the disruption in production of the working face was 22 days. Considering safety factors, both obtained the maximum values.
4 Numerical simulation of goaf stability
4.1 Modeling analysis
In a natural rock mass, from a macro point of view, the joints and fissures arranged with the occlusion of the rock combination cut each other. Rock masses have obvious geological relics such as unconformities, folds, faults, joints, cleavage, bedding, and schistosity that are generally referred to as joints in rock mass mechanics (Zhou et al., 2018; Wu et al., 2022). A rock mass belongs to a discrete medium on a macro scale, and the movement of a rock mass under the influence of severe mining belongs to the movement of the discrete medium. Therefore, the PFC method based on the discrete medium theory can simulate the fracture and movement characteristics of a jointed rock mass after coal seam mining (Zhao et al., 2015a). Some scholars (Yang and Huang, 2014; Zhao et al., 2015b; Cheng et al., 2016) have used circular particles in the PFC method to establish a jointed rock mass model to simulate the mechanical behavior of rock; however, the circular particle element and the rock block formed by joint cutting differ. With the development of simulation technology, rigid block elements have been introduced into the PFC method that can interact with other elements with different block shapes. Therefore, the rigid block element can be used to simulate a rock mass cut into blocks and arranged by joints and fissures. A jointed rock mass is generated by the shape of the rock block. To ensure the integrity of the rock mass generated by rigid blocks, the triangular rigid block element shown in Figure 6 was used to generate a jointed rock mass.
As shown in Figure 6, the number and spacing of joints in a rock mass can be changed by changing the maximum edge of the rigid block. Figure 6 shows the development characteristics of joints in a rock mass with a thickness of 2 m and length of 20 m at different maximum edge lengths. The statistical results for the joint development characteristics are presented in Table 6. As the maximum edge length of the rigid block increased from 0.1 m to 2.5 m, the number of rigid blocks decreased from 9184 to 16, the number of joints decreased from 13,918 to 15, the fissure degree decreased from 20.0 to 0.8, and the classification of joints changed from very dense to sparse. Therefore, the maximum length of a rigid block significantly affects the number of joints and the degree of fissures, which increase exponentially with decreased maximum block length.

TABLE 6. Influence of the maximum edge length of the rigid block on the joint development characteristics.
The immediate roof of the 1295 working face is 5.0 m sandy mudstone. The first rock beam of the basic roof is 3.2 m fine sandstone overlying a 16.8-m weak rock stratum. The second rock beam of the basic roof is 3.1 m siltstone overlying a 39.3-m weak rock stratum. The main key stratum is 41.3-m Changxing limestone. According to the test results of the mechanical parameters of coal and rock, the strengths of the fine sandstone, siltstone, and Changxing limestone were high, and the fissure degree of the rock mass was low. In the modeling, a larger edge length was used to simulate dense or sparse joints. The strength and fissure degree of the sandy mudstone rock mass were low and high, respectively. Smaller edge lengths were used to simulate dense or very dense joints during modeling.
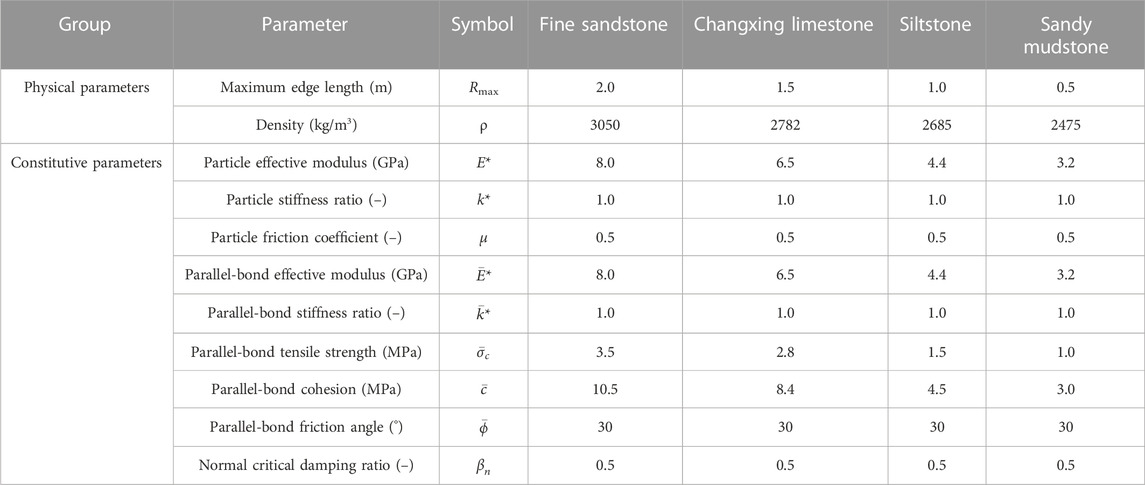
The physical and mechanical parameters of coal and rock in the Xuyong No. 1 coal mine were obtained by laboratory tests. The parameters were calibrated using a numerical simulation method based on the roof-to-floor convergence obtained by on-site mine pressure observations. The strengths of the engineering rock masses are listed in Table 7. To analyze the influence of the maximum edge length of the rigid block on the strength of the rock mass and obtain the mesoscopic parameters of the rigid block, 50 m × 100 m jointed rock mass models with different maximum edge lengths were generated. Uniaxial compression and direct tensile tests were simulated, with a loading rate of 0.5 m/s in the models. The model and loading test results are presented in Figure 7. The maximum edge lengths of the rigid blocks from left to right were 0.5 m, 1.0 m, 1.5 m, and 2.0 m.
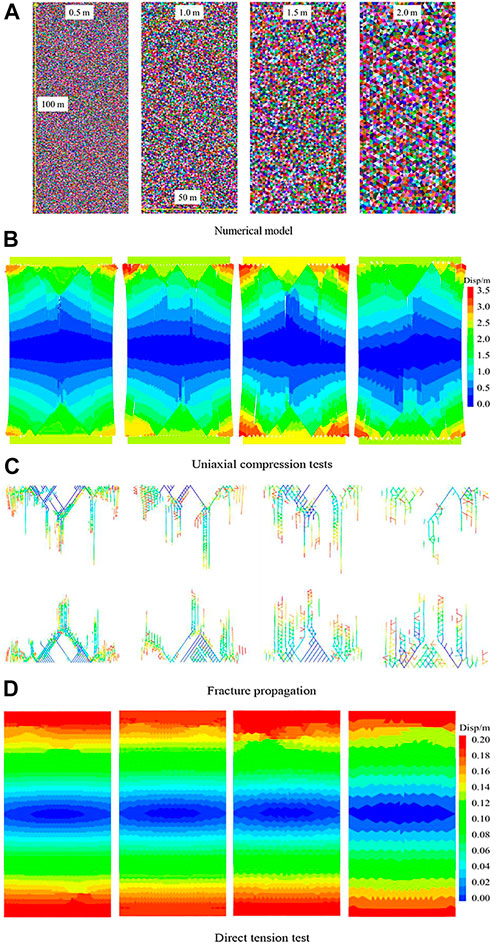
FIGURE 7. Rock mass strength test results. (A) Numerical model. (B) Uniaxial compression tests. (C) Fracture propagation. (D) Direct tension test.
According to the uniaxial compression simulation results of the rock masses (Figure 7B), the failure mode of the jointed rock mass generated by the rigid block was split, which was unrelated to the maximum edge length of the block; however, the number of cracks generated during rock mass failure decreased with increased maximum edge length of the block (Figure 7C). Figure 8 shows the stress–strain curves obtained from the model loading tests. The jointed rock mass models generated by the rigid block simulated the elasticity, fracture, and post-peak softening of the rock mass. Table 7 presents the statistical results of the tests. When the maximum side length of the block was 2.0 m, the compressive and tensile strengths of the rock mass obtained by the model loading test were 69.23 MPa and 3.21 MPa, respectively, and were basically the same as the strength of fine sandstone. Similarly, when the maximum side lengths were 1.5 m, 1.0 m, and 0.5 m, the model strengths were the same as those of the Changxing limestone, siltstone, and sandy mudstone, respectively. The aforementioned conclusions provided the basis for establishing a working face excavation model.
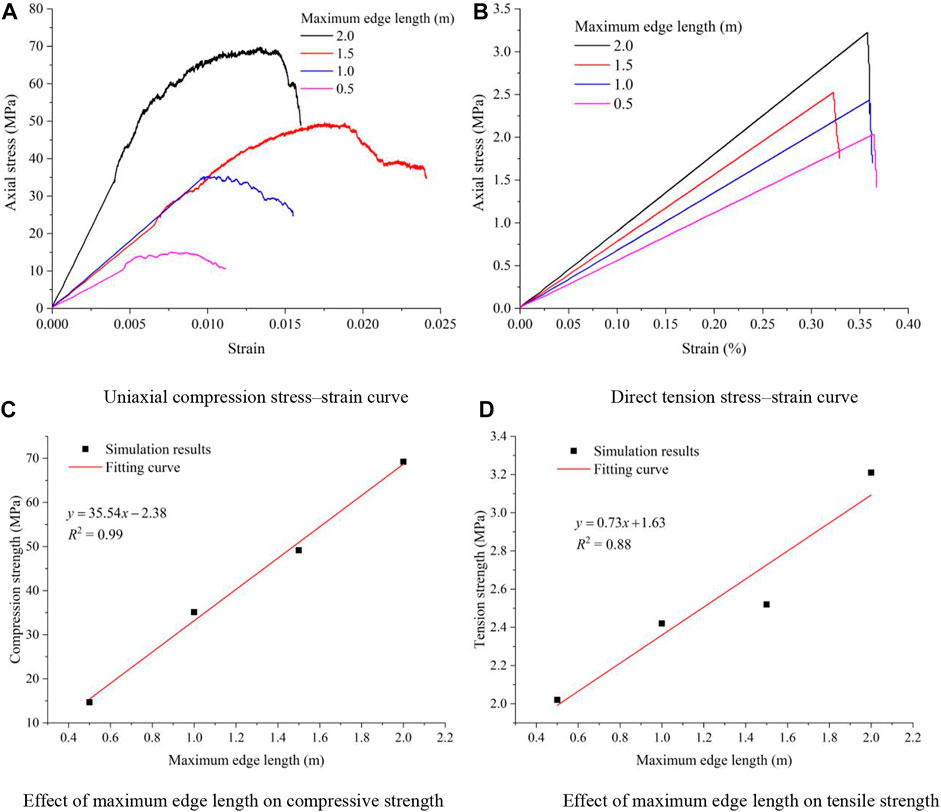
FIGURE 8. Influence of the maximum edge length of the rigid block on the rock mass strength. (A) Uniaxial compression stress–strain curve. (B) Direct tension stress–strain curve. (C) Effect of the maximum edge length on the compressive strength. (D) Effect of the maximum edge length on the tensile strength.
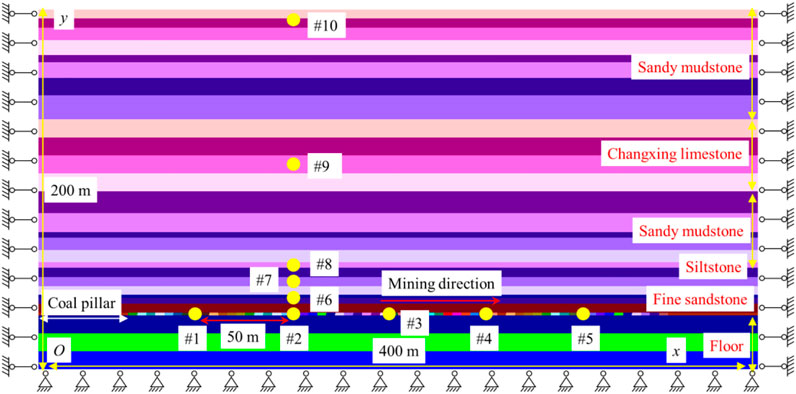
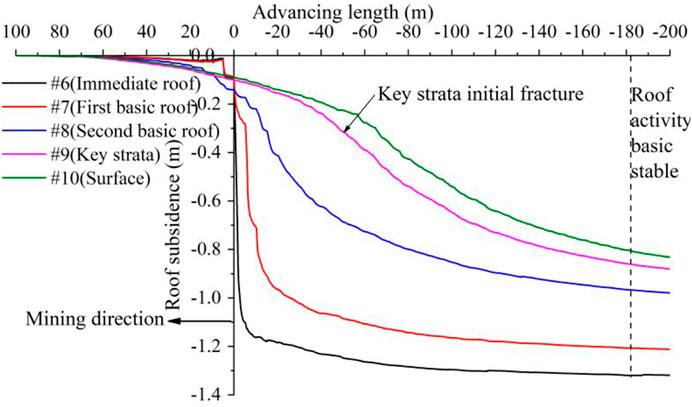
Based on the geologic column of the 1295 working face, a two-dimensional plane strain model along the strike direction in the middle of the working face was established. The model was 400 m wide and 200 m high, with a total of 353,300 rigid blocks. The PFC model is illustrated in Figure 9. The bottom of the model had a fixed boundary, and a 1.5-MPa self-weight stress of rock strata was applied to the top of the model. The horizontal displacement was limited to both sides of the model. The simulated coal seam excavation step was 5 m, and the simulated working face mining height was 1.5 m. The advancing length of the working face was 300 m along the strike direction, and 50-m boundary coal pillars were reserved on both sides. Only the C19 coal seam was mined during the simulation. Ten measuring circles were set up in the coal seam and roof strata to monitor and record the variation characteristics of the abutment pressure and displacement. Points #1–5 were separated by 50 m in the coal seam, point # 6 was located in the immediate roof, point # 7 in the fine sandstone of the basic roof, point # 8 in the siltstone of the main roof, point # 9 in the main key strata, and point # 10 in the near-surface.
4.2 Contact model and constitutive parameters
In the PFC method, the force and displacement are transmitted by the contact between blocks, and its generation and fracture law is the contact model. Potyondy and Cundall (2004) proposed a contact model that simulated the mechanical behavior of rocks (i.e., a linear parallel-bond model) to reproduce their elasticity, fracture, acoustic emission, and post-peak softening. Their contact model provided a force–displacement law for particles, linking the internal force and relative motion between the contacts. When the particle gap was ≤0, the contact model was activated, and the force–displacement law for the linear parallel-bond model updated the contact force
where Fl is the linear force, Fd is the dashpot force,
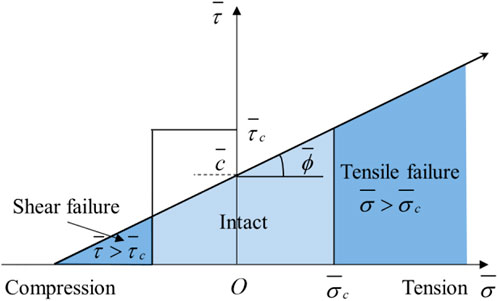
The coal and rock masses are in a three-dimensional compression state under in situ stress. After a coal seam mining operation, the vertical stress of the roof decreases, resulting in a contact stress state from compression to tension. The maximum tensile stress
where
When roof strata are in a tensile stress state, the following formula can be used to determine whether the parallel bond breaks:
where
First, the tensile strength criterion was applied during cycling. If
The trial-and-error method was used to obtain the mesoscopic parameters of the block (Wu et al., 2020; Gao et al., 2021). The mesoscopic parameters of the block were obtained by calibrating the macroscopic mechanical parameters of the rock mass (Figure 8; Table 7), as listed in Table 8. As shown in the table, the maximum edge length, effective modulus, parallel-bond tensile strength, and parallel-bond cohesion were the main parameters affecting the strength of the rock mass, which decreased with decreases in these parameter values.
4.3 Results of the numerical simulation
Figure 11 shows the characteristics of the roof fracture and movement after coal seam mining. As shown in Figure 11A, the immediate roof filled the goaf with mining and caving, consistent with the field observations. The basic roof first broke when the working face advanced to 25 m (Figure 11B). The initial fracture step distance was basically the same as that of the theoretical calculation of 26.1 m and the mine pressure observation of 25.5 m. After the first rock stratum of the basic roof broke, the overlying 16.8-m weak rock strata broke and acted on the basic roof. When the working face advanced to 35 m (Figure 11C), the first rock beam of the basic roof broke periodically; the periodic fracture step distance of 10 m was basically the same as the theoretical calculation of 10.7 m and the observation result of the mine pressure of 11.3 m. After the initial periodic weighting, there was an obvious separation phenomenon between the first and second rock beams of the basic roof, with a maximum separation value of 0.32 m. When the working face advanced to 40 m (Figure 11D), the second rock beam of the basic roof broke. Compared to the block length formed after the fracture of the first rock beam, the block size after the fracture of the second rock beam was smaller. When the working face advanced to 80 m (Figure 11E), the second rock beam separated from the Changxing limestone, and a separation fracture with a maximum value of 0.18 m was generated between the second rock beam and main key strata. The separation value and width increased with the advance of the working face. Before the main key strata broke, the width of the separation fracture increased to 56 m. When the working face advanced to 150 m (Figure 11F), the main key strata broke, resulting in the closure of the separation fracture. The actual fracture step distance of the main key strata was 56 m. After the main key stratum broke, rock stratum fractures gradually developed near the surface.
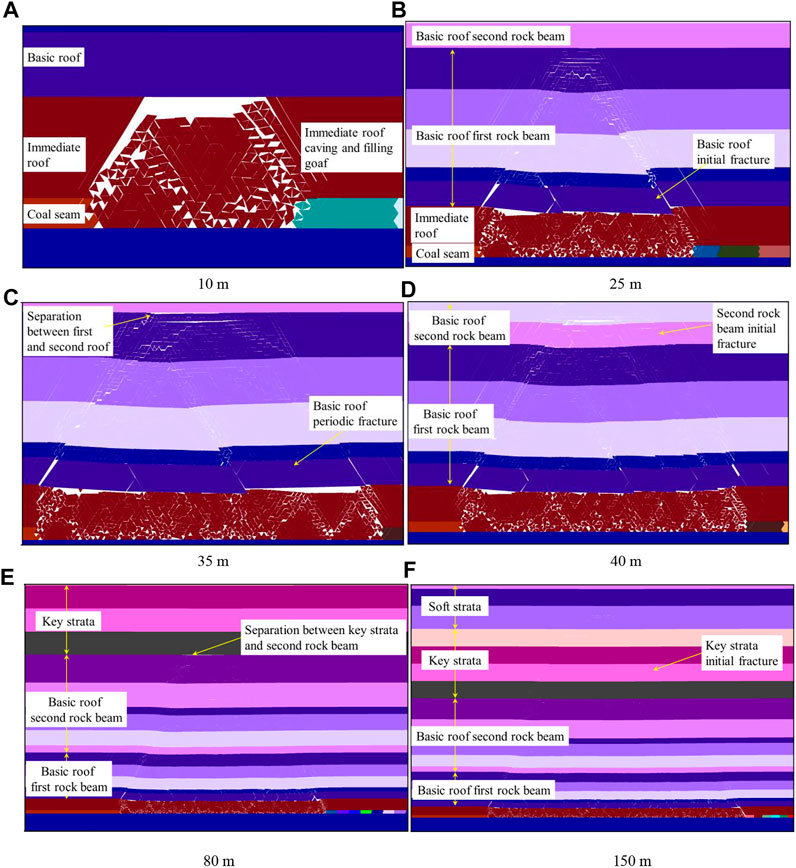
FIGURE 11. Roof fracture and movement characteristics. (A) 10 m. (B) 25 m. (C) 35 m. (D) 40 m. (E) 80 m. (F) 150 m.
Figure 12 shows the characteristics of the abutment pressure. With the mining of the working face, the abutment pressure at the measuring point first increased, then decreased sharply, and finally increased slowly. Within the range of 35 m in front of the working face, the abutment pressure increased rapidly, which is the concentrated area of advanced abutment pressure. When the working face mining passed through the measuring point, the abutment pressure dropped immediately. After the mining of the working face passed through the measuring point for a distance, the roof broke and moved, leading to the re-compaction of the caving zone and further increasing the abutment pressure. Figure 12A shows that the abutment pressure increased rapidly in the range of the violent roof activity zone, the abutment pressure increased slowly in the range of the reduced roof activity zone, and the growth rate gradually approached zero in the roof basic stable zone. According to the various characteristics of abutment pressure, the length of the violent roof activity zone was 48.9 m, while that of the reduced roof activity zone was 134.5 m.
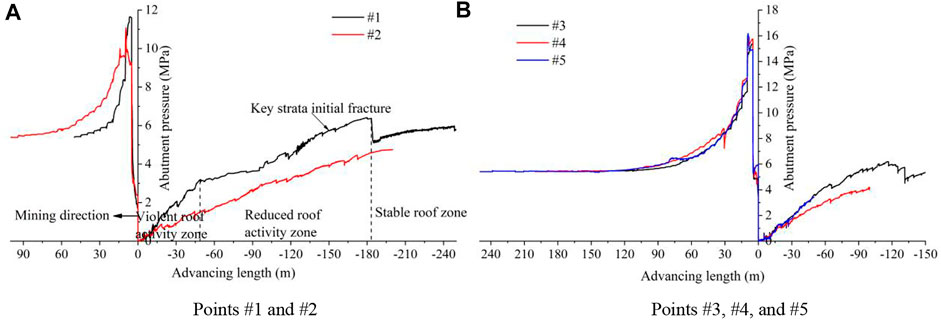
FIGURE 12. Abutment pressure variation characteristics of the working face. (A) Points #1 and #2. (B) Points #3, #4, and #5.
Figure 13 shows the distribution characteristics of abutment pressure for goaf lengths of 90 m, 180 m, and 270 m. The fluctuation of abutment pressure with advancement along the working face decreased. Owing to the non-uniformity and discontinuity of the rock block in the goaf, the abutment pressure in the goaf showed a discontinuous distribution characteristic of high pressure in the middle and low pressure on both sides. The peak abutment pressures at the three goaf lengths were 8.4 MPa, 9.5 MPa, and 10.3 MPa, respectively. The average abutment pressures were 1.3 MPa, 2.1 MPa, and 2.2 MPa, respectively. The peak abutment pressure increased with increased goaf length. The average abutment pressure increased slowly when the length of the goaf was greater than 180 m, indicating gradual stabilization of the roofing activity of the goaf at 180 m behind the coal face.
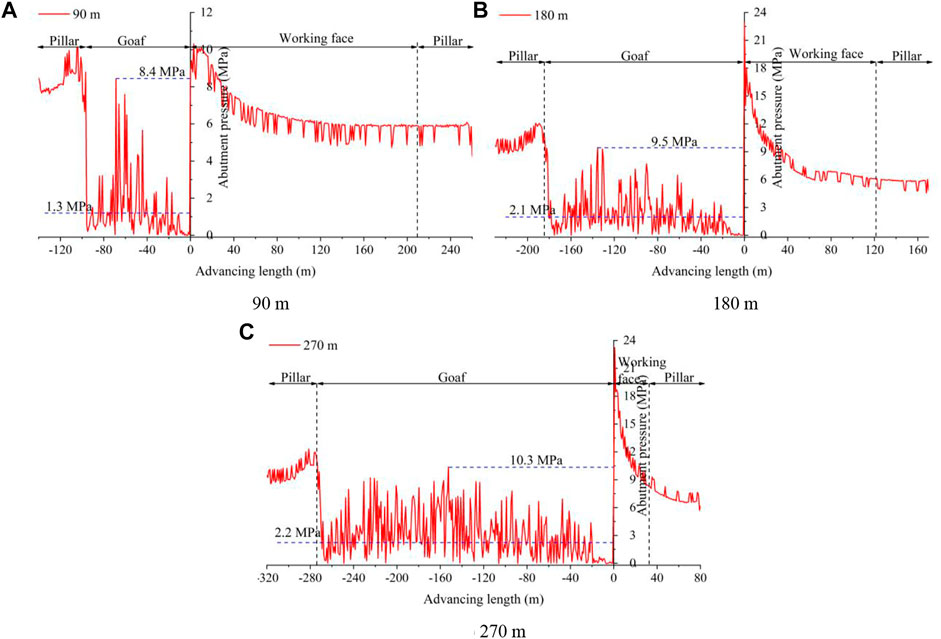
FIGURE 13. Distribution characteristics of abutment pressure in goaf. (A) 90 m. (B) 180 m. (C) 270 m.
Figure 14 shows that the subsidence roof subsidence increased with increased working face advancing length and decreased with increased roof height. After the mining of the working face, the intensity of roof activity decreased with increased roof height, and the immediate roof sank sharply and gradually stabilized within 10 m behind the working face. The first rock beam of the basic roof subsided rapidly and gradually stabilized within 20 m behind the working face. The second rock beam of the main roof began to slowly sink after 80 m into the goaf. After the initial fracture of the main key strata, the subsidence speed of the key stratum and the overlying weak rock stratum began to increase and gradually stabilized after 182 m into the goaf, indicating a gradual weakening of the roofing activity.
5 Comprehensive analysis of goaf and roof stability
The maximum stable distance along the strike direction in the middle of the goaf obtained by numerical simulation was 183.4 m, and that at the edge of the goaf obtained by the behavior characteristics of mine pressure in the gob-side entry was 135 m. This indicated that the influence of roof strata movement was greater on the middle of the goaf than that on the edge, resulting in the stability of the middle lagging behind that of the edge. The stability time of the edge of the goaf obtained from the behavior characteristics of the gob-side entry included the time when the working face was disrupted in production owing to special circumstances. When the working face advanced normally (5 m/d), the stability times of the goaf and roof obtained from the numerical simulation and field observation were 37 days and 27 days, respectively. From the aforementioned analysis, the basic stable distance along the strike direction in the middle of the goaf was 183.4 m after the coal mining, with a stable time of 37 days, while that of the goaf edge was 135 m after mining, with a stable time of 27 days. Therefore, when a mining roadway is excavated along the edge of a goaf, the heading face should lag behind the working face by at least 135 m or mining should be stopped at 27 days. When excavating a mining roadway along the middle of a goaf, the heading face should lag behind the working face by at least 183.4 m or mining should be stopped at 37 days.
The 1599 tail entry of the Xuyong No.1 coal mine is a gob-side entry driver. When the roadway was excavated, the adjacent 1597 working face was stopped at 52 days. The maximum roof-to-floor convergence during the excavation was 153 mm. Compared to the roof-to-floor convergence of 618 mm at 52 days after mining in Figure 3A, the displacement of the excavation roadway was significantly reduced, indicating that the influence of the goaf and roof activity on the gob-side entry was greatly reduced.
6 Conclusion
The study site was the 1295 working face of the Xuyong No.1 coal mine of the Sichuan Coal Group. The field mine pressure observation and numerical simulation method were used to analyze the rock pressure behavior characteristics of the gob-side roadway along the goaf edge and the roof stability characteristics along the strike direction in the middle of the goaf. The basic stability time and distance of the goaf and roof were also obtained. The main conclusions were as follows:
1) The influences of coal mining and roof activity on the mine pressure behavior of a mining roadway can be divided into five zones: pressure appearance, pressure concentration, violent roof activity, reduced roof activity, and stable roof.
2) The jointed rock mass model generated by the rigid block elements in the PFC method can simulate the elasticity, fracture, and post-peak softening of a rock mass. The maximum edge length of the rigid block increased from 0.1 m to 2.5 m, the number of joints decreased from 13,918 to 15, the fissure degree decreased from 20.0 to 0.8, and the classification of joints changed from very dense to sparse.
3) Owing to the non-uniformity and non-continuity of the rock blocks in the goaf, the abutment pressure in the goaf showed a discontinuous distribution characteristic of being high in the middle and low on both sides along the strike direction. The peak stress of some rock blocks in the goaf exceeded the in situ stress. The peak abutment pressure increased with increased goaf length; however, the average abutment pressure increased slowly after the goaf length exceeded 180 m, indicating that the roofing activity decreased gradually.
4) The influence of roof strata movement on the middle of the goaf was greater than that on the edge, resulting in the stability of the middle lagging behind that of the edge. The behavior characteristics of mine pressure in the gob-side entry included a basic stable distance along the strike direction of the goaf edge of 135 m after mining, with a basic stable time of 27 days. From the characteristics of abutment pressure and roof subsidence, the basic stable distance along the strike direction in the middle of the goaf was 183.4 m after mining, with a basic stable time of 37 days.
Data availability statement
The original contributions presented in the study are included in the article/Supplementary material. Further inquiries can be directed to the corresponding authors.
Author contributions
Conceptualization, FY and JT; methodology, FY and JT; software, FY; investigation, LK; writing—original draft preparation, FY; writing—review and editing, CL. All authors have read and agreed to the published version of the manuscript.
Funding
The authors declare that this study received funding from Sichuan Coal Group (Xuyong No.1 coal mine). The funder was not involved in the study design, collection, analysis, interpretation of data, the writing of this article, or the decision to submit it for publication.
Conflict of interest
The authors declare that the research was conducted in the absence of any commercial or financial relationships that could be construed as a potential conflict of interest.
Publisher’s note
All claims expressed in this article are solely those of the authors and do not necessarily represent those of their affiliated organizations, or those of the publisher, the editors, and the reviewers. Any product that may be evaluated in this article, or claim that may be made by its manufacturer, is not guaranteed or endorsed by the publisher.
References
Arasteh, H., Esmaeili, K., Saeedi, G., and Farsangi, M. A. E. (2022). Discontinuous modeling of roof strata caving in a mechanized longwall mine in tabas coal mine. Int. J. Geomech. 22 (5), 2337. doi:10.1061/(ASCE)GM.1943-5622.0002337
Chen, Q. F., and Liu, Y. X. (2012). Study on the size effect of goaf stability. Disaster Adv. 5 (4), 1597–1601.
Cheng, C., Chen, X., and Zhang, S. F. (2016). Multi-peak deformation behavior of jointed rock mass under uniaxial compression: Insight from particle flow modeling. Eng. Geol. 213, 25–45. doi:10.1016/j.enggeo.2016.08.010
Deng, K Z., Tan, Z X., and Zhang, H Z. (2012). Research on calculating method of residual subsidence of longwall goaf. J. China Coal Soc. 37, 1601–1605. doi:10.3390/su12041528
Gao, W. L., Zhang, Z. H., Li, B. J., and Li, K. P. (2021). Study on numerical simulation of geometric elements of blasting funnel based on PFC5.0. Shock Vib. 2021, 1–13. doi:10.1155/2021/8812964
Hu, Q. F., Deng, X. B., Feng, R. M., Li, C. Y., Wang, X. J., and Jiang, T. (2015). Model for calculating the parameter of the Knothe time function based on angle of full subsidence. Int. J. Rock Mech. Min. 78, 19–26. doi:10.1016/j.ijrmms.2015.04.022
Hu, Y. X., and Li, X. B. (2012). Bayes discriminant analysis method to identify risky of complicated goaf in mines and its application. T Nonferr Metal. Soc. 22 (2), 425–431. doi:10.1016/S1003-6326(11)61194-1
Kuang, T. J., Li, Z., Zhu, W. B., Xie, J. L., Ju, J. F., Liu, J. R., et al. (2019). The impact of key strata movement on ground pressure behaviour in the Datong coalfield. Int. J. Rock Mech. Min. 119, 193–204. doi:10.1016/j.ijrmms.2019.04.010
Li, B., Liang, Y. P., Zhang, L., and Zou, Q. L. (2019). Experimental investigation on compaction characteristics and permeability evolution of broken coal. Int. J. Rock Mech. Min. 118, 63–76. doi:10.1016/j.ijrmms.2019.04.001
Li, L., Wu, K., and Zhou, D. W. (2016). Evaluation theory and application of foundation stability of new buildings over an old goaf using longwall mining technology. Environ. Earth Sci. 75 (9), 763. doi:10.1007/s12665-016-5574-9
Li, M., Li, A. L., Zhang, J. X., Huang, Y. L., and Li, J. M. (2020). Effects of particle sizes on compressive deformation and particle breakage of gangue used for coal mine goaf backfill. Powder Technol. 360, 493–502. doi:10.1016/j.powtec.2019.10.075
Li, X. H., Yao, Q. L., and Zhang, Y. Q. (2018). Study of theory of mine strata control based on shear stress between stratum. Rock Soil Mech. 39 (7), 2371–2378. doi:10.16285/j.rsm.2016.2289
Potyondy, D. O., and Cundall, P. A. (2004). A bonded-particle model for rock. Int. J. Rock Mech. Min. 41 (8), 1329–1364. doi:10.1016/j.ijrmms.2004.09.011
Ren, L. W., He, P. F., Zou, Y. F., Dun, Z. L., Zou, Z. S., and Wang, S. R. (2022). A new classification method of mine goaf ground activation considering high-speed railway influence. Front. Earth Sc-Switz 10, 896459. doi:10.3389/feart.2022.896459
Sun, Y. J., Zuo, J. P., Karakus, M., and Wang, J. T. (2019). Investigation of movement and damage of integral overburden during shallow coal seam mining. Int. J. Rock Mech. Min. 117, 63–75. doi:10.1016/j.ijrmms.2019.03.019
Sun, Y. J., Zuo, J. P., Karakus, M., and Wen, J. H. (2020). A novel method for predicting movement and damage of overburden caused by shallow coal mining. Rock Mech. Rock Eng. 53 (4), 1545–1563. doi:10.1007/s00603-019-01988-1
Wang, R., Liu, Y. Y., Deng, X. H., Zhang, Y., Huang, X. D., and Ding, X. (2020). Analysis on loose circle of surrounding rock of large deformation soft-rock tunnel. Adv. Civ. Eng. 2020, 1–11. doi:10.1155/2020/8842976
Wu, H., Dai, B., Zhao, G. Y., Chen, Y., and Tian, Y. K. (2020). A novel method of calibrating micro-scale parameters of PFC model and experimental validation. Appl. Sci-Basel 10 (9), 3221. doi:10.3390/app10093221
Wu, Y., Zhao, Y., Tang, P., Wang, W., and Jiang, L. (2022). Analysis of the mechanical properties and failure modes of rock masses with nonpersistent joint networks. Geomech. Eng. 30 (3), 281–291. doi:10.12989/gae.2022.30.3.281
Xie, J. L., Xu, J. L., and Zhu, W. B. (2016). Gray algebraic curve model-based roof separation prediction method for the warning of roof fall accidents. Arab. J. Geosci. 9 (8), 514. doi:10.1007/s12517-016-2541-4
Yang, S. Q., and Huang, Y. H. (2014). Particle flow study on strength and meso-mechanism of Brazilian splitting test for jointed rock mass. Acta Mech. Sinica-Prc 30 (4), 547–558. doi:10.1007/s10409-014-0076-z
Yang, Z. Q., Liu, C., Zhu, H. Z., Xie, F. X., Dou, L. M., and Chen, J. H. (2019). Mechanism of rock burst caused by fracture of key strata during irregular working face mining and its prevention methods. Int. J. Min. Sci. Techno 29 (6), 889–897. doi:10.1016/j.ijmst.2018.07.005
Zhao, W. H., Huang, R. Q., and Yan, M. (2015). Mechanical and fracture behavior of rock mass with parallel concentrated joints with different dip angle and number based on PFC simulation. Geomech. Eng. 8 (6), 757–767. doi:10.12989/gae.2015.8.6.757
Zhao, W. H., Huang, R. Q., and Yan, M. (2015). Study on the deformation and failure modes of rock mass containing concentrated parallel joints with different spacing and number based on smooth joint model in PFC. Arab. J. Geosci. 8 (10), 7887–7897. doi:10.1007/s12517-015-1801-z
Keywords: goaf, stability, strata movement, roadway layout, PFC
Citation: Yuan F, Tang J, Kong L and Li C (2023) Layout timing of mining roadways considering goaf and roof stability. Front. Earth Sci. 10:1092585. doi: 10.3389/feart.2022.1092585
Received: 08 November 2022; Accepted: 21 December 2022;
Published: 09 January 2023.
Edited by:
Tianshou Ma, Southwest Petroleum University, ChinaReviewed by:
Qiangui Zhang, Southwest Petroleum University, ChinaDanqing Song, Tsinghua University, China
Copyright © 2023 Yuan, Tang, Kong and Li. This is an open-access article distributed under the terms of the Creative Commons Attribution License (CC BY). The use, distribution or reproduction in other forums is permitted, provided the original author(s) and the copyright owner(s) are credited and that the original publication in this journal is cited, in accordance with accepted academic practice. No use, distribution or reproduction is permitted which does not comply with these terms.
*Correspondence: Fang Yuan, MzQ4MzI5MDQ1QHFxLmNvbQ==; Jianxin Tang, anh0YW5nQGNxdS5lZHUuY24=; Lingrui Kong, ODc3OTg2ODQ4QHFxLmNvbSYjeDAyMDBhOw==; Cheng Li, MTAyMzMxMzgyOEBxcS5jb20=
 Fang Yuan
 Jianxin Tang1,2*