 Tingting Huang
 Zhihui Wang1,2*
- 1Laboratory of Soil and Water Conservation on the Loess Plateau of Ministry of Water Resources, Yellow River Institute of Hydraulic Research, Yellow River Conservancy Commission, Zhengzhou, China
- 2Henan Key Laboratory of Ecological Environment Protection and Restoration of the Yellow River Basin, Zhengzhou, China
- 3School of Hydrology and Water Resources, Hohai University, Nanjing, China
- 4College of Water Resources and Architectural Engineering, Northwest A&F University, Xianyang, China
The underlying surface parameters in the Budyko framework (such as parameter n in the Choudhury–Yang equation) are crucial for studying the relationship between precipitation, evapotranspiration, and runoff. It is important to accurately quantify the influence of climate and human activities on the evolution of underlying surface characteristic parameters. However, due to the spatiotemporal heterogeneity of underlying surface parameters, it is often difficult to accurately quantify these relationships. In this study, taking the Kuye River Basin located in the northern Loess Plateau as the research object, we first used trend analysis and non-linear regression methods to estimate the evolution characteristics of runoff and underlying surface parameter n. We then determined the contribution of runoff changes by using the elasticity coefficient method under the 9-year moving average window. The results showed that: 1) the Kuye River Basin runoff underwent a sudden change in 1997, and the complex human activities are the main reasons for the sharp runoff decrease. 2) In addition to precipitation and potential evapotranspiration, temperature changes will alter the basin’s underlying surface parameters, ultimately changing the runoff. Moreover, climate change first inhibited and then promoted the runoff reduction trend. 3) Human activities, represented by changes in vegetation coverage and coal mining, considerably influenced runoff evolution in Kuye River Basin. More importantly, the change of runoff in the Kuye River Basin caused by coal mining is approximately four times that of the normalized vegetation index. This study can improve the applicability of the Budyko framework in the Loess Plateau sub-basin and provide scientific guidance for water resource management.
1 Introduction
With global climatic and drastic changes in land use or vegetational cover in most areas, river runoff in many river basins in China has changed considerably (Xue et al., 2021; Gao et al., 2022; Yang et al., 2022). Since 1999, the Chinese government has implemented large-scale projects, such as returning farmland to forest and ecological restoration, which have intensified human activities in the Loess Plateau and indirectly affected the region’s underlying surface properties (Liu J. et al., 2021; Li H. et al., 2022). Changes in precipitation and evaporation directly alter regional runoff. The rainfall that falls to the forest canopy and plant leaf surface through redistribution increases the transpiration, absorption, and interception of vegetation, which will indirectly affect the hydrological cycle process of the basin (Bruno et al., 2022; Zhang et al., 2022) and change the runoff in the basin.
With the gradual increase in the environmental impact of global change, hydrologists have recognized that hydrologic model parameters show periodic change characteristics (Bittner et al., 2021). The hydrological model needs many calibrated parameters, however, the Budyko framework needs only calibrated one parameter. Therefore, it is very important to clarify the relationship between underlying surface parameters, climate factors, and human factors. The model has been widely used in land surface hydro-thermal coupling simulation and evolution mechanism analysis (Yang et al., 2021; Li and Quiring, 2022). Several methods have been proposed for studying the Budyko hypothesis, among which the p-fu (Xing et al., 2018; Ning et al., 2019), Choudhury-yang (Zhang et al., 2018; Meng et al., 2019; Hou et al., 2022), and Wang and Tang (Yao and Wang, 2022) formulas are commonly used. In the Budyko formula, the underlying surface parameter n reflects the influence of catchment characteristics and determines the shape of the Budyko curve. (Fang et al., 2016; Fu and Wang, 2019). However, the climate and the underlying surface are linked through the water cycle. Therefore, it is necessary to quantitatively separate climatic factors from the underlying surface factors through a series of methods to assess the contribution of climate and underlying surface factors to runoff change more accurately.
Relevant studies show that the underlying surface parameter n is closely related to climate factors. Ning et al. (2017) reported that the underlying surface parameter n is closely related to the climate anomaly index. Wang et al. (2021) reported that it is related to, among others, the Arctic Oscillation and El Niño. In addition, human activities are closely related to the underlying surface parameter n. Jiang et al. (2015) found that it is related to agricultural irrigation area. Wang et al. (2022) used the long short-term memory network method to reveal that it is closely related to the land-use type in the Loess Plateau. Guo et al. (2017) indicated that the amount of coal mining in the KRB increased significantly after 2000. Therefore, when constructing the correlation between the underlying surface parameter n and its related climate and human factors, the local closely related and representative influencing factors should be fully considered to improve the simulation accuracy of the Budyko model.
The Kuye River Basin (KRB) is an ecologically fragile area in the Loess Plateau (Zheng et al., 2021; Li X. et al., 2022). Recently, the significant reduction in runoff has seriously affected local industry, agriculture, quality of life, and other aspects (Yi et al., 2022; Zhang M. et al., 2019). Therefore, studying the spatiotemporal rule of runoff evolution in the KRB can provide insights into implementing and improving ecological restoration measures. Furthermore, based on the Budyko hypothesis framework, errors caused by the complexity and uncertainties of the parameters in hydrological models can be solved effectively (Zhang et al., 2015; Huang et al., 2022).
The aims of this study were as follows: 1) to show the evolution of runoff and meteorological variables and human activities variables (including vegetation coverage, water and soil conservation measures, and coal mining); 2) to accurately quantify the correlation between the time-varying parameter n) of the underlying surface in the 9-year moving window of the Budyko equation, climate, and human activity factors. Furthermore, the empirical formula of the underlying surface parameter n obtained by non-linear fitting in this study can improve the estimation accuracy of runoff and evapotranspiration; and 3) to quantify the contribution of climate change and human activities to runoff changes in the KRB by using the elasticity coefficient method.
2 Materials and methods
2.1 Study area and data sources
2.1.1 Study area
The KRB is located in the middle reaches of the Yellow River Basin, a first-level tributary of the middle reaches of the Yellow River. The total lengths of the mainstream, drainage area, and channel-specific drop are approximately 242 km, 8,706 km2, and 3.44%, respectively. KRB is “high in the northwest, low in the southeast,” and located in the southeast corner of the Mu Usu Desert (Figure 1). The long-term average annual precipitation is approximately 387 mm/year. Most of these precipitation events occur during the rainy season (June–September) in the form of high-intensity rainstorms. KRB has a typical arid and semi-arid climate with an uneven spatial distribution of precipitation and runoff, and its annual average temperature is approximately 7.6°C. Most runoff production modes in the basin are hyperosmotic. The spatial distribution pattern of precipitation and runoff in the basin is “more prevalent in the east, less in the west, more in the south, and less in the north” (Guo et al., 2017).
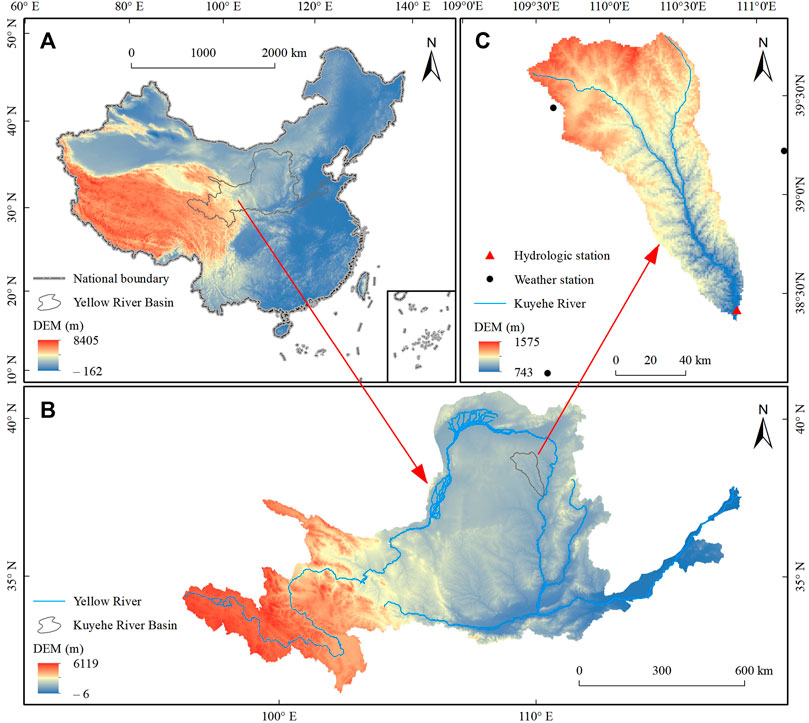
FIGURE 1. Location of the KRB in the Loess Plateau of China. (A) China, (B) The Loess Plateau, (C) The Kuye River Basin.
The spatial distribution patterns of underlying surface conditions in the basin are complex. The upper reaches are aeolian grassland areas, and the middle and lower reaches are loess gullies. Moreover, vegetation is scarce. Coupled with soil erosion dominated by hydraulic and wind erosion, the soil erosion in the basin is not optimistic. In the 1980s, large-scale ecological restoration measures were implemented, such as returning farmland to forest or grassland and soil and water conservation. During the early 21st century, The KRB’s human activities, mainly including Coal Mining, Returning Cropland to Forestland, and Water and soil conservation measures changed significantly. The above engineering measures changed the basin’s underlying surface, water, and sediment conditions.
2.1.2 Data sources
The 1981–2018 annual runoff data of the KRB were obtained from the China Hydrological Yearbook which was organized and compiled by the Ministry of Water Resources. In addition, the meteorological data, including daily precipitation, daily maximum temperature, daily minimum temperature, wind speed, sunshine duration, and water pressure, were obtained from 35 conventional meteorological stations in the KRB and its surrounding areas from the National Meteorological Information Center of the Chinese Meteorological Administration (http://data.cma.cn/).
The high-resolution radiometer (AVHRR) normalized vegetation index (NDVI) data between 1981 and 2018 were obtained from the Global Inventory Monitoring and Modeling Studies (GIMMS3g dataset) with a time resolution of 15 days. The spatial resolution was 8 km, and the annual and monthly NDVI data were synthesized in ENVI 5.0 using the maximum synthesis method. Leaf area index (LAI) data between 1981 and 2018 were obtained using an AVHRR from the National Earth System Science Data Center. The 30-m precision land-use data of 1980, 1995, 2005, and 2015 were obtained from the geospatial data cloud (http://www.gscloud.cn/). Coal mining data over the years were obtained from the “National Economic and Social Development Statistical Bulletin” and coal administration departments of counties and cities in the basin. Each county’s annual coal mining volume from 1981 to 2018 was obtained from the “Statistical Bulletin of National Economic and Social Development” and “Coal Management Department” of the KRB county. The annual coal mining volume of KRB can be calculated from the geographical location of each large coal mine.
2.2 Budyko framework
According to Budyko’s theory, the long-term actual evapotranspiration in a basin can be expressed as a function of potential evapotranspiration and precipitation combined with the water-balance equation over the years (Dzikiti et al., 2022; Fang et al., 2022). The water-balance formula is the basis of Budyko’s theory and can be expressed as
where R is the average annual runoff (mm) and E is the average annual evaporation (mm). ∆S is the variation in water storage in the basin, which is approximately 0 for the closed basin on a multiyear-time scale. Based on this, Choudhury and Yang et al. proposed the Choudhury–Yang formula (Yang et al., 2007):
Combined with equations (Xue et al., 2021; Yang et al., 2022), the average annual runoff of the basin can be expressed as:
where
2.3 Pettitt abrupt analysis
In this study, a non-parametric mutation detection method, the Pettitt mutation (Zhang et al., 2015), was used to identify the runoff mutation time of KRB and to divide the base and human activity periods. The Mann‒Whitney (Zhang Z. et al., 2019) statistics Kt and N were used to test two samples of the same population; the corresponding statistic p of Kt was calculated. p ≤0.05 indicates a significant mutation point in the statistical series.
2.4 Fitting underlying surface parameters with different factors
The semi-empirical expression based on the time-varying parameters of the underlying surface in the middle reaches of the Loess Plateau was established via an inter-annual scale by referring to the multiple linear least squares regression method previously described (Li et al., 2021) as follows:
where fPAR is the vegetation index, Tp is the average annual temperature, and REM is the number of soil and water conservation measures. Considering the rationality of the factors influencing the underlying surface parameters and location of the KRB in the Loess Plateau region, a non-linear regression method was used to fit the relationship between the underlying surface characteristic parameters and related factors. The expressions for the time-varying parameters of the underlying surface are derived as follows:
where x, y, and z represent vegetation-, climate-, and human activity-related factors, respectively, in the KRB; and a, b, c, and d are constants.
2.5 Elasticity coefficient
The elasticity coefficient of runoff to climatic and underlying surface is based on the Budyko curve (Liu et al., 2020). Assuming the drought index factor
Where
Moreover, combining Formula 5 and Formula 9, it is not difficult to obtain the elastic coefficient of vegetation, climate, and human activity related factors in the underlying surface parameters, which can be derived as follows:
Where
2.6 The contributions of climate change and human activities on runoff evolution
According to the Pettitt mutation test, the study period can be divided into the baseline and human activity periods. The 9-year sliding averages of p, R, ET0, and n of the base period were used as the base period. Therefore, the variation in runoff caused by changes in precipitation, potential evapotranspiration, and the underlying surface coefficient can be expressed as
where
Therefore, the contribution of each variable to runoff change is calculated as follows:
where
where
2.7 Simulation assessment of evaporation and runoff
In this study, three accuracy evaluation methods, i.e., coefficient of determination (R2), root mean square error (RMSE), and Nash efficiency coefficient (NSE), were used to evaluate evapotranspiration, calculated using the non-linear stepwise regression method and the linear fitting method, and constant underlying surface parameters. Degree of fit with actual watershed evapotranspiration.
R2 represents the squared error between the observed and simulated values; the larger the R2 value, the better the model fitting effect. The RMSE represents the sample standard deviation of the difference between the predicted and observed values and accounts for the dispersion of the sample. The smaller the RMSE, the better the model fitting effect. NSE represents the degree of fit between the simulated value of the model and the observer, similar to R2. However, its value ranges between -1 and one; the closer it is to 1, the better the simulation effect. The three coefficients were calculated using the following formulas:
where N represents the number of samples;
3 Results
3.1 Trend analysis of the annual hydroclimatic variables and artificial factors
To better understand the runoff evolution of the KRB between 1981 and 2018, the MK trend and Pettitt mutation tests were used to analyze the trends of the hydrometeorological series. Table 1 shows the results of the trend analysis. The mean annual runoff depth for the semi-arid KRB was 41.66 mm, showing an extremely significant decreasing trend of 1.05 mm/year. The average annual precipitation was 393.31 mm, showing an increase of 2.06 mm/year; this trend was not significant. However, the annual average potential evapotranspiration and underlying surface factor were 1,017.04 mm and 1.82, which showed a significant trend of increasing at a rate of 1.46 mm/year and 0.034/year, respectively. It can be preliminarily recognized from the Budyko formula that the significant reduction of KRB runoff in recent years may be closely related to the complex human activities in the study area, such as returning farmland to forests, water and soil conservation, water conservancy projects and other ecological restoration measures, resulting in significant changes in regional runoff. Figure 2A shows that the runoff changes of KRB from 1981 to 2018. Figure 2B shows that 1997 was the year of the runoff mutation in the study area. Therefore, 1997 was taken as the runoff mutation point, with 1981–1997 and 1998–2018 as the base and human activity periods, respectively.
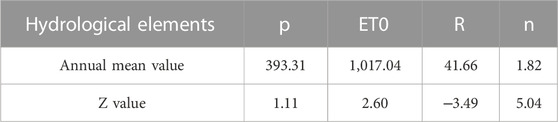
TABLE 1. Hydrological sequence evolution of KRB.
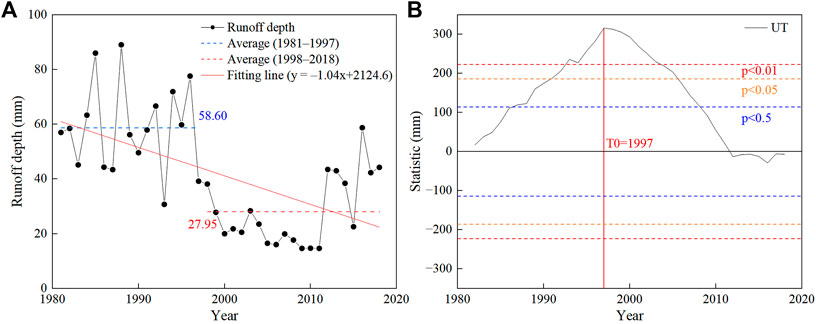
FIGURE 2. Runoff changes and Pettitt test statistics of runoff in the KRB (A) Runoff changes of KRB from 1981 to 2018 (B) Pettitt test statistics of runoff in the KRB.
3.2 Selection of the impact factors for the time-varying parameter
It should be noted that the above climate factors and human factors which related to the underlying surface parameter n change with time. Therefore, the time-varying characteristics of n should also be considered. According to the research of Li et al. (2017) and Zhang et al. (2001), the water storage capacity is 0 for more than 5–10 years. In order to better study the time-varying characteristics of the underlying surface parameter n and its attribution to runoff, the 9-year moving average window is adopted in this study. After removing the factors with smaller influencing factors, we conducted a non-linear regression on the time-varying parameters and influencing factors of the underlying surface; the results are shown in Figure 4. Regarding climatic factors, the time-varying parameters of the underlying surface had an insignificant positive correlation with precipitation, a significant positive correlation with potential evapotranspiration (p < 0.005), a highly significant positive correlation with air temperature (p < 0.001), and a highly significant negative correlation with air temperature (p < 0.001). Regarding vegetation influencing factors, the time-varying parameters of the underlying surface were positively and significantly correlated with the NDVI and LAI (p < 0.001). Finally, regarding anthropogenic factors, the time-varying parameters of the underlying surface were positively correlated with coal mining and REM (p < 0.001).
The influencing factors mentioned above were substituted into Eq. 8, and stepwise non-linear regression was conducted with time-varying parameters of the underlying surface. Finally, the expression with the highest fitting degree between the time-varying parameters of the underlying surface and the relevant factors in the KRB was obtained as follows:
where
3.3 The climate and artificial factor elasticity of runoff
The study (1981–2018) was divided into two periods, namely, the baseline period (1981–1989) and the post-baseline periods (1990–2018), based on the 9-year sliding average results of the influencing factors of runoff. According to Eq. s 7‒12 and 29, the mean value of the
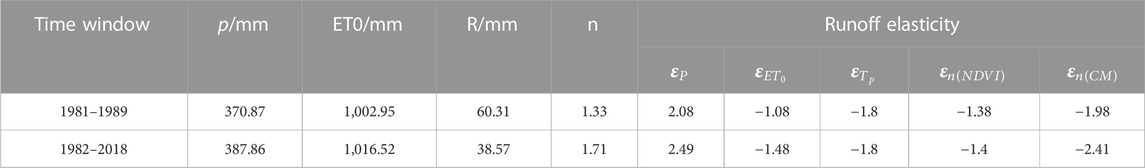
TABLE 2. Change of elastic coefficient of each factor in two periods.
It can be seen from the elastic coefficient results of the two periods that the elastic coefficient of runoff to precipitation is the largest, and the elastic coefficient of runoff to coal mining is the smallest. It shows that KRB precipitation and local coal mining will directly affect the runoff. Relative to the baseline period, the
The annual average change of runoff elasticity coefficient under the 9-year moving average window is shown in Figure 3. The
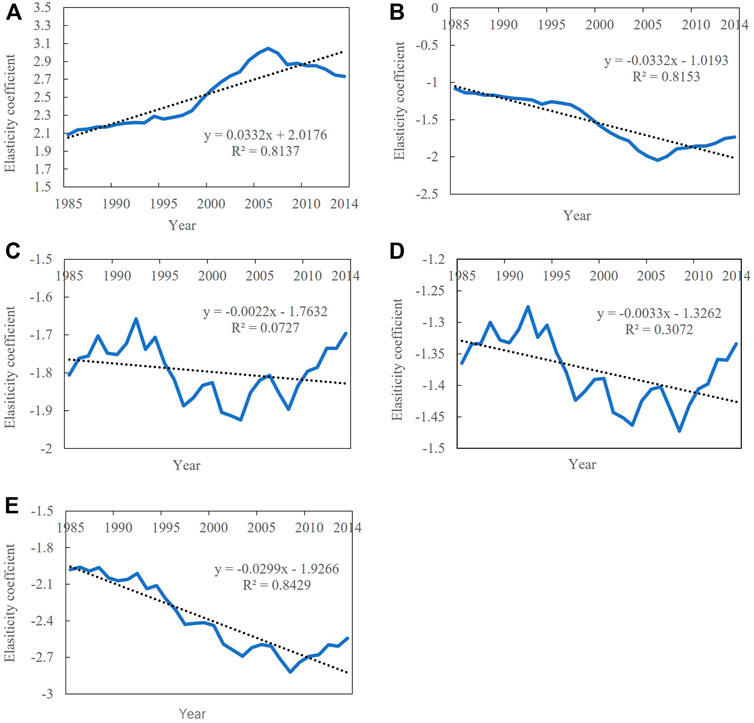
FIGURE 3. Correlation between climate and human activity factors and underlying surface parameters. (A) p, (B) ET0, (C) nc, (D) nh1, (E) nh2.
3.4 Quantitative attribution of runoff variation
The 1985 runoff eigenvalue was taken as the center. Between 1986 and 2014, the change in the characteristic parameters of the underlying surface caused by climatic change and human activities, resulting in a change in the runoff, is shown in Figure 4 a). Climatic factors and human activities were the main reasons for the sharp decrease in runoff in KRB. Moreover, runoff change caused by human activities was significantly greater than that caused by climatic change.
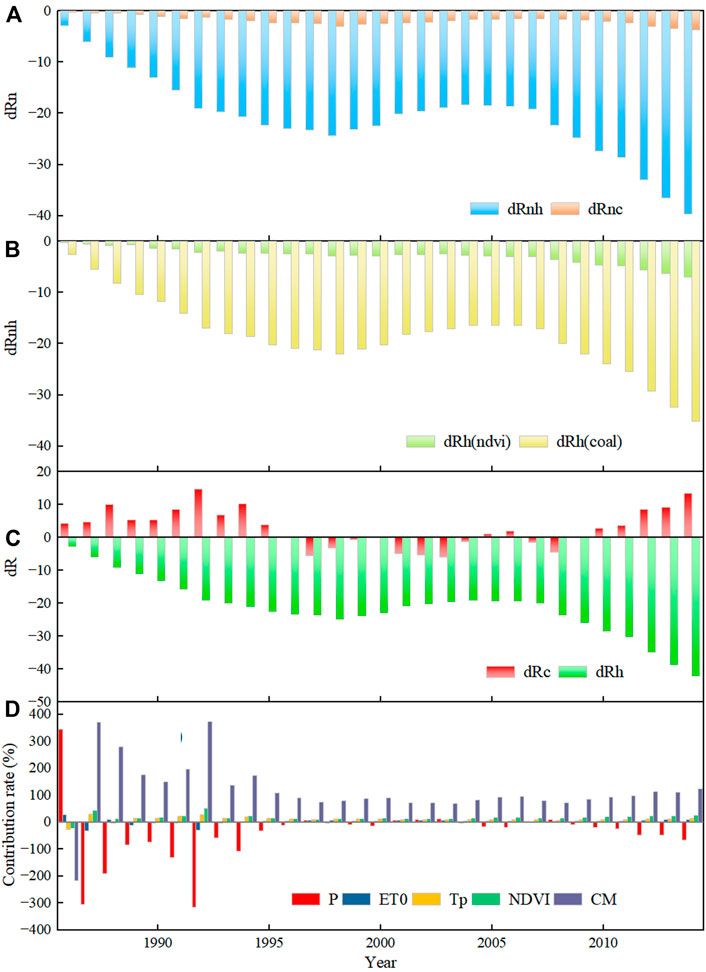
FIGURE 4. Attribution and contribution rate analysis of variables to runoff: (A) underlying surface parameters of nh and nc, (B) NDVI and Coal Mining, (C) Climate and human activities, and (D) contribution rate of runoff to each factor.
Figure 4 b) shows that between 1986 and 2014, the runoff change caused by the change in coal mining volume was larger than that caused by the change in vegetation coverage, as the measures of water and soil conservation and returning farmland to forests in the KRB have been implemented since the 1970s. In addition, the implementation of these projects was eased in the late 1980s. However, since the late 1980s, the coal mining volume in the KRB has increased annually. Therefore, the impact of coal mining on runoff is significantly greater than that of other anthropogenic activities.
Figure 4 c) shows that climatic change inhibited the sharp decrease of runoff in the basin. In contrast, changes in human activity have always facilitated the sharp decrease in runoff in the basin. However, the evolution of climatic factors has accelerated the reduction of watershed runoff since 1995, consistent with the research results of Li et al. (2021).
It can be seen from Figure 4 d) that coal mining has the largest positive contribution rate to the sharp decrease of KRB runoff, and the maximum contribution rate even exceeded 300%. On the contrary, precipitation greatly inhibited the reduction of KRB runoff. Additionally, potential evapotranspiration and temperature contributed less to runoff evolution. It is worth noting that from 1995 to 2014, the contribution rates of precipitation, potential evapotranspiration, temperature, vegetation cover, and coal mining to runoff reduction were—15%, 4%, 9%, 14%, and 88%, respectively.
4 Discussion
4.1 Runoff simulation comparison with linear relationship and constant parameter n
Previous studies have shown that underlying surface parameters have a linear relationship with vegetation coverage. This model has a good fit between the underlying surface parameters and vegetation coverage in 26 large basins (area > 300,000 km2) worldwide. However, in small basins (area < 50,000 km2), the linear relationship between vegetation coverage and underlying surface parameters is relatively weak (Li et al., 2013). Compared with the simulation results obtained using constant and linear fitting underlying surface parameters, the runoff simulated by time-varying underlying surface parameters is closer to the observed runoff (Figure 5). The stepwise non-linear regression method in this study considers the influence of three representative factors: climate, vegetation, and human activities. The time-varying parameter Budyko formula is suitable for the small watershed of KRB, which is influenced by human activities.
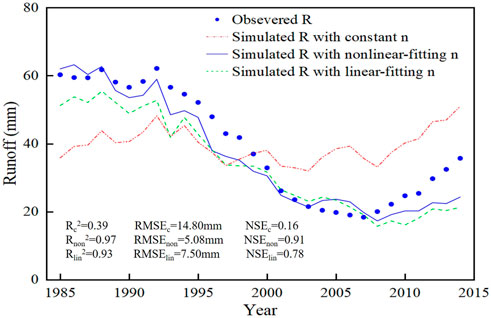
FIGURE 5. Comparison of Simulated runoff by using time-varying underlying surface parameters, linear fitting underlying surface parameters, and constant underlying surface parameters with observed runoff.
A comparison of variables (Figure 5) revealed that the method used in this study successfully separated climatic factors other than land use and vegetation cover in the underlying surface characteristic parameters (that is, the impact of temperature), leading to an increased contribution rate of climatic factors and a decreased contribution rate of human activities to runoff change. Therefore, considering the impacts of climate change in the future, watershed runoff evolution should be closely monitored.
4.2 The inclusion of coal mining in the characteristic parameters of this catchment area
Bao et al. (2019) used the Yellow River water-balance model to illustrate that coal mining in the KRB significantly impacts runoff reduction in the basin. Moreover, it has become the leading factor in runoff reduction (Guo et al., 2017; Liu Y.et al., 2021; He et al., 2022). This is because a large amount of coal mining will cause surface subsidence, leading to the formation of many underground graves and water diversion cracks, causing severe damage to the groundwater system and changes in the underlying surface conditions of the basin. Therefore, the significant impact on river runoff is directly reflected in the reduction of surface runoff. In addition, Wang et al. (2022) used the long short-term memory network method to reveal a high correlation between the time-varying parameters of the underlying surface and the area fraction of different land-use types in most basins of the Loess Plateau. Notably, it significantly correlated with the proportion of building area. Therefore, in this study, we explicitly considered the main local construction engineering industry (coal mining) and discussed its impact on the time-varying parameters of the underlying surface.
Figure 6 shows that the time-varying parameter n has a significant positive correlation with coal mining volume (R2 = 0.9056, p < 0.001). The impact of large-scale soil and water conservation measures on the Loess Plateau since the 1980s has increased vegetation coverage. According to Luan et al. (2020) and our results presented in Figure 7, the local coal resources in the KRB have significantly increased since 1997; the coal mining volume between 2005 and 2014 is the most evident. Furthermore, the land use change of the basin during the study period showed no significant change in the proportion of the building-type area of the basin during 1980–1995. Moreover, the basin’s proportion of building-type area between 1995 and 2018 increased significantly, primarily owing to the relatively developed local coal mining industry, leading to the transformation of local land-use types. The above analysis suggests that the change in the underlying surface characteristic parameters in the KRB is more closely linked to the change in coal mining volume than to vegetation coverage.
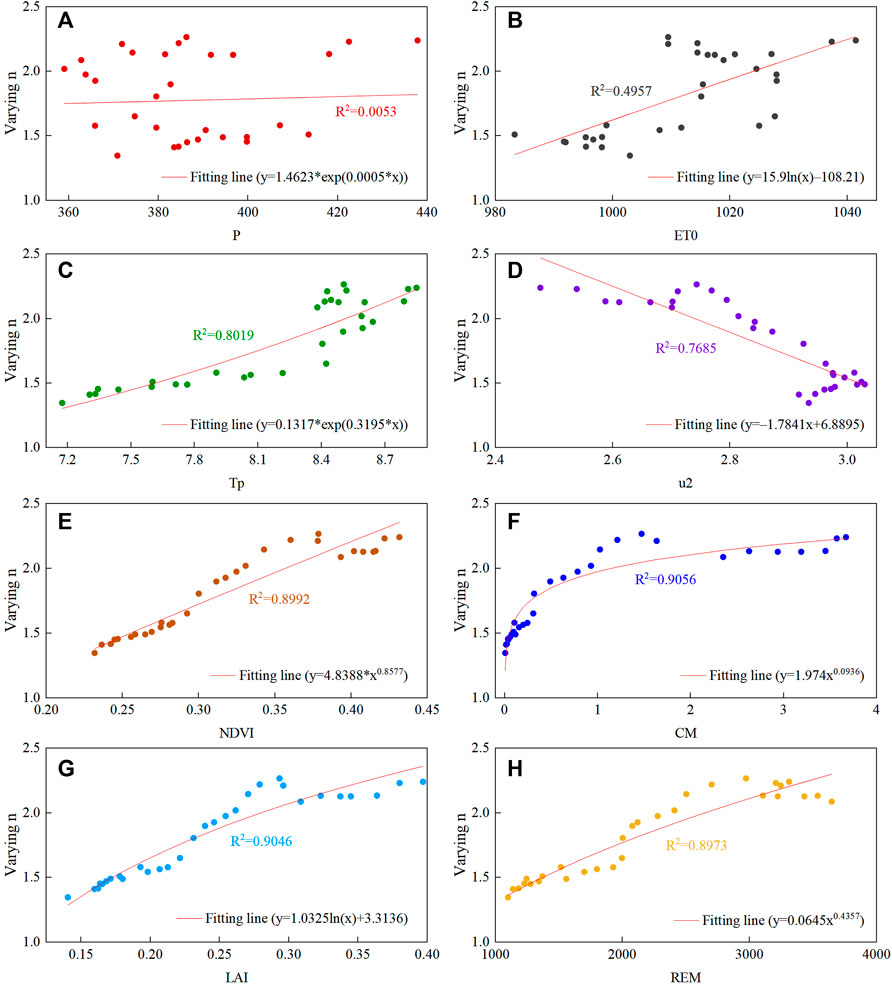
FIGURE 6. Variation of runoff elasticity coefficient of each factor (A) p, (B)
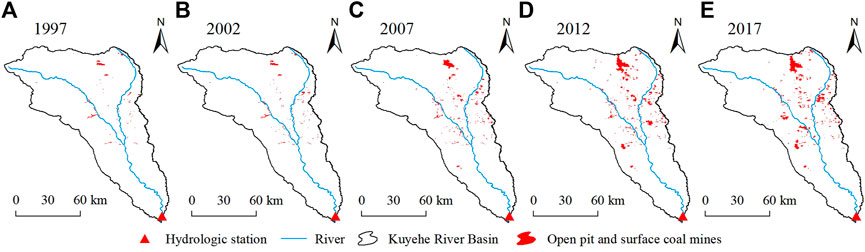
FIGURE 7. Coal mining situation in KRB in 1997, 2002, 2007, 2012, and 2017. (A) 1997, (B) 2002, (C) 2007, (D) 2012, (E) 2017.
4.3 Limitations
Errors and uncertainties still exist in estimating the underlying surface characteristic parameters in the KRB. For example, Wang et al. (2022) showed that different land-use area changes would have different impacts on the underlying surface characteristic parameters of the basin. Chen et al. (2018) affirmed that vegetation types would also affect the evolution characteristics of runoff in the basin. Furthermore, the conditions for establishing the Budyko formula are based on the water-balance equation, which assumes that the soil water change variable equals 0 over a long period. However, with urbanization, Bruno et al. (2022) found that the soil water change variable was not equal to 0. Therefore, the Budyko formula requires improvement. Changes in other natural factors, such as sunspots and El Niño-Southern Oscillation (ENSO) events, alter watershed runoff. In addition, owing to the spatial heterogeneity of the basin’s underlying surface characteristics, there will be errors in quantifying the impact of climate and human activities on runoff. Therefore, more high-precision data are required to improve the adaptability of the Budyko formula.
5 Conclusion
In this study, we first used the Choudhury–Yang formula and sensitivity analysis to clarify the evolution of watershed runoff characteristics caused by changes in climate and human activities. Second, the non-linear regression method was used to quantify the impact and contribution rate of changes more accurately in climate and human activities on the evolution of watershed runoff characteristics under the 9-year time window. The main conclusions are as follows:
1) The basin’s runoff experienced a sudden change in 1997; the KRB runoff in the human activity period decreased by 30.65 mm compared with the average annual runoff in the base period. The main factor affecting KRB runoff change is the change in the underlying surface parameters; moreover, the underlying surface parameters of the watershed showed a significant increase between 1981 and 2018.
2) According to the results of the non-linear regression, the main factors affecting the runoff change in the basin are the coal mining volume, followed by the NDVI, precipitation, temperature, and potential evapotranspiration. In addition, the change in basin temperature is an influencing factor for the change in the basin’s underlying surface parameters. The contribution of coal mining to the KRB runoff evolution is approximately four times that of the NDVI change. Therefore, we should focus on the exploitation of the KRB coal resources in the future.
3) Compared with constant underlying surface parameter simulation, using the non-linear regression method can more accurately estimate the runoff of the basin; the Nash coefficient of KRB runoff simulated by it can reach 0.91, which can effectively improve the applicability of the Budyko framework.
Data availability statement
The raw data supporting the conclusions of this article will be made available by the authors, without undue reservation.
Author contributions
Conceptualization, TH and ZHW; methodology, TH and ZHW; software, TH; validation, TH; formal analysis, TH; investigation, ZHW; resources, TH and ZYW; data curation, TH and ZW; writing—original draft preparation, TH and ZHW; writing—review and editing, TH, ZHW, and ZYW; visualization, YL; supervision, TH and ZYW; project administration, ZHW and PX; funding acquisition, ZHW and PX. All authors have read and agreed to the published version of the manuscript.
Funding
This research was funded by the Joint Funds of the National Natural Science Foundation of China (U2243212, U2243210), the Key Science and Technology Project of the Ministry of Water Resources (SKR-2022017), and Special Research Fund of the YRIHR (HKY-JBYW-2022-13).
Acknowledgments
I sincerely thank those who provide data references and advice for my study.
Conflict of interest
The authors declare that the research was conducted in the absence of any commercial or financial relationships that could be construed as a potential conflict of interest.
Publisher’s note
All claims expressed in this article are solely those of the authors and do not necessarily represent those of their affiliated organizations, or those of the publisher, the editors and the reviewers. Any product that may be evaluated in this article, or claim that may be made by its manufacturer, is not guaranteed or endorsed by the publisher.
References
Bao, Z., Zhang, J., Wang, G., Chen, Q., Guan, T., Yan, X., et al. (2019). The impact of climate variability and land use/cover change on the water balance in the Middle Yellow River Basin, China. J. Hydrol. 577, 123942. doi:10.1016/j.jhydrol.2019.123942
Bittner, D., Engel, M., Wohlmuth, B., Labat, D., and Chiogna, G. (2021). Temporal scale-dependent sensitivity analysis for hydrological model parameters using the discrete wavelet transform and active subspaces. Water Resour. Res. 57 (10), e2020WR028511. doi:10.1029/2020wr028511
Bruno, G., Avanzi, F., Gabellani, S., Ferraris, L., Cremonese, E., Galvagno, M., et al. (2022). Disentangling the role of subsurface storage in the propagation of drought through the hydrological cycle. Adv. Water Resour. 169, 104305. doi:10.1016/j.advwatres.2022.104305
Chen, H., Zhang, X., Abla, M., Lü, D., Yan, R., Ren, Q., et al. (2018). Effects of vegetation and rainfall types on surface runoff and soil erosion on steep slopes on the Loess Plateau, China. Catena 170, 141–149. doi:10.1016/j.catena.2018.06.006
Dzikiti, S., Lotter, D., Mpandeli, S., and Nhamo, L. (2022). Assessing the energy and water balance dynamics of rain-fed rooibos tea crops (Aspalathus linearis) under changing Mediterranean climatic conditions. Agric. Water Manag. 274, 107944. doi:10.1016/j.agwat.2022.107944
Fang, K., Shen, C., Fisher, J. B., and Niu, J. (2016). Improving Budyko curve-based estimates of long-term water partitioning using hydrologic signatures from GRACE. Water Resour. Res. 52 (7), 5537–5554. doi:10.1002/2016WR018748
Fang, Q., Xin, X., Guan, T., Wang, G., Zhang, S., and Ma, M. (2022). Vegetation patterns governing the competitive relationship between runoff and evapotranspiration using a novel water balance model at a semi-arid watershed. Environ. Res. 214 (4), 113976. doi:10.1016/j.envres.2022.113976
Fu, J., and Wang, W. (2019). On the lower bound of Budyko curve: The influence of precipitation seasonality. J. Hydrol. 570, 292–303. doi:10.1016/j.jhydrol.2018.12.062
Gao, Y., Xia, J., Chen, X., Zou, L., Huang, J., and Yu, J. (2022). Analysis of the nonstationarity characteristics and future trends of flood extremes in the Dongting Lake Basin. J. Hydrol. Reg. Stud. 44, 101217. doi:10.1016/j.ejrh.2022.101217
Guo, Q., Su, N., Yang, Y., Li, J., and Wang, X. (2017). Using hydrological simulation to identify contribution of coal mining to runoff change in the Kuye River Basin, China. Water Resour. 44 (4), 586–594. doi:10.1134/S0097807817040054
He, Y., Mu, X., Jiang, X., and Song, J. (2022). Runoff variation and influencing factors in the Kuye River basin of the middle Yellow River. Front. Environ. Sci. 10. doi:10.3389/fenvs.2022.877535
Hou, K., Wang, J., and Wang, X. (2022). Characteristic and attribution of runoff variation in the yanhe River Basin, Loess Plateau, based on the Budyko hypothesis. Water 14 (3), 495. doi:10.3390/w14030495
Huang, P., Song, J., Wu, Q., Sun, H., Mao, R., Cheng, D., et al. (2022). The ecohydrological effects of climate and landscape interactions within the Budyko framework under non-steady state conditions. Catena 217, 106481. doi:10.1016/j.catena.2022.106481
Jiang, C., Xiong, L., Wang, D., Liu, P., Guo, S., and Xu, C.-Y. (2015). Separating the impacts of climate change and human activities on runoff using the Budyko-type equations with time-varying parameters. J. Hydrol. 522, 326–338. doi:10.1016/j.jhydrol.2014.12.060
Li, D., Pan, M., Cong, Z., Zhang, L., and Wood, E. (2013). Vegetation control on water and energy balance within the Budyko framework. Water Resour. Res. 49 (2), 969–976. doi:10.1002/wrcr.20107
Li, H., Shi, C., Sun, P., Zhang, Y., and Collins, A. L. (2021). Attribution of runoff changes in the main tributaries of the middle Yellow River, China, based on the Budyko model with a time-varying parameter. Catena 206, 105557. doi:10.1016/j.catena.2021.105557
Li, H., Xiao, Z., Wei, J., and Wang, G. (2022a). The seasonal and diurnal variation characteristics of soil moisture at different depths from observational sites over the Tibetan plateau. Remote Sens. 14 (19), 5010. doi:10.3390/rs14195010
Li, X., Liu, X., and Yan, P. (2022b). Spatial variability of the physicochemical characteristics of surface sediments in the “three rivers and one dune” region in the Kuye River Basin, Mu us sandy land, China. CATENA 210, 105943. doi:10.1016/j.catena.2021.105943
Li, Z., Ning, T., Li, J., and Yang, D. (2017). Spatiotemporal variation in the attribution of streamflow changes in a catchment on China’s Loess Plateau. CATENA 158, 1–8. doi:10.1016/j.catena.2017.06.008
Li, Z., and Quiring, S. M. (2022). Projection of streamflow change using a time-varying Budyko framework in the contiguous United States. Water Resour. Res. 58 (10), e2022WR033016. doi:10.1029/2022WR033016
Liu, H., Wang, Z., Ji, G., and Yue, Y. (2020). Quantifying the impacts of climate change and human activities on runoff in the lancang River Basin based on the Budyko hypothesis. Water 12 (12), 3501. doi:10.3390/w12123501
Liu, J., You, Y., Zhang, Q., and Gu, X. (2021). Attribution of streamflow changes across the globe based on the Budyko framework. Sci. Total Environ. 794, 148662. doi:10.1016/j.scitotenv.2021.148662
Liu, Y., Tian, J., Liu, R., and Ding, L. (2021). Influences of climate change and human activities on NDVI changes in China. Remote Sens. 13 (21), 4326. doi:10.3390/rs13214326
Luan, J., Zhang, Y., Tian, J., Meresa, H., and Liu, D. (2020). Coal mining impacts on catchment runoff. J. Hydrol. 589, 125101. doi:10.1016/j.jhydrol.2020.125101
Meng, C., Zhang, H., Wang, Y., Wang, Y., Li, J., and Li, M. (2019). Contribution analysis of the spatial-temporal changes in streamflow in a typical elevation transitional watershed of Southwest China over the past six decades. Forests 10 (6), 495. doi:10.3390/f10060495
Ning, T., Li, Z., and Liu, W. (2017). Vegetation dynamics and climate seasonality jointly control the interannual catchment water balance in the Loess Plateau under the Budyko framework. Hydrol. Earth Syst. Sci. 21 (3), 1515–1526. doi:10.5194/hess-21-1515-2017
Ning, T., Zhou, S., Chang, F., Shen, H., Li, Z., and Liu, W. (2019). Interaction of vegetation, climate and topography on evapotranspiration modelling at different time scales within the Budyko framework. Agric. For. Meteorol. 275, 59–68. doi:10.1016/j.agrformet.2019.05.001
Wang, F., Xia, J., Zou, L., Zhan, C., and Liang, W. (2022). Estimation of time-varying parameter in Budyko framework using long short-term memory network over the Loess Plateau, China. J. Hydrol. 607, 127571. doi:10.1016/j.jhydrol.2022.127571
Wang, Y., Luo, Y., Shafeeque, M., Zhou, M., and Li, H. (2021). Modelling interannual variations in catchment evapotranspiration considering vegetation and climate seasonality using the Budyko framework. Hydrol. Process 35 (4). doi:10.1002/hyp.14118
Xing, W., Wang, W., Shao, Q., Yong, B., Liu, C., Feng, X., et al. (2018). Estimating monthly evapotranspiration by assimilating remotely sensed water storage data into the extended Budyko framework across different climatic regions. J. Hydrol. 567, 684–695. doi:10.1016/j.jhydrol.2018.10.014
Xue, D., Zhou, J., Zhao, X., Liu, C., Wei, W., Yang, X., et al. (2021). Impacts of climate change and human activities on runoff change in a typical arid watershed, NW China. Ecol. Indic. 121, 107013. doi:10.1016/j.ecolind.2020.107013
Yang, D., Sun, F., Liu, Z., Cong, Z., Ni, G., and Lei, Z. (2007). Analyzing spatial and temporal variability of annual water-energy balance in nonhumid regions of China using the Budyko hypothesis. Water Resour. Res. 43, W04426. doi:10.1029/2006WR005224
Yang, L., Zhao, G., Tian, P., Mu, X., Tian, X., Feng, J., et al. (2022). Runoff changes in the major river basins of China and their responses to potential driving forces. J. Hydrol. 607, 127536. doi:10.1016/j.jhydrol.2022.127536
Yang, Z., Song, J., Jiang, C., Wang, K., Zhao, L., and Hao, R. (2021). Contribution analysis of the streamflow changes in selected catchments on the Loess Plateau, China, using multiple budyko-based approaches. Water 13 (18), 2534. doi:10.3390/w13182534
Yao, L., and Wang, D. (2022). Hydrological basis of different Budyko equations: The spatial variability of available water for evaporation. Water Resour. Res. 58 (2), 2021WR030921. doi:10.1029/2021WR030921
Zhang, D., Liu, X., and Bai, P. (2018). Different influences of vegetation greening on regional water-energy balance under different climatic conditions. Forests 9 (7), 412. doi:10.3390/f9070412
Zhang, J., Zhang, T., Lei, Y., Zhang, X., and Li, R. (2015). Streamflow regime variations following ecological management on the Loess Plateau, China. Forests 7 (12), 6. doi:10.3390/f7010006
Zhang, L., Dawes, W. R., and Walker, G. R. (2001). Response of mean annual evapotranspiration to vegetation changes at catchment scale. Water Resour. Res. 37 (3), 701–708. doi:10.1029/2000wr900325
Zhang, M., Wang, J., and Zhou, R. (2019a). Attribution analysis of hydrological drought risk under climate change and human activities: A case study on Kuye River Basin in China. Water 11 (10), 1958. doi:10.3390/w11101958
Zhang, X., Wang, G., Xue, B., Wang, Y., and Wang, L. (2022). Spatiotemporal variation of evapotranspiration on different land use/cover in the inner Mongolia reach of the Yellow River Basin. Remote Sens. 14 (18), 4499. doi:10.3390/rs14184499
Zhang, Z., Ma, S., Shen, C., and Liu, C. (2019b). Estimating Mann–Whitney-type causal effects. Int. Stat. Rev. 87 (3), 514–530. doi:10.1111/insr.12326
Keywords: attribution analysis, runoff change, time-varying budyko framework, climate vibration, underlying surface change
Citation: Huang T, Wang Z, Wu Z, Xiao P and Liu Y (2023) Attribution analysis of runoff evolution in Kuye River Basin based on the time-varying budyko framework. Front. Earth Sci. 10:1092409. doi: 10.3389/feart.2022.1092409
Received: 08 November 2022; Accepted: 19 December 2022;
Published: 05 January 2023.
Edited by:
Xiaohu Wen, Northwest Institute of Eco-Environment and Resources (CAS), ChinaReviewed by:
Linshan Yang, Northwest Institute of Eco-Environment and Resources (CAS), ChinaZhenliang Yin, Northwest Institute of Eco-Environment and Resources (CAS), China
Copyright © 2023 Huang, Wang, Wu, Xiao and Liu. This is an open-access article distributed under the terms of the Creative Commons Attribution License (CC BY). The use, distribution or reproduction in other forums is permitted, provided the original author(s) and the copyright owner(s) are credited and that the original publication in this journal is cited, in accordance with accepted academic practice. No use, distribution or reproduction is permitted which does not comply with these terms.
*Correspondence: Zhihui Wang, d2FuZ3poaWh1aUBoa3kueXJjYy5nb3YuY24=