 Xianyu Yang
 Douwang Li1
 Kai Wu
94% of researchers rate our articles as excellent or good
Learn more about the work of our research integrity team to safeguard the quality of each article we publish.
Find out more
ORIGINAL RESEARCH article
Front. Earth Sci., 20 January 2023
Sec. Atmospheric Science
Volume 10 - 2022 | https://doi.org/10.3389/feart.2022.1090221
This article is part of the Research TopicExtreme Precipitation in Arid Regions: Observation, Mechanisms, and SimulationsView all 9 articles
The warming climate driven by global change has great potential in altering regional and global hydrologic cycles, thus leading to considerable changes in spatial variability and temporal pattern of precipitation. Northwest China (NW) has witnessed a significant wetting trend over the past decades, while the persistence of this wetting trend and potential changes in precipitation under future climate impacts remains elusive. In this study, long-term meteorological observations were used to probe historical variations of precipitation from 1951 to 2020, and the WRF model was employed as a regional climate model to examine future precipitation patterns over NW. Two 9-year downscaled WRF simulations were conducted comprising of historical (WRF-HIST; 2012–2020) and future climate change scenarios (WRF-SSP585; 2047–2055) using bias-corrected global climate model outputs from Coupled Model Intercomparison Project Phase 6 (CMIP6). Compared with ground observations, the WRF model exhibited strong capability in capturing the spatial pattern and temporal variations of precipitation across the NW. Intense precipitation was mainly found in stations located at northern NW and southeastern NW. Summertime precipitation substantially contributed to annual precipitation over the study region. Future precipitation projections suggest significant decreases of precipitation across the southern and eastern NW, with a stronger reduction magnitude in summer. Further, extreme precipitation events were projected to decrease in spring and summer, suggesting that the NW may become drier and the wetting trend may shift to another pattern in the 2050s under the SSP585 climate scenario. Overall, this study reveals historical and future potential changes in precipitation over NW through a high-resolution, dynamically downscaled dataset from WRF modeling, which in turn will help inform regional mitigation and adaption on potential impacts of future climate change on NW.
The Northwest China (NW) situated in the hinterland of Eurasia is the largest arid region in East Asia. Historically, intense land-atmosphere interactions featured by rare water vapor and descent motion caused this area to become a vast arid and semiarid region (Koster et al., 2004). In addition, the unique geographic location (lies in the shadow of the Tibetan Plateau) and climate variability caused severe droughts (with annual accumulated precipitation less than 400 mm) over the past few decades (Shi et al., 2007). The land use and land cover over this area is characterized by deserts (Taklimakan desert, Gobi desert, etc) and sandy land, thus highly sensitive to climate change (Wang, et al., 2021). The response of precipitation changes to the warming climate in this region has important implications on depicting potential impacts on the arid environment and Qinghai-Tibet Plateau (Lu et al., 2019).
Previous studies have investigated the historical temporal pattern and spatial changes of precipitation over Northwest China based on ground-level meteorological observations, numerical weather models, and satellite products (Li et al., 2013; Yang et al., 2017). Sui et al. (2013) found that the precipitation in winter and spring exhibited an increasing trend in Northwest China from 1961 to 2019. Recent studies have shown that the climate feature in Northwest China is shifting from “dry and warm” to “wet and warm” in the past few decades (Wang et al., 2021). Han et al. (2016) indicated that the increased frequency of convective precipitation trigged by warming climate may explain the dry to wet climate change. Li et al. (2016) attributed the increasing trend of precipitation to the impacts of west Pacific subtropical high and North America subtropical high on the water vapor transport. Using the JRA55 reanalysis dataset and ground-level mean precipitation observations, Peng & Zhou, (2017) suggested that enhanced evaporation induced by increased downward longwave radiation acted as the dominant contributor to the wetting trend during 1961–2010. While several mechanisms have been proposed for explaining the wetting trend, the knowledge gap remains between climate-driven impacts on precipitation across Northwest China (Qin et al., 2021).
Given the warming climate, the spatial pattern and temporal variations of precipitation are expected to change substantially; thus, accurately interpreting climate model projections for this region is essentially needed. As a crucial part of the efforts made by World Climate Research Programme (WCRP), the datasets generated from phase 6 of the Coupled Model Intercomparison Project (CMIP6) (Eyring et al., 2016) which aims to provide an improved understanding of global and regional climate change have been widely used in previous studies for assessing changes in clouds, aerosols, radiative forcing, and internal variability under various shared socio-economic pathway (SSP) (Akinsanola et al., 2020; Grose et al., 2020; Abdelmoaty et al., 2021; Almazroui et al., 2021; Watters et al., 2021). Compared with the preceding experiment (CMIP5), considerable improvements in capturing decadal climate variability by CMIP6 are expected attributed to advanced methods and ensemble techniques. Therefore, CMIP6 provides a unique opportunity for shaping a much-detailed view of future projections of precipitation over northwest China.
In this study, historical observation of precipitation from 1951 to 2020 is adopted to identify precipitation changes over the past several decades. Further, WRF simulations are conducted by using reanalysis data and dynamic downscaled inputs from bias-corrected CMIP6 model outputs under Shared Socioeconomic Pathway 5–8.5 (SSP585) scenario over the Northwestern China. Comparisons between projected precipitation in the future climate scenario and historical simulations are used to depict climate-driven precipitation changes in Northwestern China. This paper is organized as follows. Section 2 provides the details of observation data, WRF model setup, and bias-correction procedure for CMIP6 datasets. In Section 3, historical changes and regional analyses of precipitation between different scenarios are presented. Section 4 summarize major findings and conclusions of the results.
As various global climate models exhibit varying degrees of precipitation changes in future projections, bias-correction procedure is essentially needed for addressing the limitations of model bias (Xu & Yang, 2012; Xu et al., 2019). Here, we use a global bias-corrected dataset which has a horizontal grid resolution of 1.25° × 1.25° at 6-h intervals. This dataset is reconstructed from 18 models in CMIP6, which not only has mean climate conditions from ECMWF Reanalysis v5 (ERA5) and interannual variance, but also includes a non-linear trend from the ensemble mean of the 18 CMIP6 models. More details about this dataset can be found in Xu et al. (2021). In CMIP6, Shared Socioeconomic Pathways (SSPs) are developed for representing scenarios of projected socioeconomic global changes which correspond to estimated greenhouse gas (GHG) emissions under various climate policies. Here, we use the SSP585 scenario which considers high GHG emissions with a radiative forcing of 8.5 W/m2 in the year 2,100. This scenario has been widely used in projecting climate extremes in prior studies.
WRFv4.1.1 is used in this study to downscale global climate model outputs from CMIP6. In previous work, WRF has been extensively used in investigating precipitation pattern and examining land-atmosphere interactions over Northwestern China (Wen et al., 2012; Duan et al., 2018; Yan et al., 2020; Hui et al., 2022). Two nested domains with grid resolution of 27 km and 9 km are adopted, as shown in Figure 1. The WRF physics schemes used in this study include Lin scheme for microphysics (Lin et al., 1983), revised MM5 for surface layer (Jiménez et al., 2012), Rapid Radiative Transfer Model (RRTM) longwave radiation (Iacono, 2011), Goddard short wave radiation (Chou & J.Suarez, 1999), Noah-LSM for land-surface parameterization (Chen & Dudhia, 2001), Yonsei University PBL parameterization (Hong et al., 2006). These schemes are selected based on best model performance yielded from sensitivity experiments performed in prior studies (Wu et al., 2020, 2021; Yang et al., 2021). For historical simulations (hereafter referenced as WRF-HIST), initial and boundary conditions of WRF are acquired from National Center for Environmental Prediction (NCEP) Final Analysis (FNL) data with 1° × 1° resolution and 6 h interval over 2012–2020. To reduce accumulated model bias for long-term simulations, the WRF model is re-initialized every month with extended simulation period (ahead of 3 days for each month and these 3-day simulation is treated as spin-up). In contrast, the periods of 2047–2055 were selected to represent a future decadal period in this study. The future year simulation is performed under SSP585 scenario (hereafter referenced as WRF-SSP585), which is driven by bias-corrected CMIP6 global outputs (as discussed in Section 2.1).
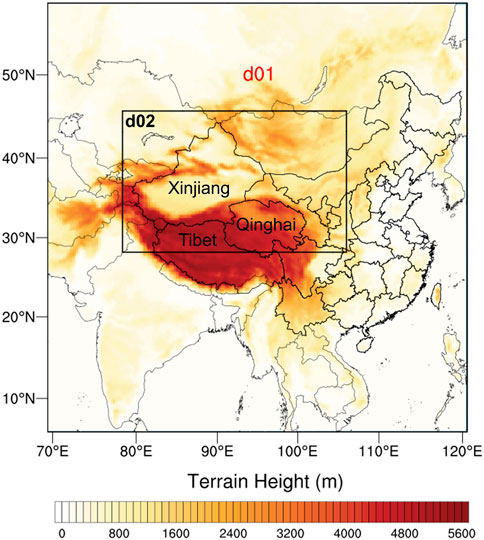
FIGURE 1. Map of the two nested WRF model domains.
In total, daily precipitation data of 145 stations from the China Meteorological Data Service Centre (CMDSC) are used in this study following rigorous data quality check (http://data.cma.cn/) (Locations shown in Figure 2). This dataset has been widely used in prior studies for investigating spatial pattern of precipitation across the NW (Peng & Zhou, 2017).

FIGURE 2. Spatial map of observed annual average precipitation across Northwestern China during 1951–2020. (Note: The color shaded area presents terrain height).
Figure 2 presents the map of time-averaged annual precipitation observed by ground-level meteorological stations across NW from 1951–2020. Spatially, the driest stations with annual total precipitation less than 50 mm are situated over vast areas of western NW (particularly west Xinjiang Province). In contrast, stations located in the eastern NW are much wetter where annual precipitation is almost 6 times higher than western NW. This pattern is broadly consistent with prior studies which revealed that climatological mean precipitation in NW exhibits decreases from east to west.
In the past several decades, a wetting trend has been identified over the NW based on surface meteorological observations and the reanalysis dataset. However, the seasonal pattern of precipitation changes remains poorly understood and thus warrants further investigation. The climatological mean precipitation in four seasons (spring, March-April-May (MAM); summer, June-July-August (JJA); autumn, September-October-November (SON); and winter, December-January-February (DJF)) is shown in Figure 3. Moreover, the contributions of seasonal precipitation to annual accumulated precipitation from 1951 to 2020 are depicted in Figure 4. Evidently, summertime precipitation substantially affects annual accumulated precipitation over time with a contribution generally greater than 50%, which suggests the governing role in determining interannual variations of NW precipitation. This is consistent with findings reported by Peng & Zhou, (2017) who attributed the summertime wetting trend over NW to increased evaporation induced by the convergence of moisture flux based on moisture budget analysis. In addition, the contributions of autumn and spring to the long-term trend of precipitation changes could not be neglected, which corresponds to ranges between 10%–36% and 10%–30% over the study period, respectively. Unlike strong interannual variability in other seasons, the proportion of wintertime precipitation on annual precipitation is persistently low (generally less than 4%), which is associated with the climate features over this vast arid region.
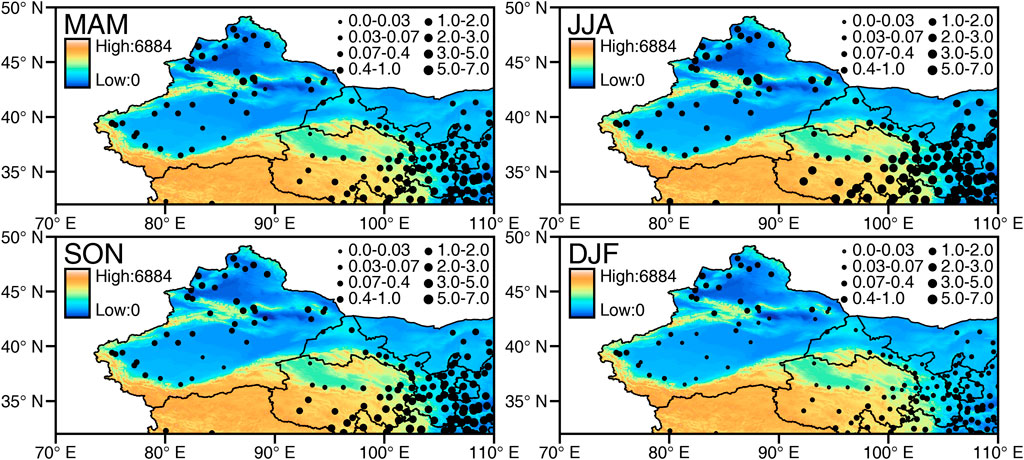
FIGURE 3. Seasonal pattern of observed climatological mean precipitation (unit: mm/day) over Northwestern China from 1951–2020. (Note: The color shaded area presents terrain height).
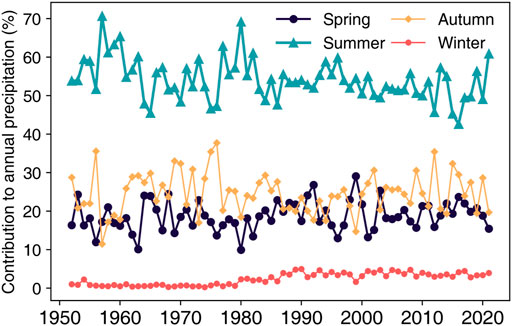
FIGURE 4. Contributions of seasonal precipitation to annual precipitation from 1951–2020.
In this section, WRF-HIST simulations over 2012–2020 are compared with future years based on dynamic downscaled WRF simulations driven by CMIP6 outputs. Figure 5 shows multi-year mean precipitation at an annual perspective over NW in WRF-HIST and WRF-SSP585 scenarios, respectively. Furthermore, the seasonal average of multi-year precipitation and corresponding changes compared to WRF-HIST are presented in Figure 6. To evaluate the model performance of WRF in replicating the variations of precipitation, simulated precipitation in the WRF-HIST experiment is compared against annual total stationary precipitation from 2012 to 2020, as shown in Supplementary Figure S1. While the WRF model tends to slightly overestimate precipitation over western NW, the spatial pattern of precipitation simulated by WRF-HIST generally agrees well with ground meteorological observations, which implies the strong capability of the WRF model due to robust physical parameterization schemes in WRF configuration.
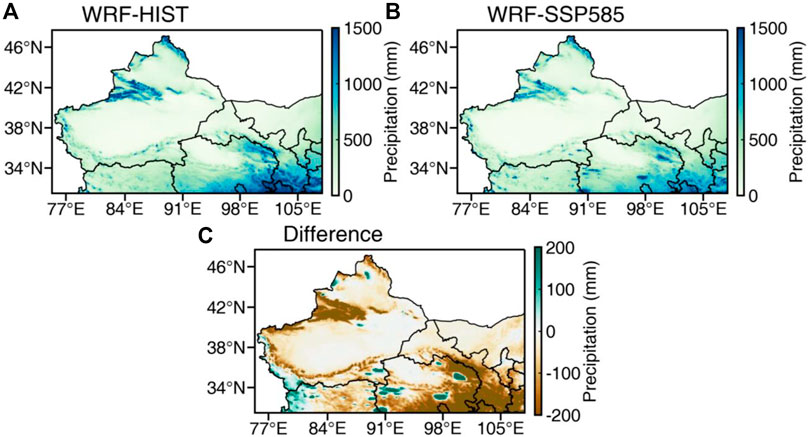
FIGURE 5. Multi-year annual average precipitation simulated by WRF-HIST (2012–2020) and WRF-SSP585 (2047–2055) experiments over Northwest China.
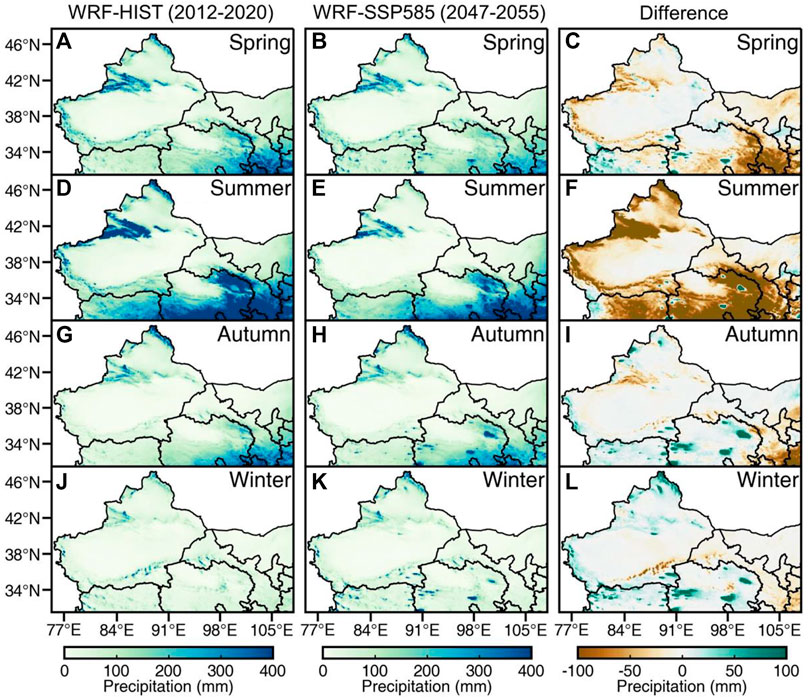
FIGURE 6. Multi-year seasonal average precipitation projected changes simulated by WRF-HIST (2012–2020) and WRF-SSP585 (2047–2055) experiments over Northwest China.
As seen in Figure 6, the spatial distribution of precipitation over NW under WRF-SSP585 is broadly consistent with WRF-HIST, where intense precipitation is found over southeastern and northwestern NW. However, the behavior of seasonal mean precipitation spans the range from profound decreases to substantial increases, with magnitude changes of precipitation varying across the model domain. It can be clearly seen that obvious changes in annual precipitation are noted in WRF-SSP585 simulations, featured by substantial decreases over southern and southeastern NW. This phenomenon suggests that the wetting trend depicted during the past several decades may not persist through the 2050s under the projected pathways. However, southern areas of Xinjiang Province and western regions of Qinghai Province do not experience significant changes in average precipitation, which is mainly attributed to the limited water vapor caused by deserts and sandy land cover.
Seasonally, the most significant changes in future projected precipitation are noted in summer which depicts region-wide substantial decreases of precipitation, except for considerable increases over Qinghai Lake, Eling Lake, and Gyaring Lake situated in eastern Qinghai Province. The large decrease in precipitation in the warm season is perhaps induced by the widespread projection of warm conditions across the study domain by CMIP6 models. In contrast, northern and southern NW are projected to become wetter in autumn and winter in the 2050s, with remarkable increases in precipitation (increment magnitude higher than 100 mm). Moreover, moderate enhanced precipitation (approximately 50 mm) is found over the western region of NW in autumn and winter. It is worth noting that there is a clear increasing precipitation intention over Qinghai Lake, Eling Lake, and Gyaring Lake in autumn and winter with larger areas compared with summertime, indicating strong lake-atmosphere interactions simulated by the WRF-SSP585 experiment. The changing seasonal patterns imply that future climate change could exert a profound influence on regional hydroclimate. While the spatial changes of precipitation in the 2050s are coincident with prior studies discussing the impacts of climate change over northern China (Veiga & Yuan, 2021), it should be noted that a recent study by Zhang et al. (2022) found that the wetting trend will persist throughout the 2030s and 2040s based on outputs from global climate models in CMIP6. This discrepancy might be linked to the bias-correction process and dynamic downscaling and additional investigations are essentially needed for elucidating clear explanations.
Owing to the unique topography and land cover types, extreme precipitation could result in serious environmental consequences. Thus, investigations on the occurrence of extreme precipitation events are warranted. Herein, we use the methods introduced by Lu et al. (2021) to calculate extreme precipitation events. Firstly, a precipitation event is defined when the daily precipitation of each model grid exceeds 0.1 mm. Then we use the 90th percentiles precipitation to obtain the thresholds of extreme precipitation events. Once simulated daily precipitation for a model grid is in excess of the threshold, it is identified as an extreme precipitation event. Following this method, the annual and seasonal extreme precipitation events over NW are quantified.
Figure 7 shows the multi-year average of extreme precipitation days (EPD) across NW simulated by WRF-HIST and WRF-SSP585, respectively. The regions with extreme precipitation are mainly concentrated in the south and northwest NW and the frequency of EPD peaks in the northwest region, which is in good agreement with the spatial pattern of EPD across NW identified by Lu et al. (2021). Moreover, it is interesting to note that this spatial pattern is consistent with precipitation distribution and regions with large decreases of EPD generally correspond to intense precipitation (as shown in Figure 5). This phenomenon suggests that not only the total amount of precipitation will decrease in response to future climate change under SSP585 scenario, but the intensity of precipitation will also decrease significantly. While previous work have reported that EPD exhibited a significant rising trend between 1961 and 2016 and most increases of precipitation over NW could be attributed to EPD over time (Lu et al., 2021), our work clearly show that future climate change greatly impacts precipitation extremes over NW which characterized by decreases in both total precipitation and EPD. Zoom into seasonal pattern of EPD (Figure 8), it can be clearly seen that the EPD in the WRF-SSP585 scenario in both spring and summer decreased significantly, particularly in summer, which implies that the decrease of EPD had a large impact on the projected precipitation decreases and the transition of the wetting trend in the 2050s over NW. In addition, it is worth noting that southern areas of NW experience an increase of EPD in winter, which might be linked to the shift of weather patterns and alteration of water vapor budget.
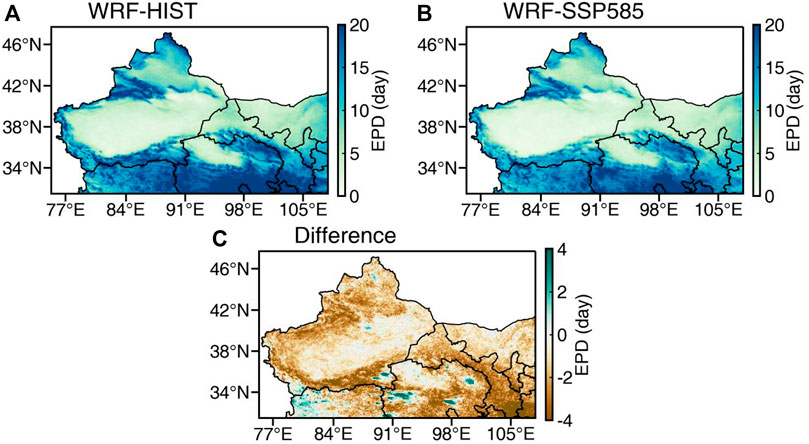
FIGURE 7. Multi-year annual mean extreme precipitation days (EPD) simulated by WRF-HIST (2012–2020) and WRF-SSP585 (2047–2055) experiments and corresponding changes over Northwest China.
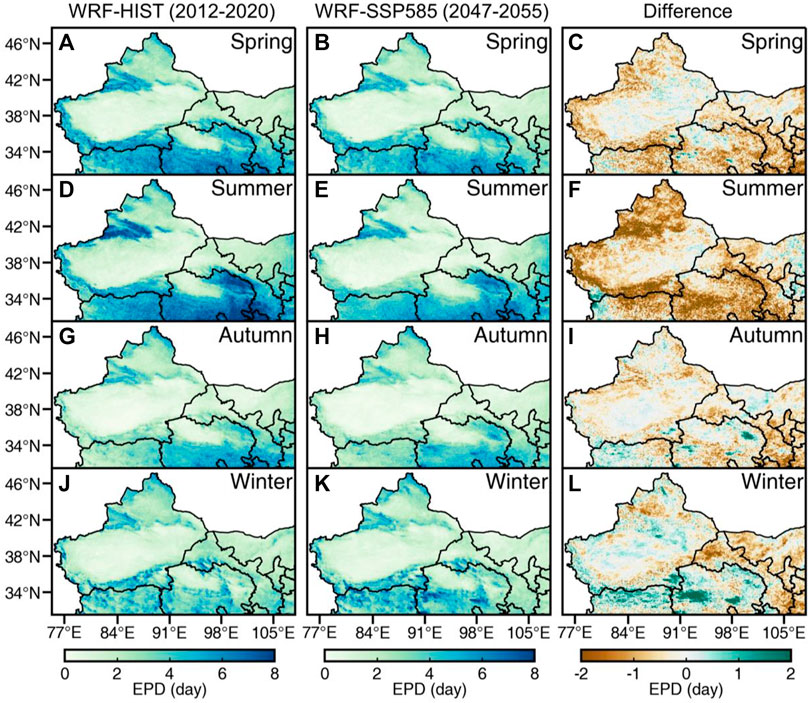
FIGURE 8. Multi-year seasonal average extreme precipitation days (EPD) and corresponding changes simulated by WRF-HIST (2012–2020) and WRF-SSP585 (2047–2055) experiments over Northwest China.
In this study, ground precipitation observations from 1951–2020 in combination with long-term WRF simulations forced by the NCEP-FNL dataset and bias-corrected CMIP6 outputs are used to assess historical and future potential precipitation changes over a climate-sensitive region, Northwest China. Compared with surface meteorological observations from 2012 to 2020 collected from CMDSC, the WRF model performs well in capturing spatial patterns of precipitation and interannual variations over NW. Based on the long-term observation dataset, it is found that strong precipitation is mainly depicted over stations located in the southeastern and northern NW. For seasonal patterns, summertime precipitation acts as the dominant contributor to annual total precipitation over this region.
The potential changes in precipitation over NW simulated by WRF with bias-corrected CMIP6 outputs are analyzed for pinpointing climate-driven impacts on precipitation across NW. It is shown that there might be a region-wide decrease in annual precipitation in the 2050s, as compared with the historical period (2012–2020). Although slight increases in precipitation are found over northern areas of Xinjiang Province and southern NW in autumn and winter, the net effects of future climate change under the SSP585 scenario present substantially reduced precipitation over the study domain. In contrast, apparent increases in precipitation are seen over inland Lakes situated in western Qinghai Province, suggesting the potential contribution from lake-atmosphere interactions. Similar to the variations of annual precipitation, the frequency of extreme precipitation events is found to be decreased in the 2050s, particularly for the summer season.
This study disentangles potential future changes of precipitation over NW in the 2050s through dynamic downscaling WRF simulations and indicates the possible shift of the wetting trend observed since the 1980s. Nevertheless, future projections may have considerable uncertainties which primarily arise from physical parameterizations configured in WRF, ensemble model members acquired from CMIP6, future climate pathways, etc. Therefore, additional efforts in identifying the potential changes of precipitation and wetting trend under various pathways are essentially needed and deserve further study.
The raw data supporting the conclusion of this article will be made available by the authors, without undue reservation.
XY and ZY designed this work and wrote the original draft. DL, KW, and LJ conducted formal analysis and revised the paper. ZY, ZZ, and LJ contributed to the data collection and analysis. XY and YL supervised this work and provide project administration. All authors contributed to manuscript and approved the submission.
This work was supported by the National Natural Science Foundation of China (No. 41975130, No. 41975135), the project “Simulations and Projections of Precipitation over Northwest China Based on CMIP6 Models” funded by the National Training Program of Innovation and Entrepreneurship for Undergraduates (No. 202210621004), Sichuan Province Training Program of Innovation and Entrepreneurship for Undergraduates (No. 202210621004, No. 202210621001), and Open Research Fund Program of Plateau Atmosphere and Environment Key Laboratory of Sichuan Province (No. PAEKL-2020-C6).
The authors declare that the research was conducted in the absence of any commercial or financial relationships that could be construed as a potential conflict of interest.
All claims expressed in this article are solely those of the authors and do not necessarily represent those of their affiliated organizations, or those of the publisher, the editors and the reviewers. Any product that may be evaluated in this article, or claim that may be made by its manufacturer, is not guaranteed or endorsed by the publisher.
The Supplementary Material for this article can be found online at: https://www.frontiersin.org/articles/10.3389/feart.2022.1090221/full#supplementary-material
Abdelmoaty, H. M., Papalexiou, S. M., Rajulapati, C. R., and AghaKouchak, A. (2021). Biases beyond the mean in CMIP6 extreme precipitation: A global investigation. Earth's. Future 9 (10). doi:10.1029/2021EF002196
Akinsanola, A., Kooperman, G., Pendergrass, A., Hannah, W., and Reed, K. (2020). Seasonal representation of extreme precipitation indices over the United States in CMIP6 present-day simulations. Environ. Res. Lett. 15 (9), 094003. doi:10.1088/1748-9326/ab92c1
Almazroui, M., Islam, M. N., Saeed, F., Saeed, S., Ismail, M., Ehsan, M. A., et al. (2021). Projected changes in temperature and precipitation over the United States, central America, and the caribbean in CMIP6 GCMs. Earth Syst. Environ. 5 (1), 1–24. doi:10.1007/s41748-021-00199-5
Chen, F., and Dudhia, J. (2001)., 129. CAALSH>2.0.CO, 5692–6585. Coupling an advanced land surface–hydrology model with the penn state–NCAR MM5 modeling system. Part I: Model implementation and sensitivity, Mon. Weather Rev., doi:10.1175/1520-0493
Chou, M.-D., and Suarez, J. M. (1999). A solar radiation parameterization for atmospheric studies. NASA Technical Memorandum., Washington
Duan, H., Li, Y., Zhang, T., Pu, Z., Zhao, C., and Liu, Y. (2018). Evaluation of the forecast accuracy of near-surface temperature and wind in NorthwestNorthwest China based on the WRF model. J. Meteorol. Res. 32 (3), 469–490. doi:10.1007/s13351-018-7115-9
Eyring, V., Bony, S., Meehl, G. A., Senior, C. A., Stevens, B., Stouffer, R. J., et al. (2016). Overview of the coupled model Intercomparison project phase 6 (CMIP6) experimental design and organization. Geosci. Model Dev. 9, 1937–1958. doi:10.5194/gmd-9-1937-2016
Grose, M. R., Narsey, S., Delage, F. P., Dowdy, A. J., Bador, M., Boschat, G., et al. (2020). Insights from CMIP6 for Australia’s future climate. Earth's. Future 8 (5). doi:10.1029/2019EF001469
Han, X., Xue, H., Zhao, C., and Lu, D. (2016). The roles of convective and stratiform precipitation in the observed precipitation trends in Northwest China during 1961–2000. Atmos. Res. 169, 139–146. doi:10.1016/j.atmosres.2015.10.001
Hong, S.-Y., Noh, Y., and Dudhia, J. (2006). A new vertical diffusion package with an explicit treatment of entrainment processes. Mon. Weather Rev. 134 (9), 2318–2341. doi:10.1175/MWR3199.1
Hui, P., Wei, F., Xiao, Y., Yang, J., Xu, J., and Tang, J. (2022). Future projection of extreme precipitation within CORDEX East Asia phase II: Multi-model ensemble. Theor. Appl. Climatol. 150, 1271–1293. doi:10.1007/s00704-022-04223-0
Iacono, M. J. (2011). Application of improved radiation modeling to general circulation models.Atmospheric and Environmental Research, Inc., Lexington, MA US No. DOE/ER61549-1, 1010861) (p. DOE/ER61549-1, 1010861). doi:10.2172/1010861
Jiménez, P. A., Dudhia, J., González-Rouco, J. F., Navarro, J., Montávez, J. P., and García-Bustamante, E. (2012). A revised scheme for the WRF surface layer formulation. Mon. Weather Rev. 140 (3), 898–918. doi:10.1175/MWR-D-11-00056.1
Koster, R. D., Dirmeyer, P. A., Guo, Z., Bonan, G., Chan, E., Cox, P., et al. (2004). Regions of strong coupling between soil moisture and precipitation. Science 305 (5687), 1138–1140. doi:10.1126/science.1100217
Li, B., Chen, Y., Chen, Z., Xiong, H., and Lian, L. (2016). Why does precipitation in northwest China show a significant increasing trend from 1960 to 2010? Atmos. Res. 167, 275–284. doi:10.1016/j.atmosres.2015.08.017
Li, B., Chen, Y., Shi, X., Chen, Z., and Li, W. (2013). Temperature and precipitation changes in different environments in the arid region of northwest China. Theor. Appl. Climatol. 112 (3–4), 589–596. doi:10.1007/s00704-012-0753-4
Lin, Y.-L., Richard, D. F., and Harold, D. O. (1983). Bulk parameterization of the snow field in a cloud model. J. Clim. Appl. Meteor. 22, 1065–1092. doi:10.1175/1520-0450(1983)022<1065:bpotsf>2.0.co;2
Lu, B., Li, H., Wu, J., Zhang, T., Liu, J., Liu, B., et al. (2019). Impact of el niño and southern oscillation on the summer precipitation over Northwest China. Atmos. Sci. Lett. 20 (8). doi:10.1002/asl.928
Lu, S., Hu, Z., Yu, H., Fan, W., Fu, C., and Wu, D. (2021). Changes of extreme precipitation and its associated mechanisms in NorthwestNorthwest China. Adv. Atmos. Sci. 38 (10), 1665–1681. doi:10.1007/s00376-021-0409-3
Peng, D., and Zhou, T. (2017). Why was the arid and semiarid northwest China getting wetter in the recent decades? J. Geophys. Res. Atmos. 122 (17), 9060–9075. doi:10.1002/2016JD026424
Qin, J., Su, B., Tao, H., Wang, Y., Huang, J., and Jiang, T. (2021). Projection of temperature and precipitation under SSPs-RCPs Scenarios over northwest China. Front. Earth Sci. 15 (1), 23–37. doi:10.1007/s11707-020-0847-8
Shi, Y., Shen, Y., Kang, E., Li, D., Ding, Y., Zhang, G., et al. (2007). Recent and future climate change in NorthwestNorthwest China. Clim. Change 80 (3–4), 379–393. doi:10.1007/s10584-006-9121-7
Sui, Y., Jiang, D., and Tian, Z. (2013). Latest update of the climatology and changes in the seasonal distribution of precipitation over China. Theor. Appl. Climatol. 113 (3), 599–610. doi:10.1007/s00704-012-0810-z
Veiga, S. F., and Yuan, H. (2021). Performance-based projection of precipitation extremes over China based on CMIP5/6 models using integrated quadratic distance. Weather Clim. Extrem. 34, 100398. doi:10.1016/j.wace.2021.100398
Wang, C., Zhang, S., Li, K., Zhang, F., and Yang, K. (2021a). Change characteristics of precipitation in Northwest China from 1961 to 2018. Chin. J. Atmos. Sci. 45 (4), 713–724.
Wang, C., Zhang, S., Zhang, F., Li, K., and Yang, K. (2021b). On the increase of precipitation in the Northwestern China under the Global Warming. Advances in Earth Science 36 (9), 980–989.
Watters, D., Battaglia, A., and Allan, R. P. (2021). The diurnal cycle of precipitation according to multiple decades of global satellite observations, three CMIP6 models, and the ECMWF reanalysis. J. Clim., 34, 1–58. doi:10.1175/JCLI-D-20-0966.1
Wen, X., Lu, S., and Jin, J. (2012). Integrating remote sensing data with WRF for improved simulations of oasis effects on local weather processes over an arid region in northwestern China. J. Hydrometeorol. 13 (2), 573–587. doi:10.1175/JHM-D-10-05001.1
Wu, K., Yang, X., Chen, D., Gu, S., Lu, Y., Jiang, Q., et al. (2020). Estimation of biogenic VOC emissions and their corresponding impact on ozone and secondary organic aerosol formation in China. Atmos. Res. 231, 104656. doi:10.1016/j.atmosres.2019.104656
Wu, K., Zhu, S., Liu, Y., Wang, H., Yang, X., Liu, L., et al. (2021). Modeling ammonia and its uptake by secondary organic aerosol over China. Geophys. Res. Atmos. 126 (7). doi:10.1029/2020JD034109
Xu, Z., Han, Y., Tam, C. Y., Yang, Z. L., and Fu, C. (2021). Bias-corrected CMIP6 global dataset for dynamical downscaling of the historical and future climate (1979–2100). Sci. Data 8 (1), 293. doi:10.1038/s41597-021-01079-3
Xu, Z., Han, Y., and Yang, Z. (2019). Dynamical downscaling of regional climate: A review of methods and limitations. Sci. China Earth Sci. 62 (2), 365–375. doi:10.1007/s11430-018-9261-5
Xu, Z., and Yang, Z.-L. (2012). An improved dynamical downscaling method with GCM bias corrections and its validation with 30 Years of climate simulations. J. Clim. 25 (18), 6271–6286. doi:10.1175/JCLI-D-12-00005.1
Yan, D., Liu, T., Dong, W., Liao, X., Luo, S., Wu, K., et al. (2020). Integrating remote sensing data with WRF model for improved 2-m temperature and humidity simulations in China. Dyn. Atmos. Oceans 89, 101127. doi:10.1016/j.dynatmoce.2019.101127
Yang, P., Xia, J., Zhang, Y., and Hong, S. (2017). Temporal and spatial variations of precipitation in Northwest China during 1960–2013. Atmos. Res. 183, 283–295. doi:10.1016/j.atmosres.2016.09.014
Yang, X., Wu, K., Lu, Y., Wang, S., Qiao, Y., Zhang, X., et al. (2021). Origin of regional springtime ozone episodes in the sichuan basin, China: Role of synoptic forcing and regional transport. Environ. Pollut. 278, 116845. doi:10.1016/j.envpol.2021.116845
Keywords: climate change, CMIP6, future projections, dynamical downscaling, extreme precipitation
Citation: Yang X, Li D, Yang Z, Wu K, Ji L, Zhou Z and Lu Y (2023) Revealing historical observations and future projections of precipitation over Northwest China based on dynamic downscaled CMIP6 simulations. Front. Earth Sci. 10:1090221. doi: 10.3389/feart.2022.1090221
Received: 05 November 2022; Accepted: 21 November 2022;
Published: 20 January 2023.
Edited by:
Kai Yang, Lanzhou University, ChinaReviewed by:
Ben Yang, Nanjing University, ChinaCopyright © 2023 Yang, Li, Yang, Wu, Ji, Zhou and Lu. This is an open-access article distributed under the terms of the Creative Commons Attribution License (CC BY). The use, distribution or reproduction in other forums is permitted, provided the original author(s) and the copyright owner(s) are credited and that the original publication in this journal is cited, in accordance with accepted academic practice. No use, distribution or reproduction is permitted which does not comply with these terms.
*Correspondence: Yaqiong Lu, eWFxaW9uZ0BpbWRlLmFjLmNu
Disclaimer: All claims expressed in this article are solely those of the authors and do not necessarily represent those of their affiliated organizations, or those of the publisher, the editors and the reviewers. Any product that may be evaluated in this article or claim that may be made by its manufacturer is not guaranteed or endorsed by the publisher.
Research integrity at Frontiers
Learn more about the work of our research integrity team to safeguard the quality of each article we publish.