 Wei Lu
 Ziniu Xiao
 Xueshang Feng
95% of researchers rate our articles as excellent or good
Learn more about the work of our research integrity team to safeguard the quality of each article we publish.
Find out more
ORIGINAL RESEARCH article
Front. Earth Sci. , 25 January 2023
Sec. Interdisciplinary Climate Studies
Volume 10 - 2022 | https://doi.org/10.3389/feart.2022.1087737
This article is part of the Research Topic Impact of Solar Activities on Weather and Climate View all 11 articles
The effect of solar activity on the regional temperature in winter has been widely discussed. However, whether the summer temperature of land in the northern hemisphere is sensitive to solar activity remains to be further investigated. In this study, the empirical orthogonal function (EOF) analysis, spectrum analysis, and correlation analysis are employed to reveal the possible link between the summer temperature distribution over Eurasian land (0–180°E and 20°N−80°N) and solar activity. The results show that the corresponding time series of the second pattern significantly exhibits an 11-year solar periodicity. Its tripolar temperature distribution is similar to the correlation maps between the temperature and sunspot number (SSN). Particularly, Central Asia (50°E−90°E and 30°N−60°N) is the key response region over Eurasia. The temperature of Central Asia shows a weak but significant negative correlation with SSN. Further analysis of atmospheric circulation indicates that the solar-induced cyclonic and negative geopotential height anomalies in Central Asia weaken the high-pressure ridge on the southwest side and strengthen northwesterly winds. At the same time, with the increase in the cloud cover and the decrease of shortwave radiation, the temperature is lowered. Due to the impact of solar activity, the upper atmosphere over Eurasia forms a wave train-like structure, resulting in a tripolar temperature distribution pattern. On the other hand, the 21-year sliding correlation results suggest that the connection between solar activity and the temperature in Central Asia was strong and decadal stable until 1980. Whereas the temperature and atmospheric circulations in high latitudes become more sensitive to solar activity after 1980. Anyway, solar activity still can be considered a non-negligible factor in the prediction of the summer temperature in Eurasia.
As the external forcing of the earth system, solar activity has a major impact on terrestrial climate change. Solar signals have been found in the stratosphere and troposphere. The process of the down-transmission of the solar signal to the surface is usually explained by two mechanisms, i.e., ‘Top-down’ and ‘Bottom-up’ (Gray et al., 2010; Ding, 2019). Solar radiation is a direct source of energy for the climate system, which is usually used to assess the solar influence on climate in model simulations. However, the assessment of the effects of climate on the response to solar irradiance in IPCC AR6 mainly focuses on the global scale, lacking a view of regional climate change. Then, the impact of solar activity on climate change is spatially selective. (Cao, 2021; IPCC, 2021; Xiao, 2021). In addition, Connolly et al. (2021) found that the response of the solar irradiance to solar activity in the northern hemisphere depends on the estimation methods. They claim that solar activity appears to be underestimated in modern climate change prediction. Hence, the issue of the impact of solar activity on climate change should continue to be addressed.
Temperature is one of the key parameters of climate change. Numerous statistical studies have found similar periodicities in the temperature proxy records and solar variations during the Holocene, revealing the possible linkage between temperature and solar activity on centennial-to-decadal scales (Soon, 2005; Zhao and Feng, 2014; Liu et al., 2019; Huang et al., 2020; Ogurtsov et al., 2020; Brehm et al., 2021). In the 20th century, strong correlations between solar irradiance and the temperature of the mid-upper troposphere are also found based on the proxy data (Wang et al., 2010).
Kodera et al. (2016) concluded the spatial structure of global solar signal based on the surface temperature variations from observations and model data, reflecting the differences in regional responses. The surface air temperatures over Eurasia, such as Turkey and Japan, are sensitive to solar forcing (Kilcik, 2005; Kilcik et al., 2008). Kilcik et al. (2010) proved that the response of Atlantic-Eurasian regions depends on the latitudes and solar activity affects the temperature of mid-latitudes significantly in winter. Moreover, some scientists proposed that solar forcing has a significant effect on the wintertime temperature and precipitation over Asia (Kossobokov et al., 2010; Chen et al., 2015; Ojala et al., 2015; Song et al., 2019; Chen et al., 2020; Xu et al., 2020). Recently, Xu et al. (2020) revealed that extreme cold events are highly related to the energetic particle precipitation in winter over Eurasia and the interaction of wave-mean flow in the stratosphere and troposphere is an important medium in the downward process of solar signals.
In particular, the spatial distribution of solar signals in winter is pointed to be similar to the second EOF pattern of the Eurasian temperature in the early research (Miyazaki and Yasunari, 2008; Chen et al., 2015). Maliniemi et al. (2014) found that the clearest winter temperature distribution pattern is seen in the declining phase of the solar cycle and the pattern of positive North Atlantic Oscillation is produced by the declining phase. Nevertheless, the response of summer temperature over Eurasia to solar activity has not received enough attention.
Overall, we first analyze the distribution of summer temperature over Eurasian land and further do the spectrum and correlation analysis to reveal the possible linkage between solar activity and the temperature. Then we mainly analyze the mechanism of solar activity signal transmission to the surface from the perspective of atmospheric circulation. This allows us to elucidate the causes of temperature changes in regions perturbed by solar activity.
In this study, ‘summer’ is defined as the average values of June, July, and August. The SSN is usually used to characterize solar activity in previous studies. The SSN data is obtained from Sunspot Index and Long-term Solar Observation site, which is available at https://wwwbis.sidc.be/silso/datafiles. The monthly SSN data covers the period from 1749 to the present. We mainly focus on the changes in solar activity during 1901–2010 because of the limitations of meteorological data.
Two monthly temperature datasets from ERA-20C (ERA_tmp) and CRU TS 4.05 dataset (CRU_tmp) are used. The CRU TS 4.05 dataset spans a period from 1901 to 2020, with a spatial resolution of 0.5° × 0.5°. It is a gridded monthly dataset from the Climatic Research Unit (University of East Anglia) and Met Office (Harris, 2020), which is derived by interpolating monthly anomalies from station observations. ERA-20C (1901–2020) is a twentieth-century reanalysis dataset from ECMWF, available at https://apps.ecmwf.int/datasets/data/era20c-daily/levtype=sfc/type=an/. We also use 2.5° × 2.5° monthly mean atmospheric variations, including winds, geopotential height (HGT), cloud, precipitation, and radiation from the ERA-20C dataset. The boundary data of the Qinghai-Tibet Plateau comes from http://data.tpdc.ac.cn/zh-hans/data/61701a2b-31e5-41bf-b0a3-607c2a9bd3b3/(Zhang et al., 2021).
Following Thiéblemont et al. (2015) and Huo et al. (2021), we select high and low solar activity (HS and LS) years by the 3-year running mean method. Figure 1 shows the time series of JJA SSN and 3-year sliding mean JJA SSN. The HS (LS) years of each solar cycle are marked by the red (blue) dots during 1901–2020. The HS years are listed as follows: 1904, 1905, 1906, 1917, 1918, 1919, 1927, 1928, 1929, 1937, 1938, 1939, 1947, 1948, 1949, 1957, 1958, 1959, 1968, 1969, 1970, 1979, 1980, 1981, 1989, 1990, 1991, 1999, 2000, and 2001. And the LS years include 1911, 1912, 1913, 1922, 1923, 1924, 1932, 1933, 1934, 1942, 1943, 1944, 1953, 1954, 1955, 1963, 1964, 1965, 1975, 1976, 1977, 1985, 1986, 1987, 1995, 1996, 1997, 2007, 2008, and 2009. We will investigate the responses of terrestrial temperature to solar activity by composite analysis in the following part.
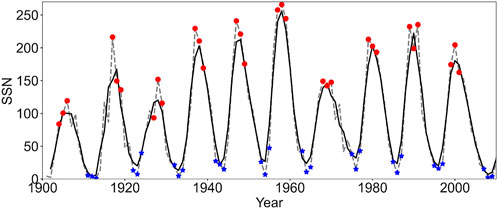
FIGURE 1. Time series of SSN. The dashed gray and solid black curves are the series of JJA SSN and 3-year running mean values of JJA SSN. The red (blue) dots mark the HS (LS) years.
The EOF method is also called principal component analysis (PCA). This approach captures the dominant spatial distribution and its time-varying characteristics by deriving the orthogonal empirical eigenvectors of the covariance matrix associated with climate variables (Ionita et al., 2012; Zhang and Moore, 2015). Multi-previous studies utilized this way to extract temperature patterns and analyze the causes of temperature changes (Hong et al., 2017; Ning et al., 2022; Song et al., 2022). This study takes advantage of the orthogonal characteristic between the patterns to better grasp the solar signal in the summer temperature over Eurasian. Then, correlation and composite differences analysis are combined to further explore the process of the impact of solar activity. In the last part, we conduct the sliding correlation analysis to assess the stability of the relationship between solar activity and the Eurasian summer temperature.
In this study, we first extract the first two dominant patterns and the corresponding principal component time series of summer temperature over Eurasian land (0–180° E and 20°N −80° N) through the EOF analysis method (Figure 2). The first leading mode shows positive temperature anomalies over the whole land, explaining 12.68%/14.66% of the total variance (Figures 2A,B). Previous studies pointed out the westerly jet is the main factor for the summer warming of the latitude of 40°N −65°N after 1960 (Wu and Sun, 2015). In addition, the corresponding PC1 time series have no apparent decadal periodicity (Figures 3A,C) and it shows a very weak relationship with SSN with the correlation coefficients r = −0.02/0.01. Hence, no more attention is paid to the first leading modes in this study.
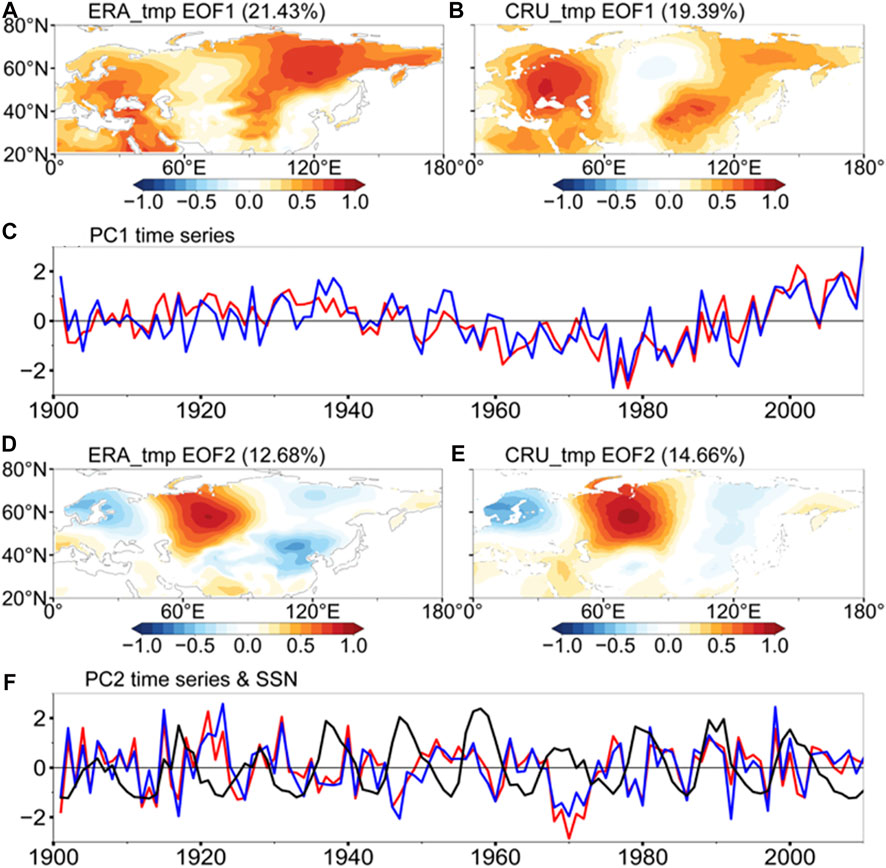
FIGURE 2. Spatial patterns and the corresponding normalized time series for the leading first (A–C) and second (D–F) EOF modes of summer land Eurasian temperature (unit: °C) anomalies over 0–180°E and 20°N −80°N during 1901–2010. The red (blue) solid lines are the corresponding time series of ERA_tmp (CRU_tmp). The black solid line is the standardized SSN.
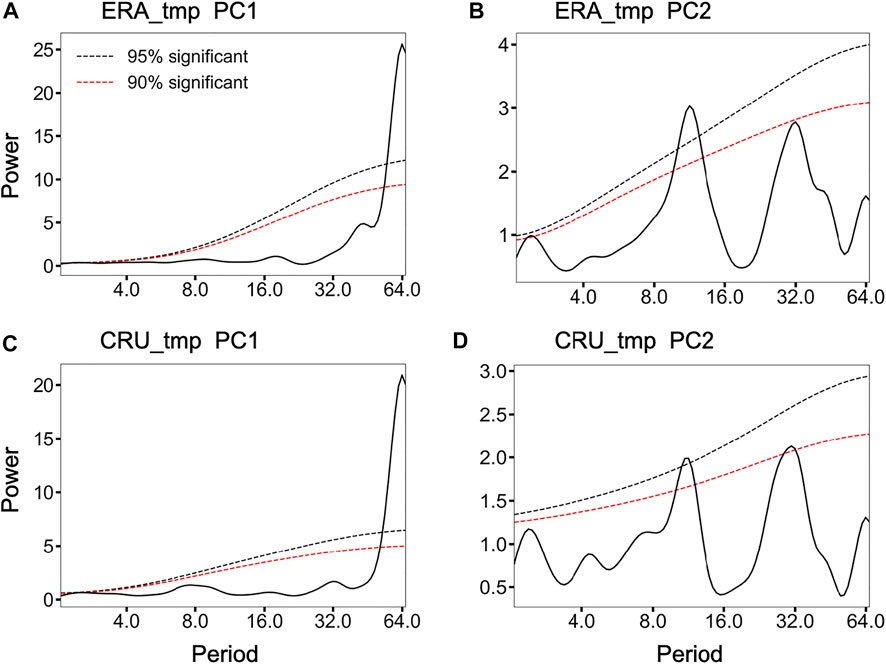
FIGURE 3. Power spectrums of the time series of the leading modes. The red (black) dashed lines indicate statistical confidence levels are 90% (95%). (A) ERA_tmp PC1. (B) ERA_tmp PC2. (C) CRU_tmp PC1. (D) CRU_tmp PC2.
The second EOF mode, accounting for 21.43%/19.39% of the variance, is characterized by ‘-+-’ tripolar patterns in high latitudes, corresponding with the found by Wu and Sun (2015). They have anomalies of one positive sign centered in the region over Central Asia-Southwest of Russia and the other two negative signs over the two sides of Eurasian land, respectively (Figures 2D,E). But the 11-year solar periodicity signal is significantly present in the PC2 time series, which is above the 95% confidence level (Figures 3B,D).
To reveal the correlation between solar activity and temperature distribution, we calculate the correlation coefficients between PC2 and SSN. SSN is negatively correlated with the corresponding PC2 times series during 1901–2010 (r = −0.12/−0.16, p<0.1), and the correlations are much weaker with PC3 (r = −0.07/0.06). The correlations are stronger than that between SSN and other climate indices listed in Table 1, such as the East Asian summer monsoon index (EASMi), North Atlantic oscillation (NAO), Pacific Decadal Oscillation (PDO), Southern Oscillation Index (SOI) and the Niño3.4 index. Namely, the second spatial distribution of summer temperature is possibly modulated by the solar cycle. Overall, we focus on the response of the Eurasian summer temperature to solar activity.
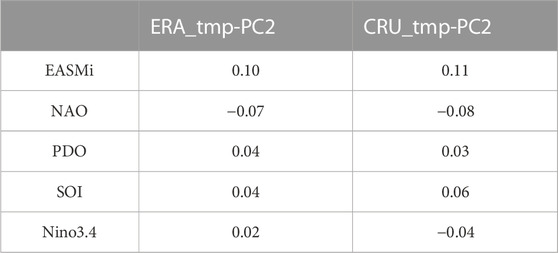
TABLE 1. Correlation coefficients between PC2 and the other climate indices.
On the other hand, Figures 4A,B depict the correlation maps between detrended summer temperature and SSN during 1901–2010, revealing the significant response regions to solar activity. The impact of solar activity on Eurasian land varies regionally in summer. But in winter, strong solar activity tends to warm the temperature of most Eurasian land (Chen et al., 2015). In the middle and high latitudes of Central Asia (30°N −60°N, 50°E −90°E), the temperature is negatively correlated to the solar activity, which is opposite to that in the two sides of Eurasian land. It is also worth noting that the spatial patterns of correlation maps are alike to the second EOF modes of summer temperature over Eurasian land (Figures 2C,D).
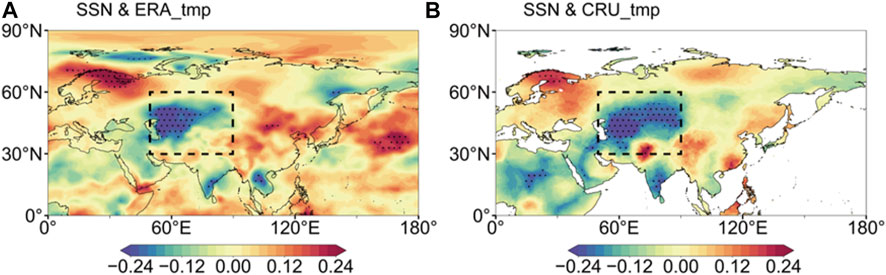
FIGURE 4. Correlation maps between detrended summer temperature and SSN over Eurasia during 1901–2010. Black dotted regions are above 95% confidence level. Central Asia (30°N–60°N and 50°E–90°E) is marked by the black dashed frame. (A) SSN and ERA_tmp. (B) SSN and CRU_tmp.
On the other hand, Figures 4A,B depict the correlation maps between detrended summer temperature and SSN during 1901–2010, revealing the significant response regions to solar activity. The impact of solar activity on Eurasian land varies regionally in summer. But in winter, strong solar activity tends to warm the temperature of most Eurasian land (Chen et al., 2015). In the middle and high latitudes of Central Asia (30°N–60°N, 50°E–90°E), the temperature is negatively correlated to the solar activity, which is opposite to that in the two sides of Eurasian land. It is also worth noting that the spatial patterns of correlation maps are alike to the second EOF modes of summer temperature over Eurasian land (Figures 2C,D).
According to the temperature distribution pattern and the correlation maps with the solar activity, the area of Central Asia has attached attention. Huang et al. (2020) also found that the summer temperature of acid central Asia also has a common cycle with solar activity during the Holocene. We show the temperature time series of Central Asia in Figure 5. The regional temperature is positively correlated to the corresponding PC2 and the correlation coefficient between SSN and PC2 of ERA_tmp (CRU_tmp) is 0.63 (0.76), which is significantly above the 99% confidence level. Besides, the correlation coefficients between SSN and the temperature of Central Asia are −0.19/−0.24, which is significantly above the 95% confidence level. In addition, the temperature of Central Asia has an 11-year solar cycle. Hence, Central Asia is the key response area to solar activity. In the following, we mainly discuss the impact of solar activity on the summer temperature of Central Asia.
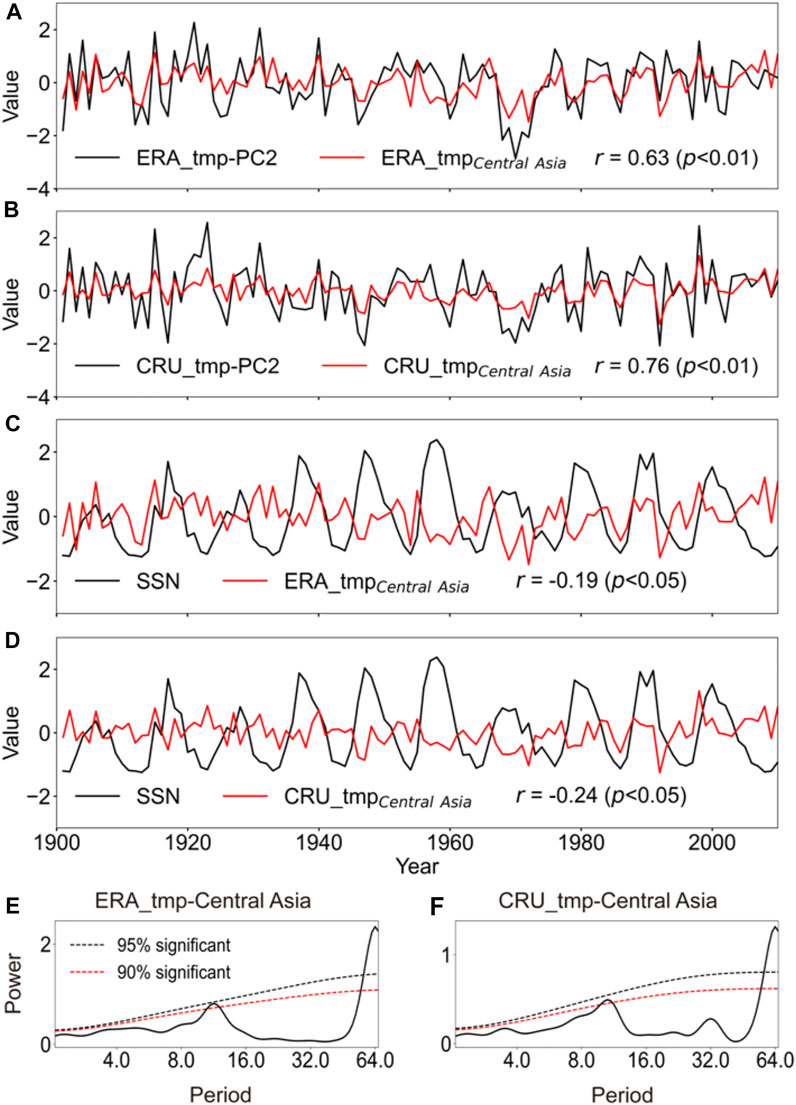
FIGURE 5. Comparison of the temperature of Central Asia (30 °N–60°N and 50°E–90°E) and PC2 (A,B) and SSN (C,D), (E,F) Power spectrum of the summer temperature for Central Asia. The red and black dashed lines indicate statistical confidence at the 90% and 95% confidence levels.
The evidence in Section 3.1 reveals the relationship between solar activity and summer temperature over Eurasia, especially in Central Asia. How does the Sun signal transmit downward? To further explore the physical process of the impact of solar activity, we pay attention to the response of the atmospheric circulation and cloud-radiation feedback mechanism based on the analysis of the composite differences and regression.
Figures 6A–C show composite differences between HS and LS years of geopotential height and wind at 200 hPa, 500 hPa, and 850 hPa over Central Asia. Solar activity induces positive geopotential height anomalies at 500 hPa and cyclonic anomalies at 850 hPa in most of the Eurasian land regions except Central Asia. The circulation anomalies’ patterns resemble each other at 200 hPa, 500 hPa, and 850 hPa, reflecting a barotropic structure. The magnitudes of the circulation anomalies become weaker with the height from top to bottom. Meanwhile, the mean background climatology states during 1901–2010 are illustrated in Figures 6D–F for comparison. In the southwest of Central Asia, high pressure at 500 hPa centered at 30°N and 60°E exists. And northwesterly winds prevail at 850 hPa in summer due to the pressure gradient over Central Asia. Combining the disturbance of the atmospheric circulation field by solar activity and the climatic background field, the negative geopotential height anomalies over Central Asia, opposite to the other regions in Eurasian land, weaken the high-pressure ridge in the southwest of Central Asia. Besides, the cyclonic anomalies strengthen the northwesterly wind, causing more transport of cold advection to Central Asia.
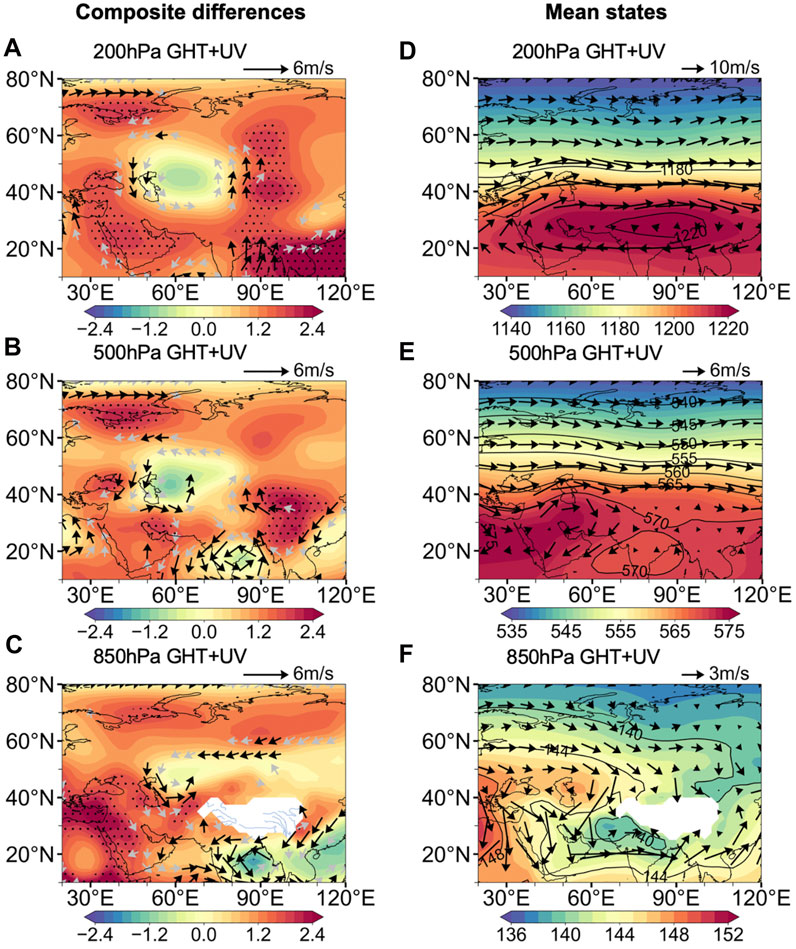
FIGURE 6. (A–C) Composite differences (HS minus LS) of wind and geopotential height (GHT, color) at 850 hPa, 500 hPa, and 200 hPa during 1901–2010. Black dots marks regions where GHT differences are above 90% confidence level. The black vectors show the wind differences are over 90% confidence level (D–F) Background climatology states GHT and winds at 850 hPa, 500 hPa, and 850 hPa in summer over Eurasia during 1901–2010. The wind and geopotential data at 850 hPa on the Qinghai-Tibet Plateau are ignored.
Figure 7 presents the correlation maps between geopotential height and wind at 200 hPa, 500 hPa, and 850 hPa and SSN during 1901–2010, indicating the contribution of solar activity to circulation. A wave train-like structure of geopotential anomalies with one negative and two positive anomalies at 500 hPa shows up in the mid-high latitude, which is similar to the second pattern of the summer temperature distribution in Figure 2. The wave train-like structure is weaker in the bottom of the troposphere than that in the upper troposphere. At 850 hPa, a pair of cyclonic and anticyclonic anomalies appear in the northwest of the Eurasian land, which may affect advective transport. The results of regression analysis show no essential differences with the analysis of the composite differences, except for the size of several significant areas. Solar activity will perturb the climate background field, thereby weakening the climate system and strengthening convection.
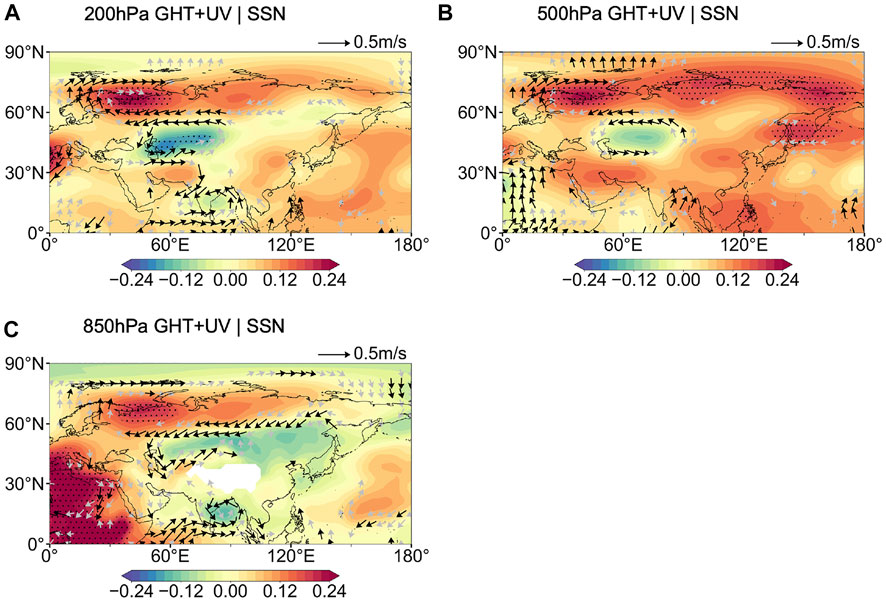
FIGURE 7. Correlation maps between (A) 200 hPa, (B) 500 hPa, and (C) 850 hPa geopotential height (GHT, color) and wind (vector) and SSN. Black dots marks regions where GHT differences are above 90% confidence level. The black vectors show the wind differences are over 90% confidence level. The wind and geopotential data at 850 hPa on the Qinghai-Tibet Plateau are ignored.
Figure 8 illustrates the composite differences in the cloud, radiation, and precipitation between HS and LS years during 1901–2010. The composite differences patterns of total cloud cover are characterized by positive anomalies centered over Central Asia and negative anomalies in other areas of Eurasian land (Figure 8A). It is consistent with the correlation patterns between temperature and SSN in Figure 3. The pattern for surface net solar radiation is opposite to that for the total cloud cover (Figure 8B).
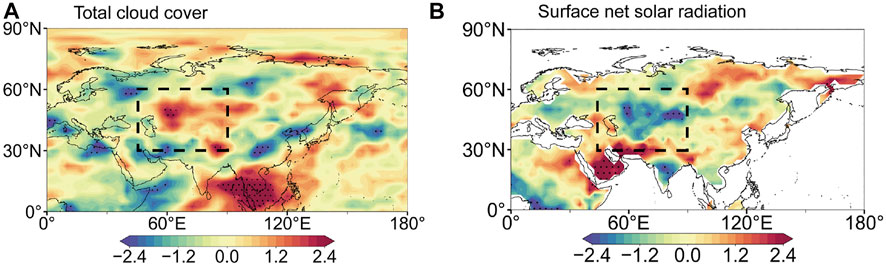
FIGURE 8. Composite differences (HS minus LS) of total cloud cover (A) surface net solar radiation (B) (units: J·m−2) during 1901–2010. during 1901–2010. Central Asia (30 °N–60°N and 50°E–90°E) is marked by the black dashed frame.
Previous studies found that the temperature is sensitive to cloud-radiative feedback (Tang et al., 2012; Tang and Leng, 2012). Increased total cloud cover over Central Asia inhibits the downward transmission of solar energy, resulting in lower temperatures. The negative anomalies of the surface net solar radiation result from the increase in the total cloud cover. The synergy amplifies the effect of solar activity on the temperature.
Figure 9 depicts the atmospheric circulations and surface air temperature anomalies regressed onto the second dominant time series PC2. The GHT and wind anomalies at 200 hPa show a tripolar pattern characterized by ‘-+-’ anomalies in mid-high latitude (Figure 9A). The significant positive anomalies centered over northern Europe, which is in contrast to other negative responses over the other regions in Eurasian. Furthermore, the similar and weaker patterns at 500 hPa and 850 hPa reflect an equivalent structure. The wave-train-like temperature anomalous pattern associated with PC2 resembles the correlation maps between solar activity and atmospheric circulation (Figure 7).
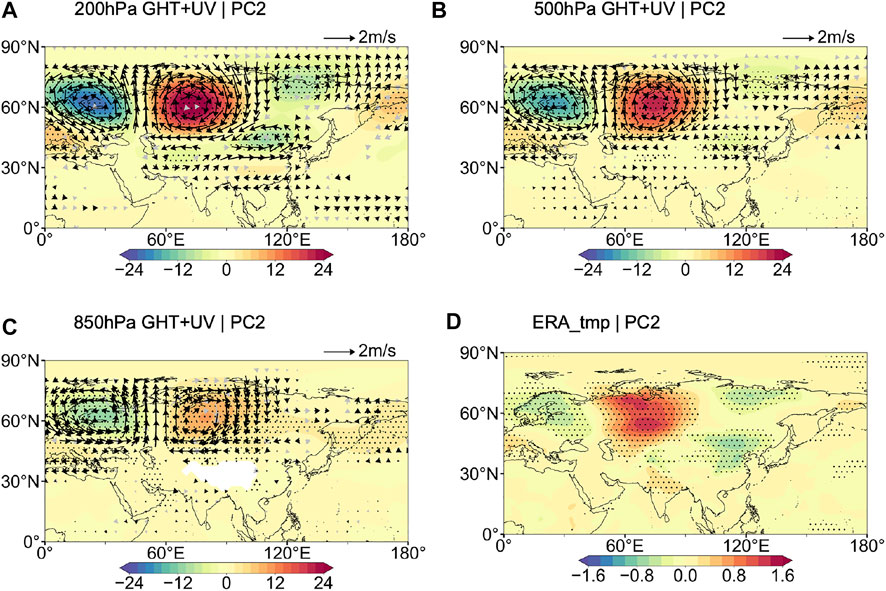
FIGURE 9. Regression maps of (A) 200 hPa, (B) 500 hPa, and (C) 850 hPa geopotential height (GHT, color) and wind (vector), and (D) ERA_tmp onto PC2. Black dots marks regions where GHT differences are above 90% confidence level. The black vectors show the wind differences are over 90% confidence level. The wind and geopotential data at 850 hPa on the Qinghai-Tibet Plateau are ignored.
In the sections above, it is revealed the response of the Eurasian summer temperature to solar activity during 1901–2010. We note that the decadal changes in the relationship between the summer temperature of the mid-upper troposphere over Eurasia have been found through proxy data and the empirical mode decomposition method (Wang et al., 2010). Based on the 449-year reconstructed temperature, Duan and Zhang (2014) found disparities between temperature in Tibet Plateau and solar activity are identified in two periods, the 1880s–1900s and the 1980s–present. It should be noted that a similar reversal of signs of solar-climatic correlation at the beginning of the 80s was also reported by Georgieva et al. (2007) and Veretenenko and Ogurtsov (2012). However, Ogurtsov and Veretenenko (2017) found responses of low atmosphere to solar activity in winter Russia changed in the 2000s approximately. Chiodo et al. (2019) suggested that the solar signal only occurs in NAO after the mid-1960s, which is not robust. The research above reveals that the decadal impacts of solar activity on regional climate are different and the persistence of the impact and the stability of the signal deserves attention.
In this study, we find the size of atmospheric response areas differs between the composite and correlation analysis results (Figure 6 and Figure 7). The correlation analysis is based on the whole data, while the composite analysis is only for the years of extreme solar activity. Therefore, we further assess the decadal stability of the relationship between the Eurasian summer temperature and solar activity to expound the reasons for the differences.
Figure 10 shows the 21-year sliding correlations between SSN and PC2 and the temperature of Central Asia. The PC2 was negatively related to SSN before 1980, but the relationship became weak and positive after 1980. The relationship between the temperature of Central Asia and solar activity keeps pace with PC2. We note that the negative correlation period is about central-decadal years (Figure 10). Scafetta (2014) thought there might be another oscillation, such as a 9.1-year oscillation, beating with the 11-year solar cycle and producing a long-beat pattern. To clarify the decadal change of the impact of solar activity on the temperature and ensure consistent degrees of freedom, we chose two periods of the same length, i.e., 1951–1980 (P1) and 1981–2010 (P2) in the following part (Table 2). The correlation coefficients between PC2 and SSN during P1 are −0.31/−0.37 with above 90% significant confidence, but they are 0.23/0.29 during P2 with no statistical significance.
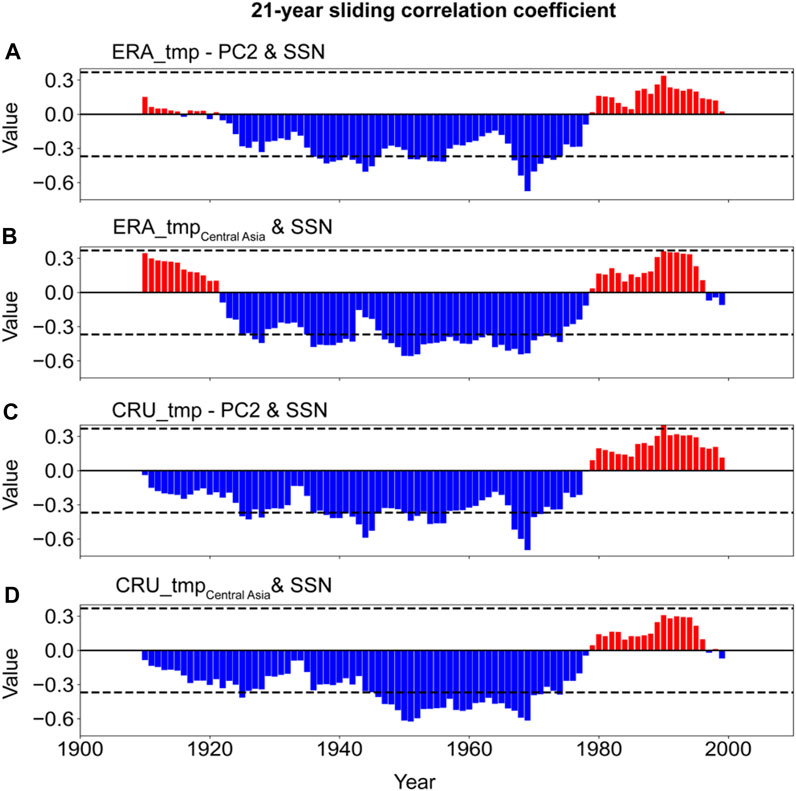
FIGURE 10. The 21-year sliding correlation coefficient between SSN and the time series of PC2 (A–C) and the temperature of Central Asia (B–D) during 1901–2010. The values of dashed lines are ± 0.369, which represents the 90% confidence level.
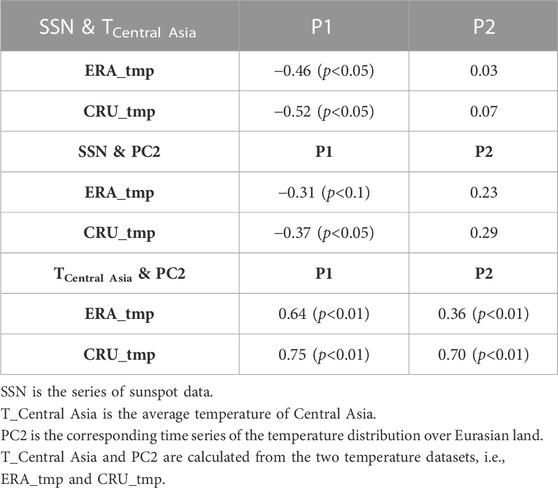
TABLE 2. The correlation coefficients between the three variabilities (SSN, T_Central Asia, and PC2) during the two periods of P1 (1951–1980) and P2 (1981–2010).
We also find remarkable differences are seen in the correlation maps between SSN and temperature during P1 and P2 (Figure 11). For the latitude of 30°N–60°N, strong negative connections persist during the 1951–1980 period. In contrast, the temperature is significantly positive relative to SSN in high latitudes during the 1981–2010 period. During P1, Central Asia is the significant negative response region of temperature to solar activity (r = −0.46, p<0.05/−0.52, p<0.05). However, the temperature of Central Asia becomes insensitive to solar activity after 1980 (r = 0.03/0.07). And the mid-high latitude regions, such as North Europe and East Russia, are more sensitive to solar activity. Additionally, the correlation between the temperature of Central Asia and the corresponding PC2 is weaker during P2 (r = 0.64, p<0.01/0.75, p<0.01) than that during P1 (r = 0.36, p<0.01/0.70, p<0.01). These similar changes in 1980 reveal that the link between solar activity and the second temperature distribution may be affected by the response of the temperature in Central Asia.
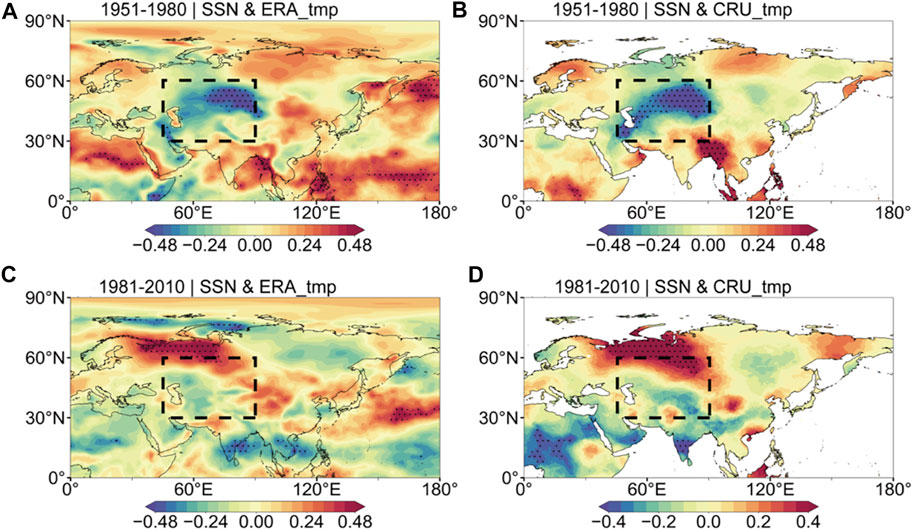
FIGURE 11. Correlation maps between SSN and temperature during 1951–1980 (P1) and 1981–2010 (P2). Dotted regions are at above 95% confidence level. Central Asia (30 °N–60°N and 50°E–90°E) is marked by the black dashed frame. (A) 1951–1980 SSN and ERA_tmp. (B) 1951–1980 SSN and CRU_tmp. (C) 1981–2010 SSN and ERA_tmp. (D) 1981–2010 SSN and CRU_tmp.
The solar effect on the surface temperature depends on the atmospheric circulation condition. We compare the atmospheric background conditions between P1 and P2 below by the composite differences in geopotential height and wind to explore the reason for the decadal change in the relationship (Figure 12). The mid-high latitude differences match the change in the solar activity response areas, such as central Asia, North Europe, and East Russia. Positive potential height and cyclonic anomalies in P2, compared with that in P1, may make the solar disturbance signal insignificant. The change in the background may be caused by global warming or internal variability of the climate system. The reasons for the different responses of regional climate to solar activity and its interdecadal variation deserve further study.
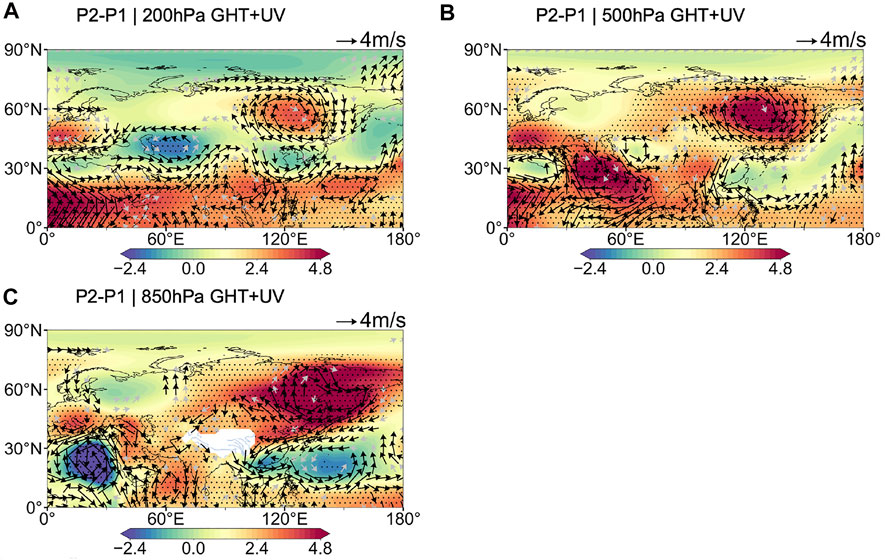
FIGURE 12. Composite differences (P2 minus P1) of atmospheric circulation between 1951 and 1980 (P1) and 1981–2010 (P2). Black dots marks regions where geopotential height (GHT) differences are above the 90% confidence level. The black vectors show the wind differences are over 90% confidence level. The wind and GHT data at 850 hPa on the Qinghai-Tibet Plateau are ignored. (A) P2-P1 | 200 hPa GHT+UV. (B) P2-P1 | 500 hPa GHT+UV. (C) P2-P1 | 850 hPa GHT+UV.
In this study, we analyze the distribution of the summer temperature over Eurasian land for the past 110 years based on the EOF methods and reveal its response to solar activity. The time series corresponding to the second EOF mode has an 11-year significant power spectrum periodicity. In addition, the correlation pattern between SSN and temperature is similar to the temperature distribution pattern. Central Asia is considered to be the key region where solar activity affects the temperature distribution in Eurasia.
The physical mechanism can be explained from the perspective of atmospheric circulation. The schematic figure is shown in FIG.13. The left and the right panels compare the atmosphere response to the LS and HS and the climatic states are shown in the middle panel. The second EOF pattern of the summer temperature is alike to a wave train-like structure, with one positive and two negative anomalies across the mid-high latitudes, and causes a barotropic response of the atmospheric circulation. The two side panels of Figure 13 show the atmospheric circulation anomalies associated with HS and LS resemble the wave train-like pattern. In the key area, Central Asia, the temperature is highly related to the second temperature distribution and negatively related to solar activity. The other regions are weakly positive for solar activity. Over Central Asia, the negative potential height anomalies at 500 h Pa associated with solar activity weakened the high-pressure ridge on the southwest side. The cyclonic anomalies related to solar activity strengthen the southwesterly wind. Besides, more clouds and less radiation make the terrestrial receive less solar energy (Figure 13). Under the combined action of atmospheric circulation and cloud and radiation feedback, temperature decreases with increasing solar activity.
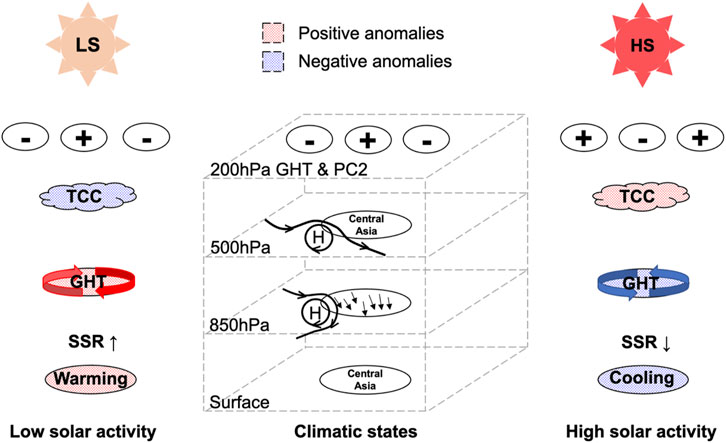
FIGURE 13. A schematic figure of the impact of solar activity on the summer temperature over Eurasia. ‘TCC’, ‘SSR’, and ‘H’ represent the total cloud cover, surface net solar radiation, and the high-pressure center, respectively. The black arrows in the middle panel show the north-westerly wind. Positive (Negative) anomalies are marked by red (blue) dots. The blue (red) widened vectors show the cyclonic (anti-cyclonic) anomalies.
The connection between temperature distribution and solar activity was strong and decadal stable until 1980. The key response areas change from Central Asia in the middle latitudes to Northern Europe in the mid-high latitudes after 1980 due to the change in atmospheric conditions. As the mechanism mentioned above, the arrival of solar activity signals on the ground depends on the transport of atmospheric circulation and the reflection of the cloud-radiation process. The impact of solar activity on the temperature over Central Asia and even the whole of Eurasia would be convinced to be established again in the future if the atmospheric change stemmed from climate internal variability. Solar activity still can be considered a non-negligible factor in the prediction of the summer temperature in Eurasia.
The original contributions presented in the study are included in the article/supplementary material, further inquiries can be directed to the corresponding author.
The authors confirm their contribution to the paper as follows: study conception and design: ZX; data collection and analysis: WL; draft manuscript preparation: WL and XF. All authors reviewed the results and approved the final version of the manuscript.
This work was supported by the Natural Science Foundation of China (U1902209, 42030204) and the Specialized Research Fund for State Key Laboratories.
We thank Liang Zhao for sharing his suggestions on this research. We are grateful for the thoughtful comments and recommendations from two reviewers.
The authors declare that the research was conducted in the absence of any commercial or financial relationships that could be construed as a potential conflict of interest.
All claims expressed in this article are solely those of the authors and do not necessarily represent those of their affiliated organizations, or those of the publisher, the editors and the reviewers. Any product that may be evaluated in this article, or claim that may be made by its manufacturer, is not guaranteed or endorsed by the publisher.
Brehm, N., Bayliss, A., Christl, M., Synal, H.-A., Adolphi, F., Beer, J., et al. (2021). Eleven-year solar cycles over the last millennium revealed by radiocarbon in tree rings. Nat. Geosci. 14 (1), 10–15. doi:10.1038/s41561-020-00674-0
Cao, L. (2021). Climate system response to solar radiation modification. Clim. Change Res. 17 (6), 671–684. doi:10.12006/j.issn.1673-1719.2021.170
Chen, H., Ma, H., Li, X., and Sun, S. (2015). Solar influences on spatial patterns of Eurasian winter temperature and atmospheric general circulation anomalies. J. Geophys. Res. Atmos. 120 (17), 8642–8657. doi:10.1002/2015jd023415
Chen, S., Wu, R., Chen, W., Yao, S., and Yu, B. (2020). Coherent interannual variations of springtime surface temperature and temperature extremes between central-northern Europe and northeast Asia. J. Geophys. Res. Atmos. 125 (11). doi:10.1029/2019jd032226
Chiodo, G., Oehrlein, J., Polvani, L. M., Fyfe, J. C., and Smith, A. K. (2019). Insignificant influence of the 11-year solar cycle on the north Atlantic oscillation. Nat. Geosci. 12 (2), 94–99. doi:10.1038/s41561-018-0293-3
Connolly, R., Soon, W., Connolly, M., Baliunas, S., Berglund, J., Butler, C. J., et al. (2021). How much has the sun influenced northern hemisphere temperature trends? An ongoing debate. Res. Astron. Astrophys. 21 (6), 131. doi:10.1088/1674-4527/21/6/131
Ding, Y. (2019). Effect of solar activity on Earth's climate and weather. Meteorol. Mon. (in Chin. 45 (03), 297–304. doi:10.7519/j.issn.1000-0526.2019.03.001
Duan, J., and Zhang, Q.-B. (2014). A 449 year warm season temperature reconstruction in the southeastern Tibetan Plateau and its relation to solar activity. J. Geophys. Res. Atmos. 119 (2011), 11,578–11,592. doi:10.1002/2014jd022422
Georgieva, K., Kirov, B., Tonev, P., Guineva, V., and Atanasov, D. (2007). Long-term variations in the correlation between NAO and solar activity: The importance of north–south solar activity asymmetry for atmospheric circulation. Adv. Space Res. 40 (7), 1152–1166. doi:10.1016/j.asr.2007.02.091
Gray, L. J., Beer, J., Geller, M., Haigh, J. D., Lockwood, M., Matthes, K., et al. (2010). Solar influences on climate. Rev. Geophys. 48 (4), RG4001. doi:10.1029/2009rg000282
Hong, X., Lu, R., and Li, S. (2017). Amplified summer warming in europe–west Asia and northeast Asia after the mid-1990s. Environ. Res. Lett. 12 (9), 094007. doi:10.1088/1748-9326/aa7909
Huang, C., Rao, Z., Li, Y., Yang, W., Liu, L., Zhang, X., et al. (2020). Holocene summer temperature in arid central Asia linked to millennial-scale North Atlantic climate events and driven by centennial-scale solar activity. Palaeogeogr. Palaeoclimatol. Palaeoecol. 556, 109880. doi:10.1016/j.palaeo.2020.109880
Huo, W., Xiao, Z., Wang, X., and Zhao, L. (2021). Lagged responses of the tropical pacific to the 11-yr solar cycle forcing and possible mechanisms. J. Meteorol. Res. 35 (3), 444–459. doi:10.1007/s13351-021-0137-8
Ionita, M., Lohmann, G., Rimbu, N., and Scholz, P. (2012). Dominant modes of Diurnal Temperature Range variability over Europe and their relationships with large-scale atmospheric circulation and sea surface temperature anomaly patterns. J. Geophys. Res. 117 (D15), n/a. doi:10.1029/2011jd016669
Kilcik, A., Ozguc, A., and Rozelot, J. P. (2010). Latitude dependency of solar flare index-temperature relation occuring over middle and high latitudes of Atlantic-Eurasian region. J. Atmos. SOLAR-TERRESTRIAL Phys. 72 (18), 1379–1386. doi:10.1016/j.jastp.2010.10.002
Kilcik, A., Özgüç, A., Rozelot, J. P., and Yeşilyurt, S. (2008). Possible traces of solar activity effect on the surface air temperature of Turkey. J. Atmos. Solar-Terrestrial Phys. 70 (13), 1669–1677. doi:10.1016/j.jastp.2008.07.002
Kilcik, A. (2005). Regional sun–climate interaction. J. Atmos. Solar-Terrestrial Phys. 67 (16), 1573–1579. doi:10.1016/j.jastp.2005.09.003
Kodera, K., Thiéblemont, R., Yukimoto, S., and Matthes, K. (2016). How can we understand the global distribution of the solar cycle signal on the Earth's surface? Atmos. Chem. Phys. 16 (20), 12925–12944. doi:10.5194/acp-16-12925-2016
Kossobokov, V., Le Mouël, J.-L., and Courtillot, V. (2010). A statistically significant signature of multi-decadal solar activity changes in atmospheric temperatures at three European stations. J. Atmos. Solar-Terrestrial Phys. 72 (7-8), 595–606. doi:10.1016/j.jastp.2010.02.016
Liu, X., Rao, Z., Shen, C. C., Liu, J., Chen, J., Chen, S., et al. (2019). Holocene solar activity imprint on centennial- to multidecadal-scale hydroclimatic oscillations in arid central Asia. J. Geophys. Res. Atmos. 124 (5), 2562–2573. doi:10.1029/2018jd029699
Maliniemi, V., Asikainen, T., and Mursula, K. (2014). Spatial distribution of Northern Hemisphere winter temperatures during different phases of the solar cycle. J. Geophys. Res. Atmos. 119 (16), 9752–9764. doi:10.1002/2013jd021343
Miyazaki, C., and Yasunari, T. (2008). Dominant interannual and decadal variability of winter surface air temperature over Asia and the surrounding oceans. J. Clim. 21 (6), 1371–1386. doi:10.1175/2007jcli1845.1
Ning, G., Luo, M., Wang, S., Liu, Z., Wang, P., and Yang, Y. (2022). Dominant modes of summer wet bulb temperature in China. Clim. Dyn. 59 (5-6), 1473–1488. doi:10.1007/s00382-021-06051-w
Ogurtsov, M. G., and Veretenenko, S. V. (2017). Possible contribution of variations in the galactic cosmic ray flux to the global temperature rise in recent decades. Geomagn. Aeron. 57 (7), 886–890. doi:10.1134/s0016793217070143
Ogurtsov, M., Veretenenko, S. V., Helama, S., Jalkanen, R., and Lindholm, M. (2020). Assessing the signals of the Hale solar cycle in temperature proxy records from Northern Fennoscandia. Adv. Space Res. 66 (9), 2113–2121. doi:10.1016/j.asr.2020.07.038
Ojala, A. E. K., Launonen, I., Holmström, L., and Tiljander, M. (2015). Effects of solar forcing and North Atlantic oscillation on the climate of continental Scandinavia during the Holocene. Quat. Sci. Rev. 112, 153–171. doi:10.1016/j.quascirev.2015.01.021
Scafetta, N. (2014). Discussion on the spectral coherence between planetary, solar and climate oscillations: A reply to some critiques. Astrophys. Space Sci. 354 (2), 275–299. doi:10.1007/s10509-014-2111-8
Song, Y., Chen, H., and Yang, J. (2022). The dominant modes of spring land surface temperature over western Eurasia and their possible linkages with large-scale atmospheric teleconnection patterns. JGR. Atmos. 127 (4). doi:10.1029/2021jd035720
Song, Y., Li, Z., Gu, Y., Liou, K.-N., Zhang, X., and Xiao, Z. (2019). The effect of solar cycle on climate of northeast Asia. J. Meteorol. Res. 33 (5), 885–894. doi:10.1007/s13351-019-8132-z
Soon, W. W. H. (2005). Variable solar irradiance as a plausible agent for multidecadal variations in the Arctic-wide surface air temperature record of the past 130 years. Geophys. Res. Lett. 32 (16), L16712. doi:10.1029/2005gl023429
Tang, Q., and Leng, G. (2012). Damped summer warming accompanied with cloud cover increase over Eurasia from 1982 to 2009. Environ. Res. Lett. 7 (1), 014004. doi:10.1088/1748-9326/7/1/014004
Tang, Q., Leng, G., and Groisman, P. Y. (2012). European hot summers associated with a reduction of cloudiness. J. Clim. 25 (10), 3637–3644. doi:10.1175/jcli-d-12-00040.1
Thiéblemont, R., Matthes, K., Omrani, N.-E., Kodera, K., and Hansen, F. (2015). Solar forcing synchronizes decadal North Atlantic climate variability. Nat. Commun. 6 (1), 8268. doi:10.1038/ncomms9268
Veretenenko, S., and Ogurtsov, M. (2012). Regional and temporal variability of solar activity and galactic cosmic ray effects on the lower atmosphere circulation. Adv. Space Res. 49 (4), 770–783. doi:10.1016/j.asr.2011.11.020
Wang, Y., Miao, Q.-L., E, C.-Y., Han, J.-K., and Ding, Y.-Y. (2010). Relation between temperature changes of the mid-upper troposphere over Eurasian mid-high latitudes and solar irradiance in the twentieth century. Environ. Earth Sci. 60 (6), 1257–1266. doi:10.1007/s12665-009-0266-3
Wu, X., and Sun, Z. (2015). Climatic features of summer land surface temperature in Eurasian continent and its relationship with atmospheric circulation. Trans. Atmos. Sci. (in Chin. 38 (02), 195–204.
Xiao, Z., Liu, J., Liu, S. H., Petridis, L., Cai, C., Cao, L., et al. (2021). Novel small molecule fibroblast growth factor 23 inhibitors increase serum phosphate and improve skeletal abnormalities in hyp mice. Mol. Pharmacol. 43 (06), 408–421. doi:10.1124/molpharm.121.000471
Xu, X., He, S., and Wang, H. (2020). Relationship between solar wind—magnetosphere energy and eurasian winter cold events. Adv. Atmos. Sci. 37 (6), 652–661. doi:10.1007/s00376-020-9153-3
Zhang, Y., Liu, L., Li, B., and Zheng, D. (2021). Comparison of Qinghai-Tibet Plateau extent dataset 2021 edition with 2014 edition. J. Glob. Change Data & Discov. 5 (3).
Zhang, Z., and Moore, J. C. (2015). “Chapter 6 - empirical orthogonal functions,” in Mathematical and physical fundamentals of climate change. Editors Z. Zhang, and J. C. Moore (Boston: Elsevier), 161–197.
Keywords: solar cycle, temperature distribution, Eurasian climate, decadal change, summer
Citation: Lu W, Xiao Z and Feng X (2023) The possible impact of solar activity on the summer temperature distribution over Eurasia. Front. Earth Sci. 10:1087737. doi: 10.3389/feart.2022.1087737
Received: 02 November 2022; Accepted: 02 December 2022;
Published: 25 January 2023.
Edited by:
Folco Giomi, Independent Researcher, Padova, ItalyReviewed by:
Maxim Ogurtsov, Ioffe Institute (RAS), RussiaCopyright © 2023 Lu, Xiao and Feng. This is an open-access article distributed under the terms of the Creative Commons Attribution License (CC BY). The use, distribution or reproduction in other forums is permitted, provided the original author(s) and the copyright owner(s) are credited and that the original publication in this journal is cited, in accordance with accepted academic practice. No use, distribution or reproduction is permitted which does not comply with these terms.
*Correspondence: Ziniu Xiao, eGlhb3puQGxhc2cuaWFwLmFjLmNu
Disclaimer: All claims expressed in this article are solely those of the authors and do not necessarily represent those of their affiliated organizations, or those of the publisher, the editors and the reviewers. Any product that may be evaluated in this article or claim that may be made by its manufacturer is not guaranteed or endorsed by the publisher.
Research integrity at Frontiers
Learn more about the work of our research integrity team to safeguard the quality of each article we publish.