 Thanop Thitimakorn
 Rungroj Arjwech2
- 1Department of Geology, Faculty of Science, Chulalongkorn University, Bangkok, Thailand
- 2Department of Geotechnology, Faculty of Technology, Khon Kaen University, Khon Kaen, Thailand
- 3Department of Food Technology, Faculty of Science, Chulalongkorn University, Bangkok, Thailand
Shear-wave velocity (Vs) of soils in Nakhon Nayok City, Central Thailand were determined using the Multi-Channel Analysis of Surface Wave technique. The Vs. of 35 tested sites were weighted average to 30 m depth based on the National Earthquake Hazards Reduction Program (NEHRP) criteria, which revealed NEHRP site classes C, D, and E within the study area. Soil class C was found in the north of the city. Moreover, most of the residential area of Nakhon Nayok City is positioned on soil classes D and E. The soil in the area of study has an amplification value ranging from 1.4 to 3.9. The central and southwestern parts of the city, which mainly consist of soft sediments, have a higher amplification value than that in the northern part, which mainly consists of coarse grain soils of colluvial deposits. Based on the NEHRP and amplification value, the Nakhon Nayok City area will experience some effect from ground shaking from nearby and far away earthquake seismic sources.
Introduction
Displacement along faults can produce ground movement and intense shaking. The level of shaking is affected by the types of soil and rock through which the seismic waves travel. Most unconsolidated surficial materials tend to amplify ground shaking by reducing the velocity of earthquake waves and increasing their amplitude, which then affects the stability of structures even if they are far from the epicenter of the earthquake (McPherson, 2005; Thitimakorn et al., 2009). Shear-wave velocity (Vs) is a key shallow-subsurface property used to determine the ability to amplify ground shaking (Borcherdt, 1994; Dobry et al., 2000), whereby materials with a lower Vs. are more capable of amplification compared to those with a higher Vs. The Vs. can be measured using multi-channel surface waves (MASW), which is a low-budget, high signal to noise ratio technique. In this method, the Rayleigh waves are recorded using artificial sources, such as a sledgehammer, and several receivers (Park et al., 1999). The National Earthquake Hazards Reduction Program (NEHRP) categorized materials according to their ability to amplify ground shaking using Vs. and the areas affected by seismic ground shaking can be determined and mapped.
Several researchers have successfully used the MASW method to conduct site classification and microzonation studies. Although this technique is available and has been used since the late 1960s, better equipment and computer developed in the present day have resulted in an increase in the recording, processing, and interpretation of the surface wave technique. Mohamed et al. (2013) conducted the MASW surveys to derive the Vs. profiles in both 1D and 2D and later developed the NEHRP site classification map. They found that the reliability of the MASW method depends on the accurate determination of phase velocities for horizontally traveling fundamental mode Rayleigh waves. Mahajan and Kumar (2018) performed site characterization using the microtremor method the in Kangra Valley (NW Himalaya, India) and validated their results by comparing with the Vs. profile obtained from the MASW technique. It was found that the derived Vs. profiles were compared between these two different approaches, which were found to be in good agreement. Sairam et al. (2019) conducted the MASW survey for 600 sites in the Northwestern Deccan Volcanic Province of India. Their study suggested that Vs. derived from the MASW method is a good proxy for soil classifications. Abdallatif et al. (2022) acquired 20 lines of 2D MASW in Abu Dhabi, UAE. Their objectives were to determine subsurface geology, material stiffness, potential weak zones up to ∼35 m depth and to propose the appropriate seismic site classification for a proper foundation design.
The study area of Nakhon Nayok city (NNC) is a province in the Central part of Thailand, which lies within the northwest-southeast trending Nakhon Nayok fault zone (Figure 1). The zone shows evidence of at least two paleo earthquakes in the past. The first earthquake occurred in the Pong Mongkhon fault segment about 3,000 years ago with a magnitude intensity. The second earthquake occurred near the Pa Po fault segment about 1,000 years ago (Department of Mineral Resources, 2012). Furthermore, Nutalaya et al. (1985) reported that two additional earthquakes occurred in two of the surrounding provinces. Lopburi and Chachoengsao. From a lithological point of view, the province of Nakhon Nayok can be divided into two parts. The first is the mountainous area of Khao Yai National Park in the northeast, and the second is the plain in the central and southwest, which contains the urban areas. According to the DMR, the northeastern part consists of volcanic rocks, sandstones and siltstones whereas the urban areas located on the central and southwestern sides are developed on unconsolidated colluvial, alluvial, alluvial fan, delta deposits overlain by flat deposits in brackish water deposits, and delta deposits overlain by deposits of marine clay deposits and natural levees (DMR, 2014). The focus of this study is NNC, located in the center of the province, where there is a dense population.
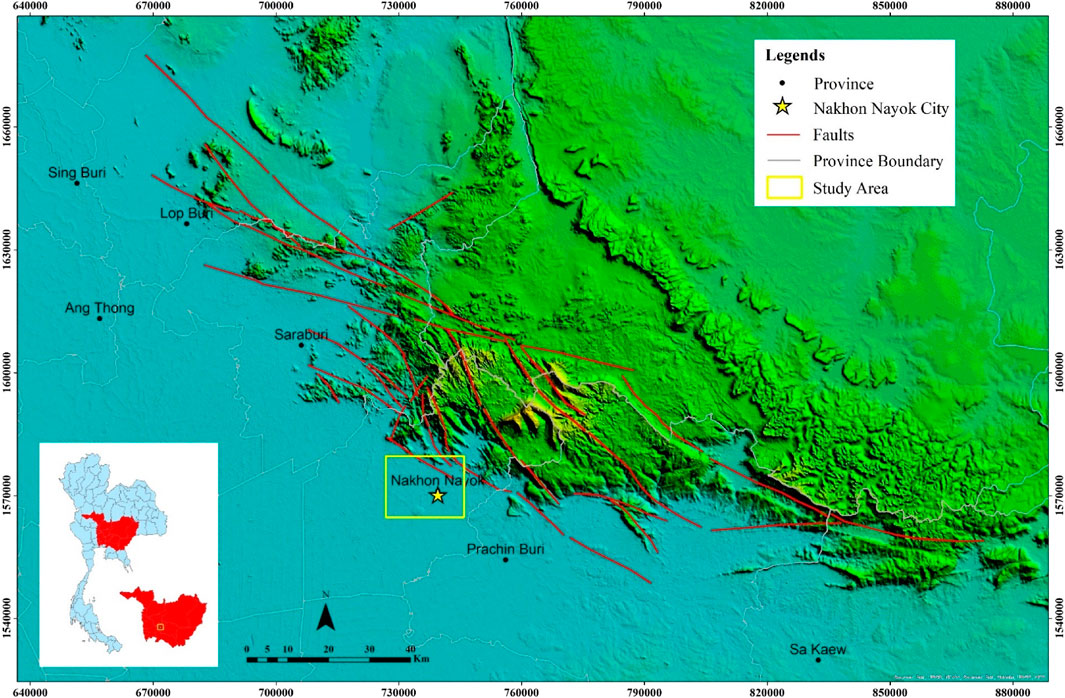
FIGURE 1. Location of Nakhon Nayok City (NNC) and the Nakhon Nayok fault zone in the northeastern part of the city.
From the above, it can be concluded that the NNC is an area vulnerable to earthquake ground shaking due to its tectonic settings and lithology. As a result, an evaluation of the Vs. of soils was carried out to help planning to prevent damage from future earthquakes. The main objective of this study was to use the Vs. values derived from the MASW method to create a site classification map and relevant maps. This study provides an important understanding of the shallow Vs. structure and its distribution in the NNC and surrounding area.
Geology of the study area
The study area is approximately 150 km2 and covers the entire NNC area. The geological map of the area is shown in Figure 2. Volcanic rocks, such as andesite and tuff, as well as clastic sedimentary rocks, are found in the north and northeast part of the study area. The Quaternary age sediments found in the area can be divided into five units: alluvial plain (Qa), colluvium (Qc), delta overlain by tidal flat (Qdf), delta overlain by marine clay (Qdm), and natural levee (Qfl).

FIGURE 2. Surficial geological map of the study area, the MASW test sites, and locations of the boreholes.
The Qa is found in the middle part and is laid in the northwest and southeast directions of the study area and consists mainly of sand, silt, and clay. Due to the limited borehole information in the study area, the thickness of the sediments could not be exactly determined. However, the thickness of this sediment is expected to be greater than 100 m in the central part of the city. The Qc unit consists mainly of gravel and sand and is found mainly in the northern part of the study area. The Qdf consists of sand intercalated by an uneven bed of clay and gravel and is found in the western part of the area. The Qfl is the levee of the Nakhon Nayok river and consists of clay and fine sand. Finally, the Qdm unit is found in the southern part of the area and consists mainly of clay, silty clay, and sandy clay.
Tectonic setting
The regional tectonic processes of Central Thailand (CT) reflect the interaction between the Indian and Eurasian plates. The south and west of CT are convergent margins: subduction in the Andaman-Nicobar region to the west and the Sumatra region to the south-southwest. These subduction zones have created great megathrust earthquakes and damaging crustal earthquakes. The geological structure of the CT sediment basin has been extensively studied using seismic and drilling data from petroleum exploration. Morley and Racey (2010) divided the CT basins into two types. The first type is associated with the strike-slip Mae Ping and Three Pagodas fault belts that occur as intermontane basins in the western highlands. The second type is related to extensional features located beneath the flat Central Plain and formed larger basins than the first. These authors suggest that the origin of these basins may be related to pre-existing structures.
The NNC is at the eastern edge of the central plain basin and is also affected by several tectonic processes that occurred in the CT basin. According to the Department of Mineral Resources (DMR), the NNC is in a low seismic zone. However, resent studies were reported that there was a potentially active fault zone in the northeastern side of the city. The Nakhon Nayok fault zone (Figure 1) was identified in central Thailand by Charusiri (2005), who considered it a branch of the Moei-Tongyi fault. However, it was previously named the Mae-Ping fault by Polachan et al. (1991). Although there is no evidence of present-day seismicity in this fault zone, a paleoseismological study by Charusiri (2005) indicated a slip rate of .17 mm/yr and suggested that the fault zone can generate an earthquake up to Mw 7. From their studied, it considered the Nakhon Nayok fault zone to be one of the major earthquake sources in central Thailand.
Material and method
In this study the MASW method was used to derive the Vs. profiles of soils in the study area. This method was first used in oil and gas as well as in Earth structure studies. Recently, Park et al. (1999) modified this method to suit shallow exploration, especially in geotechnical and environmental applications. This method uses the surface wave in the seismic record, which is noise in conventional seismic exploration. Surface wave propagate near the surface of the Earth has a strong amplitude with over 70%–80% of the total seismic energy compared to the body waves (Sheriff, 1991). The recorded surface wave is transferred into a frequency domain and its dispersion curve can be revealed. Then, the dispersion curve of corresponding surface wave record was transferred to the Vs. profiles using the inversion process.
In this study, 35 test sites of MASW data were acquired, which covered the entire study area (Figure 2). The grid size of the MASW test point was about 1–2 km. The data were collected using 24 4.5-Hz natural frequency geophones and a 24-channel engineering seismograph. All the geophones were placed at 2 m spacing. The source used was a 12-lb sledgehammer to strike a metal plate placed at 10 m from the first receiver. All the MASW data were then transferred to a personal computer for further processing using the SURFSEIS software package of Kansas Geological Survey. All Vs. profiles were weighted average to 30 m to derive the Vs.(30). Then Vs.(30) from all test stations were used to generate the NEHRP and amplification maps respectively.
The accuracy and consistency of the inverted Vs. profiles can be confirmed by looking at the percentage root mean square (%RMS) error from the last iteration of the inversion process. In this study, all %RMS errors of every test site were well below 7%. Thus, it can be concluded that all Vs. profiles derived from the MASW data are acceptable and can be used to generate the site classification map of the area.
Result
NEHRP site classification map
Many researchers have proposed the methods for soil classification based on their physical properties (Joyner et al., 1981; Tinsley and Fumal, 1985; Wills et al., 2000). In Borcherdt et al. (1991). Proposed a correlation between the soil amplification and the weighted average Vs. down to 30 m of soil [Vs.(30)]. This correlation was later incorporated into the NEHRP site classification scheme. The classification divided soils into six classes, which are class A to F, based on their Vs.(30) value. Table 1 shows the soil classification system used by the NEHRP. For earthquake hazard mapping, according to NEHRP guidelines, the Vs. of soils must be determined to a depth of 30 m. The Vs.(30) can be calculated using Eq. 1;
where Vs(i) is the Vs. of any soil layer and di is the thickness of any soil layer.
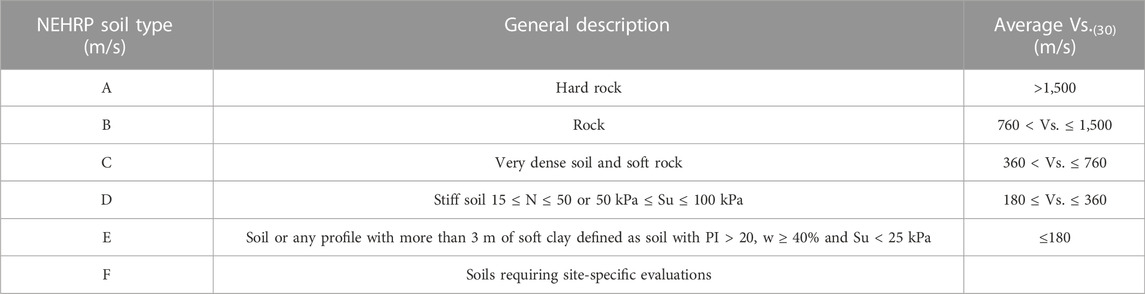
TABLE 1. The NEHRP soil profile type classification for seismic amplification (BSSC, 2003).
To create the NEHRP map, the Vs.(30) of each test location was calculated using Eq. 1 and then the obtained Vs.(30) values were used to classify the site class according to the recommendations of the NEHRP. Finally, the site classification map was generated. Table 2 shows the Vs.(30) values, NEHRP site class, and amplification of each test location. The NEHRP map of the study area is shown in Figure 3.
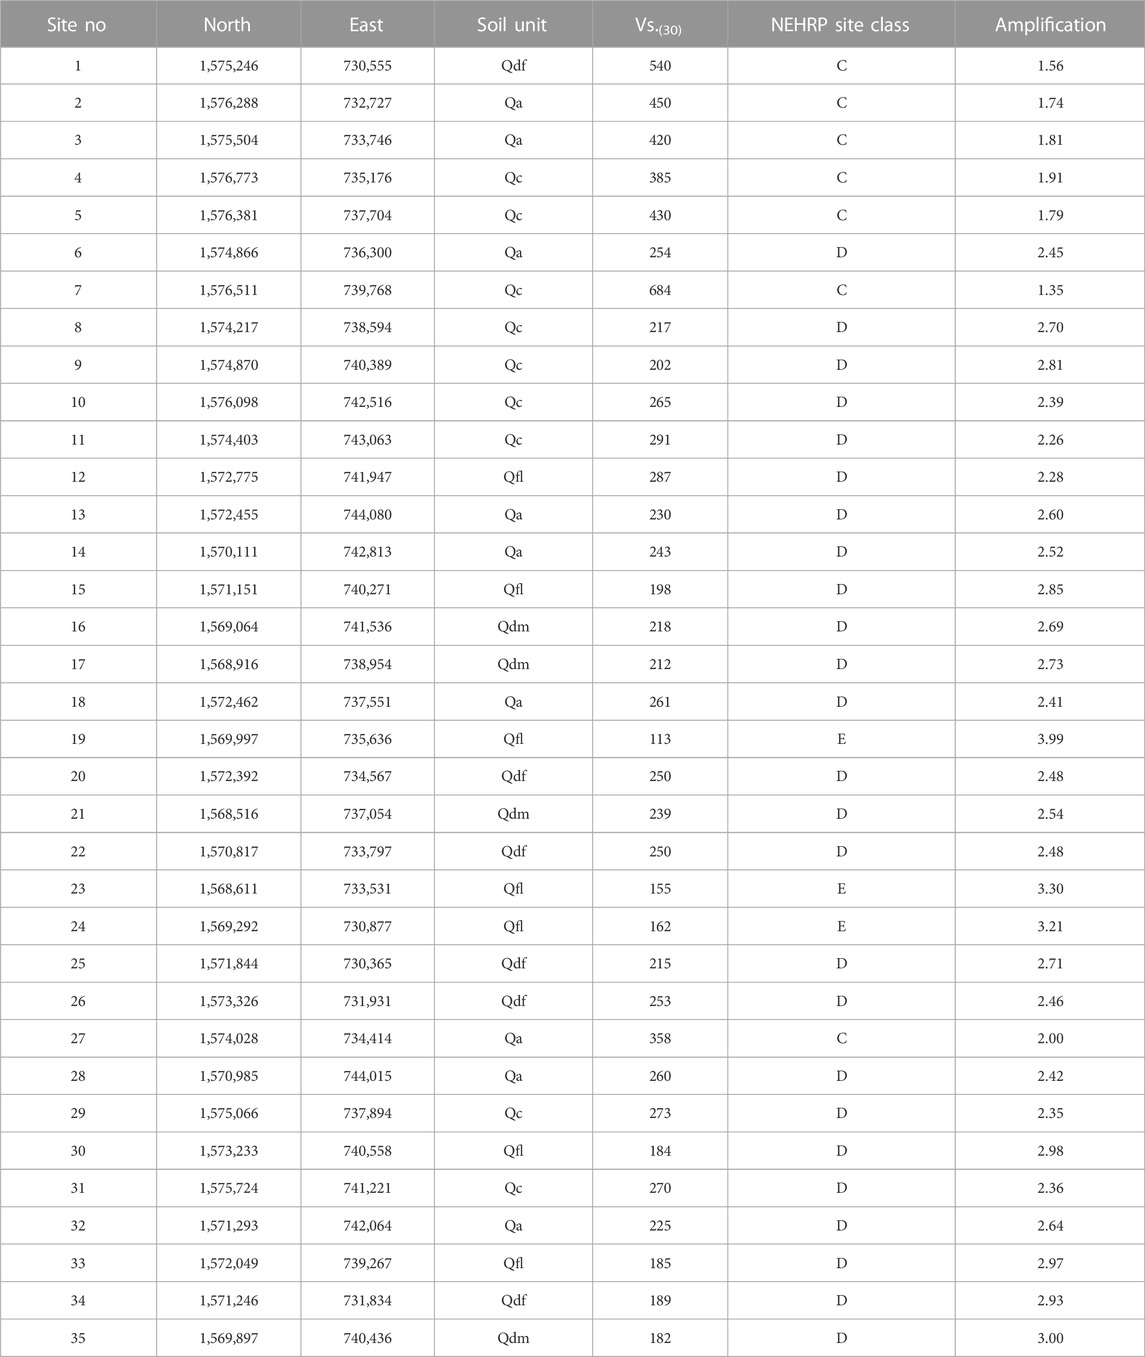
TABLE 2. The NEHRP site classification for each test site.
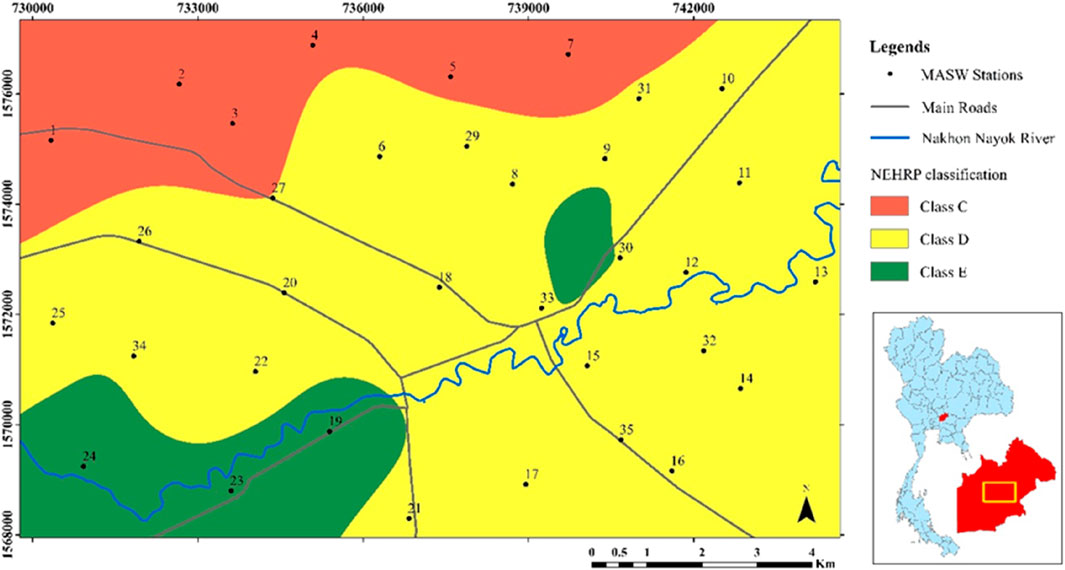
FIGURE 3. Map of NEHRP site classifications for NNC.
Preliminary soil amplification map
When designing any type of engineering structure, it vital to evaluate the possible amplifications of ground shaking caused by earthquakes from nearby or far away seismic sources. Soft soil tends to upsurge the earthquake energy during an earthquake, and so are accountable for a large share of damage. In this study, the Vs.(30) data obtained from the MASW method were used to determine the likely soil amplification of the soils in the NNC area. Midorikawa (1987) proposed the relationship between the Vs.(30) value and soil amplification (A) from seismic energy as given in Eqs 2, 3:
The site amplification map was created based on the Vs.(30) derived from the inversion of the MASW method and is shown in Figure 4. From Table 2, it can be seen that the Vs.(30) of all tested sites were less than 1,100 m/s. So, in this study Eq. 2 was selected to calculate the amplification values.
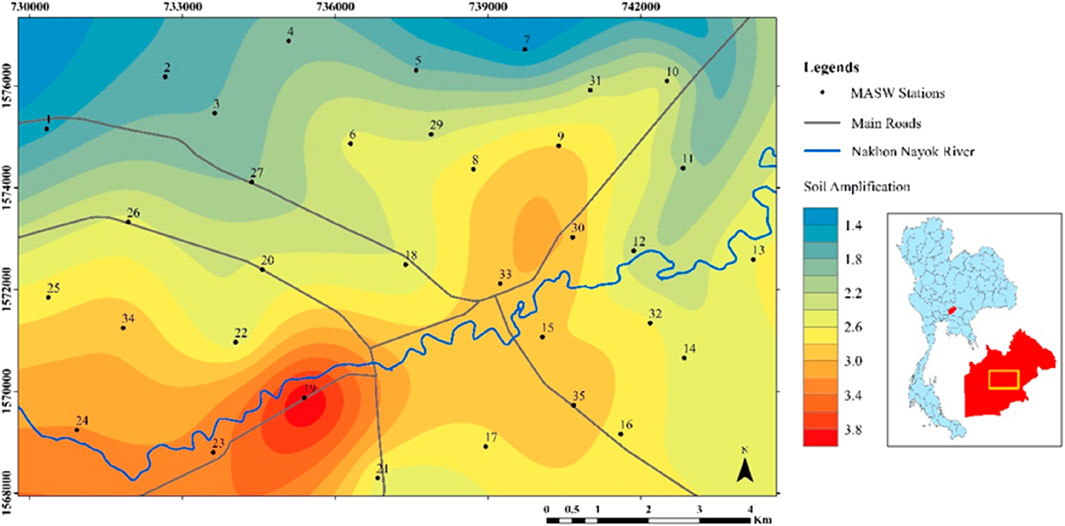
FIGURE 4. Preliminary soil amplification map of NNC.
Discussion
In Figure 3, it is revealed that there were three soil classes (classes C, D, and E) in the study area. Soil class D covered most of the study area. Soil class E was found only along both sides of the Nakhon Nayok river in the southwestern part of the area and some areas in the northeastern side of the city. Soil class C was found in the northern part.
From the NEHRP map, the main part of the city area was situated on soil classes D and E. Soils with lower Vs.(30) values will likely experience more ground shaking than those with higher Vs.(30) values, due to the amplifying properties of the soils. Thus, most of NNC area will be subjected to some soil amplification from ground motion, either from nearby or from distant seismic sources.
In Table 2, the amplification values ranged from 1.4 to 3.9 and were higher in the central and southwestern parts where the soils were mostly soft soils from the alluvial plain and the levee. In the northern part of the study area, the amplification was rather low, apparently because the oils in this area typically consisted of coarse grain sediments from the colluvial deposits. The Vs. in this part were also very high. Clearly, most parts of NNC are in a high amplification area (>2.0).
Conclusion
Vs. profiles from data collected at 35 sites were determined using the MASW method. The test sites were selected to cover as much of the city as possible. The Vs. profiles of each test site were then used to calculate the Vs.(30) values as recommended by the NEHRP guideline. Then, the NEHRP site class was assigned for each test site.
The study showed that the northern part of the area has high Vs.(30) values (higher than 400 m/s) as the soils in this area were mostly gravel and sand from colluvial deposits. On the contrary, the southwestern, south, and central parts of the area had lower Vs.(30) values than in the northern part (less than 300 m/s). The soils in these areas were mostly clay, clayey sand, and sand.
The NEHRP map revealed that there were three soil classes in the study area. Soil class C was found in the northern part, soil class D covered most of the study area, and soil class E was found only along both sides of the Nakhon Nayok river in the southwestern part of the area and some areas in the northeastern side of the city.
The soil amplification values ranged from 1.4 to 3.9, with higher values in the central and southwestern parts. In the northern part of the study area, the amplification was relatively low and the Vs. in this part was also very high. Most parts of NNC are in a relatively high amplification area (> 2.0). Based on the NEHRP and amplification value, the NNC area will experience some effect from ground shaking from nearby and far away earthquake seismic sources.
Data availability statement
The raw data supporting the conclusions of this article will be made available by the authors, without undue reservation.
Author contributions
TT carried out the data acquisition, data processing and interpretation, and drafted the manuscript. RA supervised the data acquisitions and reviewed the manuscript. SK helped to perform data processing and reviewing the manuscript. All authors read and accepted the final manuscript.
Funding
This study was supported by the Ratchadaphiseksomphot Endowment Fund (RCU_D_64_003_23), Chulalongkorn University.
Acknowledgments
The authors kindly thank the Department of Geology, Faculty of Science, Chulalongkorn University for supporting field equipment used in this study.
Conflict of interest
The authors declare that the research was conducted in the absence of any commercial or financial relationships that could be construed as a potential conflict of interest.
Publisher’s note
All claims expressed in this article are solely those of the authors and do not necessarily represent those of their affiliated organizations, or those of the publisher, the editors and the reviewers. Any product that may be evaluated in this article, or claim that may be made by its manufacturer, is not guaranteed or endorsed by the publisher.
References
Abdallatif, T. F., Khozym, A. A., and Ghandour, A. A. (2022). Determination of seismic site class and potential geologic hazards using Multi-Channel analysis of surface waves(MASW) at the industrial city of Abu Dhabi, UAE. NRIAG J. Astronomy Geophys. 11 (1), 193–209. doi:10.1080/20909977.2022.2055829
Borcherdt, R. D. (1994). New developments in estimating site effects on ground motion. Seminar New Dev. Earthq. Ground Motion Estim. Implic. Eng. Des. Pract. Appl. Technol. Counc. 10, 1–44.
Borcherdt, R. D., Wentworth, C. M., Janssen, A., Fumal, T. E., and Gibbs, J. F. (1991). Methodology of predictive GIS mapping for special study zones for strong ground shaking in the San Francisco Bay Region, CA. Proc. 4th Inter Conf. Seis Zona 3, 545–552.
BSSC (2003). NEHRP recommended provisions for seismic regulations for new buildings and other structures, Part1: Provisions, FEMA 368. Kansas City United States: Federal Emergency Management Agency.
Charusiri, P. (2005). Active fault study in ongkalak fault zone, ongkalak, Nakhon Nayok, Central Thailand, technical report. Bangkok, Thailand: Department of Geology, Faculty of Science, Chulalongkorn University, 185. (in Thai with English abstract).
Department of Mineral Resources (2014). Regional classification for geological and resources management in Nakhon Nayok province. Bangkok: Department of Mineral Resources, Ministry of Natural Resources and Environment.
Department of Mineral Resources (2012). Seismic hazard study of Nakhon Nayok province (Nakhon Nayok fault zone) (executive summary contract No. 23/2555. Bangkok: Department of Mineral Resources, Ministry of Natural Resources and Environment.
Dobry, R., Borcherdt, R. D., Crouse, C. B., Idriss, I. M., Joyner, W. B., Martin, G. R., et al. (2000). New site coefficients and site classification system used in recent building seismic code provisions. Earthq. Spectra 16 (1), 41–67. doi:10.1193/1.1586082
Joyner, W. B., Warrick, R. E., and Fumal, T. (1981). The effect of quaternary alluvium on strong ground motion in the Coyote Lake, California, earthquake of 1979. Bull. Seismol. Soc. Am. 71, 1333–1349. doi:10.1785/BSSA0710041333
Mahajan, A. K., and Kumar, P. (2018). Site characterisation in Kangra Valley (NW Himalaya, India) by inversion of H/V spectral ratio from ambient noise measurements and its validation by multichannel analysis of surface waves technique. Near Surf. Geophys. 16, 314–327. doi:10.3997/1873-0604.2018008
McPherson, A. (2005). Estimating the influence of sediments on ground shaking. Aus Geo News 82, 21–22.
Midorikawa, S. (1987). Prediction of seismal map in Kanto plain due to hypothetical earthquake. J. Struct. Dyn. 33, 43–48.
Mohamed, A. M. E., Abu El Ata, A. S. A., Abdel Azim, F., and Taha, M. A. (2013). Site-specific shear wave velocity investigation for geotechnical engineering applications using seismic refraction and 2D multichannel analysis of surface waves. NRIAG J. Astronomy Geophys. 2, 88–101. doi:10.1016/j.nrjag.2013.06.012
Morley, C. K., and Racey, A. (2010). “Tertiary stratigraphy,” in The geology of Thailand. Editors M. F. Ridd, A. J. Barber, and M. J. Crow (London, United Kingdom: Geol. Soc.), 223–271.
Nutalaya, P., Sodsri, S., and Arnold, E. P. (1985). Series on seismology volume II Thailand. Southeast Asia Association of Seismology and Earthquake Engineering.
Park, C., Miller, R., and Xia, J. (1999). Multichannel analysis of surface waves. Geophysics 64 (3), 800–808. doi:10.1190/1.1444590
Polachan, S., Pradidtan, S., Tongtaow, C., Janmaha, S., Intrawijitr, K., and Sangsuwan, C. (1991). Development of cenozoic basins in Thailand. Mar. Petroleum Geol. 8, 84–97. doi:10.1016/0264-8172(91)90047-5
Sairam, B., Singh, A. P., Patel, V., Chopra, S., and Ravi Kumar, M. (2019). VS30 mapping and site characterization in the seismically active intraplate region of western India: Implications for risk mitigation. Near Surf. Geophys. 17, 533–546. doi:10.1002/nsg.12066
Sheriff, R. E. (1991). Encyclopedic dictionary of exploration geophysics. Tulsa, Oklahoma: Society of Exploration Geophysicists.
Thitimakorn, T., Ismail, A., Anderson, N., and Hoffman, D. (2009). Mapping a NEHRP site class using Multi-Channel analysis of surface waves (MASW) method in southeast Missouri. USA. Bull Earth Sci Thai (BEST) 2 (1), 31–39.
Tinsley, J. C., and Fumal, T. E. (1985). “Mapping quaternary sedimentary deposits for areal variations in shaking response, J. I. Ziony, 1360, 101–126. USGS Prof. Pap.Eval. Earthq. Hazards Los Angel. Region – Earth Sci. Perspective
Keywords: Nakhon Nayok, NEHRP, shear wave velocity, MASW, amplification
Citation: Thitimakorn T, Arjwech R and Kupongsak S (2023) Seismic site classification of Nakhon Nayok City, central Thailand, using the MASW technique. Front. Earth Sci. 10:1086385. doi: 10.3389/feart.2022.1086385
Received: 01 November 2022; Accepted: 28 December 2022;
Published: 10 January 2023.
Edited by:
Fanyu Zhang, Lanzhou University, ChinaReviewed by:
Neelima Satyam, Indian Institute of Technology Indore, IndiaJumrik Taipodia, National Institute of Technology, Arunachal Pradesh, India
Copyright © 2023 Thitimakorn, Arjwech and Kupongsak. This is an open-access article distributed under the terms of the Creative Commons Attribution License (CC BY). The use, distribution or reproduction in other forums is permitted, provided the original author(s) and the copyright owner(s) are credited and that the original publication in this journal is cited, in accordance with accepted academic practice. No use, distribution or reproduction is permitted which does not comply with these terms.
*Correspondence: Thanop Thitimakorn, dGhhbm9wLnRAY2h1bGEuYWMudGg=