 Gong Cheng
 Yuying Ban1
 Huan Li
 Rehan Khan
- 1Key Laboratory of Metallogenic Prediction of Nonferrous Metals and Geological Environment Monitoring, Ministry of Education, School of Geosciences and Info-Physics, Central South University, Changsha, China
- 2Hunan Key Laboratory of Remote Sensing Monitoring of Ecological Environment in Dongting Lake Area, Hunan Natural Resources Affairs Center, Changsha, China
- 3School of Mathematics and Statistics, Hunan University of Technology and Business, Changsha, China
Rare earth resource is a national strategic resource, which plays an essential role in the field of high technology research and development. In this paper, we aim to use remote sensing quantitative inversion prospecting technology, use surface-to-surface mode, and model inversion and evaluation through convolutional neural network model to achieve a new research method for large-scale, low-cost, rapid and efficient exploration of ion-adsorbed rare earth ore. The results show that the RE2O3 content of samples has significant negative correlation with the second, third and fourth band of GF-2 image, but has no significant correlation with the first band of GF-2 image; the convolution neural network model can be used to reconstruct the RE2O3 content. The content distribution map of RE2O3 obtained by inversion is similar to that of geochemical map, which indicates that the convolution neural network model can be used to invert the RE2O3 content in the sampling area. The quantitative inversion results show that the content distribution characteristics of ion adsorption rare earth ore in the study area are basically consistent with the actual situation; there are two main high anomaly areas in the study area. The high anomaly area I is a known mining area, and the high anomaly area II can be a prospective area of ion adsorption type rare earth deposit. It shows that the remote sensing quantitative inversion prospecting method of ion adsorption type rare earth deposit based on Convolutional Neural Networks (CNN) model is feasible.
1 Introduction
Rare earth resources play an essential role in aerospace, metallurgy, energy, agriculture and other fields. They are called to be the country’s strategic resources and play’s an essential role in the economic development technological research and development of the country (Liu et al., 2015; Qin, 2019). Increasing in the demand of rear earth resource helps to develop the economy of the country, especially Ion adsorption type rare earth minerals that are dominant in China. Research in recent years on ion adsorption rare earth ores have become the hot spot of global rare earth exploration because of the advantages of complete distribution of light and heavy rare earth elements. The wide distribution range with no radiation by which different rare earth elements can be separated without mineral decomposition (Chi, 1988; Chi and Tian, 2007; Yang and Hu, 2018). In recent years, the geochemical characteristics of rare earth elements and the role of absorption processes in their distribution and fixation in Weathering product deposits have been studied (Abedini et al., 2020; Kiaeshkevarian et al., 2020; Khosravi et al., 2021; Abedini et al., 2022). A well-protected rare earth resource development space and a large number of ion adsorption type rare earth mines have developed in Guangxi lately. Among them, the ion-adsorption type rare earth mines in the Liutang mining area of Chongzuo City are rich in valuable rare earth elements and are easy to mine and wash. Therefore, it has a great significance for the economic development technological research and development to develop and utilize the ion adsorption rare earth ore in Liutang mining area Chongzuo City, Guangxi Province, China.
The traditional rare earth ore exploration methods are mainly chemical exploration and geological exploration methods. These methods are time-consuming and labor-intensive and the exploration cycle is relatively long, which can no longer meet the current economic development needs. Therefore, remote sensing quantitative inversion method is a method that combines remote sensing data and geochemical data to quantitatively observe the surface target. Then invert the content of the observation target, mainly to study the content, distribution and migration laws of various chemical elements on the surface of the earth (Liang et al., 2016; Zhao, 2017). The remote sensing quantitative inversion method has the advantages of being comprehensive, macroscopic, economical, fast, and has a short cycle. It has been widely used in soil heavy metal pollution monitoring (Qiao, 2010; Ding et al., 2012; Mohamed et al., 2018; Zhang et al., 2019; Ding et al., 2019), water pollutant monitoring (Qiao, 2010; Ding et al., 2012; Mohamed et al., 2018; Ding et al., 2019; Zhang et al., 2019), air pollutant monitoring (Wang, 2006; Du et al., 2014; Wu et al., 2018), vegetation index (Cozzolino and Moron, 2004; Huang et al., 2009), and mineral content research (Zhang et al., 2011; Yang et al., 2012; Möller and Williams-Jones, 2018). There is also great potential for applications in mineral exploration. Quantitative inversion models can be classified into two categories: physical models and statistical models. Because physical models are generally very complex and contain a lot of content, at present, domestic and foreign scholars mostly use statistical models for quantitative inversion research. Commonly used statistical models (Ma et al., 2018) are: univariate regression, multiple linear regression (Cheng, 2007; Guo et al., 2018; Cheng et al., 2019a), partial least squares (Li et al., 2005; Liu and Zhang, 2007; Xu et al., 2018), neural networks (Schiller and Doerffer, 1999; Yu et al., 2012; Cao et al., 2017; Lin et al., 2018) support vector machines, random forests and other methods (Durbha et al., 2007; Abdel-Rahman et al., 2013; Xu et al., 2014; Vincenzi et al., 2015; Jiang, 2017; LI et al., 2017; Wang et al., 2018). With the development of computer technology, artificial intelligence science and deep learning methods have been developed, and some scholars began to apply deep learning methods to quantitative inversion, and have achieved good inversion results (Wang et al., 2017; Tan et al., 2018; Liu et al., 2020; Bouslihim et al., 2021). At present, most of the remote sensing quantitative inversion research is based on the measured spectral data. Due to the complex acquisition environment of remote sensing data, it is affected by many factors, results in low inversion accuracy. In addition, in recent years, the quantitative inversion research based on remote sensing image data mostly adopts the multiple linear regression method, results in low inversion accuracy, Fine-grained image classification based on multimodal features is a very hot research topic in the fields of computer vision and pattern recognition, which aims to divide coarse-grained or basic categories of things into more detailed subcategories, and its main feature is that the visual similarity between different categories is very high, and the visual similarity between the same categories is very low. Therefore, the visual similarity of images between different species in these fine classifications is very high, and it is necessary to extract the fine-grained features to distinguish, but labeling in fine-grained categories generally requires a lot of domain knowledge, so the labeling workload is large, and the requirements for labelers are relatively high. Therefore, to improve the inversion accuracy of remote sensing quantitative inversion based on remote sensing images has become an important issue in the research of remote sensing quantitative inversion.
Remote sensing rare earth prospecting is carried out based on the spectral characteristics of rare earth ores, which are related to the atomic structure of rare earth elements. The spectral absorption characteristics of rare earth elements mainly depend on the F-F electronic transition of REE3+. As early as more than 50 years ago, scholars have studied the visible-near-infrared reflection spectral characteristics of rare earth minerals (Adams, 1965; Hunt, 1977), and some other scholars have studied the spectral characteristics of rare earth minerals since then (Batsanov et al., 1969; Dai, 2013; Turner et al., 2014; Boesche et al., 2015). With the development of remote sensing technology, domestic and foreign scholars have applied remote sensing technology to the exploration and research of rare earth minerals, and achieved certain results (Zhang et al., 2012; Zhao et al., 2014; Boesche et al., 2015; Cheng et al., 2019b). However, many scholars at home and abroad have studied the spectral characteristics of rare earth ores and rare earth elements, and also applied remote sensing technology to the exploration of rare earth ores, but most of them use alteration information extraction methods for rare earth ore exploration, and the application of remote sensing quantitative inversion for rare earth ore exploration is still very few, especially the exploration of ion adsorption rare earth ore. We use CNNs for feature extraction, which has the advantage that users do not care about specific features at all, that is, the encapsulation of feature extraction is realized. Convolutional neural network technology is used to automatically extract the optical features of minerals for mineral identification. The successful application of these technologies will have far-reaching application value by reducing the cost and time required to process and identify minerals (Lou et al., 2020).
This paper investigate about the Liutang mining area in Guangxi as the study area, uses the geochemical exploration data of the mining area and remote sensing data of GF-2 as the research data and the following effects are hoped to be obtained. Firstly, after constructing the surface-facing pattern sample set, the Spearman correlation analysis between the rare earth ore content and the GF-2 image band resolution was performed, and it was expected that the RE2O3 content of the sample would have a significant correlation with the wavelength band of the GF-2 image, and the results of the significant correlation between the geochemical exploration RE2O3 content data of the sample and the reflectance data of the GF-2 image band were obtained. Secondly, the convolutional neural network method was used to quantitatively invert the content of ion-adsorbed rare earth minerals in the study area, and the convolutional neural network model proposed could invert the RE2O3 content very well. The Kriging interpolation pattern of the sample RE2O3 content obtained by the model inversion was similar to the RE2O3 content distribution characteristics of the geochemical exploration map. Finally, the accuracy of the model is tested, and compared with the high-definition images of the study area, the distribution characteristics of the expected inversion results are basically in line with the actual situation, and it is proved that the quantitative inversion method of remote sensing of ion-adsorbed rare earth ore based on convolutional neural network model is feasible.
2 Materials and methods
2.1 The study area
This paper investigate the Liutang mining area of Chongzuo City, Guangxi Province as the study area. The Liutang mining area is located in the northwest of Chongzuo City. The geographic coordinates are 107°13′30″∼107°15′00″ east longitude and 22°27′00″∼22°28′09″ north latitude. The mining area is located in the syncline core of Chongzuo, rising from northwest to southeast and dipping from southeast, with a gentle dip angle (10°–20°), and is cut by the Jinlou fault. The exposed strata in the mining area are the Lower Triassic Beisi Formation and the Quaternary strata, the core rock of the syncline is volcanic lava and the surrounding rocks are the Besi Formation limestone. The lithology of the exposed magmatic rocks is the acidic volcanic lava in the Lower Triassic Beisi Formation, mainly rhyolite lava and secondarily granite porphyry, The rhyolite lava is in the upper part, and the granite porphyry is near the limestone in the lower part. The outcrop magmatic rocks are distributed in the whole mining area, and the dip angle is mainly 0°–25° (Gao et al., 2009; Qin, 2019; Qin et al., 2019) (Figure 1).

FIGURE 1. Regional geological map of Guangxi Chongzuo Liutang mining area.
The ion-adsorbed rare earth ore is formed by the of the middle-acid volcanic rock mass in the upper part of the Triassic Beisi Formation rich in rare earth ions under the action of the internal force of the geological structure and then subjected to weathering and denudation. It is decomposed at the bottom, and the rare earth ions are migrated, adsorbed, and finally enriched in the middle and lower parts of the weathering crust. The mining area is characterized by lower mountains and hills, and the climate belongs to the subtropical monsoon climate, which is warm and humid, which is conducive to chemical weathering, so that the upper part of the acidic volcanic rock body develops into a large-scale weathering crust, which is conducive to the formation of ion adsorption rare earth minerals. From the formation mechanism of ion adsorption rare earth ore, we can get the following information: the ore-hosting layer of ion adsorption rare earth ore deposit is mainly the weathering crust of acid volcanic rock mass. On the plane, the mineral content of the ore body is directly related to the degree of development of the weathering crust, the higher the degree of weathering greater the thickness of the weathering crust and greater the thickness of the ore body. Generally, the thickness of the ore body is highest at the mountainside, followed by the top of the mountain, and the thinnest or none at the bottom of the mountain. On the profile, ore bodies are often enriched in the middle and lower parts of the weathering crust (Figure 2).
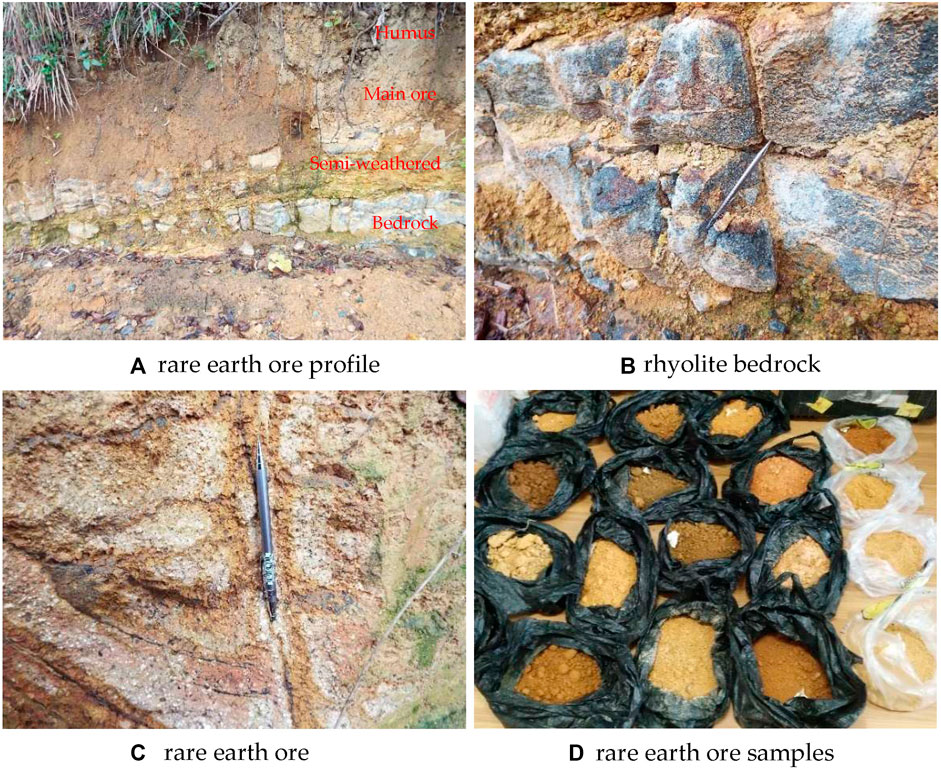
FIGURE 2. Artificial outcrop photographs of rare earth orebodies (A,B), microscopic photographs (C) and outcrop of rock identification (D).
2.2 Geochemical data and processing methods
The geochemical data used in this study come from the sample data obtained by the Guangxi Zhuang Autonomous Region 274 Geological Team during field drilling and exploration in the Liutang mining area. Because remote sensing images can only reflect the characteristics of surface features, only the topsoil samples (0–0.5 m from the surface) in each drilling sample were taken as the sample data for remote sensing quantitative inversion research, and finally a total of 374 sample data were obtained. The chemical composition analysis of the sample was determined in Youyan Rare Earth New Materials Co., Ltd., and the rare earth ore content was the sum of the oxide content of various rare earth elements in the selected sample. As shown in Table 1, the data of 374 samples followed the normal distribution in population, with a minimum content of .16%, a maximum content of 15.99%, a mean content of 3.47%, and a standard deviation of 2.06%. Using GPS to determine the coordinates of the drilling site while collecting the drilling data, the sample data can be projected onto the remote sensing image, the sample point location plot is shown in the Figure 3.

TABLE 1. Correlation analysis of geochemical exploration data.

FIGURE 3. Distribution of sampling points.
2.3 Remote sensing data and processing methods
The remote sensing data used in this study are GF-2 remote sensing data. The GF-2 satellite was successfully launched on 19 August 2014. It is the first civilian optical remote sensing satellite with a ground resolution of 1 m independently developed by China. GF-2 is equipped with panchromatic and ground resolutions of 1 m. It is a 4-m multispectral camera with sub-meter ground resolution and high positioning accuracy. The multispectral imagery of the GF-2 satellite includes four bands. The payload specifications of the GF-2 satellite are shown in Table 2. Since the technical indicators of the GF-2 satellite shows that the band spectrum is mainly concentrated in the visible light band. It can be seen from previous studies that various rare earth elements have characteristic absorption bands in the visible spectrum (Dai, 2013; Dai et al., 2018). Therefore, the band spectrum of the GF-2 image contains the characteristic absorption band of rare earth elements, and the GF-2 remote sensing image can be used as the research data to quantitatively invert the content of rare earth minerals.
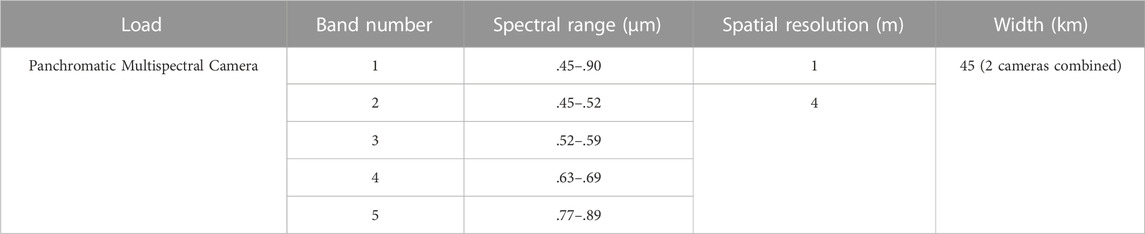
TABLE 2. GF-2 satellite payload technical index table.
The remote sensing image of GF-2 (Figure 4) obtained in this paper was taken on 12 November 2020. The row number of the image is 187/12. The image swath covers the study area. The cloud cover at the time of shooting is less than 5%, which is not affected by cloud cover. Although the shooting time of the obtained remote sensing images is different from that of the geochemical exploration data, the research mining area adopts leaching technology to mine rare earth ore. This mining method has little effect on the rare earth ore content on the surface. Therefore, the mining of ore bodies has little effect on the quantitative inversion research of rare earth ore by remote sensing, and the obtained GF-2 images can be used for quantitative inversion research of remote sensing with geochemical data.
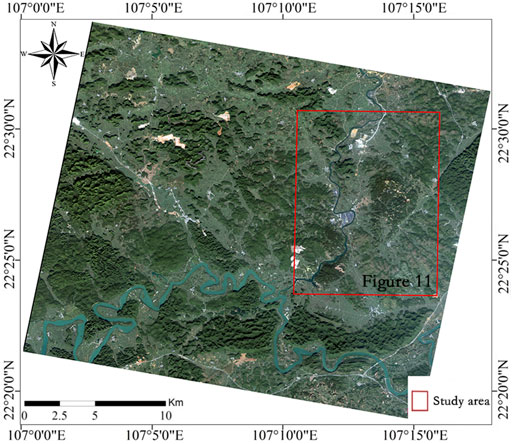
FIGURE 4. GF-2 remote sensing image used in the study.
Since the acquisition of remote sensing satellite images is affected by many factors, the acquired GF-2 remote sensing images need to be preprocessed to reduce the bias caused by these factors. In order to reduce the influence of sensing instruments (sensors) and atmosphere on the spectral reflectance of remote sensing images, it is necessary to perform radiometric calibration and atmospheric correction on the acquired remote sensing images. To reduce the image deviation caused by the satellite shooting and projection, it is necessary to use high-definition and accurate remote sensing images for geometric correction processing, the pair of image spectral curves before and after correction is shown in the Figure 5. Finally, the preprocessed image is cropped to obtain remote sensing data from the study area.
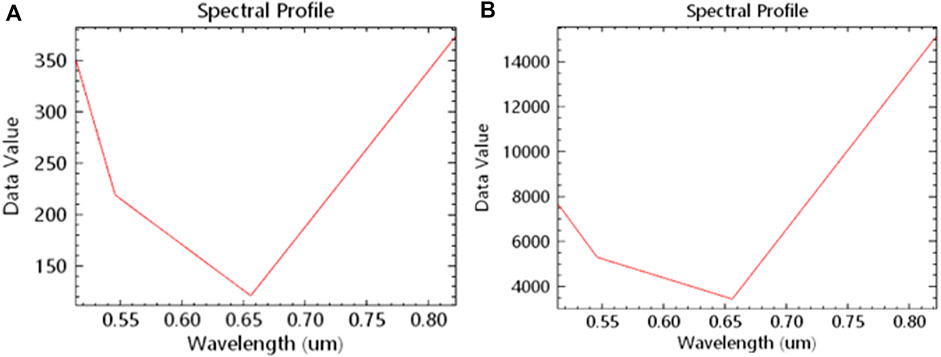
FIGURE 5. Comparison of image spectral curves before and after correction (A), before correction; (B), after correction.
2.4 Method of constructing surface-to-surface correspondence pattern sample set
Traditional remote sensing quantitative inversion and quantitative inversion research is basically carried out by using the corresponding relationship between sample geochemical data and remote sensing image pixel spectral data (point-to-surface). However, the geochemical data obtained from exploration is the chemical composition data of the surface drilling samples. Now the chemical composition of the geochemical samples points is compared with the pixels of the remote sensing image, the geochemical sample is a point on the pixel, if the scale between the geochemical data and the remote sensing image data does not match. In order to reduce the inversion error caused by the scale mismatch, this study constructed a sample set of the surface-to-surface correspondence pattern corresponding to the sample geochemical data and the remote sensing image pixel spectral data. Firstly, according to the coordinates of the sampling point, the rare earth ore content data of the sampling point is projected onto the remote sensing image, and the spectral data of the pixel corresponding to the sampling point is extracted. Then the Kriging interpolation method is used to interpolate the rare earth ore content data of the sample points into a geochemical map with the same pixel size as the remote sensing image, and the rare earth ore content data corresponding to the sampling points are extracted from the geochemical map. Finally, the extracted image spectrum data match with the rare earth ore content data extracted from the geochemical map to construct a surface-to-surface corresponding pattern sample set (Figure 6).
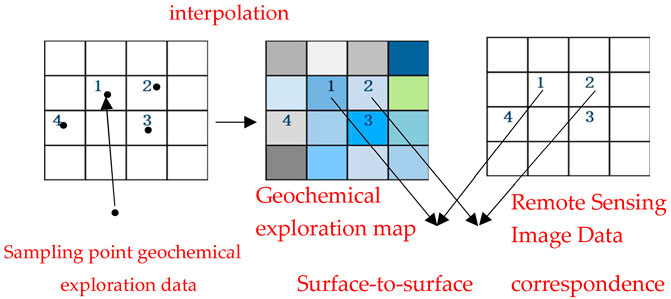
FIGURE 6. Schematic diagram of the construction surface-to-surface correspondence mode.
2.5 Correlation analysis method
According to the principle of remote sensing quantitative inversion, it can be seen that the spectral characteristics of the same mineral are the same, and the same mineral with different contents is only different in the spectral reflectance, so there is a certain relationship between the characteristic spectral reflectance of the mineral and the content of the mineral. Based on the correlation, the inversion model between the rare earth ore content and the reflectance of the remote sensing image band can be established.
In this paper, correlation analysis is carried out on the constructed surface-to-surface correspondence pattern sample set in SPSS software. Because the distribution of RE2O3 content data of the collected samples does not conform to the normal distribution, so Spearman correlation analysis is recommended for the correlation analysis of this research instead of Pearson correlation because Spearman correlation analysis correspond to two-way correlation analysis. Correlation analysis of a sample set of corresponding patterns.
2.6 Convolutional neural network model modeling method
Convolutional Neural Networks (CNN) is a type of feedforward neural network that contains convolution operations and has a deep hierarchical structure. It is one of the representative algorithms of deep learning. The convolutional neural network has strong representation learning ability, and can classify the input information according to its hierarchical structure invariant to translation. The convolutional neural network structure consists of an input layer, a convolutional layer, a pooling layer, a fully connected layer and an output layer. Convolutional neural network has stronger learning ability and feature expression ability than other methods because of its multi-layer characteristics (Li et al., 2016; Liang, 2019; Yuanni et al., 2019). CNN require a smaller sample size for training through the receptive field and weight sharing, and they can therefore obtain a relatively ideal neural network with restricted sample sizes (He et al., 2022). It can be seen that the ability of convolutional neural networks to learn features and the generalization performance of the limit learning machine can reduce the amount of computation and achieve good classification accuracy compared with traditional methods. Moreover, deep learning methods can better solve the complex relationship between remote sensing images and ground observation targets than shallow machine learning methods, and can achieve better remote sensing image recognition and classification effects, so the use of deep learning methods for remote sensing quantitative inversion is expected to improve the accuracy of inversion.
The convolutional neural network model established in this study (Figure 7) has two pooling layers (pool) and a fully connected layer (affine), and a dropout layer (Figure 9) is connected behind the fully connected layer to increase the establishment of the stability of the convolutional neural network model. The ratio of control neurons in the dropout layer to remain activated in this study is set to .7. After the dropout layer, the SoftMax, cross-entropy error (Eq. 1) is output, the performance of the model is judged according to the error value, and then it is transferred to the back propagation process. The 4-band reflectance data of the GF-2 image is used as the independent variable, in order to increase the number of independent variables, the reflectance data of the four bands were copied four times to become 16 independent variables, and then the 16 independent variables were changed into a 4 × 4 matrix, the convolution kernel of the convolutional layer was set to 2 × 2, and the maximum subsampling method was used for the pooling layer, and the ratio of training samples to test samples is set to 2: 1. The convolution kernel of the convolutional layer is set to 2 × 2, the maximum subsampling method is selected for the pooling layer, and the ReLU function is selected for the activation layer. The learning rate of the gradient optimization algorithm is set to .001, the number of trainings is set to 5,000, and the output layer is 1, that is, the content of ion adsorption rare earth ore.
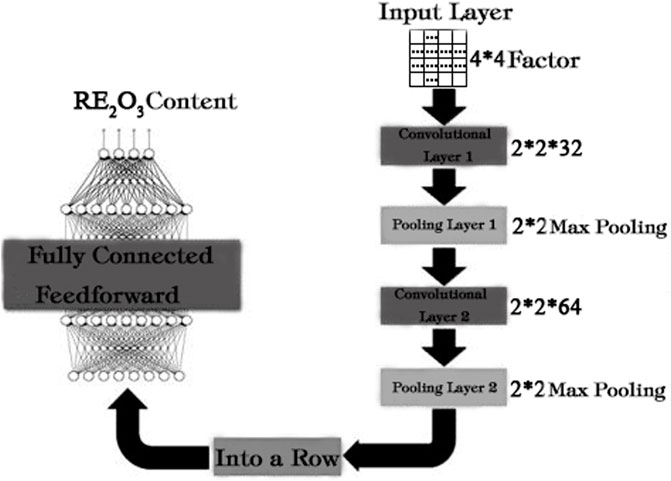
FIGURE 7. Schematic diagram of the construction of the convolutional neural network model of ion-adsorbed rare earth ore.
Among them, n is the number of samples; C is the number of classes; xi is the independent variable of the i-th sample; yi is the predicted value of each i-th sample; wj and bj are the weight and bias values of class j.
The implementation of CNN uses the Python programming language and needs to configure the environment of the pycharm software. Python is a language that represents the idea of simplicity. Reading a good Python program feels like reading English. It allows you to focus on solving problems rather than figuring out the language itself. Due to its open-source nature, Python has been ported to many platforms.
A simple test method is used to test the modeling accuracy and prediction accuracy of the established convolutional neural network model. In the simple test method, 2/3 of the total sampling samples are randomly selected for modeling, and the remaining samples are used for prediction test. Three parameters, R2, RMSE and RPD, are used to represent the inversion accuracy of the model. In addition, Kriging interpolation was performed on the rare earth ore content of the predicted sampling points, and the distribution map of rare earth ore inversion results in the sampling area was obtained, which was compared with the geochemical prospecting map to test the accuracy of the distribution characteristics of the inversion results.
3 Results
3.1 Correlation analysis results
The analysis results (Table 3) showed that the RE2O3 content data and the spectral data of the second, third, and fourth bands of GF-2 images were significantly correlated, and the correlation was negative. This shows that the higher the RE2O3 content of the sample, the lower the spectral reflectance of the image band. The wavelength range of the b2-b4 band covers 520–890 nm. There are multiple characteristic absorption bands of rare earth elements in this band range. There is a significant correlation between the total content of rare earth elements in the sample and the measured hyperspectral in the 560–770 nm band (Figure 8). Therefore, the correlation between the RE2O3 content of the sample and the spectral reflectance of the two, three, and four bands of the GF-2 image is significantly consistent with the spectral characteristics of rare earth elements previously studied. There is a significant correlation between the RE2O3 content data of the sample and the reflectance of the GF-2 image band, so a quantitative inversion model of the sample RE2O3 content and the reflectance of the GF-2 image band can be established.
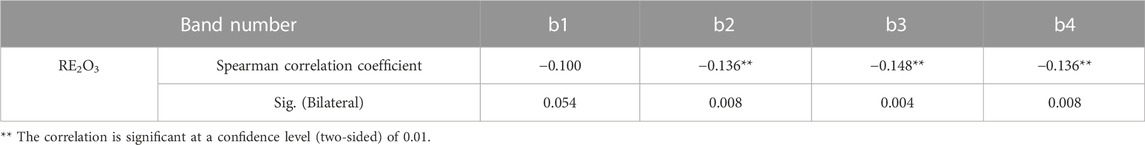
TABLE 3. Correlation coefficient between RE2O3 content and GF-2 image band spectrum.
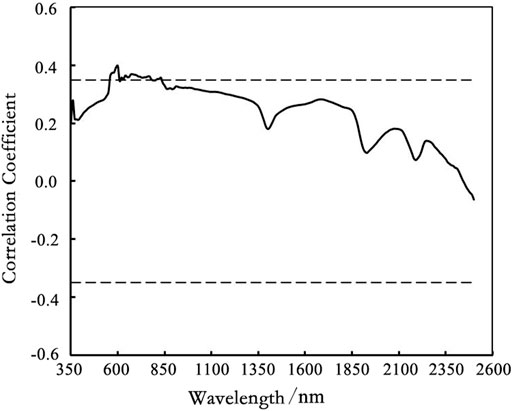
FIGURE 8. Correlation diagram of REEs content in rare earth ore samples and measured hyperspectral.
3.2 Convolutional neural network modeling results
After the convolutional neural network is established, the surface-to-surface corresponding pattern sample set is trained and tested, and the modeling results and detection results of the convolutional neural network are obtained. From the comparison chart of the modeling results of the convolutional neural network (Figure 9A) and the comparison chart of the detection results (Figure 9B), it can be seen that the modeling accuracy and inspection accuracy of the convolutional neural network are high, and the surface-to-surface corresponds to the pattern sample set. The modeling R2 reached .95, the RMSE was .003, and the RPD reached 4.65. The test accuracy was slightly lower than the modeling accuracy (Saeys et al., 2005; Vohland et al., 2011). The test R2 also reached .91, the RMSE was .005, and the RPD reached 3.33. According to the standard of the test parameter index, R2 ≥ .9, RPD ≥ 3, indicating that the established convolutional neural network model can invert the RE2O3 content of the sample extremely well. Modeling comparison diagram and inspection comparison chart. It can be seen that the predicted value of the RE2O3 content and the measured value fit are well fitted, and the sample point is distributed around Y = X straight line.
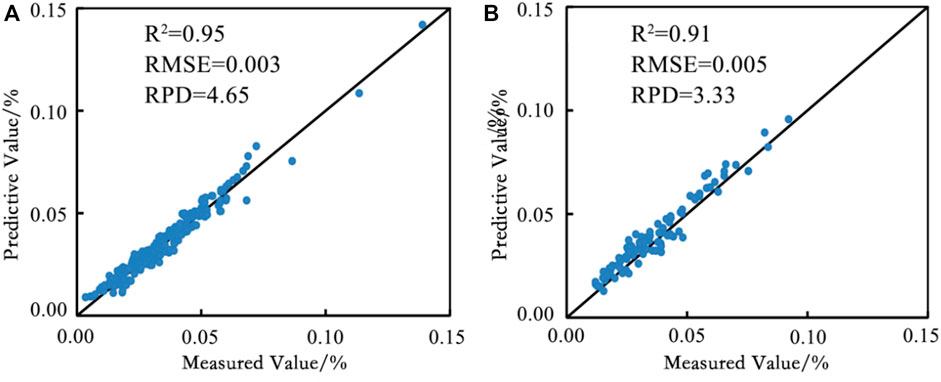
FIGURE 9. Convolutional neural network model inversion results comparison diagram of surface-to-surface corresponding pattern sample set (A), comparison diagram of modeling results; (B), comparison diagram of inspection.
The distribution characteristics of the inversion results in the sampling area were analyzed using the inversion results of the surface-to-surface corresponding model sample set. The RE2O3 content of the samples obtained by the inversion of the convolutional neural network model was interpolated into the RE2O3 content distribution map of the sampling area by Kriging interpolation (Figure 10A). There is a small part of high anomaly area in the middle and the southwest of the sampling area, and the rare earth ore content is lower in the south and southwest of the sampling area. Compared with the geochemical exploration map (Figure 10B) obtained by interpolating the measured RE2O3 content of the sample, it is found that the content distribution characteristics of the sample RE2O3 content obtained by the inversion of the convolutional neural network model are basically similar to the RE2O3 content distribution characteristics of the geochemical exploration map. The distribution position of the high abnormal area in the inversion result of the convolutional neural network model is the same as the distribution position of the high abnormal area in the geochemical exploration map, and there is only a slight difference in the shape. The distribution range in the northwest is larger than that of the geochemical exploration map, but the location is similar, indicating that the established convolutional neural network inversion model can invert the RE2O3 content of the sample well.
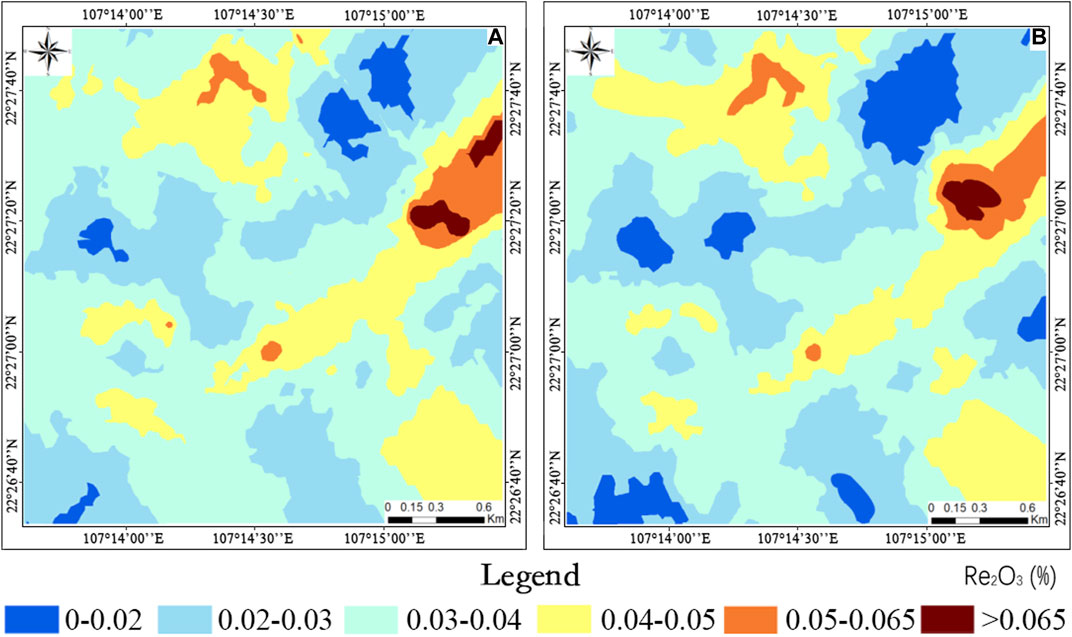
FIGURE 10. Kriging interpolation diagram of RE2O3 content in the sampling area (A), interpolation diagram of convolutional neural network inversion results; (B), interpolation diagram of measured values.
4 Discussion
Firstly, the correlation between the RE2O3 content of the ion-adsorbed rare earth ore sample and the spectral data of the GF-2 remote sensing image was analyzed by using the Spearman correlation coefficient. The RE2O3 content of the rare earth ore sample and the spectral data of the second, third and fourth wavelengths of the GF-2 remote sensing image were significantly negatively correlated respectively. The convolutional neural network model established in Section 3.2 was used to quantitatively invert the study area, and the content distribution map of ion-adsorbed rare earth ore in the study area was obtained (Figure 11). From the distribution map of rare earth ore content, it can be seen that the content distribution of rare earth ore in the study area is relatively concentrated. The RE2O3 content is mainly concentrated in .02%–.04%, and the high anomalous areas of RE2O3 content (RE2O3 content > .065%) are mainly distributed in two areas, which are divided into No. I and No. II high anomaly areas. Other small areas with high RE2O3 content are mainly distributed in the villages, town buildings in the study area and the acid magmatic rock distribution area of the Beisi Formation in the east of the sampling area. The RE2O3 content in the northern and southeastern parts of the study area is relatively low, mainly between .02% and .04%, and the areas with RE2O3 content below .02% are mainly distributed in the rivers and their vicinity in the study area.
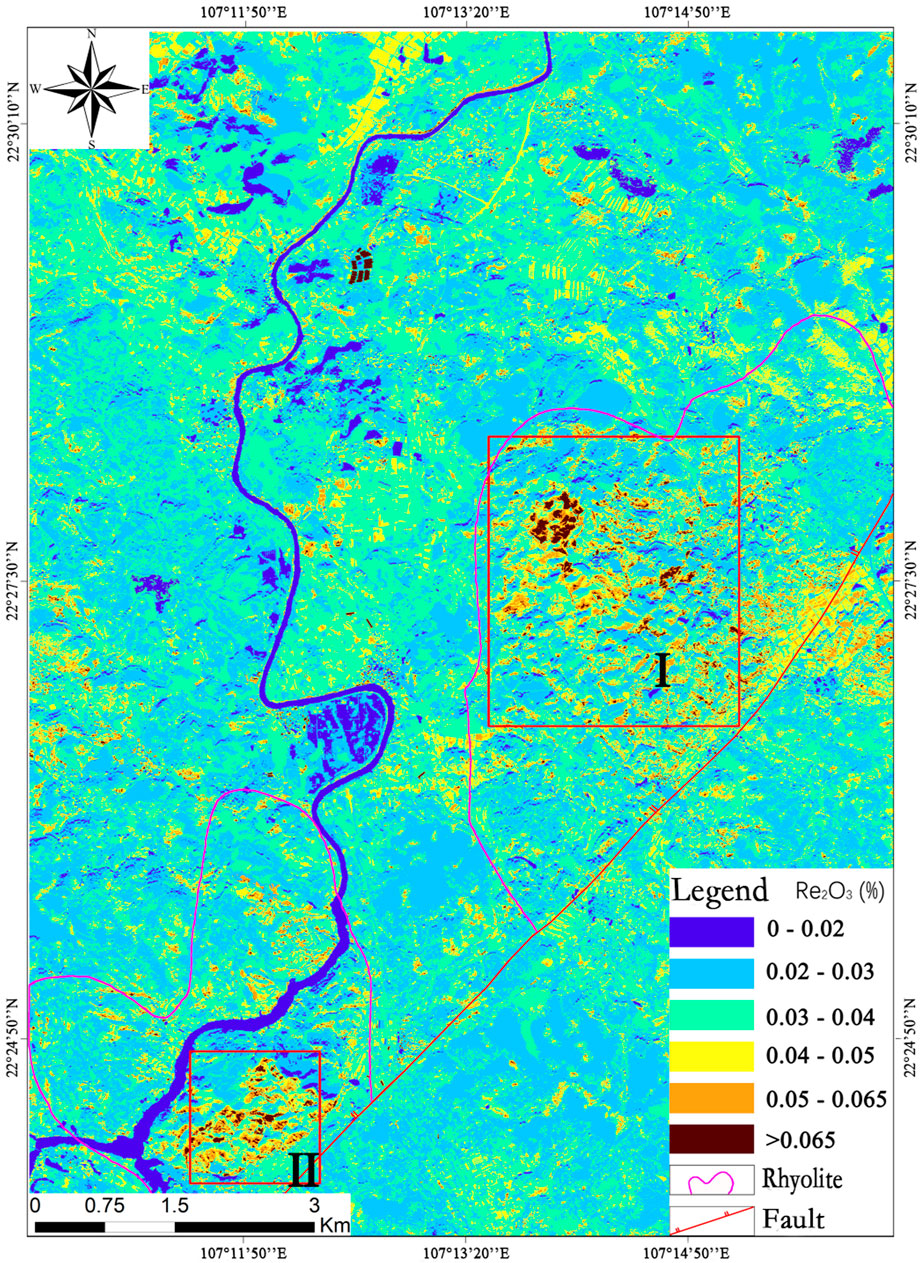
FIGURE 11. Convolutional neural network remote sensing inversion results of rare earth ore content in the study area.
Compared with the remote sensing images of the study area, it can be seen that the high anomaly area I is distributed in the known mining area, and the high anomaly distribution position in the area is relatively consistent with the high anomaly distribution position of the geochemical map, indicating that the inversion result of this high anomaly area is precise. The high anomaly area II is distributed on the exposed area of the acid magmatic rock of the Beisi Formation. The formation is the same as the formation of the sampling mine, and there is a fault near the formation, because the rare earth element ions of the ion adsorption rare earth ore come from the magmatic rock. The rare earth element ions are the basis for the formation of ion adsorption rare earth ore, and the fault provides the internal force genesis for the formation of ion adsorption rare earth ore. Therefore, the magmatic rock distribution area is the precondition for the formation of ion adsorption type rare earth ore, and the high anomaly area may be the former scenic spot of ion adsorption type rare earth mine. The area with RE2O3 content in the range of .04‰–.05‰ is mainly distributed in the river in the western part of the study area, and the content of ion adsorption rare earth ore in the river is higher than that of the surrounding area. Because the wastewater generated by the surrounding mining area will be discharged into the river when mining ion-adsorbed rare earth ore and leaching rare earth elements, which leads to an increase in the content of rare earth ore in the river. It is also the reason why the river environment around the rare earth mining area is polluted, which shows that the distribution of rare earth ore content in the river is reasonable.
Other scattered small high anomaly areas are mainly distributed in villages and towns buildings. This may be because the spectral reflectance of buildings in the visible light band is similar to the resolution of ion-adsorbed rare earth minerals, and the convolutional neural network inversion model cannot distinguish between the two. The inversion result of RE2O3 content in this area is higher, which is inconsistent with the actual situation. In addition to these scattered small areas with high RE2O3 content and two major abnormal areas with high RE2O3 content, other areas in the study area have lower RE2O3 content. Compared with the geological map and remote sensing images of the study area, these areas can also be ruled out as non-reactive areas. The mining area is also consistent with the actual situation.
In short, the inversion results of the convolutional neural network model are not consistent with the actual situation except for some villages and town buildings, the two main high anomaly areas are in line with the actual situation, and the distribution of RE2O3 content in other areas is also in line with the actual situation. Therefore, the inversion results of the convolutional neural network model are relatively good, and the buildings in villages and towns can be seen on the remote sensing images. The false anomaly areas in the study area can be simply eliminated, so that the potential prospects of rare earth mines can be circled, indicating the volume of the integrated neural network model can be applied to prospecting for ion adsorption rare earth ore.
Finally, there are some shortcomings in this paper:
a) High spatial resolution images help to identify soil information, so GF-2 remote sensing images were selected for this experiment. In addition, in order to better identify soil information, it is recommended to add bands of SAR images (Sentinel-1, for example) to detect ground minerals at a certain depth.
b) This study only uses the method of convolutional neural networks for modeling, and does not use other methods for comparison, in subsequent studies, method comparison can be used as a new research point.
c) The influence of vegetation cover on the quantitative inversion results was not considered in this study. The study area belonged to the subtropical climate with vegetation cover was high all over the year. The surface information obtained by remote sensing images would be affected by vegetation, resulting in deviations in the remote sensing quantitative inversion results of ion-adsorbed rare earth mines. In future studies, the influence of vegetation cover on the quantitative inversion results needs to be considered, and the vegetation index in the remote sensing data is excluded before the remote sensing quantitative inversion of ion-adsorbed rare earth ores is carried out.
d) The remote sensing data used in this study are GF-2 images, which are multispectral remote sensing data, the number of bands are small, and the spectral range only covers .52–.89 μm. The spectral range is narrow, and the spectral resolution is also low, which may lead to the submergence of the spectral band of rare earth elements and reduce the accuracy of quantitative inversion. In future studies, high-spectral resolution remote sensing images should be selected as research data as far as possible.
5 Conclusion
Generally, this paper investigates Liutang mining area of Chongzuo City, Guangxi Province as the study area, and uses GF-2 remote sensing images and geochemical exploration data of the study area as the research data for quantitative inversion. Secondly, the surface-to-surface corresponding pattern sample set is constructed and Spearman correlation analysis is executed, then the convolutional neural network model is used to execute quantitative inversion modeling of ion-adsorbed rare earth ore, and the experiment is performed. Finally, the quantitative inversion of the content of ion-adsorbed rare earth ore in the study area was carried out, and the feasibility of quantitative inversion of ion-adsorbed rare earth ore by remote sensing based on convolutional neural network method was analyzed. Specifically, the following conclusions are drawn:
a) After Spearman correlation analysis between rare earth ore content after constructing the surface-to-surface correspondence pattern sample set and GF-2 image band reflectance, it was found that the RE2O3 content of the sample has a significant negative correlation with the second, third, and fourth bands of the GF-2 image respectively. Only the correlation with the first band of the GF-2 image was not significant, therefore, a quantitative inversion model of RE2O3 content can be established by using the geochemical RE2O3 content data of the sample and the reflectance data of the GF-2 image band.
b) Based on the band spectral data of GF-2 images, a convolutional neural network model was established, and the established model was tested. It was found that the RPD of the established convolutional neural network model was above 3.0. It shows that the established convolutional neural network model can invert the RE2O3 content very well. The distribution of RE2O3 content in the sampling area obtained by inversion is basically similar to the distribution characteristics of RE2O3 content in the geochemical exploration map, indicating that the convolutional neural network model can be used to invert the RE2O3 content in the sampling area.
c) Based on GF-2 image data, the established convolutional neural network model was used to quantitatively invert the content distribution map of ion-adsorbed rare earth ore in the study area. It was found that there were two main high anomaly areas in the study area. The high anomaly area I is a known mining area, and the high anomaly area II is distributed in the magmatic acid rock strata of the Beisi Formation, and there are faults nearby, which can be delineated as a prospective area for ion adsorption rare earth ore. Comparing the distribution map of the inversion results of RE2O3 content with the high-definition images in the study area, it is found that the distribution characteristics of the inversion results are basically in line with the actual situation, indicating that the CNN model-based quantitative inversion method for ion adsorption rare earth deposits is feasible.
d) The multi-spectral band range of GF-2 remote sensing images only covers 450–890 nm, the spectral range is narrow, and some characteristic absorption band information of rare earth elements is lost, and the spectral information of some ground objects in this band range is close and cannot be clearly distinguished. Therefore, the accuracy of remote sensing quantitative inversion is reduced to a certain extent. In future research, remote sensing images with high spectral resolution should be selected as research data as much as possible.
Data availability statement
The original contributions presented in the study are included in the article/Supplementary Material, further inquiries can be directed to the corresponding authors.
Author contributions
Conceptualization, GC and HL; methodology, GC and XD; software, YB and HZ; validation, GC, XD, and GL; formal analysis, GC and YB; investigation, GC, YB, LL, and GL; resources, GC; data curation, YB and GC; writing—original draft preparation, GC and YB; writing—review and editing, RK, HZ, and HL; visualization, YB and HZ; supervision, GC and HL; project administration, GC; funding acquisition, GC. All authors have read and agreed to the published version of the manuscript.
Funding
This research was funded by Open project of Hunan Provincial Key Laboratory for remote sensing monitoring of ecological environment in Dongting Lake area (grant number: DTH Key Lab. 2022-12) and Hunan natural resources science and technology plan project (grant number: 2020-04). The APC was funded by Central South University.
Acknowledgments
The authors want to thank Zhenguang Hu and Chinalco Guangxi Nonferrous Rare Earth Development Co., Ltd for his fieldwork assistance.
Conflict of interest
The authors declare that the research was conducted in the absence of any commercial or financial relationships that could be construed as a potential conflict of interest.
Publisher’s note
All claims expressed in this article are solely those of the authors and do not necessarily represent those of their affiliated organizations, or those of the publisher, the editors and the reviewers. Any product that may be evaluated in this article, or claim that may be made by its manufacturer, is not guaranteed or endorsed by the publisher.
References
Abdel-Rahman, E. M., Ahmed, F. B., and Ismail, R. (2013). Random forest regression and spectral band selection for estimating sugarcane leaf nitrogen concentration using EO-1 hyperion hyperspectral data. Int. J. Remote Sens. 34 (2), 712–728. doi:10.1080/01431161.2012.713142
Abedini, A., Khosravi, M., and Dill, H. G. (2020). Rare Earth element geochemical characteristics of the late Permian Badamlu karst bauxite deposit, NW Iran. J. Afr. Earth Sci. 172, 103974. doi:10.1016/j.jafrearsci.2020.103974
Abedini, A., Khosravi, M., and Mongelli, G. (2022). The middle Permian pyrophyllite-rich ferruginous bauxite, northwestern Iran, Irano–Himalayan karst belt: Constraints on elemental fractionation and provenance. J. Geochem. Explor. 233, 106905. doi:10.1016/j.gexplo.2021.106905
Adams, J. W. (1965). The visible region absorption spectra of rare-Earth minerals. Am. Mineral. 50, 356–366.
Batsanov, S. S., Derbeneva, S. S., and Batsanova, R. L. (1969). Electronic spectra of fluorides, oxyfluorides, and oxides of rare-Earth metals. J. Appl. Spectrosc. 10 (2), 240–242. doi:10.1007/bf00615368
Boesche, N. K., Rogass, C., Lubitz, C., Brell, M., Herrmann, S., Mielke, C., et al. (2015). Hyperspectral REE (rare Earth element) mapping of outcrops—Applications for neodymium detection. Remote. sens-basel 7 (5), 5160–5186. doi:10.3390/rs70505160
Bouslihim, Y., Rochdi, A., Aboutayeb, R., el Amrani-Paaza, N., Miftah, A., and Hssaini, L. (2021). Soil aggregate stability mapping using remote sensing and GIS-based machine learning technique. Front. Earth Sci. 9. doi:10.3389/feart.2021.748859
Cao, B., Qiu, Z., Zhu, S., and Cao, B. (2017). Improvement of BPANN based algorithm for estimating water depth from satellite imagery. Bull. Surv. Mapp. 2, 40–44. doi:10.13474/j.cnki.11-2246.2017.0045
Cheng, B. (2007). Study on Quantitative retrieval of soil organic matter and related elements in the black soil in songliao plain based on RS data. Changchun: JLU.
Cheng, G., Li, J., Wang, C., Hu, Z., and Ning, Q. (2019a). Study on hyperspectral quantitative inversion of ionic rare Earth ores. Spectrosc. Spect. Anal. 39 (5), 1571–1578. doi:10.3964/j.issn.1000-0593(2019)05-1571-08
Cheng, G., Zhong, C., Yuan, H., Ren, M., Xu, W., and Wang, D. (2019b). Quantitative remote sensing modeling and inversion of laterite type bauxite based on sample data. GSF 26 (4), 109–116. doi:10.13745/j.esf.sf.2019.7.5
Chi, R. (1988). Geological characteristics of Fujian ion-adsorption rare Earth ore and its prospecting markers. Chin. Rare Earths (4), 49–52. doi:10.16533/j.cnki.15-1099/tf.1988.04.011
Chi, R., and Tian, J. (2007). Review of weathered crust rare Earth ore. J. Chin. Rare Earths 25 (6), 641–650. doi:10.3321/j.issn:1000-4343.2007.06.001
Cozzolino, D., and Moron, A. (2004). Exploring the use of near infrared reflectance spectroscopy (NIRS) to predict trace minerals in legumes. Anim. Feed Sci. Technol. 111, 161–173. doi:10.1016/j.anifeedsci.2003.08.001
Dai, J. (2013). Quantitative estimation of concentrations of dissolved rare earth elements using reflectance spectroscopy. Beijing: CUGB.
Dai, J., Wu, Y., and Ling, T. (2018). Reflectance spectroscopy and hyperspectral detection of rare rarth element. Spectrosc. Spect. Anal. 38 (12), 3801–3808. doi:10.3964/j.issn.1000-0593(2018)12-3801-08
Ding, M., Xiao, H., Chen, S., Guo, Y., and Wu, H. (2012). Remote sensing quantitative retrieval of soil organic matter content in the land development and consolidation region based on BP neural network. Natur.Sci.J.Xiangtan Univ. 34 (2), 103–106. doi:10.3969/j.issn.1000-5900.2012.02.022
Ding, H., Chen, Y., and Chen, Y. (2019). Remote sensing inversion method of soil iron content in the loess plateau. Remote Sens. Technol. Appl. 34 (2), 275–283. doi:10.11873/j.issn.1004-0323.2019.2.0275
Du, J., Yang, G., and Li, J. (2014). Quantitative retrieval of Chlorophyll-A by remote sensing in linghe river based on HJ-1B data. Water Sav. Irrig. 9, 50–53. doi:10.3969/j.issn.1007-4929.2014.09.013
Durbha, S., King, R. L., and Younan, N. H. (2007). Support vector machines regression for retrieval of leaf area index from multiangle imaging spectroradiometer. Remote Sens. Environ. 107, 348–361. doi:10.1016/j.rse.2006.09.031
Gao, Z., Li, Q., Cai, H., and Luo, S. (2009). On the Guangxi ion adsorption deposits. NanFang ZiRan ZiYuan (3), 23–25. doi:10.3969/j.issn.1672-321X.2009.03.005
Guo, B., Zhang, J., and Wu, D. (2018). Thermal hyperspectral remote rensing for the quantitative inversion of quartz content by regression analysis. Sci. Technol. Eng. 17, 125–130. doi:10.3969/j.issn.1671-1815.2018.17.021
He, Y., Zhang, Z., Wang, X., Zhao, Z., and Qiao, W. (2022). Estimating the total organic carbon in complex lithology from well logs based on convolutional neural networks. Front. Earth. Sc-switz. 567, 871561. doi:10.3389/feart.2022.871561
Huang, C., Han, L., Yang, Z., and Liu, X. (2009). Exploring the use of near infrared reflectance spectroscopy to predict minerals in straw. Fuel 88, 163–168. doi:10.1016/j.fuel.2008.07.031
Hunt, G. R. (1977). Spectral signatures of particulate minerals in the visible and near infrared. Geophysics 42 (3), 501–513. doi:10.1190/1.1440721
Jiang, H., Yusufujiang, R., Baihetinisha, A., He, H., and Hazritiomar, M. (2017). Soil retrieval by synergizing optical and microwave remote sensing data based on support vector machine regression algorithm. Geogr. Geoinformation Sci. 33 (6), 30–36. doi:10.3969/j.issn.1672-0504.2017.06.006
Khosravi, M., Vérard, C., and Abedini, A. (2021). Palaeogeographic and geodynamic control on the Iranian karst-type bauxite deposits. Ore Geol. Rev. 139, 104589. doi:10.1016/j.oregeorev.2021.104589
Kiaeshkevarian, M., Asghar Calagari, A., Abedini, A., and Shamanian, G. (2020). Geochemical and mineralogical features of karst bauxite deposits from the Alborz zone (Northern Iran): Implications for conditions of formation, behavior of trace and rare Earth elements and parental affinity. Ore Geol. Rev. 125, 103691. doi:10.1016/j.oregeorev.2020.103691
Li, J., Tian, Q., and Wu, J. (2005). The study of spectral responses of agricultural soils for Fe, Zn and Se in the area of fuyang riversides. Remot. Sens. Inf. 3, 10–13. doi:10.3969/j.issn.1000-3177.2005.03.003
Li, Y., Hao, Z., and Lei, H. (2016). Survey of convolutional neural network. J. Comput. Appl. 36 (9), 2508–2515. doi:10.11772/j.issn.1001-9081.2016.09.2508
Li, Z., Xin, X., Tang, H., Yang, F., Chen, B. r., and Zhang, B. h. (2017). Estimating grassland LAI using the random forests approach and landsat imagery in the meadow steppe of Hulunber, China. J. Integr. Agr. 16 (2), 286–297. doi:10.1016/S2095-3119(15)61303-X
Liang, D. (2019). Research on the architecture of convolutional neural networks and their applications. Jinan: SDNU.
Liang, S., Cheng, J., Jia, K., Jiang, B., Liu, Q., Liu, S., et al. (2016). Recent progress in land surface quantitative remote sensing. Journal of Remote Sensing. J. Remote Sens. 20 (5), 875–898. doi:10.11834/jrs.20166258
Lin, J., Pan, Y., Yang, M., Tong, G., Tang, P., and Zhang, J. (2018). Quantitative inversion of long sequential leaf area index using remote sensing based on BP neural network from 1988 to 2013. Acta Ecol. Sin. 38 (10), 3534–3542. doi:10.5846/stxb201703290547
Liu, H., and Zhang, L. (2007). A predictive model for the hyperspectral character of saltmarsh soil to its heavy metal content at Chongming Dongtan. Acta Ecol. Sin. 27 (8), 3427–3434. doi:10.3321/j.issn:1000-0933.2007.08.040
Liu, X., Meng, M., Zhao, Z., Wang, N., Huang, F., Zhang, B., et al. (2015). Review of remote sensing technology application in Rare-Earth mining. J. Rare. Earths 33 (5), 524–534. doi:10.11785/S1000-4343.20150501
Liu, L., Zhang, Y., Li, Y., Liu, X. Y., and Wan, Y. (2020). PM2.5 Inversion using remote sensing data in eastern China based on deep learning. Environ. Sci. 41 (4), 1513–1519. doi:10.13227/j.hjkx.201909209
Lou, W., Zhang, D., and Bayless, R. C. (2020). Review of mineral recognition and its future. Appl. Geochem. 122, 104727. doi:10.1016/j.apgeochem.2020.104727
Ma, X., Zhou, K., Wang, J., and Cui, S. (2018). Hyperspectral remote sensing quantitative inversion of ore-forming element content. Contr Geol. Min. Resour. Res. 33 (4), 644–650. doi:10.6053/j.issn.1001-1412.2018.04.20
Mohamed, E. S., Saleh, A. M., Belal, A. B., and Gad, A. (2018). Application of near-infrared reflectance for quantitative assessment of soil properties. EJRS 21, 1–14. doi:10.1016/j.ejrs.2017.02.001
Möller, V., and Williams-Jones, A. E. (2018). A hyperspectral study (V-NIR-SWIR) of the nechalacho REE-Nb-Zr deposit, Canada. J. Geochem Explor 188, 194–215. doi:10.1016/j.gexplo.2018.01.011
Qiao, L. (2010). Hyperspectral characteristics of soil and quantitative remote sensing Inversion on TM data in Harbin. Harbin: NEFU.
Qin, F. (2019). Metallogenic condition and prospecting prognosis of ion adsorption rare earth deposits in Chongzuo area, Guangxi Province. Guilin: GLUT. doi:10.7666/d.D01818688
Qin, F., Tan, J., Zhou, Y., and Meng, X. (2019). Characteristics and Genesis of ion-adsorbed rare-Earth deposits in volcanic weathering crust in Chongzuo area of Guangxi. Min. Resour+ Geol. 33 (2), 234–241. doi:10.3969/j.issn.1001-5663.2019.03.007
Saeys, W., Mouazen, A. M., and Ramon, H. (2005). Potential for onsite and online analysis of pig manure using visible and near infrared reflectance spectroscopy. Biosyst. Eng. 91 (4), 393–402. doi:10.1016/j.biosystemseng.2005.05.001
Schiller, H., and Doerffer, R. (1999). Neural network for emulation of an inverse model-operational derivation of case II water properties from MERIS data. Int. J. Remote Sens. 20 (9), 1735–1746. doi:10.1080/014311699212443
Tan, J., Mao, K., Zuo, Z., Zhao, T., Tan, X., and Li, J. (2018). Soil moisture retrieval based on convolutional neural network and AMSR2 microwave remote sensing. High. Technol. Lett. 28 (5), 399–408. doi:10.3772/j.issn.1002-0470.2018.05.003
Turner, D. J., Rivard, B., and Groat, L. A. (2014). Visible and short-wave infrared reflectance spectroscopy of REE fluorocarbonates. Miner. 99, 1335–1346. doi:10.2138/am.2014.4674
Vincenzi, S., Zucchetta, M., Franzoi, P., Pellizzato, M., Pranovi, F., De Leo, G. A., et al. (2015). Application of a Random Forest algorithm to predict spatial distribution of the potential yield of Ruditapes philippinarum in the Venice lagoon, Italy. Ecol. Model 222 (8), 1471–1478. doi:10.1016/j.ecolmodel.2011.02.007
Vohland, M., Besold, J., Hill, J., and Frund, H. C. (2011). Comparing different multivariate calibration methods for the determination of soil organic carbon pools with visible to near infrared spectroscopy. Geoderma 166 (1), 198–205. doi:10.1016/j.geoderma.2011.08.001
Wang, R., Chen, T., Wang, Y., Wang, L. S., Xie, C. J., Zhang, J., et al. (2017). Soil near-infrared spectroscopy prediction model based on deep sparse learning. Chin. J. Lumi 38 (1), 109–116. doi:10.3788/fgxb20173801.0109
Wang, X., Zheng, X., Han, Z., Wang, X., and Wang, J. (2018). Random forests-based hybrid feature selection algorithm for soil potassium content inversion using hyperspectral technology. Spectrosc. Spect. Anal. 38 (12), 3883–3889. doi:10.3964/j.issn.1000-0593(2018)12-3883-07
Wang, Y. (2006). Study on the Urban Aerosol quantitative retrieval based on the remote sensing and gGround-based air quality measurement data. Nanjing: NNU. doi:10.7666/d.y981384
Wu, Z., Li, J., Wang, R., Rui, W., Lei, S., Song, M., et al. (2018). Estimation of CDOM concentration in inland lake based on random forest using Sentinel3A OLCI. J. Lake Sci. 30 (4), 979–991. doi:10.18307/2018.0411
Xu, J., Dong, J., Yang, Y., Tan, K., and Cheng, W. (2014). Support vector machine model for predicting the cadmium concentration of soil-wheat system in mine reclamation farmland using hyperspectral data. Acta Photonica Sin. 43 (5), 530001–530008. doi:10.3788/gzxb20144305.0530001
Xu, W., Cheng, G., Lu, Y., Zhou, W., and Sun, W. (2018). Remote sensing prospecting prediction about chromite in BINARA area of Sophia province, Madagascar. Contr Geol. Min. Resour. Res. 33 (1), 108–114. doi:10.6053/j.issn.1001-1412.2018.01.014
Yang, H., Zhang, L., Huang, Z., Zhang, X. W., and Tong, Q. X. (2012). Quantitative iInversion of rock SiO2 content based on thermal infrared emissivity spectrum. Spectrosc. Spect. Anal. 32 (6), 1611–1615. doi:10.3964/j.issn.1000-0593(2012)06-1611-05
Yang, T., and Hu, L. (2018). Study on distribution regularity of iron adsorption rare Earth deposits in Guangxi and forecast for prospecting target area. Min. Explor 9 (6), 1179–1184. doi:10.3969/j.issn.1674-7801.2018.06.020
Yu, F., Zhao, Y., and Li, H. (2012). Soil moisture retrieval based on GA-BP neural networks algorithm. J. Infrared. Millim. W 31 (3), 283–288. doi:10.3724/SP.J.1010.2012.00283
Yuanni, D., Yang, H., and Fang, H. (2019). Aero-engine gas path fault diagnostic method based on convolutional neural network. Comput. Meas. Control 27 (10), 74–78. doi:10.16526/j.cnki.11-4762/tp.2019.10.016
Zhang, L., Zhang, X., Huang, Z., Yang, H., and Zhang, F. Z. (2011). Quantitative estimation of CaO content in surface rocks using hyperspectral thermal infrared emissivity. Spectrosc. Spect. Anal. 31 (11), 2940–2943. doi:10.3964/j.issn.1000-0593(2011)11-2940-04
Zhang, Q., Zhang, D., Huang, G., and Zhu, J. (2012). The remote sensing prospecting information extraction and mineral resources prognosis in the Banqiao rare Earth mineral deposit. Remot Sens. Land Resour. 2012 (1), 120–126. doi:10.6046/gtzyyg.2012.01.21
Zhang, S., Shen, Q., Nie, C., Huang, Y., Wang, J., Hu, Q., et al. (2019). Hyperspectral inversion of heavy metal content in reclaimed soil from a mining wasteland based on different spectral transformation and modeling methods. Spectrochim. Acta. A 211, 393–400. doi:10.1016/j.saa.2018.12.032
Zhao, H. (2017). Research on a remote-sensing geochemistry nonlinear inversion model based on ETM+ data. Changchun: JLU.
Keywords: ion adsorption rare earth ore, remote sensing, quantitative inversion, convolutional neural network model, GF-2 image, RE2O3 content
Citation: Cheng G, Ban Y, Deng X, Li H, Zhang H, Li G, Liao L and Khan R (2023) Research on quantitative inversion of ion adsorption type rare earth ore based on convolutional neural network. Front. Earth Sci. 10:1086325. doi: 10.3389/feart.2022.1086325
Received: 01 November 2022; Accepted: 19 December 2022;
Published: 06 January 2023.
Edited by:
Ali Abedini, Urmia University, IranReviewed by:
Maryam Khosravi, Isfahan University of Technology, IranWeitao Chen, China University of Geosciences Wuhan, China
Copyright © 2023 Cheng, Ban, Deng, Li, Zhang, Li, Liao and Khan. This is an open-access article distributed under the terms of the Creative Commons Attribution License (CC BY). The use, distribution or reproduction in other forums is permitted, provided the original author(s) and the copyright owner(s) are credited and that the original publication in this journal is cited, in accordance with accepted academic practice. No use, distribution or reproduction is permitted which does not comply with these terms.
*Correspondence: Xiaoqing Deng, MjAwMkBodXRiLmVkdS5jbg==; Huan Li, bGlodWFuQGNzdS5lZHUuY24=