- 1Applied Mineral and Petrology Special Task Force for Activating Research (AMP STAR), Department of Geology, Faculty of Science, Chulalongkorn University, Bangkok, Thailand
- 2Petroleum Geoscience, Faculty of Science, Chulalongkorn University, Bangkok, Thailand
An evaluation of the potential shale gas play and geological carbon dioxide (CO2) storage from the Triassic Huai Hin Lat Formation in Thailand was performed based on field observations and mineralogical and geochemical data. This study was mainly focused on mudstone samples in some parts of the Huai Hin Lat Formation. The samples can be divided into three groups based on their mineral compositions as follows: coaly mudstone, carbonate-siliceous mudstone, and carbonate mudstone. The brittleness index based on their mineral compositions indicates that the samples show ultra-high carbonate and quartz contents, which suggests a good hydraulic fracture candidate. Total organic carbon and extractable organic matter of the samples represents poor to excellent generation potential for hydrocarbon source rock with type III kerogen. The depositional environment shows that the Huai Hin Lat Formation occurs in anoxic to suboxic conditions in an aquatic depositional environment. The formation is suitable for geological CO2 storage, which may reduce CO2 during petroleum production and increase the production rate. Consequently, results from this study are useful for unconventional shale reservoir exploration and carbon storage technology in Thailand and adjacent countries.
1 Introduction
Organic-rich shales and mudstones have been extensively studied due to their significant potential as unconventional and conventional petroleum resources (Curtis, 2002; Brindle et al., 2015; Zeng et al., 2015; Li et al., 2018; He et al., 2021; Yang et al., 2021; Zhao et al., 2021; Hazra et al., 2022). Currently, advanced technology developments, such as horizon drilling and hydraulic fracturing, have unlocked the ability to access unconventional shale gas and shale oil resources. These unconventional shale reservoirs can store carbon dioxide (CO2) within fractures and pores after the hydraulic fracturing process. In addition, CO2 can be absorbed by organic matter and clay minerals within organic-rich shale formations. Carbon capture and storage (CCS) technology has been developed as petroleum exploration and production technology has progressed because CCS technology involves many of the same technologies as the petroleum exploration and production industry (Metz et al., 2005). With the successful exploration and development of shale gas in the United States, the global petroleum industry has increased its trends to increase the exploration activities in unconventional shale gas and shale oil basins and this has included carbon storage studies in these shale basins (e.g., Brindle et al., 2015; Pranesh, 2018). However, shales and mudstones usually contain a wide variety of bedding styles and materials derived from different sources. Compared with the United States, the Southeast Asian region is lagging in the exploration and development of shale gas and geological CO2 storage in unconventional shale reservoirs.
Shale gas basins in Thailand and adjacent regions are controlled by several factors such as the effective thickness of organic-rich shales, total organic carbon (TOC), organic matter maturity and brittle mineral content. Triassic Huai Hin Lat organic-rich shale is one of the main petroleum source rocks in the Khorat Plateau and widely occurs in the plateau and adjacent areas (Sattayarak et al., 1989; Racey, 2011). However, petroleum exploration wells penetrating into the Huai Hin Lat shales are limited in the Khorat Plateau due to the very thick overburden rock (Racey, 2011). Thus, sedimentary basin developments and geochemical characteristics of different lithofacies within the Huai Hin Lat shale have not been systematically explained. This study combines field observations with mineralogical and geochemical data to ascertain the mineralogical compositions, geochemical characteristics, and depositional environments of mudstones from certain parts of the Huai Hin Lat Formation. These new insights will be useful in promoting the exploration and efficient development of the next stage of shale gas and geological CO2 storage in Thailand and similar areas.
2 Geological setting
The study area is located at the western margin of the Khorat Plateau, Thailand (Figure 1). The plateau rifted from the northern margin of Gondwana in the Late Devonian and has drifted as continental blocks since then (Barber et al., 2011; Metcalfe, 2011; Morley, 2012; Morley et al., 2013; Choong et al., 2022). The two continental blocks, Indochina and South China, formed the Khorat Plateau after they drifted over the Palaeotethys Ocean and then started to collide in the Late Permian (Hutchison, 1989; Metcalfe, 1996). In the Early to Middle Triassic, another continental block named Sibumasu started to collide with Indochina forming the Nan-Uttaradit Suture at the western margin of the Khorat Plateau (Figure 1). During this collision, Permian carbonates and clastics of the Saraburi Group were deposited in a deep to shallow marine environment. The Permian carbonates are the main proven petroleum reservoirs in the region. The collision event was followed by a Late Triassic tectonic extension, which created half-graben basins, where the non-marine sequences were deposited as the Huai Hin Lat Formation (Figure 2; Cooper et al., 1989; Sattayarak et al., 1989; Drumm et al., 1993; Booth and Sattayarak, 2011; Phujareanchaiwon et al., 2021). The depositional environment of the Huai Hin Lat Formation is broadly interpreted to be fluvio-lacustrine sediments of the Late Triassic (Norian) age based on the Estheria fauna, spores, and pollen (Chonglakmani and Sattayarak, 1978; Phujareanchaiwon et al., 2021; Chitnarin et al., 2022). Additionally, the Huai Hin Lat Formation was covered by thick non-marine Mesozoic sequences in the Khorat Plateau (Figure 1).
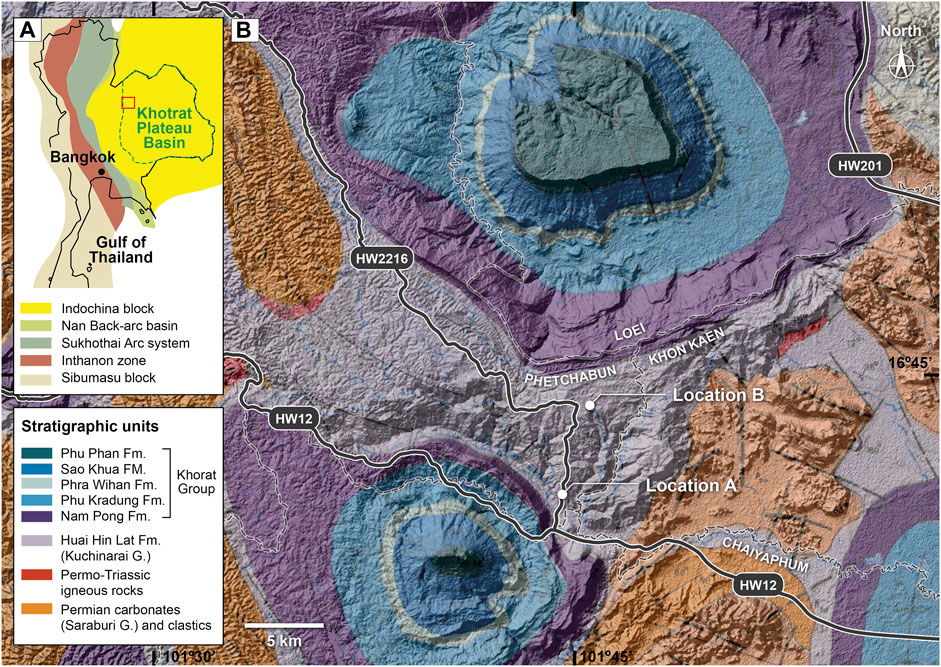
FIGURE 1. (A) Map showing the study locations in Phetchabun Province, central Thailand. (B) Geological map of the study area showing locations A and B situated in the Huai Hin Lat Formation.
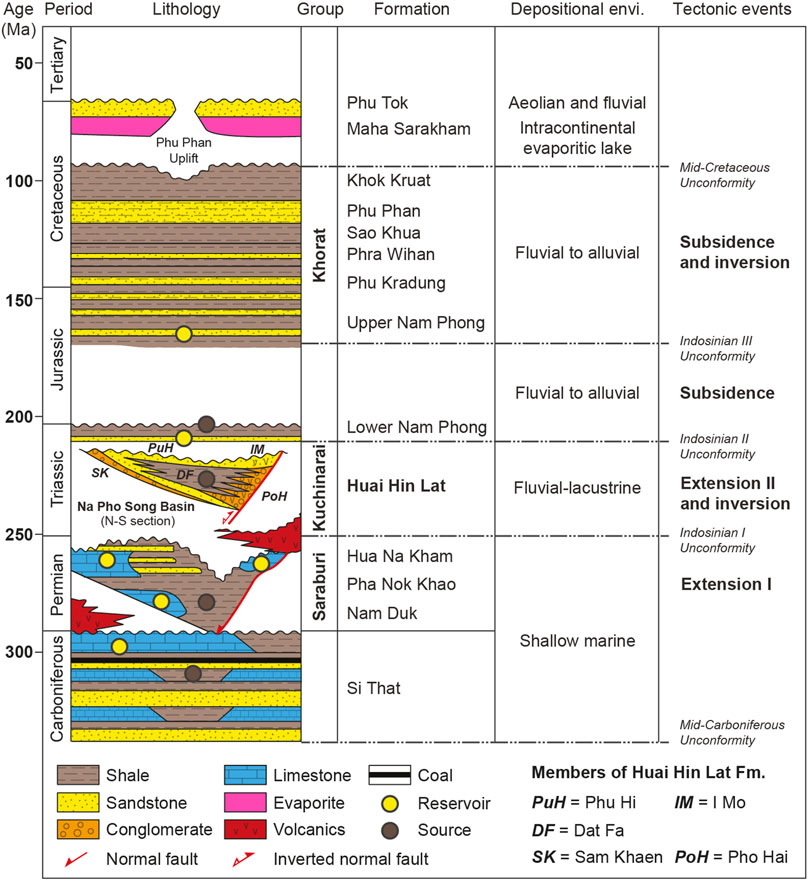
FIGURE 2. Stratigraphy of the Khorat Plateau including petroleum system elements and key events (modified from Racey, 2011).
During the Late Cretaceous to the present, several tectonic deformations in the Khorat Plateau affected the Huai Hin Lat rocks and the petroleum systems in the region including regional uplift, strike–slip faults, regional erosions, thrusts, and folds (Cooper et al., 1989; Bunopas and Vella, 1992; Mouret et al., 1993; El Tabakh et al., 1999; Morley, 2012). Consequently, the Huai Hin Lat Formation is only exposed along the western margin of the Khorat Plateau. The exposed Huai Hin Lat Formation is divided into two basins, the Na Pho Song and Sap Phlu Basins, which are located in the northwest and southwest of the Khorat Plateau, respectively (Arsairai et al., 2016). The Sap Phlu Basin is a small basin, while the Na Pho Song Basin is a larger basin and is being investigated for hydrocarbon accumulation. Hydrocarbon peak generation from the organic-rich shales of the Huai Hin Lat Formation is believed to have occurred in the Late Triassic (Kozar et al., 1992).
The Huai Hin Lat Formation is divided into two major units, the lower and upper sequences, which contain five members (Figure 2; Chonglakmani and Sattayarak, 1978). The lower sequence consists of the Pho Hai (PoH) Member and the Sam Khaen (SK) Member. The upper sequence is comprised of the Dat Fa (DF) Member, the Phu Hi (PuH) Member, and the I Mo (IM) Member. The Pho Hai Member mainly consists of volcanic rocks and some interlayers of sandstone and conglomerate. The Sam Khaen Member contains predominantly conglomerate with some intercalations of limestone beds and is normally found interfingered with sandstone and shale. The Dat Fa Member is comprised of calcareous, carbonaceous shale, and argillaceous limestone with fossils. Overlying the Dat Fa Member, the Phu Hi Member is characterized by sandstone, shale, and argillaceous limestone with some conglomerate. The I Mo Member is only exposed in some areas and consists of volcanic rocks interbedded with shale, sandstone, and limestone.
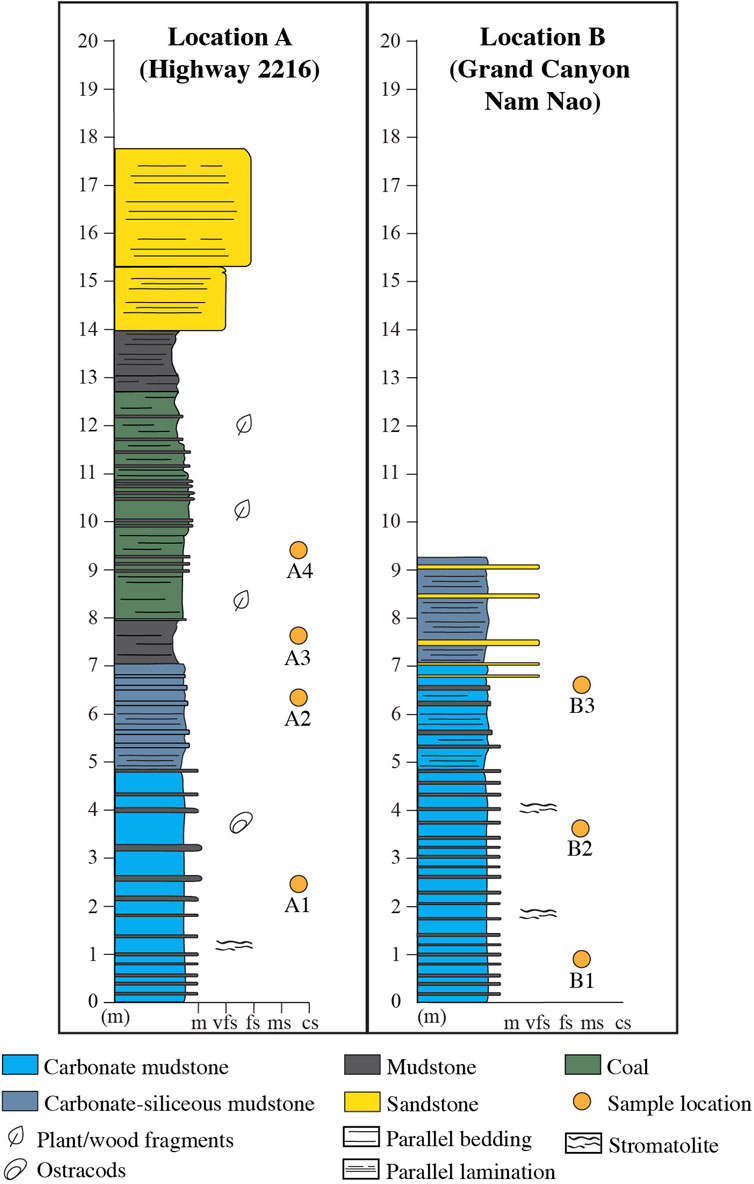
Field observations and sample collection were performed in two outcrops exposed at the top of a hill in the Na Pho Song Basin (Figure 1). The first outcrop (location A) is exposed along Highway 2216 in Phetchabun Province and mainly consists of silisiclastic rocks (Figure 1). The second outcrop (location B) is also located in the Phetchabun Province, about 7 km north of the first outcrop, and mainly consists of carbonate mudstones (Figure 1). The two outcrops belong to the Dat Fa Member based on the lithology description from Chonglakmani and Sattayarak (1978).
3 Materials and methods
A lithostratigraphic study was examined from the outcrops and hand-picked rock samples were collected to analyze the geochemical characteristics. Location A yielded a well exposed and continuous outcrop of the various lithologies. The measured section at location A was tracked through the roadside and comprises a thick (5–7 m) dark-colored mudstone interval that probably indicates organic-rich strata. The lithology from this location consists of sandstone, coaly mudstone, carbonate mudstone, and carbonate-siliceous mudstone (Figures 3A,B and Figure 4). Plant fragments and fossils were observed from the coaly mudstone strata. The carbonate mudstone from location A contains ostracods, which could be seen in hand specimens. Stromatolites were also observed in some carbonate mudstone strata at location A. Location B is located within a tourist attraction area in the Phetchabun Geopark called Grand Canyon Nam Nao. The section is well exposed along the cliff, which makes it difficult to complete the stratigraphic study (Figure 4). The lithology from location B mainly consists of carbonate mudstones with abundant stromatolites (Figures 3C,4). Minor thin sandstone and siltstone beds can be observed from this location. Seven rock samples were collected including four samples from location A and three samples from location B (Figure 4). These samples were collected by digging approximately 0.10 and 0.30 m into the outcrop to avoid the weathered parts of the samples. The remaining weathered parts were removed before crushing the samples into pieces with a hammer and a jaw-crusher. Then, the samples were ground into powder with a cleaned disc mill grinder with baked quartz sands. The glassware containing the samples and the ball mill were cleaned with dichloromethane (DCM) to ensure that all contaminants were removed.

FIGURE 3. (A) Sandstone and coaly mudstone outcrop from location A. (B) Carbonate mudstone outcrop from location A. (C) Carbonate mudstone outcrop from location B.
The sample powders (10 g each) were dried at 60 °C for 3 h. Then, they are analyzed for major oxides (i.e., SiO2, Al2O3, total-Fe2O3, K2O, Na2O, MgO, CaO, MnO, TiO2, and P2O5) using a Bruker AXS S4 Pioneer X-ray fluorescence (XRF) spectrometer at the Department of Geology, Chulalongkorn University, Thailand. This XRF analysis was operated at 60 kV/50 mA. The precession level of major oxide data was better than 0.01%. X-ray diffraction (XRD) analysis was performed at the same location using a Bruker AXS D8 advanced diffractometer equipped with a copper-target tube and operated at 40 kV and 30 mA. The sample powders were scanned from 5 to 70 ° 2θ with increments of 0.02 °. The semi-quantitative XRD analysis was based on X-ray powder diffraction and the minerals in the ICDD database were incorporated into the Bruker EVA® software. The first step was mineral identification, followed by manual scaling of the peaks of each mineral to provide the best fit to the observed XRD diffractogram. The percentage of minerals was converted from an area computation where there is a unique peak in the interval as determined using the Bruker EVA® software. The computation area is performed between two points (entry points) of the peak, which informs the position of the peak maximum and the net area of the peak.
The sample powders (100 g each) were analyzed for TOC contents by the SHIMADZU TOC analyzer using the solid sample module (SSM-5000A). The TOC measurement was conducted by Core Laboratories, Houston, United States. Inorganic carbon was removed by using hydrochloric acid (HCl) prior to the analysis. The TOC content was reported in the weight percent of organic carbon (wt%). In this study, the hydrocarbon potential source rock was assessed using TOC contents and was used to confirm the depositional environments of the samples.
The sample powders (50 g each) were analyzed by rock-Eval pyrolysis to measure the contents of free volatile/light hydrocarbons (S1) and hydrocarbon cracking from kerogen or remaining hydrocarbon potential (S2); additionally, the oxygen index (OI), hydrogen index (HI), and maximum temperature (Tmax) were measured using Rock-Eval 6 at Core Laboratories, Houston, United States. The samples were pyrolyzed in an inert atmosphere and further residual carbon was burned off in an oxidation oven. A Flame Ionization Detector (FID) was used for detection of released hydrocarbon during pyrolysis and on-line infrared detection was used to measure released CO and CO2. Pyrolysis was conducted at a temperature range of 300 °C–650 °C at a rate of 25 °C/min. Oxidation started at 300 °C and was followed by an increase of temperature up to 750 °C with a temperature gradient of 25 °C/min to burn off all residual carbon.
Bitumen is composed of complex hydrocarbons and can be extracted by organic solvents with a solid-liquid extraction technique (Tissot and Welte, 1984; Sachse et al., 2011). Bitumen extraction or extractable organic matter (EOM) is extracted from 50 g of the powdered samples using a Soxhlet apparatus for 48 h and a mixture of dichloromethane (DCM) and methanol (CH3OH) (93:7). After the extraction process was complete, the concentration of the solution was fractionated into saturated hydrocarbons, aromatic hydrocarbons, and resin by column chromatography on a silica gel. The results were recorded in parts per million (ppm). The chromatography column (50 × 2.5 cm) was cleaned using acetone and dichloromethane and then a packed silica gel of 40–370 mesh was activated for 24 h at 120 °C and capped with aluminum foil. Then, hexane was used to extract aliphatic hydrocarbon from the total hydrocarbons. A mixture of dichloromethane and hexane (7:3) was used to extract aromatic hydrocarbon. Resin was extracted using methyl alcohol. Only saturated hydrocarbon fractions or aliphatic hydrocarbon fractions were analyzed in this study.
The saturated hydrocarbon fractions of all samples were dissolved in hexanes and analyzed using Gas Chromatography-Mass Spectrometry (GC-MS) at the Scientific and Technological Research Equipment Centre (STREC), Chulalongkorn University, Thailand. The GC-MS analysis was performed on an Agilent 7000C GC/MS Triple Quad with a gas chromatograph attached directly to the ion source (70 eV ionization voltage, 100 mA filament emission current, 280 °C inlet temperature). The GC-MS temperature was programmed to start at 80 °C, increase to 310 °C at a rate of 4 °C/min, and was held at 310°C for 30 min. Chromatograms were acquired during scanning, which had a 35–700 molecular weight and were selected-ion-monitored (SIM) for compound identification and integration.
4 Results
4.1 Major mineral composition
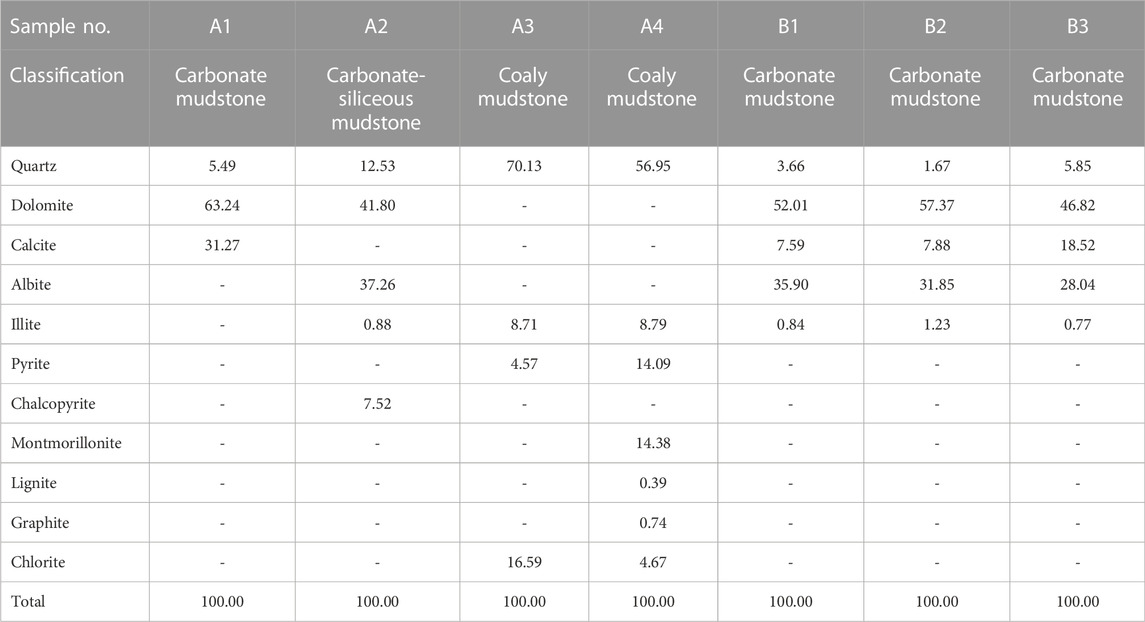
Table 1 shows the detailed mineral compositions from XRD data for the samples. The mineral components are dominated by dolomite (0–63.24 wt%, average 37.32 wt%) and quartz (1.67–70.13 wt%, average 22.33 wt%) followed by feldspar (albite) (0–37.26 wt%, average 22.18 wt%). The calcite content ranged from 0 to 31.27 wt% and averaged 9.32 wt%. Pyrite was only detected from coaly mudstone samples and ranged from 4.57 to 14.09 wt%.
To classify the rock types and brittle index, this study used a ternary diagram from Glaser et al. (2014). The ternary diagram was used to plot the mineral composition of the collected samples, where the total contents of quartz, feldspar, and mica (QFM), of calcite, dolomite, ankerite, siderite, and magnesite (Carbonates), and of kaolinite, illite, chlorite, and montmorillonite (Clays) were equal to 100%. The results show that Huai Hin Lat mudstones from both locations, A and B, are relatively rich in carbonate minerals and very poor in clay minerals (Figure 5A). The mudstone samples from Highway 2216 (location A) were divided into carbonate-rich siliceous mudstone and carbonate-dominated lithotype (Figure 5A), while the mudstone samples from Grand Canyon Nam Nao (location B) were classified as silica-rich carbonate mudstone (Figure 5A). Coaly mudstones from location A were classified as clay-rich siliceous mudstone in the diagram (Figure 5A).
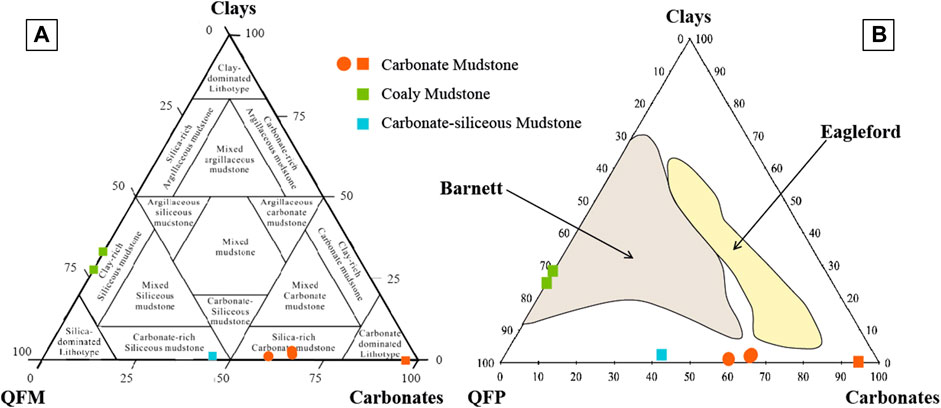
FIGURE 5. (A) Lithotype classification based on the ternary diagram of mineralogical composition from samples in the Huai Hin Lat Formation (modified after Glaser et al., 2014). (B) Mineral ternary plot comparing the Huai Hin Lat mudstones with American analogues (modified after Brindle et al., 2015). Most samples lie outside either formation but the coaly mudstones are more comparable with the Barnett formation than the Eagle Ford. The red rectangle, green rectangle, and blue rectangle represent the samples from location A, while the red dot denotes the samples from location B. Note that QFM refers to quartz, feldspar, and mica and QFP refers to quartz, feldspar, and pyrite.
The mineral composition from the ternary diagram in Figure 5B can be used to evaluate the mineral-based brittleness index (MBI). The mineral composition is a result of the burial diagenesis and is useful for hydraulic fracturing due to the existence of brittle minerals. The ternary diagram divides the mineral compositions from the samples into three major categories: clay dominated (kaolinite, illite, chlorite, and montmorillonite), silicate dominated (quartz, feldspar, and pyrite) and carbonate dominated (calcite and dolomite) (Figure 5B). As shown in the diagram, the samples were mainly classified into two groups as follows: brittle-mineral-rich mudstones and clay-rich mudstones (Figure 5B). Quartz, feldspar, pyrite calcite, and dolomite are the main brittle minerals in the samples, while the others are plastic minerals. The plastic minerals play a dominant role in coaly mudstones, which indicates that the coaly mudstones in the study area are easy to transform. The other rock samples are suitable for hydraulic fracturing based on their MBI. In addition, Figure 5B shows a comparison between the studied samples and two analogues from the United States as follows: the Eagle Ford and Barnett Formations. The coaly mudstones lie inside the Barnett Formation, while the others are not matched with the two formations.
4.2 Major element geochemistry
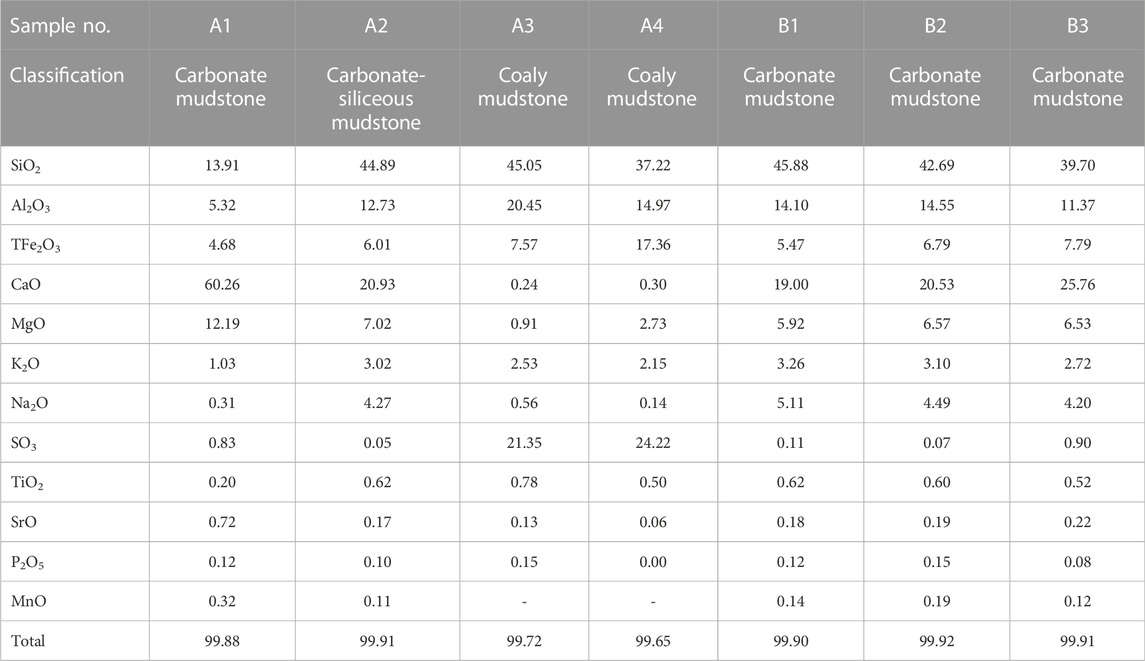
Significant variations can be observed in the major element concentrations in the samples (Table 2). SiO2 concentrations in the samples varied from 13.91 to 45.88 wt% with an average of 38.48 wt%. Wide variations was also observed in Al2O3 (5.32–20.45 wt%), CaO (0.24–60.26 wt%), MgO (0.91–12.19 wt%), and K2O content (1.03–3.26 wt%) with an averages of 13.36 wt%, 21.00 wt%, 5.98 wt%, and 2.54 wt%, respectively. The TFe2O3 (total iron) concentrations in the samples varied from 4.68 to 17.36 wt% with an average of 7.95 wt%. An anomalous high TFe2O3 content (17.36) in sample A4 may be due to pyrite occurrence (Table 1). Sodium (Na) concentrations are low in coaly mudstone samples compared to carbonate mudstones and carbonate-siliceous mudstones (Table 2). The Na contents in carbonate mudstones and carbonate-siliceous mudstones reflect the presence of plagioclase (albite) (Tables 1,2).
The most abundant elements are silicon (Si), aluminum (Al), calcium (Ca), iron (Fe), and magnesium (Mg) (Table 2). Silicon is mainly associated with quartz and clay minerals in fine-grained sediments (Fu et al., 2010a; Fu et al., 2010b; Zeng et al., 2015). Thus, the Si/(Si + Al + Fe) ratio can be used to indicate the terrigenous provenance distance in which the ratio decreases with the increasing distance (Li et al., 2018). The Si/(Si + Al + Fe) ratio of the samples varies from 0.54 to 0.71 with an average of 0.64 (Table 2), and indicates that the samples were deposited near terrigenous provenance.
4.3 Quantity of organic matter (organic carbon richness)
TOC analysis was performed to provide information on the quantity of organic matter in the rock samples. The studied samples have a high average TOC content at 5.91 wt%, which ranges from 0.91 to 20.17 wt% (Table 3). The highest TOC content appears in the coaly mudstone samples, whereas the carbonate-siliceous mudstone has the lowest TOC value of 0.91 wt% in sample A2 (Table 3). The results indicate that TOC generally exceeds the kerogen threshold of 0.2 wt% for carbonate rock and 0.5 wt% for shale necessary for the generation of hydrocarbon (Tissot and Welte, 1984; Hunt, 1995). The TOC contents from all samples suggest that samples are good to excellent petroleum source rocks based on Peters and Cassa (1994). The EOM contents of the coaly mudstone samples are significantly high and in the range of 2,939–4,127 ppm (Table 3). Other samples from both studied locations have similar values in the range of 100–200 ppm (Tables 3). All samples from both locations have poor to excellent generation potential for petroleum source rocks (Figure 6A; Tissot and Welte, 1984).
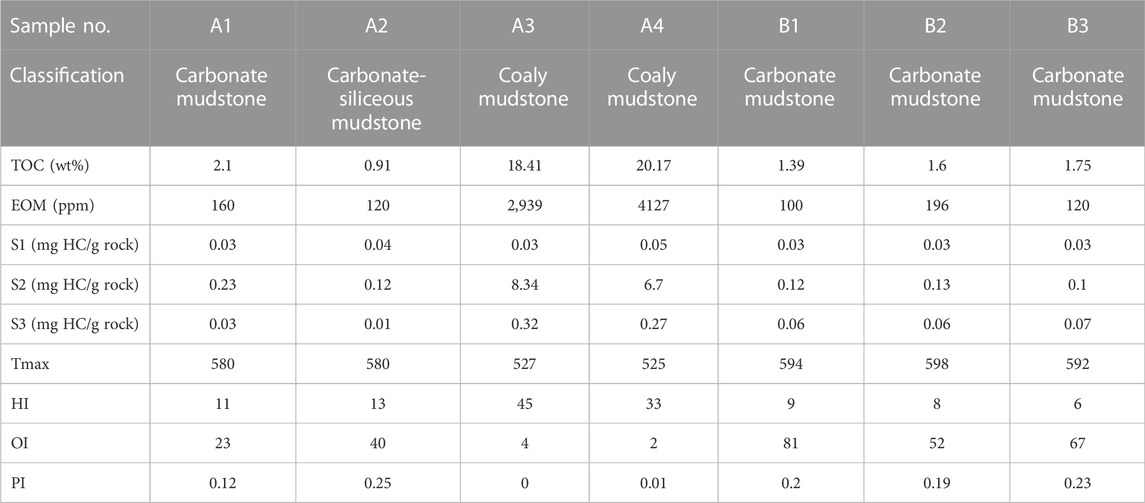
TABLE 3. Total organic carbon (TOC), extractable organic matter (EOM), and rock-Eval pyrolysis results of the samples from the Huai Hin Lat Formation. Note: S1 = free hydrocarbon from the rock sample indicates mostly light hydrocarbon and implies oil and gas, S2 = hydrocarbon cracking from kerogen or remaining hydrocarbon potential, S3 = carbon dioxide (CO2) released from pyrolyzed organic matter, Tmax = maximum temperature of S2 peak, HI = hydrogen index [(S2/TOC) x100], OI = oxygen index [(S3/TOC) x100], and PI = production index [S1/(S1+S2)].
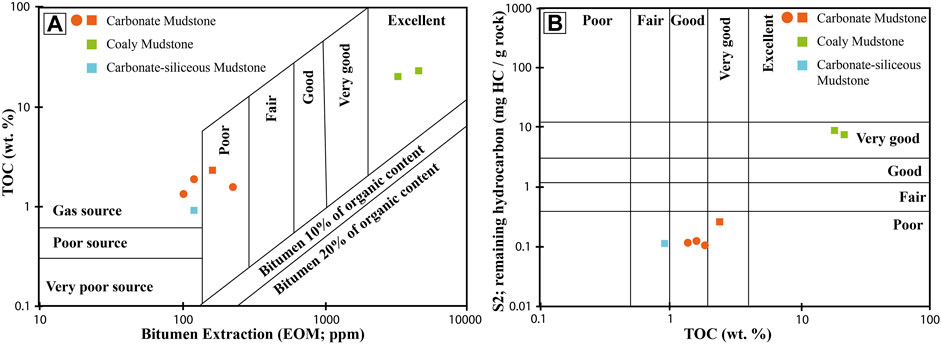
FIGURE 6. (A) Total organic carbon (TOC) and extractable organic matter (EOM) cross-plot showing the hydrocarbon generation potential of the samples. (B) Cross-plot of TOC and remaining hydrocarbon potential (S2) showing the hydrocarbon generating potential of the studied formations. The red rectangle, green rectangle, and blue rectangle represent the samples from location A, while the red dot denotes the samples from location B.
The cross-plot between TOC and EOM indicates that the hydrocarbon generation potential is poor in the carbonate mudstone samples, while the coaly mudstone has excellent hydrocarbon generation potential (Figure 6A). It should be noted that TOC and EOM contents can only be used to determine the amount of organic matter in sedimentary rock. TOC and EOM contents cannot be used to determine the types and origins of organic matter, and doing so may cause misinterpretation of the hydrocarbon potential of the samples. Thus, other parameters from pyrolysis analysis were used to support the organic facies and organic matter types of the source rocks in the study area (Table 3). Moreover, the amount of the S2 was also plotted against the TOC content to evaluate the hydrocarbon generation potential of the source rocks (Figure 6B).
The pyrolysis S1 and S2 yields were in the range of 0.03–0.05 mg HC/g rock and 0.10–8.34 mg HC/g rock, respectively (Table 3). The highest values were recorded in the coaly mudstones, where the TOC values are also high (Table 3). Generally, an S2 value lower than 4.0 mg HC/g rock indicates source rocks with poor genetic potential, while yields greater than 4.0 are known as hydrocarbon source rocks. The cross-plot between S2 and TOC shows that the coaly mudstones were classified as very good hydrocarbon potential source rocks (Figure 6B). Meanwhile, the other rock samples have fair to very good hydrocarbon generation potential. However, Erik (2016) suggested that if the S2 value is lower than 0.2 mg HC/g rock, the pyrolysis data are not reliable.
4.4 Quality of organic matter (kerogen classification)
Organic matter types can be defined by pyrolysis parameters and TOC contents for conversion to the hydrogen index (HI) and oxygen index (OI) contents, which can be plotted in the modified Van-Krevelen diagram. The HI and OI values of the samples depend on the organic matter sources and conditions during the formation deposition. High HI content can indicate that the organic matter was deposited under anoxic conditions, while high OI content is usually related to oxidized organic matter (Chenrai and Fuengfu, 2020). The relationship between HI and OI is used to classify organic matter types or kerogen types including kerogen type I, II, and III. In addition, when organic matter is post-mature or has experienced microbial biodegradation, it can turn into kerogen type IV, which has no potential for hydrocarbon generation (Tissot and Welte, 1984).
Kerogen types of the samples from the Huai Hin Lat Formation in this study were determined using the modified Van–Krevelen diagram, which suggests that the organic matter of the samples consists of type III and IV kerogens (Figure 7A). Type IV kerogen may be derived from oxidized terrestrial plants or reworked from other sources (Tissot and Welte, 1984), which were strongly degraded, either during deposition or during thermal maturation that lead to a reduction in HI values. Thus, the TOC and S2 values of the samples were plotted to confirm the kerogen types from the modified Van–Krevelen diagram (Figure 7B). The coaly mudstone samples were classified as type III kerogen, which suggests a mainly gas-prone source rock (Figure 7B). Meanwhile, the other rock samples were classified as type IV kerogen (Figure 7B).

FIGURE 7. (A) Modified van Krevelen diagram of the hydrogen index and oxygen index showing the kerogen quality of the studied samples. (B) Cross-plot of total organic carbon (TOC) and remaining hydrocarbon potential (S2) showing the quality of kerogen in the studied samples. The red rectangle, green rectangle, and blue rectangle represent the samples from location A, while the red dot denotes the samples from location B.
The HI values from this study ranged from 6 to 45 mg/g TOC with the highest values occurring in the coaly mudstone sample (Table 3). The HI values suggest that the Huai Hin Lat Formation in the study area has poor hydrocarbon generation potential based on Peters (1986). However, HI can be reduced with increasing maturity. Therefore, the low HI values of the samples from this study may be partly caused by a higher level of thermal maturity (e.g., Chenrai and Fuengfu, 2020). This is supported by the plot between HI and Tmax (Figure 8A). Based on the cross-plot in Figure 8A, the maturity level of the samples in the study area currently occurs in a post-mature stage . Meanwhile, Tmax can also be used to evaluate the maturation level of the source rock by using a production index (PI) parameter (Figure 8B). The cross-plot between PI and Tmax shows that the samples are also in a post-mature stage (Figure 8B). However, the very low PI and high Tmax from the coaly mudstone samples indicate anomalous values in the sample. The inconsistency between PI and Tmax values may be due to various possibilities such as lithology, mineral composition, uranium content, and oxidized or reworked organic matter (Gao et al., 2019; Yang and Horsfield, 2020).
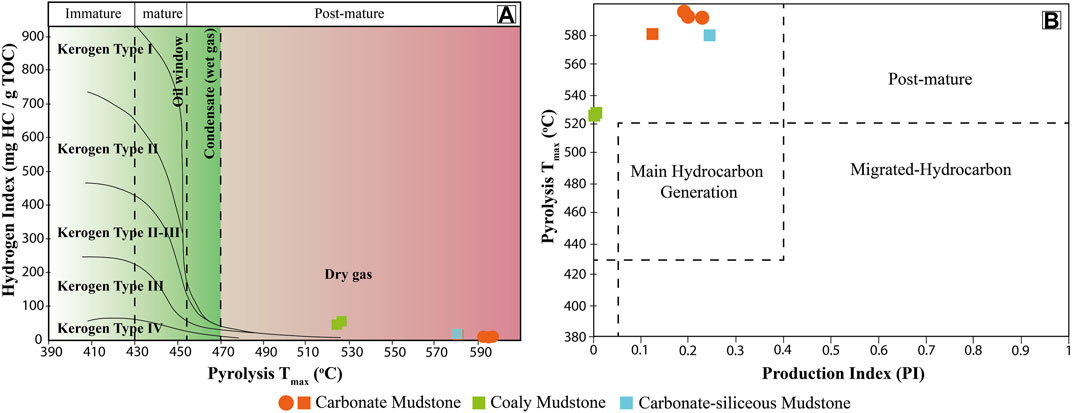
FIGURE 8. (A) Cross-plot of the hydrogen index and Tmax showing the type of kerogen and thermal maturity of the studied samples. (B) Cross-plot of Tmax and production index (PI) showing the maturation of the studied samples. The red rectangle, green rectangle, and blue rectangle represent the samples from location A, while the red dot denotes the samples from location B.
4.5 Molecular geochemistry
The organic matter type and depositional condition of the study area is complicated because TOC and pyrolysis data are poor, which is possibly due to strong maturation. In this study, the organic matter type and the depositional condition were determined using organic geochemical data such as non-biomarker and biomarker parameters. The GC–MS method was used to analyze the characteristics of the biomarker and non-biomarker parameters from the aliphatic hydrocarbon fraction (Table 4). This method can be used for the interpretation of the organic matter type, the conditions of the depositional environment, and thermal maturity.
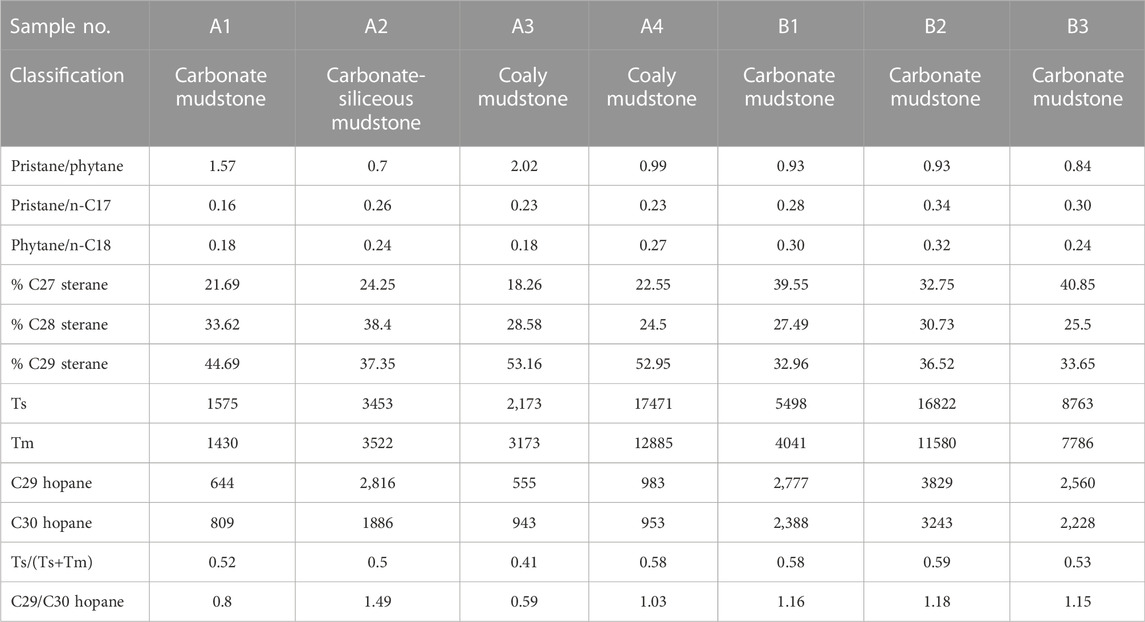
TABLE 4. The geochemical results and biomarker ratios of saturated hydrocarbon of the samples from the Huai Hin Lat Formation.
Pristane (C19H40) and phytane (C20H42) are regular isoprenoids derived from the phytol side chain of chlorophyll molecules (Miles, 1989). The phytol can be transformed into pristane under oxidizing conditions and/or into phytane under reducing conditions in the depositional environment. The pristane/phytane ratio (Pr/Ph) is used to determine the redox condition of the depositional environment and organic matter type (Powell, 1988; Chandra et al., 1994; Large and Gize, 1996). However, organic matter in a non-redox condition may report a higher Pr/Ph ratio during thermal maturity (Powell, 1988). According to Didyk et al. (1978), the Pr/Ph ratio values lower than 1.0 represented an anoxic condition associated with a hypersaline or carbonate environment, while oxic condition values higher than 3.0 indicate the prevalence of terrigenous inputs (Peters et al., 1995; Peters et al., 2005). In addition, an intermediate or suboxic condition ranges from 1.0 to 3.0 (Amane and Hideki, 1998).
The average Pr/Ph ratio of the samples is 1.14 (Table 4). The coaly mudstone samples show Pr/Ph ratios between 0.99 and 2.02 (Table 4). The other samples show lower ratios, ranging from 0.70 to 1.57 (Table 4). In addition, most carbonate mudstone samples have Pr/Ph ratios lower than 1.0, except sample A1 from location A with a Pr/Ph ratio of 1.57. Hence, the Pr/Ph ratios of the samples can indicate that the carbonate mudstones were deposited under anoxic conditions with a hypersaline environment. In contrast, the coaly mudstones were deposited under suboxic conditions.
From Figure 7A, the modified Van-Krevelen diagram is seemingly unqualified for kerogen classification in the study area due to low HI and low OI. Hence, isoprenoid/n-alkane was used for organic matter types using a pristane (Pr)/n-C17 and phytane (Ph)/n-C18 diagram (e.g., Shanmugam, 1985; Sachse et al., 2011; Alkhafaji et al., 2015). The diagram shows that organic matter from the studied samples of the Huai Hin Lat Formation is originally from a transitional and algal aquatic environment (Figure 9). Furthermore, a Pr/n-C17 and Ph/n-C18 diagram is usually used as an indicator of organic matter maturation and the level of biodegradation (Peters et al., 2007). The diagram is consistent with high organic matter content (TOC >0.5 wt%) in an anoxic to suboxic environment, which is supported by the Pr/Ph ratios (Table 4; Figure 9).
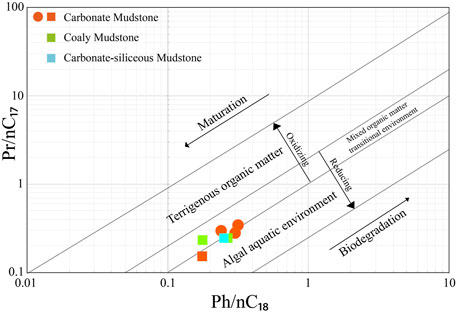
FIGURE 9. Plot of pristane/n-C17 (Pr ∕n-C17) versus phytane/n-C18 (Ph/n-C18) for the samples from the Huai Hin Lat Formation. The red rectangle, green rectangle, and blue rectangle represent the samples from location A, while the red dot denotes the samples from location B.
The regular sterane distribution can indicate organic matter sources within sedimentary rocks and can be divided into three groups as follows: C27, C28, and C29. C27 regular sterane indicates a marine plankton influence, C28 regular sterane can be formed in a freshwater lacustrine environment associated with yeast, fungi, plankton, and algae, and C29 regular sterane indicates higher terrestrial plants associated with brown and green algae (Volkman, 1986). However, C29 regular sterane can also be derived from microalgae or cyanobacteria (Volkman and Maxwell, 1986). In addition, some C27 and C28 regular steranes might be derived from planktonic and/or algal freshwater inputs (Volkman and Maxwell, 1986). The relative amounts of C27, C28, and C29 regular steranes were converted to relative percentages and plotted in a ternary diagram as presented in Figure 10.
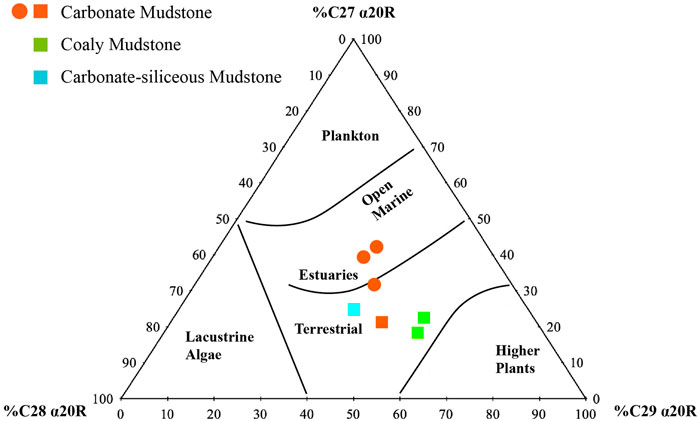
FIGURE 10. Ternary diagram of relative abundance of C27, C28, and C29 regular steranes showing the sources and depositional environments of the samples from the Huai Hin Lat Formation. The red rectangle, green rectangle, and blue rectangle represent the samples from location A, while the red dot denotes the samples from location B.
In this study, a predominance of C29 regular sterane over C28 and C27 regular steranes was clearly shown in the coaly mudstone samples (Table 4; Figure 10). Meanwhile, other samples included a mix of various organic matter sources. The results from the diagram can be distinguished between samples from location A and B. Location A is dominated by a terrestrial organic source or higher plants, while location B is dominated by plankton from an aquatic environment. Also, the sedimentary facies change from siliciclastic sediments in location A to carbonate sediments in location B. Thus, the studied section gradually changes from a shallow (location A) to deep (location B) water environment.
Carbonate source rocks usually show a predominance of C29-hopane (norhopane) over C30-hopane (hopane) with C29/C30 hopane ratios above 1. In contrast, mudstone source rocks show a predominance of C30-hopane over C29-hopane with C29/C30 hopane ratios mostly below 1 (Alimi, 2017). The biomarker analysis from the samples reveals that the C29/C30 hopane ratios are generally more than 0.80, except for coaly mudstone (A3) with a ratio of 0.59. These ratios suggest that C29-hopane is slightly higher than C30-hopane and indicates that carbonate source rocks predominantly occur in the study area (Waples and Machihara 1991; Alimi, 2017).
Ts (C27 18α (H)-22,29,30-trisnorneohopanes) and Tm (C27 17α (H)-22,29,30-trisnorhopane) can be used for the thermal maturation and lithology of the source rocks using the Ts/(Ts+Tm) ratio (Bordenav et al., 1993). During catagenesis of petroleum generation, Tm is less stable than Ts (Bordenav et al., 1993). Organic source rock is mature when the values of the Ts/(Ts+Tm) ratio are between 0.35 and 0.95 (Peters et al., 2007). In addition, the Ts/Ts+Tm ratio may also be influenced by the variation in lithology in which carbonate source rock is significantly lower than mudstone source rocks (Waples and Machihara, 1991; Bordenav et al., 1993; Peters and Moldowan, 1993; Sherifa and Reza, 2018). In this study, all samples occur in the range of 0.41–0.59 with a mean value of 0.53, which indicates that the organic matter is currently in a mature stage (Table 4). The results of the Ts/(Ts+Tm) ratios in this study correspond with the Tmax data.
5 Discussion
5.1 Shale gas exploration implications
The results of the isoprenoid ratio, isoprenoid/n-alkane, and regular sterane suggest that the organic matter accumulated in a mixed aquatic–terrigenous environment (Table 4; Figures 9,10). The samples in the study area show relatively high TOC values and are classified as type III kerogen, which suggests more gas-prone generation. The geochemical data in this study indicates that the samples have experienced high maturation resulting from the complex tectonic events in the area. Nevertheless, one or more locations in this region could meet conditions that place the Huai Hin Lat Formation as an active source rock.
Previous hydrocarbon exploration activities in the Huai Hin Lat Formation have primarily focused on shale source rocks (Arsairai et al., 2016; Phujareanchaiwon et al., 2021; Arsairai et al., 2022). However, the preliminary results of this study indicate that the carbonate mudstones of the Huai Hin Lat Formation are also a potential petroleum source rock. This important finding will be beneficial for potential prospects and exploration targets in the study area, where the known Huai Hin Lat strata entered the peak oil window in the Late Triassic (Kozar et al., 1992). The geochemical results of the Huai Hin Lat source rock suggest good source rock properties, which have a high brittleness index (Figure 5B). In terms of mineral composition, the samples show ultra-high carbonate and quartz contents, which indicates their high fracability and good hydraulic fracturing potential. Therefore, the carbonate mudstone source rocks offer guidance for potential shale gas prospects. Moreover, the biomarker parameters and depositional environment indicators presented and discussed in this study are also useful for future petroleum exploration in the study area.
5.2 Geological CO2 storage implications
Generally, CO2 can be captured and stored in geological formations and structures with various trapping mechanisms such as depleted gas reservoirs, saline aquifers, and coal bed methane. However, enhanced oil recovery (EOR) and enhanced gas recovery (EGR) techniques can be used to increase the rate and volume of oil and gas recovered from conventional and unconventional reservoirs (Khosrokhavar et al., 2014; Sherifa and Reza, 2018; Goodman et al., 2021). These techniques require the injection of fluid, such as water, natural gas, and CO2, into conventional reservoirs or hydraulic fractured reservoirs. Thus, CO2 can be stored in shale gas through sorption onto organic matter and clay minerals with the displacement of natural gas by injected CO2 (Metz et al., 2005; Goodman et al., 2021). The benefits of CO2 injection into unconventional shale reservoirs are as follows: 1) a reduction in the cost of the injected fluid, 2) an acceleration of the displacement rate due to higher density compared with methane, and 3) higher sorption capacities in organic matter compared to methane. Moreover, CO2 injection is estimated to enhance gas production by up to 7% in the Marcellus Shale in the United States (Godec et al., 2013). Goodman et al. (2021) recommended methane-bearing shale with a TOC content over 2.0 wt% for good geological CO2 storage by hydraulic fracturing.
The TOC contents of the Huai Hin Lat Formation in this study demonstrate that the coaly mudstone samples are a suitable geological CO2 storage area with current methane generation. The carbonate mudstones have good TOC ranging from 1.39 to 2.1 wt% and are a secondary target due to the uncertainty of methane generation. The relatively lower TOC content in the carbonate mudstone samples is possibly due to the presence of carbonate minerals and relatively high-water depth far from organic matter sources. Moreover, the Huai Hin Lat Formation is expected to be widely extensive and have a high thickness due deposition in a large lake environment or an aquatic depositional environment. Since the study area is dominated by carbonate-siliceous mudstone and carbonate mudstone, the geochemical reaction between the shale reservoir and acidified water during CO2 injection needs to be further studied.
6 Conclusion
In this study, field observations, mineralogical data, and geochemical data from the Huai Hin Lat Formation were used to interpret organic matter sources and depositional conditions and environments, and shale gas play and the geological CO2 storage potential of the formation were assessed. The samples can be classified as coaly mudstone, carbonate-siliceous mudstone, and carbonate mudstone. The samples suggest poor to excellent generation potential for hydrocarbon source rock with type III kerogen. The geochemical studies indicate that the studied samples are currently at the post-mature stage. The organic matter is typical of higher terrestrial plants with a minor algae input. The depositional environment indicates that the Huai Hin Lat Formation occurs in anoxic to suboxic conditions in an aquatic depositional environment. The mineral composition and brittleness index of the mudstone samples suggest a good hydraulic fracture candidate. The formation is suitable for geological CO2 storage, which may reduce CO2 during petroleum production and increase the production rate.
Data availability statement
The original contributions presented in this study are included in the article/Supplementary Material, and further inquiries can be directed to the corresponding authors.
Author contributions
PiC was responsible for the preparation, creation, and writing of the initial manuscript draft. TA conducted the geochemical analysis and prepared the manuscript. SJ was responsible for reviewing and editing the draft. PaC conducted the geochemical analysis.
Funding
This research was funded by the Thailand Science Research and Innovation Fund, Chulalongkorn University (DIS66230012).
Conflict of interest
The authors declare that the research was conducted in the absence of any commercial or financial relationships that could be construed as a potential conflict of interest.
Publisher’s note
All claims expressed in this article are solely those of the authors and do not necessarily represent those of their affiliated organizations, or those of the publisher, the editors, and the reviewers. Any product that may be evaluated in this article, or claim that may be made by its manufacturer, is not guaranteed or endorsed by the publisher.
References
Alimi, H. (2017). Characterization of carbonate source-derived hydrocarbons using advanced geochemical technologies. J. Sustain. energy Engng. 5 (2), 163–173. doi:10.7569/jsee.2017.629510
Alkhafaji, M. W., Aljubouri, Z. A., Aldobouni, I. A., and Littke, R. (2015). Hydrocarbon potential of Ordovician–Silurian successions in Akkas field, Western desert of Iraq. Am. Assoc. Pet. Geol. Bull. 9, 617–637. doi:10.1306/10221413197
Amane, W., and Hideki, N. (1998). Geochemical characteristics of terrigenous and marine sourced oils in Hokkaido, Japan. Org. Geochem. 28, 27–41. doi:10.1016/s0146-6380(97)00102-2
Arsairai, B., Feng, Q., Chonglakmani, C., and Glumglomjit, S. (2022). Source rock potential assessment of the Huai Hin Lat Formation, Sap Phlu Basin, nakhon ratchasima Province, northeastern Thailand. Acta Geochim. doi:10.1007/s11631-022-00569-4
Arsairai, B., Wannakomol, A., Feng, Q., and Chonglakmani, C. (2016). Paleoproductivity and paleoredox condition of the Huai Hin Lat Formation in northeastern Thailand. J. Earth Sci. 27 (3), 350–364. doi:10.1007/s12583-016-0666-8
Barber, A. J., Ridd, M. F., and Crow, M. J. (2011). The origin, movement and assembly of the pre-tertiary tectonic units of Thailand. London: Geological Society of London.
Booth, J., and Sattayarak, N. (2011). Subsurface carboniferous-cretaceous geology of northeast Thailand. London: Geological Society of London.
Bordenave, M. L., Espitalie, J., Leplat, P., Oudin, J. L., and Vendenbroucke, M. (1993). “Screening techniques for source rock evaluation,” in Applied petroleum geochemistry editions. Editor M. L. Bordenave (Paris: Technip), 237–255.
Brindle, S., O'Connor, D., Windmill, R., Wellsbury, P., Oliver, G., Spence, G., et al. (2015). An integrated approach to unconventional resource play reservoir characterization, Thistleton-1 case study, NW England. First Break 33 (2). doi:10.3997/1365-2397.33.2.79272
Bunopas, S., and Vella, P. (1992). “Geotectonics and geologic evolution of Thailand,” in Proceedings of the national conference on geologic resources of Thailand: potential for future development, Bangkok, Thailand, November 17 - 24, 1992.
Chandra, K., Mishra, C. S., Samanta, U., Gupta, A., and Mehrotra, K. L. (1994). Correlation of different maturity parameters in the Ahmedabad-Mehsana block of the Cambay basin. Org. Geochem. 21 (3-4), 313–321. doi:10.1016/0146-6380(94)90193-7
Chenrai, P., and Fuengfu, S. (2020). Organic geochemistry of the lower permian tak Fa Formation in Phetchabun Province, Thailand: Implications for its paleoenvironment and hydrocarbon generation potential. Acta Geochim. 39 (3), 291–306. doi:10.1007/s11631-019-00370-w
Chitnarin, A., Kershaw, K., Promduang, A., and Tepnarong, P. (2022). Late triassic freshwater conchostracan, ostracods, and stromatolites from Huai Hin Lat Formation, northeastern Thailand. Thai Geosci. J. 3 (3), 32–50.
Chonglakmani, C., and Sattayarak, N. (1978). “Stratigraphy of the Huai Hin Lat Formation (upper triassic) in northeastern Thailand,” in Proceedings of the regional conference on geology and mineral resources of southeast Asia, Thailand, November 14-18, 1978.
Choong, C. M., Pubellier, M., Sautter, B., and Gebretsadik, H. T. (2022). Records of the oceanic propagator closure at the southern splay of the Palaeo-Tethys. Geol. J. 57, 3881–3915. doi:10.1002/gj.4520
Cooper, M. A., Herbert, R., and Hill, G. S. (1989). “The structural evolution of Triassic intermontane basins in northeastern Thailand,” in Proceedings of the international symposium on intermontane basins: geology and resources, Thailand, 30 January-2 February 1989.
Didyk, B. M., Simoneit, B. R. T., Brassell, S. T., and Eglinton, G. (1978). Organic geochemical indicators of palaeoenvironmental conditions of sedimentation. Nature 272 (5650), 216–222. doi:10.1038/272216a0
Drumm, A., Heggemann, H., and Helmcke, D. (1993). “Contribution of sedimentology and sediment petrology of the non-marine Mesozoic sediments in northern Thailand (Phrae and Nan provinces),” in Proceedings of the international symposium on biostratigraphy of mainland southeast Asia: facies & paleontology, Chiang Mai, Thailand, 31 January - 5 February 1993.
El Tabakh, M., Utha-Aroon, C., and Schreiber, B. C. (1999). Sedimentology of the cretaceous maha sarakham evaporites in the khorat plateau of northeastern Thailand. Sediment. Geol. 123 (1-2), 31–62. doi:10.1016/s0037-0738(98)00083-9
Erik, N. Y. (2016). Paleoenvironment characteristics and hydrocarbon potential of the lower miocene bituminous shales in sivas basin (central anatolia, Turkey). Arab. J. Geosci. 9 (1), 18. doi:10.1007/s12517-015-2063-5
Fu, X., Wang, J., Zeng, Y., Tan, F., Chen, W., and Feng, X. (2010a). Geochemistry of rare Earth elements in marine oil shale - a case study from the Bilong Co area, Northern Tibet, China. Oil Shale 27, 194–208. doi:10.3176/oil.2010.3.02
Fu, X., Wang, J., Zeng, Y., Tan, F., and Feng, X. (2010b). REE geochemistry of marine oil shale from the Changshe Mountain area, northern Tibet, China. Int. J. Coal Geol. 81, 191–199. doi:10.1016/j.coal.2009.12.006
Gao, X., Wang, P., Li, J., Wang, M., and Ma, W. (2019). Influencing factors of the Tmax parameter in rock-eval pyrolysisIOP conference series: Environ. IOP Conf. Ser. Earth Environ. Sci. 360 (1), 012011. doi:10.1088/1755-1315/360/1/012011
Glaser, K. S., Miller, C. K., Johnson, G. M., Kleinberg, R. L., and Pennington, W. D. (2014). Seeking the sweet spot: Reservoir and completion quality in organic shales. Oilfield Rev. 25, 16–29.
Godec, M., Koperna, G., Petrusak, R., and Oudinot, A. (2013). Potential for enhanced gas recovery and CO2 storage in the Marcellus Shale in the Eastern United States. Int. J. Coal Geol. 118, 95–104. doi:10.1016/j.coal.2013.05.007
Goodman, A., Kutchko, B., Sanguinito, S., Natesakhawat, S., Cvetic, P., Haljasmaa, I., et al. (2021). Reactivity of CO2 with utica, Marcellus, Barnett, and Eagle Ford shales and impact on permeability. Energy fuels. 35 (19), 15894–15917. doi:10.1021/acs.energyfuels.1c01995
Hazra, B., Vishal, V., Sethi, C., and Chandra, D. (2022). Impact of supercritical CO2 on shale reservoirs and its implication for CO2 sequestration. Energy fuels. 36 (17), 9882–9903. doi:10.1021/acs.energyfuels.2c01894
He, W., Sun, Y., and Shan, X. (2021). Geochemical characteristics of the lower cretaceous hengtongshan Formation in the tonghua basin, northeast China: Implications for depositional environment and shale oil potential evaluation. Appl. Sci. (Basel). 11, 23. doi:10.3390/app11010023
Hunt, J. M. (1995). “Depositional environment and shale oil potential evaluation,” in Petroleum geochemistry and geology. 2nd edition (New York: W.H. Freeman and Company), 23.
Khosrokhavar, R., Griffiths, S., and Wolf, K. H. (2014). Shale gas formations and their potential for carbon storage: Opportunities and outlook. Environ. Process. 1, 595–611. doi:10.1007/s40710-014-0036-4
Kozar, M. G., Crandall, G. F., and Hall, S. E. (1992). “Integrated structural and stratigraphic study of the khorat basin, ratburi limestone (permian), Thailand,” in Proceedings of a national conference on geologic resources of Thailand: potential for future development, Bangkok, 17–24 November 1992.
Large, D. J., and Gize, A. P. (1996). Pristane/phytane ratios in the mineralized Kupferschiefer of the Fore-Sudetic Monocline, southwest Poland. Ore Geol. Rev. 11 (1-3), 89–103. doi:10.1016/0169-1368(95)00017-8
Li, D., Li, R., Xue, T., Wang, B., Liu, F., Zhao, B., et al. (2018). Characteristic and geological implications of major elements and rare Earth elements of Triassic Chang 7 oil shale in Tongchuan City, Southern Ordos Basin (China). Minerals 8 (4), 157. doi:10.3390/min8040157
Metcalfe, I. (2011). Palaeozoic–mesozoic history of SE asia. Geol. Soc. Lond. Spec. Publ. 355 (1), 7–35. doi:10.1144/sp355.2
Metcalfe, I. (1996). Pre-Cretaceous evolution of SE Asian terranes. Geol. Soc. Lond. Spec. Publ. 106, 97–122. doi:10.1144/gsl.sp.1996.106.01.09
Metz, B., Davidson, O., and De Coninck, H. (2005). Carbon dioxide capture and storage: Special report of the intergovernmental panel on climate change. Cambridge: Cambridge University Press.
Morley, C. K., Ampaiwan, P., Thanudamrong, S., Kuenphan, N., and Warren, J. (2013). Development of the Khao Khwang fold and thrust belt: Implications for the geodynamic setting of Thailand and Cambodia during the Indosinian orogeny. J. Asian Earth Sci. 62, 705–719. doi:10.1016/j.jseaes.2012.11.021
Morley, C. K. (2012). Late cretaceous–Early palaeogene tectonic development of SE Asia. Earth. Sci. Rev. 115 (1-2), 37–75. doi:10.1016/j.earscirev.2012.08.002
Mouret, C., Heggemann, H., Gouadain, J., and Krisadasima, S. (1993). “Geological history of the siliciclastic Mesozoic strata of the Khorat group in the Phu Phan range area, northeastern Thailand,” in Proceedings of the international symposium on biostratigraphy of main-land Southeast Asia: facies and paleontology, Thailand, 31 January - 5 February, 1993.
Peters, K. E., and Cassa, M. R. (1994). “Applied source rock geochemistry,” in The petroleum system from source to trap. Editors L. B. Magoon, and W. G. Dow (Tulsa: American Association of Petroleum Geologists).
Peters, K. E., Clark, M. E., Das Gupta, U., McCaffrey, M. A., and Lee, C. Y. (1995). Recognition of an Infracambrian source rock based on biomarkers in the Baghewala-1 oil, India. AAPG Bull. 79 (10), 1481–1493.
Peters, K. E. (1986). Guidelines for evaluating petroleum source rock using programmed pyrolysis. AAPG Bull. 70, 318–329.
Peters, K. E., and Moldowan, J. M. (1993). The biomarker guide: Interpreting molecular fossils in petroleum and ancient sediments. New Jersey: Prentice-Hall.
Peters, K. E., Moldowan, J. M., and Walters, C. C. (2007). The biomarker guide: Biomarkers and isotopes in petroleum systems and earth history. Cambridge: Cambridge University Press.
Peters, K. E., Peters, K. E., Walters, C. C., and Moldowan, J. M. (2005). The biomarker guide: Biomarkers and isotopes in the environment and human history. Cambridge: Cambridge University Press.
Phujareanchaiwon, C., Chenrai, P., and Laitrakull, K. (2021). Interpretation and reconstruction of depositional environment and petroleum source rock using outcrop gamma-ray log spectrometry from the Huai Hin Lat Formation, Thailand. Front. Earth Sci. 9, 638862. doi:10.3389/feart.2021.638862
Powell, T. G. (1988). Pristane/phytane ratio as environmental indicator. Nature 333 (6174), 604. doi:10.1038/333604a0
Pranesh, V. (2018). Subsurface CO2 storage estimation in Bakken tight oil and Eagle Ford shale gas condensate reservoirs by retention mechanism. Fuel 215, 580–591. doi:10.1016/j.fuel.2017.11.049
Sachse, V. F., Littke, R., Heim, S., Kluth, O., Schober, J., Boutib, L., et al. (2011). Petroleum source rocks of the Tarfaya Basin and adjacent areas, Morocco. Org. Geochem. 42 (3), 209–227. doi:10.1016/j.orggeochem.2010.12.004
Sattayarak, N., Srilulwong, S., and Pum-Im, S. (1989). “Petroleum potential of the triassic pre-khorat intermontane basin in northeastern Thailand,” in Proceeding of the international symposium on intermontane basins: geology and resources, Thailand, 30 January-2 February, 1989.
Shanmugam, G. (1985). Significance of coniferous rain forests and related organic matter in generating commercial quantities of oil, Gippsland Basin, Australia. AAPG Bull. 69, 1241–1254.
Sherifa, C., and Reza, B. (2018). Carbon dioxide utilization and sequestration in kerogen nanopores. New Jersey: Utilization and Sequestration.
Tissot, B. P., and Welte, D. H. (1984). Petroleum formation and occurrence. Berlin: Springer-Verlag.
Volkman, J. K. (1986). A review of sterol markers for marine and terrigenous organic matter. Org. Geochem. 9 (2), 83–99. doi:10.1016/0146-6380(86)90089-6
Volkman, J. K., and Maxwell, J. R. (1986). Acyclic isoprenoids as biological markers. Methods Geochem. Geophys. 24, 1–42.
Waples, D. W., and Machihara, T. (1991). Biomarkers for geologist. AAPG methods in exploration series. Tulsa: American Association of petroleum Geologists.
Yang, H., Shi, X., Luo, C., Wu, W., Li, Y., He, Y., et al. (2021). Mineral composition of prospective section of Wufeng-Longmaxi shale in Luzhou shale play, Sichuan Basin. Minerals 12 (1), 20. doi:10.3390/min12010020
Yang, S., and Horsfield, B. (2020). Critical review of the uncertainty of Tmax in revealing the thermal maturity of organic matter in sedimentary rocks. Int. J. Coal Geol. 225, 103500. doi:10.1016/j.coal.2020.103500
Zeng, S., Wang, J., Fu, X., Chen, W., Feng, X., Wang, D., et al. (2015). Geochemical characteristics, redox conditions, and organic matter accumulation of marine oil shale from the Changliang Mountain area, northern Tibet, China. Mar. Pet. Geol. 64, 203–221. doi:10.1016/j.marpetgeo.2015.02.031
Keywords: Khorat Plateau, carbon storage, biomarker, source rock, shale gas
Citation: Chenrai P, Assawincharoenkij T, Jitmahantakul S and Chaiseanwang P (2022) Geochemical characteristics of shale gas formation and the potential for carbon storage in Thailand: An example from the Triassic Huai Hin Lat Formation. Front. Earth Sci. 10:1085869. doi: 10.3389/feart.2022.1085869
Received: 31 October 2022; Accepted: 02 December 2022;
Published: 21 December 2022.
Edited by:
Paula Alexandra Gonçalves, Institute of Earth Science, PortugalReviewed by:
Xiugen Fu, Southwest Petroleum University, ChinaBodhisatwa Hazra, Central Institute of Mining and Fuel Research, India
Copyright © 2022 Chenrai, Assawincharoenkij, Jitmahantakul and Chaiseanwang. This is an open-access article distributed under the terms of the Creative Commons Attribution License (CC BY). The use, distribution or reproduction in other forums is permitted, provided the original author(s) and the copyright owner(s) are credited and that the original publication in this journal is cited, in accordance with accepted academic practice. No use, distribution or reproduction is permitted which does not comply with these terms.
*Correspondence: Piyaphong Chenrai, cGl5YXBob25nLmNAY2h1bGEuYWMudGg=; Thitiphan Assawincharoenkij, VGhpdGlwaGFuLkFAY2h1bGEuYWMudGg=
 Piyaphong Chenrai
 Thitiphan Assawincharoenkij
 Sukonmeth Jitmahantakul
 Patthapong Chaiseanwang