 Jorrit van der Schot1*
 Jakob Abermann1
 Tiago Silva1†Caroline Drost Jensen2
 Brice Noël3
 Wolfgang Schöner1,4
- 1Institute of Geography and Regional Science, University of Graz, Graz, Austria
- 2Danish Meteorological Institute, Copenhagen, Denmark
- 3Institute for Marine and Atmospheric Research, Utrecht University, Utrecht, Netherlands
- 4Austrian Polar Research Institute, Vienna, Austria
Along with Arctic warming, climate models project a strong increase in Arctic precipitation in the 21st century as well as an increase in the ratio of liquid to total precipitation. In the precipitation-rich region of south-east Greenland, precipitation changes could locally have significant impacts on runoff. However, climate data are sparse in this remote region. This study focuses on improving our understanding of the past precipitation changes on Ammassalik island in south-east Greenland between 1958 and 2021. To assess past changes in air temperature at 2-meter and precipitation, output from a regional polar climate model (RACMO2.3p2) is evaluated with measurements from automatic weather stations in Tasiilaq and on Mittivakkat glacier. In addition, RACMO2.3p2 is used to assess past seasonal changes in air temperature at 2-meter, precipitation amount, precipitation phase and the altitude of the rain/snow boundary. We find that the climate model accurately represents the monthly average observed air temperature at 2-meter. While total precipitation is overestimated, interannual variability of precipitation is properly captured. We report a significant increase of summer temperature at 2-meter of +0.3°C/decade (p<0.01) at Mittivakkat glacier and +0.2°C/decade (p<0.01) in Tasiilaq in 1958–2021. For the subperiod 1990–2019, the trend in annual averages of temperature at 2-meter in Tasiilaq (+0.8°C/decade, p=0.02) corresponds well to known temperature trends on the Greenland Ice Sheet within the same period. On Mittivakkat glacier a significant trend is not detected within this subperiod (+0.2°C/decade, p=0.25). The modelled liquid precipitation ratio on Ammassalik island increased in all summer months (1958–2015) by +2.0/+1.9/+1.8%/decade in June/July/August respectively. In July and August, these trends were stronger at higher elevations. No statistical evidence is found for trends in other seasons. We also identify monthly increases in the altitude of the rain-to-snow boundary (+25/+23/+20 m/decade in July/August/September respectively).
1 Introduction
1.1 Scope
The increase in air temperature in the Arctic region occurs nearly four times as fast as the global average over recent decades (Rantanen et al., 2021). An ensemble of climate models (CMIP6) projects continued 21st century Arctic warming more than double that of the global mean (Cai et al., 2021). Along with air temperature, precipitation is projected to increase due to changes in surface evaporation, atmospheric water vapor content and moisture transport that influences precipitation rates (Bintanja and Andry, 2017; McCrystall et al., 2021). The increase in precipitation with surface air temperature is also considerably higher in the Arctic (4.5%/°C) compared to the global average (1.6–1.9%/°C) (Bintanja and Selten, 2014; Bintanja and Andry, 2017). In addition, global climate models project an increase in the ratio of liquid to total precipitation in the Arctic as more precipitation is expected to fall as liquid precipitation with higher air temperatures. In recent decades, increases in temperature and liquid precipitation have been found in Greenland (Hanna et al., 2020; Niwano et al., 2021; Huai et al., 2022). Average air temperatures in Greenland have increased in the period 1991–2019 by 4.4°C in winter, 2.7°C in spring and 1.7°C in summer (Hanna et al., 2020). This increase has partly been attributed to increasing frequency and intensity of Greenlandic atmospheric blocking events since the 1990s (Delhasse et al., 2020; Hanna et al., 2020). On the Greenland Ice Sheet (GrIS), average annual rainfall increased by 25% in the last decade (2010–2019) compared to the 1981–2010 reference period (Niwano et al., 2021).
In this study we make a detailed assessment of past climatic changes on Ammassalik island, located on the south-east coast of Greenland. Assessing precipitation trends in south-east Greenland is particularly relevant because it receives the highest amounts of precipitation compared to other regions in Greenland (Berdahl et al., 2018). Additionally, there are many small glaciers and ice caps (GIC) located on the island. GICs in Greenland are known to be particularly sensitive to the ongoing atmospheric changes (Bjørk et al., 2012; Noël et al., 2017; Khan et al., 2022). Another advantage of Ammassalik island is that it has a unique coverage and quality of a network of automatic weather stations (AWS), compared to other places in Greenland. While these observations provide essential information about the local climate, the challenges of observing precipitation in remote (Arctic) regions should be considered. One difficulty is that maintenance of weather stations is expensive and labor-intensive, which can lead to extended gaps in the observed time series. Additionally, there are several environmental factors that strongly impact the robustness of measurements from precipitation gauges. Wind-induced undercatch is particularly relevant in the Ammassalik island, due to the complex topography and characteristic strong winds present in the region. Wetting and evaporating losses contribute to systematic underestimation (Yang et al., 1999). Since systematic errors regarding solid precipitation are greater than those for liquid precipitation, precipitation measurements are more accurate in the summer season. In this study we combine a regional climate model with AWS observations. The model data helps to bridge the gap of sparse observational data. We cross-check these two data sources and use them to provide a more complete perspective on climate (and in particular, precipitation) trends at Ammassalik island.
1.2 Geographical description of the study region
Ammassalik island (65.73 °N, 37.62 ′W) is located on the south-east coast of Greenland, just south of the Arctic circle and covers approximately 772 km2 (Figure 1). Tasiilaq is the largest settlement (1913 inhabitants (per 1 January 2022) (StatBank Greenland, 2022) and is located on the south side of the island. The west coast of Ammassalik island borders the Sermilik fjord (10–15 km wide, 85 km long), which separates the island from the mainland and connects the GrIS with the Irminger Sea (S. H. Mernild, Malmros, et al., 2012). The distance between the GrIS and the Ammassalik region is about 40 km. In the east, the Ammassalik islands borders the Denmark Strait, which separates Greenland and Iceland. This area is of climatological importance, since it is the thermodynamic transition zone between the North Atlantic Ocean and the Arctic Ocean (Mernild S. et al., 2012). The Ammassalik region is characterized by strong alpine relief in the eastern part of the island (Mernild et al., 2006), where altitudes can reach approximately 1,000 m a.s.l. Mittivakkat glacier is the largest and the most studied glacier across the island. In a study of climate conditions in the Mittivakkat glacier catchment, temperature at 2-meter (T2m), wind speed, relative humidity and summer precipitation were shown to be increasing, whereas winter precipitation and total annual precipitation have decreased slightly over the period 1989–2006 (Mernild et al., 2008). T2m was -0.9°C (1900–2008) and mean annual corrected precipitation at the AWS in Tasiilaq was approximately 1,200 mm water equivalent/year (w.e./year) (corrected after (Allerup et al., 1998; 2000)) (Mernild S. et al., 2012). The relative occurrence of solid, mixed and liquid precipitation has been estimated based on air temperatures (Hanssen-bauer, 2003), and was found to be 68%, 14% and 18% respectively in the period 1999–2006 (Mernild et al., 2008). Glacier thinning and glacier recession has been observed in the broader region of south-east Greenland (Bjørk et al., 2012; Mernild S. H. et al., 2012). The mass change from Mittivakkat glacier was -1.0 +/- 0.7 m w.e./year in the period 1996–2012 (Mernild S. H. et al., 2012; Yde et al., 2014). Within this time period, 14 out of the 16 years had a negative surface mass balance, with record mass losses in 2009/2010 and 2010/2011 (∼2.2 and ∼2.5 m w.e./year respectively) (Mernild S. H. et al., 2012). A more recent mass balance record based on measurements at the AWS gives an accelerated average mass balance rate of -2.1 m ice eq./year (2009–2019) (Fausto et al., 2020).
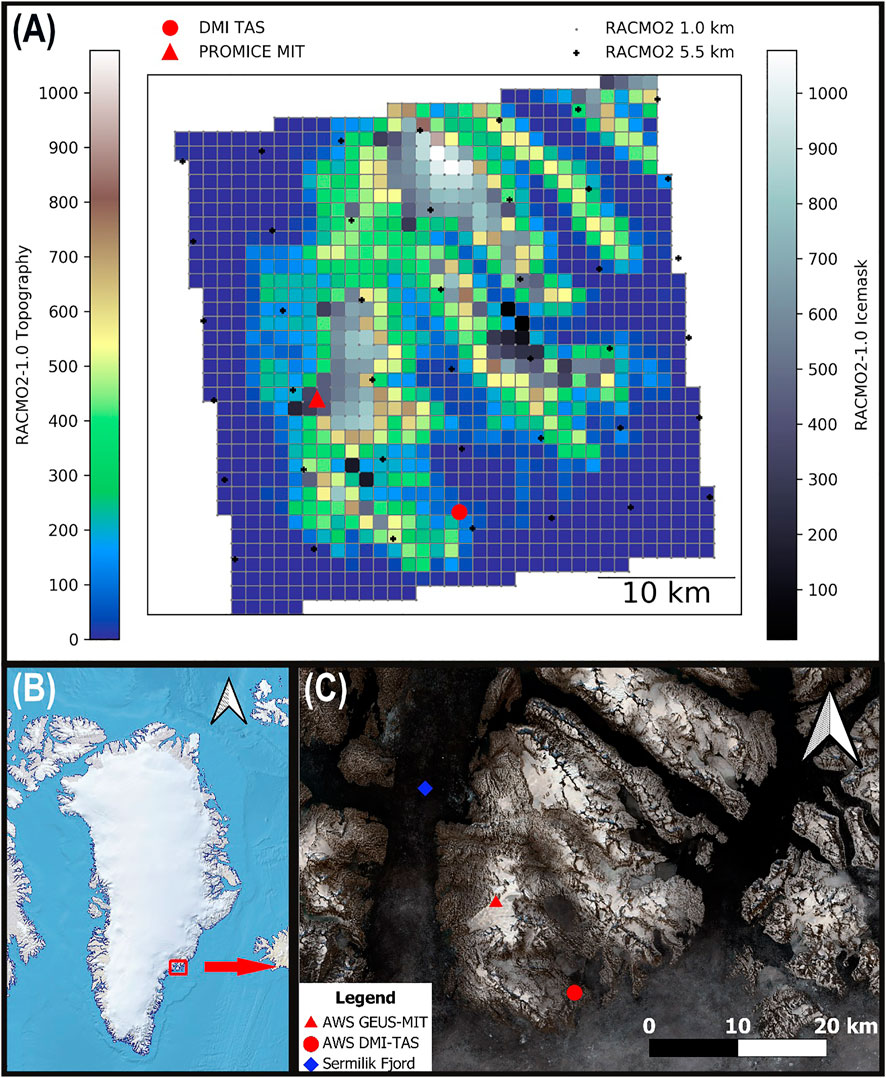
FIGURE 1. (A) The spatial resolution of both RACMO2 products is indicated with black (RACMO2-5.5km) and grey (RACMO2-1.0 km) dots. RACMO2-1.0 km model topography and Icemask as well as the location of AWS at Tasiilaq (DMI-TAS) and Mittivakkat (GEUS-MIT) are shown. (B) The location of the study area in Greenland. (C) Median of Sentinel 2 RGB imagery from July 2022 with highlighted locations of AWS GEUS-MIT, AWS DMI-TAS and the Sermilik Fjord.
1.3 Research objectives
Given the limited detailed knowledge of past precipitation changes in coastal regions in Greenland, the objectives of this study are to 1) establish a quality-controlled database of precipitation and temperature data from Ammassalik island from a combined use of observational and model data, 2) conduct a time series analysis of these data, 3) with particular focus on spatiotemporal patterns of the ratio of liquid to total precipitation and the 4) altitude of the rain-to-snow boundary.
2 Data
An overview of data used in this study is given in Table 1.
TABLE 1. Overview of data used in this study.
2.1 RACMOv2.3
The Regional Atmospheric Climate Model (RACMO2) was developed by the Royal Netherlands Meteorological Institute (KNMI) (van Meijgaard et al., 2008). In this study, we use the polar version of this model, RACMO2.3p2, (hereafter RACMO2) that was developed by the Institute for Marine and Atmospheric research (IMAU), Utrecht University, in order to better simulate the evolution of surface mass balance over the ice sheets of Greenland, Antarctica and other glaciated regions (Noël et al., 2018). In this study, we use RACMO2 at 5.5 km resolution (RACMO2-5.5 km) (hereafter RACMO2-5.5 km) and the statistically downscaled product at 1 km (RACMO2-1 km) (hereafter RACMO2-1.0 km) (Noël et al., 2019). The forcing was done on a three-hourly basis by ERA-40 (1958–1978), ERA-Interim (1979–1989) and ERA-5 (1990–2021). The topography in RACMO2-5.5 km and RACMO2-1.0 km are from the GIMP DEM at 90 m downsampled to 5.5 km and 1.0 km (Howat et al., 2014).
RACMO2-1 km is well suited to resolve the steep surface mass balance (SMB) gradients in the topographically complex regions in which GICs are often situated (Noël et al., 2019), including Ammassalik island. This product extends to the GrIS and the GICs located outside of the ice sheet margin. The cloud physics scheme which determines partitioning of precipitation is described in (Wessem et al., 2014).
2.2 Weather station Tasiilaq (DMI-TAS)
The Danish Meteorological Institute (DMI) operates several AWS in the coastal regions of Greenland. In this study we use several time series of variables observed at the AWS in Tasiilaq (TAS), located at 37.64 °W and 65.61°N (54 m a.s.l.) (Cappelen et al., 2021). A daily time series of T2m (1958–2020) (DMI-TAS-daily T2m) has been created from the available min. and max. T2m according to the formula:
In addition, we use the monthly time series of T2m (1958–2020) (DMI-TAS-monthly T2m). For precipitation, we use a daily time series of accumulated precipitation (1958–2020) (DMI-TAS daily precip). Several gaps (mainly in 1980 and 2013–2014) exist in the precipitation observations at TAS (Cappelen et al., 2021). Minor inhomogeneities could also still exist in this dataset due to a small change in station location on 15 August 2015 as well as the installation of a Pluvio automatic raingauge at this date (Cappelen et al., 2021).
A monthly time series is also available (1958–2020) (DMI-TAS monthly precip). Metadata on the time series as well as further information about the sensors installed at the AWS are available in the historical data collection report from DMI (Cappelen et al., 2021).
2.3 AWS Mittivakkat (GEUS-MIT)
The programme for Monitoring the Greenland Ice Sheet (PROMICE) (Fausto and Van As, 2021) has been measuring climate data since 2007 at several locations on the GrIS as well as on GIC on the ice sheet margins. The AWS at Mittivakkat (MIT) is located at 65.69°N and 37.83°W at an elevation of 440 m a.s.l. (Fausto et al., 2020). The station has been installed on 3 May 2009. From this dataset we use daily time series of air temperature (2009–2020) (GEUS-MIT daily T2m). The temperature sensor is located at a height of approximately 2.6 meter above the surface, although the actual height varies with the snow height.
A table with information about all temperature sensors and precipitation gauges used in DMI-TAS and GEUS-MIT, as well as accuracy values, is given in the Supplementary Table S1.
3 Methods
3.1 Data preparation
From both RACMO2 datasets, a time series of data for Ammassalik island has been selected based on the minimum and maximum longitude and latitude of the entire island. Atmospheric variables from DMI-TAS and GEUS-MIT were extracted from RACMO2-5.5 km and RACMO2-1.0 km respectively using the nearest grid point. The corresponding model elevation is 68 and 443 m a.s.l. for TAS and MIT respectively. Quality control of the observed data has been done by DMI and GEUS for their respective datasets. RACMO2-1.0 km solid precipitation has been restricted to 1958–2015 due to a data gap in the model output thereafter. Daily solid precipitation from this model output consists almost solely of values <1 mm in the 2015–2021 period in our study region.
3.2 Trend analysis of temperature and precipitation variables
Subsets of the different model time series have been created for all meteorological seasons (DJF, MAM, JJA, SON) as well as for every month. Yearly and seasonal averages of T2m and accumulated precipitation were created from the daily dataset. Long term trends in yearly T2m and precipitation data have then been statistically assessed using the non-parametric Mann-Kendall statistical trend (M-K test) (Mann, 1945; Kendall, 1975; Mahmud, 2019). We use a critical value to detect significant trends with a 0.05 significance level. The slope corresponds to the Theil-Sen estimator and is reported as direction and magnitude of the change per decade.
3.3 Trend analysis of the altitude of the rain-to-snow boundary
We use the term rain-to-snow boundary (RSB) to identify the altitude where the shift from liquid precipitation to solid precipitation takes place. We assess monthly changes in the RSB in this region. Our analysis is conducted with the dataset covering the Ammassalik island domain in the model (see data preparation). For each day within each timeseries, regions with daily liquid and/or solid precipitation of more than 1 mm w.e. were selected. The RSB is then defined as follows:
• On days with only liquid precipitation, the RSB is defined as the highest altitude within the selected model domain where liquid precipitation occurs.
• On days with only solid precipitation, the RSB is defined as the lowest altitude within the selected model domain where solid precipitation occurs.
• On days with solid and liquid precipitation, the RSB is defined as the average of the highest elevation where liquid precipitation and the lowest elevation where solid precipitation occurs.
Days with both solid and liquid precipitation <1 mm in all grid cells are considered precipitation-free and thus do not get considered in the analysis of the RSB. For each month, an average of daily values of the estimated RSB was calculated. The M-K test was performed on yearly time series for each month of the year. At the same time, annual trends were also calculated for the number of days with precipitation above the 1 mm threshold within each month.
3.4 Evaluation of RACMO2 with observations
To support our use of RACMO2, we evaluate its performance for temperature and precipitation at different time steps at the two locations with AWS. From the observed and modelled data, monthly and annual means/totals were calculated for those months with full data coverage on the daily time scale for both data types. Root mean square error (RMSE) and Pearson correlation coefficient (R) were calculated for T2m at MIT, T2m at TAS and total precipitation at TAS.
3.5 Trend analysis of precipitation phase
Precipitation phase trends based on the ratio of modelled liquid to total precipitation were analyzed for the individual summer months and over different altitude ranges in 200 m bins. The covered area within a certain altitude range decreases with increasing altitude. As with the other trend analyses, the M-K test was used in order to assess the presence of statistically significant trends in the time series. Sen’s slope values of the M-K test at different altitude bins are for months with detected statistical trends.
4 Results
4.1 Evaluation of RACMO2 with observations
In Figure 2 we show that modelled and measured T2m at MIT have Pearson correlation coefficients of 0.95, 0.99 and 0.95 on the daily (Figure 2A), monthly (Figure 2D) and annual (Figure 2G) time scale respectively. These values are slightly lower on at TAS (0.84, 0.91. 0.41) on the daily (Figure 2B), monthly (Figure 2E) and annual (Figure 2H) time scale respectively. The low correlation value for T2m at TAS at the annual time scale is mainly due to larger than average absolute differences in the period 1979–1989 (see section 4.2.1). A relatively low correlation (R = 0.38) exists for daily precipitation values at TAS (Figure 2C), whereas this value is higher for the monthly (0.80) (Figure 2F) and annual scale (0.71) (Figure 2I). We highlight the high RMSE (1,016 mm w.e.) for annual precipitation at TAS. On average, the difference between modelled and observed annual precipitation does not get stronger or weaker depending on the precipitation amount. On the contrary, we do see a larger difference between relatively higher observed and modelled precipitation totals on the monthly time scale.
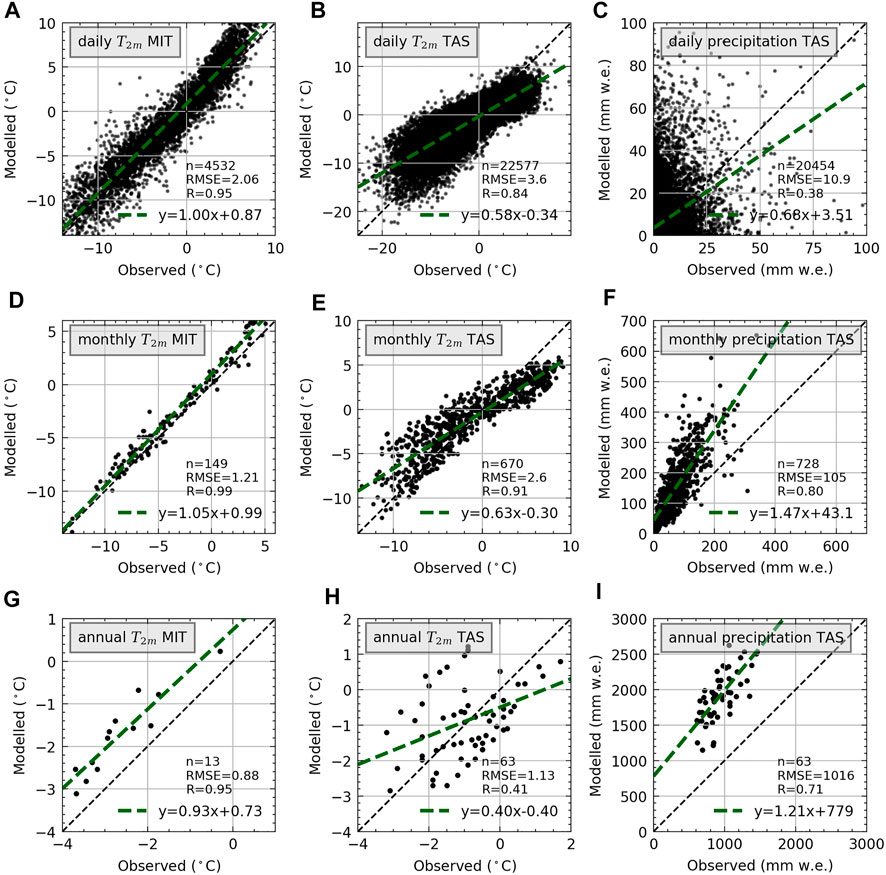
FIGURE 2. Evaluation of RACMO2 variables T2m and precipitation at daily (A, B, C), monthly (D, E, F), and annual (G, H, I) time scales. 23 values are not shown in (C) due to the choice of x and y limits. Dashed line represents a 1:1 relationship between model and observations. A linear fit is plotted with a dark green line and the equation is highlighted in the bottom right corner of each subplot. Number of observations (n), Root Mean Square Error (RMSE) and the Pearson correlation coefficient (R) are highlighted in the bottom right of each subpanel.
4.2 Climate trends on Ammassalik island
4.2.1 Temperature trends
Figure 3 illustrates trends in annual average T2m for two locations on Ammassalik island, based on a combination of climate model data and observations. The interannual variability of annual averages of T2m of RACMO2 aligns well with observations. This is true for both locations, however the validation period for MIT is limited (13 years). Based on visual inspection, we identify larger than average discrepancies between observed and modelled annual T2m averages during the period 1979–1989 (Figure 3A). Modelled values of annual average T2m at TAS show no trend during 1958–2021, however a strong trend (0.8°C/decade, p<0.01) is detected for the 1990–2019 period. T2m on Mittivakkat glacier is increasing with 0.2°C/decade (p<0.01) in 1990–2021 (Figure 3C), while no trend for the 1990–2019 period is detected (non-significant trend, +0.2°C/decade, p=0.25). At both locations, the only statistically significant seasonal T2m trends occur in summer (+0.2 and +0.3°C/decade at TAS and MIT respectively) (Figures 3B,D). The key temperature trends that result from this analysis are clear increases in T2m at MIT over the whole time period, a strong increase in T2m at TAS during 1990–2019 as well as increases during summer, but not in other seasons.
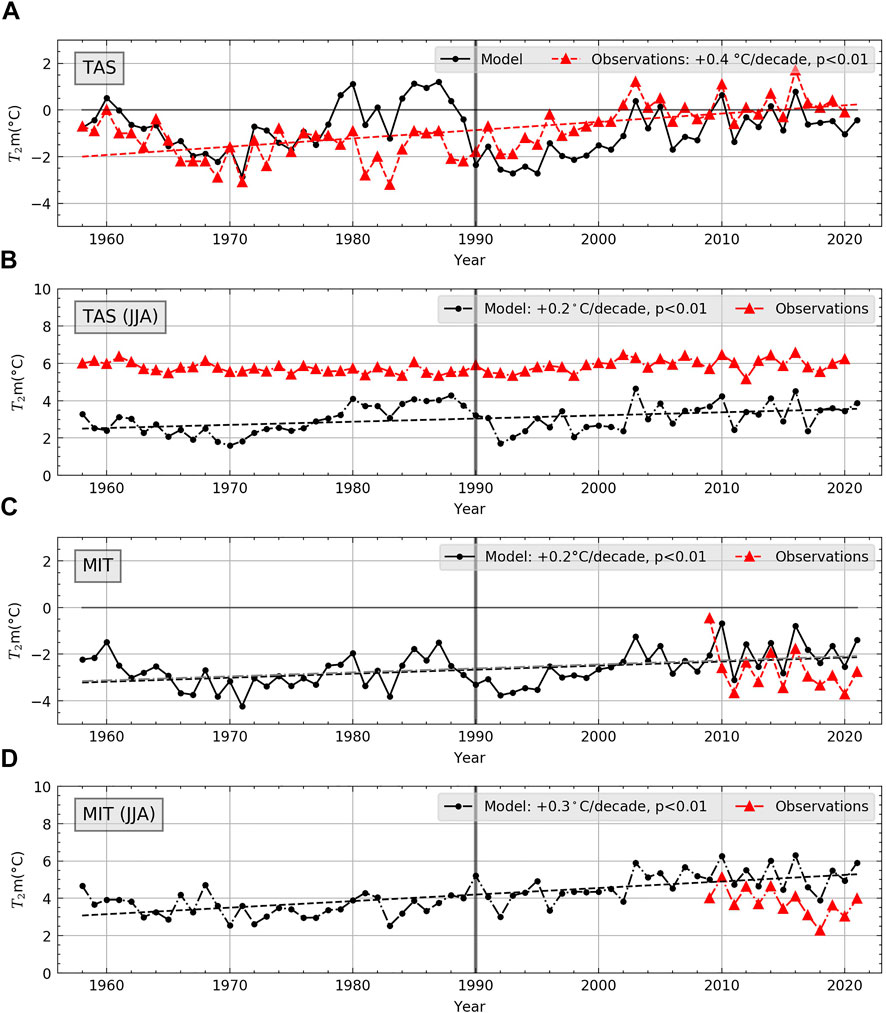
FIGURE 3. Annual average T2m trends for two locations on Ammassalik island. Modelled (RACMO2-5.5 km for TAS and RACMO2-1.0 km for MIT) T2m values are indicated with black dots. Observed (DMI-TAS) and (GEUS-MIT) T2m values are indicated with red triangles. Subpanels depict annual average T2m at TAS (A), summer annual averages at TAS (B), annual average T2m at MIT (C) and summer annual averages at MIT (D). Linear trends for the 1958-2021 period are calculated with the Sen’s slope and shown as dotted lines.
4.2.2 Precipitation trends
For precipitation trends we rely on the regional climate model, as the observations do not distinguish between solid or liquid precipitation. The correlation between monthly observed and modelled precipitation is R = 0.80 (Figure 2F). For annual totals however, the modelled values are approximately double that of the observed values (RMSE = 1,016 mm over 1958–2019). The reason for this mismatch is unclear, as limitations to both the measurements as well as the model output exist. Despite the difference absolute values, the interannual variability of total precipitation is captured well by the model. Modelled values of yearly total precipitation, liquid precipitation, solid precipitation at TAS show no significant trend over the period 1958–2019 (Figure 4A). While we do not detect any trends over the 1958–2015 period, solid precipitation at MIT has decreased over the period 1990–2015 (-131 mm w.e./decade, p=0.03). Modelled summer precipitation over the period 1958–2015 has decreased at TAS (-7.4 mm w.e./decade, p<0.01) and at MIT -6.5 mm w.e./decade, p=0.02).
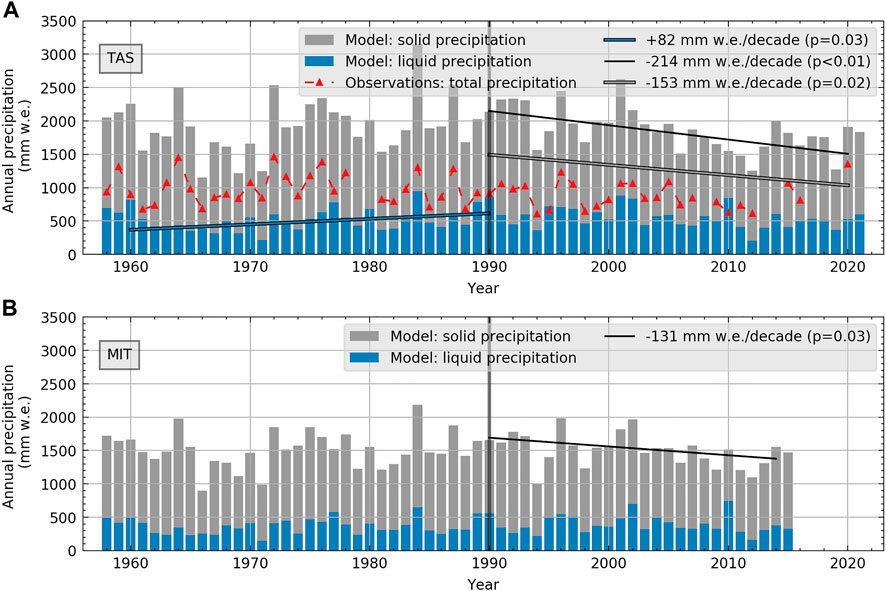
FIGURE 4. Annual liquid (height of the blue bars), solid (height of the grey bars) and total (top of the stacked bars) for two locations on Ammassalik island, TAS (A) and MIT (B). Data from RACMO2 and DMI-TAS. Trends are shown with solid black (for total precipitation), grey with black edges (solid) and blue with black edges (liquid precipitation).
4.2.3 Precipitation phase trends
In Figure 5 the temporal evolution of the precipitation phase on Ammassalik island is shown for the summer months. Each summer month shows an increasing trend (1958–2015) in the liquid precipitation ratio and this trend is higher in early summer: 2.02%/decade, p<0.01 (June) (Figure 5A), 1.90%/decade p<0.01 (July) (Figure 5B), and 1.80%/decade, p<0.01 (August) (Figure 5C). This is also valid for all altitude bands. In June, this increase is only statistically significant in the 600–800 m a.s.l. range (2.7%/decade, p=0.03). In both July and August, statistically significant increases occur at all altitude range. When looking at the separate seasonal time series of location TAS and MIT, we identify the following statistically significant trends in precipitation phase: increases of +2.57%/decade, p=0.00 (summer) and +1.75%/decade, p=0.03 (autumn) at TAS and +2.19%/decade, p=0.03 (autumn) at MIT. The rainfall ratio at MIT (rainfall to total precipitation) is increasing in all summer months with the strongest trend in June (4.4%/decade, 2.4%/decade, 2.4%/decade in June, July, August, respectively). No significant trends occur in the yearly averages of precipitation phase. The relative increase of liquid precipitation in late summer is larger in higher altitudes, as we notice a clear increase in the magnitude of the slope values for increasing altitude bins in July and August (Figures 5B,C).
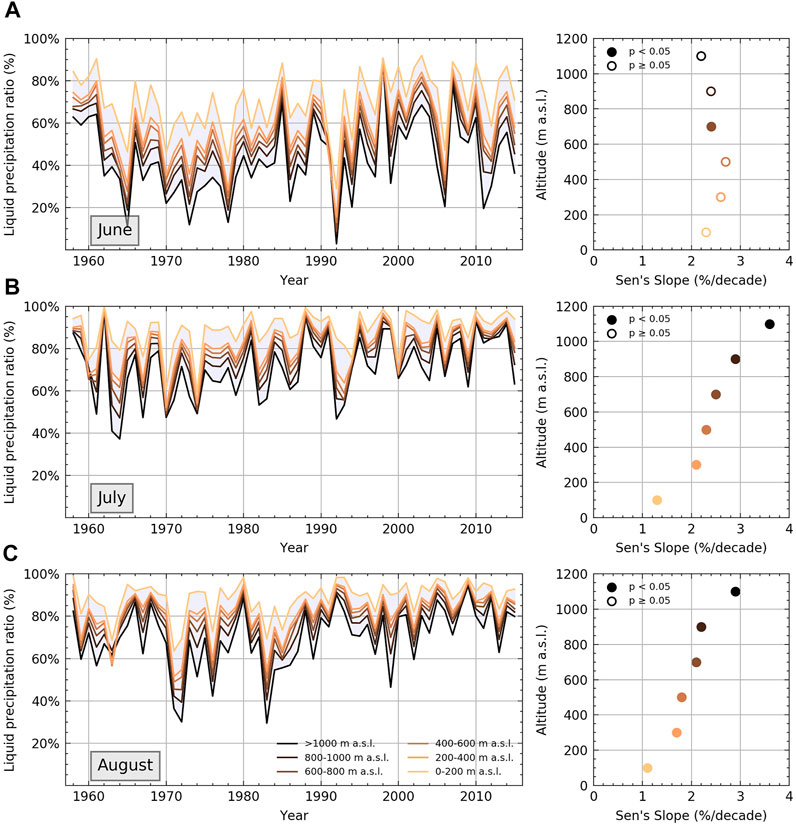
FIGURE 5. RACMO2-1.0 km trends in liquid precipitation ratio at different elevation bands for June (A), July (B) and August (C). Sen’s slope values at different elevation bands are highlighted in the scatterplots.
4.3 Trend analysis of the rain/snow boundary altitude
Figure 6 shows monthly averages of the modelled rain/snow boundary altitude (RSB), based on RACMO2-1.0 km (GIC). July, August and September all show significant increases in the modelled RSB, while the other months of the year show non-significant trends. The slope values are +24.5 m/decade (July) (Figure 6A), +23.3 m/decade (August) (Figure 6B) and +20.0 m/decade (September) (Figure 6C).
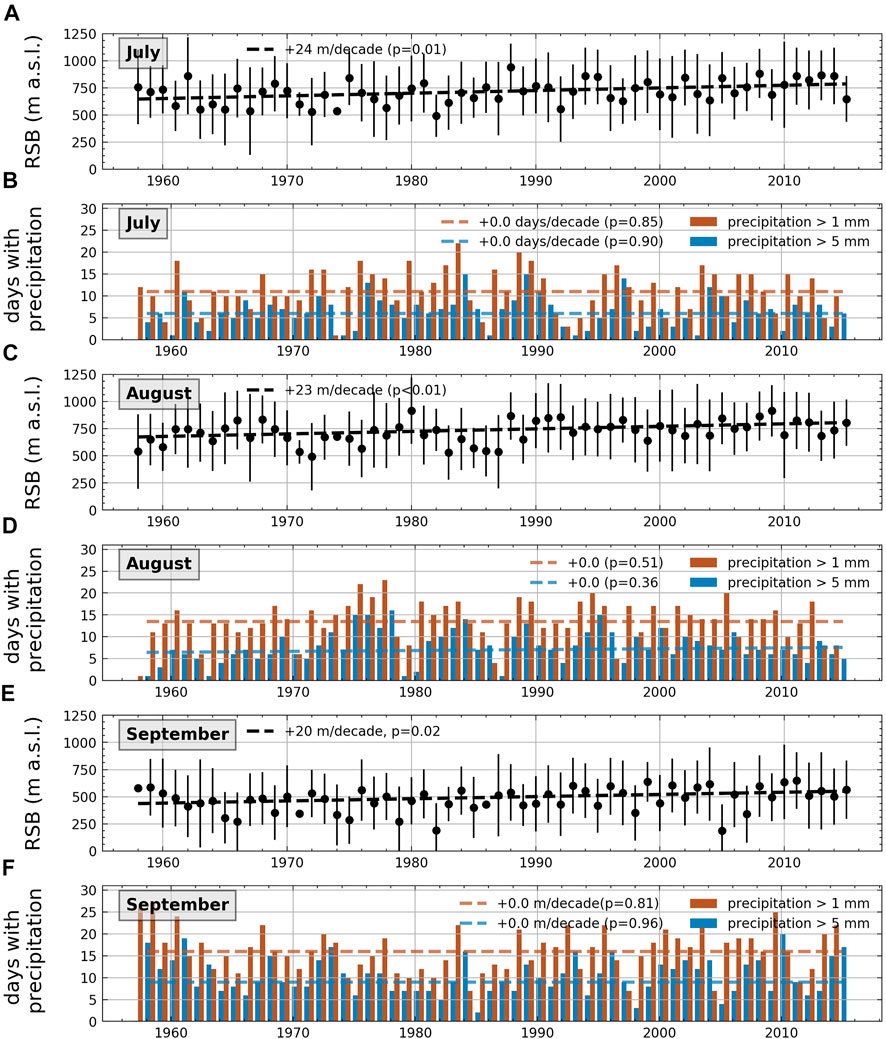
FIGURE 6. Estimated RSB from RACMO2-1.0 km model data for GIC on Ammassalik island. The monthly averages for July (A), August (C) and September (E) are plotted as black dots and standard deviation is plotted as the vertical black bar. The number of days with precipitation above the threshold of > 1 mm (brown) and > 5 mm (blue) are highlighted for June (B), July (D) and August (F). For both the RSB and days with precipitation linear trends are indicated with a dashed line.
5 Discussion
While RACMO2 monthly and daily T2m values correspond well to observations, larger discrepancies appear on the annual time scale. RACMO2 is a useful product for climate analysis in this study region, given its high spatial resolution. It is important not to overinterpret the low Pearson correlation coefficient for the daily precipitation in TAS, as the accurate representation of precipitation on the daily time scale is not the model objective, neither is it crucial for our analysis. The higher Pearson correlation coefficients on the monthly and annual time scale show that the general variability in precipitation is captured well. The earlier highlighted model overestimation of T2m in the period 1979–1989 cannot be attributed to specific data issues. While a minor relocation of the weather station has taken place in 1982, this cannot explain the overestimation as the larger differences between model and observations disappear at the end of the 1979–1989 period. Due to the large uncertainties (mainly related to undercatch) in the precipitation observations as well as in the model output (relatively high spatial resolution of 5.5 km), it is challenging to assess which dataset more accurately represents the precipitation in the area. However, the robustness of the analysis can be improved by including other high-resolution datasets (e.g., CARRA) (Schyberg et al., 2021). We suggest the use discharge observations as a third independent validation possibility specifically for the precipitation variable.
We found several key climate trends on Ammassalik island in the period 1958–2020. We identified that trends in T2m and precipitation have become more pronounced in the 30-year subperiod 1990–2019, when compared to 1960–1989. The temperature trend in Tasiilaq from 1990 to 2019 (+0.8°C/decade, p=0.02) is similar in magnitude to reported trends for the GrIS over the same period (Hanna et al., 2021), while the temperature increase over MIT during this period is significantly weaker (non-significant, +0.2°C/decade, p=0.25). Several studies have previously highlighted the beginning of the 1990s as a period with accelerated mass loss for the GrIS (Mouginot et al., 2019; Hanna et al., 2021) which has also been objectively determined by a break-point analysis (Silva et al., 2022). While we did not perform any break point analysis here, we see a strong difference between the subperiod 1960–1989 and 1990–2019 (particularly for T2m). A good example of this acceleration is visible in the DMI-TAS T2m time series (non-significant trend -0.17°C/decade, p = 0.45) for 1960–1989 compared to a significant trend +0.72°C/decade, p<0.01 in 1990–2019. This acceleration is not found in the precipitation time series. In order to quantify potential influences of sea surface temperatures, we correlated annual values of T2m with the Atlantic Multidecadal Ocean Index, which gives +0.21 for both locations. Furthermore, given the known influences of sea ice conditions in coastal fjord systems on local climate (Koenigk et al., 2016), we hypothesize that seasonal temperature changes in our study area could be influenced by sea ice coverage in the nearby Sermilik Fjord.
Our results show a systemic underestimation of summer T2m in Tasiilaq. Apart from the general simplified representation of the complex topography of the study area, a contributing factor to this underestimation could be the elevation difference between the selected model grid (68 m a.s.l.) and the weather station (54 m a.s.l.). Summer temperature increases in Greenland can be seen as a consequence of increasing atmospheric blocking (Hanna et al., 2021). We highlight that the temperature and precipitation trends in our study area are most pronounced in summer. Greenland GIC are particularly sensitive to temperature increases in summer as these generally leads to increased melt and runoff. The increase in liquid precipitation in summer corresponds well with the fact that we detect a temperature increase in this season in TAS as well as MIT. The liquid precipitation ratio in the summer season is sensitive to changes, as its value is characteristically very high during this time of the year. Since most precipitation changes that we identify occur in the summer season, this factor must be considered. The shift in RSB (Figure 6) is less influenced by this factor, as changes in the altitude of precipitation within the study area are also considered.
Some differences appear from a comparison of trends at the two locations within our study region (Figures 3, 4). A key contributing factor to this contrast is the differences in microclimate between TAS and MIT. MIT is characterized by its glaciated surface. In addition, the local topography is more mountainous, and it has greater proximity to Sermilik Fjord. The sea-breeze and katabatic winds are more pronounced at this location. An example of a different climate trend for the two locations is that we identify a stronger T2m increase at MIT compared to TAS. In general, trends in T2m and precipitation are more pronounced at MIT, which is in line with the general observation that mountain regions warm more significantly in higher elevations (Pepin et al., 2015). There is also growing evidence for the elevation dependency of precipitation changes (Kotlarski et al., 2015; Yao et al., 2016; Hu et al., 2021). In our study region there are no trends in absolute precipitation in TAS, while we have highlighted a decreasing trend in solid precipitation at MIT. The absence of a trend in annual precipitation (total, solid and liquid) at TAS is particularly interesting, given the existing trends in liquid precipitation (1958–2020) for the GrIS as well as the GIC and tundra regions in Greenland (Huai et al., 2022). In an earlier study, several significant short-term trends have been detected for observed annual precipitation at TAS (-54 mm w.e./year in 2001–2012, -17 mm w.e./year in 1991–2012 and 1971–2000, +23 mm w.e./year in 1951–1980) (Mernild et al., 2015). In parts, those trends refer to rather short timespans, which may limit interpretability considering the relatively high natural variability of precipitation. The fact that we detect changes between TAS and MIT for precipitation as well as T2m can be explained by considering the influence of air temperature on the partitioning of precipitation.
The frequent occurrence of temperature inversions over the snow/ice covered areas in the study area could potentially alter the relationship between elevation and climate trends. Radiosonde observations TAS have shown that inversions regularly (in about 84% of the observations) occur until an altitude of approximately 300 m a.s.l. (Mernild and Liston, 2010). Recent studies show a general increase in inversion frequency (3%/decade) and thickness (12 m/decade) for surface based inversion in the southern part of Greenland, particularly in the summer season (Shahi et al., 2020).
5.1 Comparison of detected trends with other Arctic regions
5.1.1 Temperature
In general, the detected signal of increasing air temperature is also occurring widespread in other Arctic regions (Huang et al., 2017). The strongest increase in surface air temperature over land has been detected in Siberia (Hantemirov et al., 2022) and in the eastern part of the Canadian Arctic (Rapaić et al., 2015). The stronger trend in temperature time series from 1990 onwards, compared to earlier decades, was also detected in Svalbard (+0.32°C/decade from 1898 to 2018, +1.7°C/decade in 1991–2018) (Nordli et al., 2020). In Greenland, regional temperature trends are strongly dependent on the season. In general, the more northern regions show stronger temperature trends in recent decades. In autumn, there is a clear difference between stronger trends temperature trends on the East coast (Hanna et al., 2021). The seasonal temperature trends detected in this study are weaker compared to temperature trends in Sisimiut, located on the west coast at a comparable latitude (Hanna et al., 2021).
5.1.2 Precipitation
For the whole Arctic region, total annual precipitation has increased by 1.5%–2.0% per decade in the period 1979–2017 with the strongest trend in the cold season (October-May) (Box et al., 2019). There is significant spatial variability in changes in precipitation phase throughout the Arctic. The decrease in solid precipitation and increase in liquid precipitation (that we found to have taken place in the summer season in our study area) has been observed around the GrIS margins (Doyle et al., 2015) and in Scandinavia and the Baltic Sea (Rasmus et al., 2015; Irannezhad et al., 2016). On the contrary, colder Arctic regions such as north Canada and Siberia show increasing snowfall (Krasting et al., 2013; Vincent et al., 2015). Precipitation has been found to increase in the Canadian Arctic. However, there is considerable spatial seasonal and temporal variability in this trend (Rapaić et al., 2015). In other regions within Greenland, increasing precipitation trends have been detected. Liquid precipitation over GIC in Greenland has increased by 2–3 mm w.e./decade in the period 1990–2010 (Huai et al., 2021). This trend is even stronger over the GrIS (12 mm w.e./decade) (Huai et al., 2021).
5.3 Potential implications
The average altitude of the RSB during precipitation events is 652 m a.s.l. in summer. Given the fact that this altitude is increasing (1958–2016), the precipitation phase is shifting towards more liquid precipitation at this altitude and further increases in temperature and hence the liquid precipitation ratio are projected, a likely conclusion is that Mittivakkat glacier (as well as other GIC on Ammassalik island) will receive significantly more liquid precipitation in the future. The largest glacier-covered areas on Ammassalik island are located between 400–800 m a.s.l. The average RSB has remained inside this elevation range. If the same trend continues in the future, the average RSB will increase towards higher elevations with smaller GIC cover, which increases the likeliness of liquid precipitation on the glaciers on Ammassalik island. While the specific effect of increased liquid precipitation at marginal glaciers is not well known, it could potentially be an important factor for accelerated melt. Liquid precipitation events related to cyclonic weather conditions lead to amplified runoff on the GrIS, as the drainage system of the ice sheet can less efficiently drain the meltwater during this time (Doyle et al., 2015). Given the identified summer and autumn trends in precipitation in our study region, we hypothesize that the same mechanism could potentially contribute to enhanced runoff on GIC on Ammassalik island.
6 Conclusion
The combination of several types of climate data (model and observations) is a useful approach for studying local changes in temperature and precipitation in remote regions where climate data is sparsely available. This approach has here contributed to an increased understanding of precipitation and temperature changes on Ammassalik island. In general, and specifically for the daily and monthly time scales, RACMO2 performs well when compared to observations from the AWS. Larger differences and lower Pearson correlation coefficients exist when comparing annual totals of precipitation and annual averages of T2m. We find that RACMO2 is a useful addition to the observational data in this region, because of its high spatial resolution, temporal consistency, and the fact that it has been extensively evaluated over glaciated surfaces.
T2m has been increasing on Ammassalik island since 1958, a trend that becomes more pronounced in the 1990–2019 subperiod. This temperature trend is stronger at MIT than at TAS, where no significant trend is detected in 1960–1989. Temperature changes are strongest in the summer season. Due to trends in precipitation as well as air temperature, the liquid to total precipitation ratio on Ammassalik island is increasing in summer. Higher elevated regions on Ammassalik island have recently received more liquid precipitation due to this increased liquid precipitation ratio combined with an upward migration of the RSB altitude. These changes occur within an elevation range where many of the island’s glaciers are located. Given that atmospheric temperature and the liquid precipitation ratio are projected to further increase, it is likely that the trend identified in this study will persist in the future. These combined changes could significantly increase surface runoff in the future for the GIC located on Ammassalik island.
Data availability statement
Publicly available datasets were analyzed in this study. This data can be found here: https://doi.org/10.22008/FK2/8SS7EW (GEUS), https://confluence.govcloud.dk/display/FDAPI/Climate+data (DMI)
Author contributions
JS, JA and WS contributed to conception and design of the study. CJ and BN provided the data for the analysis. JS performed data preparation and statistical analysis and wrote the first draft of the manuscript. All authors contributed to manuscript revision.
Funding
This research has been conducted as part of the Snow2Rain research project, which has been funded by the Earth System Sciences (ESS) research programme of the ÖAW, the Austrian Academy of Sciences. The authors acknowledge the financial support by the University of Graz.
Acknowledgments
We would like to thank the Geological Survey of Denmark and Greenland (GEUS) for providing AWS data from their weather station on Mittivakkat glacier.
Conflict of interest
The authors declare that the research was conducted in the absence of any commercial or financial relationships that could be construed as a potential conflict of interest.
Publisher’s note
All claims expressed in this article are solely those of the authors and do not necessarily represent those of their affiliated organizations, or those of the publisher, the editors and the reviewers. Any product that may be evaluated in this article, or claim that may be made by its manufacturer, is not guaranteed or endorsed by the publisher.
Supplementary material
The Supplementary Material for this article can be found online at: https://www.frontiersin.org/articles/10.3389/feart.2022.1085499/full#supplementary-material
References
Allerup, P., Madsen, H., and Vejen, F. (1998). Estimating true precipitation in arctic areas. NHP Rep. 1–9.
Allerup, P., Vejen, H., and Madsen, F. (2000). Correction of precipitation based on off-site weather information. Atmos. Res. 53, 231–250. doi:10.1016/s0169-8095(99)00051-4
Berdahl, M., Rennermalm, A., Hammann, A., Mioduszweski, J., Hameed, S., Tedesco, M., et al. (2018). Southeast Greenland winter precipitation strongly linked to the Icelandic Low position. J. Clim. 31, 4483–4500. doi:10.1175/JCLI-D-17-0622.1
Bintanja, R., and Andry, O. (2017). Towards a rain-dominated Arctic. Nat. Clim. Chang. 7, 263–267. doi:10.1038/nclimate3240
Bintanja, R., and Selten, F. M. (2014). Future increases in Arctic precipitation linked to local evaporation and sea-ice retreat. Nature 509, 479–482. doi:10.1038/nature13259
Bjørk, A. A., Kjær, K. H., Korsgaard, N. J., Khan, S. A., Kjeldsen, K. K., Andresen, C. S., et al. (2012). An aerial view of 80 years of climate-related glacier fluctuations in southeast Greenland. Nat. Geosci. 5, 427–432. doi:10.1038/ngeo1481
Box, J. E., Colgan, W. T., Christensen, T. R., Schmidt, N. M., Lund, M., Parmentier, F.-J. W., et al. (2019). Key indicators of Arctic climate change: 1971–2017. Environ. Res. Lett. 14, 045010. doi:10.1088/1748-9326/aafc1b
Cai, Z., You, Q., Wu, F., Chen, H. W., Chen, D., and Cohen, J. (2021). Arctic warming revealed by multiple CMIP6 models: Evaluation of historical simulations and quantification of future projection uncertainties. J. Clim. 34, 4871–4952. doi:10.1175/JCLI-D-20-0791.1
Cappelen, J., Vinther, B. M., Kern-Hansen, C., Laursen, E. V., and Jørgensen, P. V. (2021). Greenland-DMI historical climate data collection 1784-2020. Available at: https://www.dmi.dk/publikationer/.
Delhasse, A., Hanna, E., Kittel, C., and Fettweis, X. (2020). Brief communication: CMIP6 does not suggest any atmospheric blocking increase in summer over Greenland by 2100. Int. J. Climatol. 41, 2589–2596. doi:10.1002/joc.6977
Doyle, S. H., Hubbard, A., Van De Wal, R. S. W., Box, J. E., Van As, D., Scharrer, K., et al. (2015). Amplified melt and flow of the Greenland ice sheet driven by late-summer cyclonic rainfall. Nat. Geosci. 8, 647–653. doi:10.1038/ngeo2482
Fausto, R. S. ., Abermann, J., and Ahlstrøm, A. P. (2020). Annual surface mass balance records (2009–2019) from an automatic weather station on Mittivakkat glacier, SE Greenland. Front. Earth Sci. 8, 1–5. doi:10.3389/feart.2020.00251
Fausto, R., and Van As, D. (2021). Programme for monitoring of the Greenland ice sheet (PROMICE): Automatic weather station data. Version: v03. Geol. Surv. Den. Greenl. 13, 3819–3845.
Hanna, E., Cappelen, J., Fettweis, X., Mernild, S. H., Mote, T. L., Mottram, R., et al. (2020). Greenland surface air temperature changes from 1981 to 2019 and implications for ice-sheet melt and mass-balance change. Int. J. Climatol. 41, 1–17. doi:10.1002/joc.6771
Hanna, E., Cappelen, J., Fettweis, X., Mernild, S. H., Mote, T. L., Mottram, R., et al. (2021). Greenland surface air temperature changes from 1981 to 2019 and implications for ice-sheet melt and mass-balance change. Int. J. Climatol. 41, E1336–E1352. doi:10.1002/joc.6771
Hanssen-bauer, I. F. (2003). Climate variations and implications for precipitations types in the Norwegian arctic.
Hantemirov, R. M., Corona, C., Guillet, S., Shiyatov, S. G., Stoffel, M., Osborn, T. J., et al. (2022). Current Siberian heating is unprecedented during the past seven millennia. Nat. Commun. 13, 4968–8. doi:10.1038/s41467-022-32629-x
Howat, I. M., Negrete, A., and Smith, B. E. (2014). The Greenland Ice Mapping Project (GIMP) land classification and surface elevation data sets. Cryosphere 8, 1509–1518. doi:10.5194/tc-8-1509-2014
Hu, W., Yao, J., He, Q., and Chen, J. (2021). Elevation-dependent trends in precipitation observed over and around the Tibetan plateau from 1971 to 2017. WaterSwitzerl. 13, 2848–2917. doi:10.3390/w13202848
Huai, B., van den Broeke, M. R., Reijmer, C. H., and Noël, B. (2022). A daily, 1 km resolution Greenland rainfall climatology (1958-2020) from statistical downscaling of a regional atmospheric climate model. J. Geophys. Res. Atmos. 1–17. doi:10.1029/2022jd036688
Huang, J., Zhang, X., Zhang, Q., Lin, Y., Hao, M., Luo, Y., et al. (2017). Recently amplified arctic warming has contributed to a continual global warming trend. Nat. Clim. Chang. 7, 875–879. doi:10.1038/s41558-017-0009-5
Irannezhad, M., Ronkanen, A. K., and Kløve, B. (2016). Wintertime climate factors controlling snow resource decline in Finland. Int. J. Climatol. 36, 110–131. doi:10.1002/joc.4332
Khan, S. A., Colgan, W., Neumann, T. A., van den Broeke, M. R., Brunt, K. M., Noël, B., et al. (2022). Accelerating ice loss from peripheral glaciers in north Greenland. Geophys. Res. Lett. 49, e2022GL098915. doi:10.1029/2022GL098915
Koenigk, T., Caian, M., Nikulin, G., and Schimanke, S. (2016). Regional Arctic sea ice variations as predictor for winter climate conditions. Clim. Dyn. 46, 317–337. doi:10.1007/s00382-015-2586-1
Kotlarski, S., Lüthi, D., and Schär, C. (2015). The elevation dependency of 21st century European climate change: An RCM ensemble perspective. Int. J. Climatol. 35, 3902–3920. doi:10.1002/joc.4254
Krasting, J. P., Broccoli, A. J., Dixon, K. W., and Lanzante, J. R. (2013). Future changes in northern hemisphere snowfall. J. Clim. 26, 7813–7828. doi:10.1175/JCLI-D-12-00832.1
Mahmud, M. M. H. I. M., and Stuart, A. (2019). pyMannKendall: a python package for non parametric Mann Kendall family of trend tests. Biometrika 42, 80. doi:10.2307/2333424
Mann, H. B. (1945). Nonparametric tests against trend. Nonparametric Tests Against Trend 13, 245–259. doi:10.2307/1907187
McCrystall, M. R., Stroeve, J., Serreze, M., Forbes, B. C., and Screen, J. A. (2021). New climate models reveal faster and larger increases in Arctic precipitation than previously projected. Nat. Commun. 12, 6765–6812. doi:10.1038/s41467-021-27031-y
Mernild, S. H., Seidenkrantz, M. S., Chylek, P., Liston, G. E., and Hasholt, B. (2012b). Climate-driven fluctuations in freshwater flux to Sermilik Fjord, East Greenland, during the last 4000 years. Holocene 22, 155–164. doi:10.1177/0959683611431215
Mernild, S. H., Hansen, B. U., Jakobsen, B. H., and Hasholt, B. (2008). Climatic conditions at the Mittivakkat glacier catchment (1994-2006), Ammassalik island, SE Greenland, and in a 109-year perspective (1898-2006). Geogr. Tidsskr. 108, 51–72. doi:10.1080/00167223.2008.10649574
Mernild, S. H., Hanna, E., Mcconnell, J. R., Sigl, M., Beckerman, A. P., Yde, J. C., et al. (2015). Greenland precipitation trends in a long-term instrumental climate context (1890-2012): Evaluation of coastal and ice core records. Int. J. Climatol. 35, 303–320. doi:10.1002/joc.3986
Mernild, S. H., Liston, G. E., Hasholt, B., and Knudsen, N. T. (2006). Snow distribution and melt modeling for Mittivakkat glacier, Ammassalik island, southeast Greenland. J. Hydrometeorol. 7, 808–824. doi:10.1175/JHM522.1
Mernild, S. H., and Liston, G. E. (2010). The Influence of air temperature inversions on snowmelt and glacier mass balance simulations, Ammassalik Island, Southeast Greenland. J. Appl. Meteorol. Climatol. 49, 47–67. doi:10.1175/2009JAMC2065.1
Mernild, S. H., Malmros, J. K., Yde, J. C., and Knudsen, N. T. (2012a). Multi-decadal marine- and land-terminating glacier recession in the Ammassalik region, southeast Greenland. Cryosphere 6, 625–639. doi:10.5194/tc-6-625-2012
Mouginot, J., Rignot, E., Bjørk, A. A., van den Broeke, M., Millan, R., Morlighem, M., et al. (2019). Forty-six years of Greenland Ice Sheet mass balance from 1972 to 2018. Proc. Natl. Acad. Sci. U. S. A. 116, 9239–9244. doi:10.1073/pnas.1904242116
Niwano, M., Box, J. E., Wehrlé, A., Vandecrux, B., Colgan, W. T., and Cappelen, J. (2021). Rainfall on the Greenland ice sheet: Present-day climatology from a high-resolution non-hydrostatic polar regional climate model. Geophys. Res. Lett. 48. doi:10.1029/2021GL092942
Noël, B., van de Berg, W. J., Lhermitte, S., and van den Broeke, M. R. (2019). Rapid ablation zone expansion amplifies north Greenland mass loss. Sci. Adv. 5, eaaw0123–11. doi:10.1126/sciadv.aaw0123
Noël, B., Van De Berg, W. J., Lhermitte, S., Wouters, B., Machguth, H., Howat, I., et al. (2017). A tipping point in refreezing accelerates mass loss of Greenland’s glaciers and ice caps. Nat. Commun. 8, 14730. doi:10.1038/ncomms14730
Noël, B., Van De Berg, W. J., Van Wessem, J. M., Van Meijgaard, E., Van As, Di., et al. (2018). Modelling the climate and surface mass balance of polar ice sheets using RACMO2 - Part 1: Greenland (1958-2016). Cryosphere 12, 811–831. doi:10.5194/tc-12-811-2018
Pepin, N., Bradley, R. S., Diaz, H. F., Baraer, M., Caceres, E. B., Forsythe, N., et al. (2015). Elevation-dependent warming in mountain regions of the world. Nat. Clim. Chang. 5, 424–430. doi:10.1038/nclimate2563
Rantanen, M., Karpechko, A. Y., Lipponen, A., Ruosteenoja, K., Vihma, T., Laaksonen, A., et al. (2021). Than the globe since 1979. 1–10. doi:10.1038/s43247-022-00498-3
Rasmus, S., Boelhouwers, J., Briede, A., Brown, I. A., Falarz, M., Ingvander, S., et al. (2015). “Recent change—terrestrial cryosphere,” in Second assessment of climate change for the Baltic Sea basin. Regional climate studies (Cham: Springer), 117–129. doi:10.1007/978-3-319-16006-1_6
Schyberg, H., Yang, X., Køltzow, M. A. Ø., Amstrup, B., Bakketun, Å., Bazile, E., et al. (2021). Arctic regional reanalysis on single levels from 1991 to present. doi:10.24381/cds.713858f6
Shahi, S., Abermann, J., Heinrich, G., Prinz, R., and Schöner, W. (2020). Regional variability and trends of temperature inversions in Greenland. J. Clim. 33, 9391–9407. doi:10.1175/JCLI-D-19-0962.1
Silva, T., Abermann, J., Noël, B., Shahi, S., van de Berg, W. J., and Schöner, W. (2022). The impact of climate oscillations on the surface energy budget over the Greenland Ice Sheet in a changing climate. Cryosphere 16, 3375–3391. doi:10.5194/tc-16-3375-2022
StatBank Greenland (2022). Available at: https://bank.stat.gl/pxweb/en/Greenland/Greenland__BE__BE01__BE0120/BEXSTD.px/table/tableViewLayout1/ (Accessed October 21, 2022).
van Meijgaard, E., van Ulft, B., van de Berg, W. J., Bosveld, F. C., van den Hurk, B., Lenderink, G., et al. (2008). The KNMI regional atmospheric climate model RACMO version 2.1. Tech. Rep. Tr. - 302, 43.
Vincent, L. A., Zhang, X., Brown, R. D., Feng, Y., Mekis, E., Milewska, E. J., et al. (2015). Observed trends in Canada’s climate and influence of low-frequency variability modes. J. Clim. 28, 4545–4560. doi:10.1175/JCLI-D-14-00697.1
Wessem, J. M. Van, Reijmer, C. H., Lenaerts, J. T. M., Berg, W. J. Van De, and Broeke, M. R. Van Den (2014). Updated cloud physics in a regional atmospheric climate model improves the modelled surface energy balance of Antarctica, Cryosphere, 8, 125–135. doi:10.5194/tc-8-125-2014
Yang, D., Ishida, S., Goodison, B. E., and Gunther, T. (1999). Bias correction of daily precipitation measurements for Greenland. J. Geophys. Res. 104, 6171–6181. doi:10.1029/1998jd200110
Yao, J., Yang, Q., Mao, W., Zhao, Y., and Xu, X. (2016). Precipitation trend-Elevation relationship in arid regions of the China. Glob. Planet. Change 143, 1–9. doi:10.1016/j.gloplacha.2016.05.007
Keywords: air temperature (AT), climate change, Greenland, Mittivakkat glacier, precipitation, RACMO2, rainfall, snowfall
Citation: van der Schot J, Abermann J, Silva T, Jensen CD, Noël B and Schöner W (2023) Precipitation trends (1958–2021) on Ammassalik island, south-east Greenland. Front. Earth Sci. 10:1085499. doi: 10.3389/feart.2022.1085499
Received: 31 October 2022; Accepted: 28 December 2022;
Published: 11 January 2023.
Edited by:
Bartłomiej Luks, Institute of Geophysics (PAN), PolandReviewed by:
Jan Kavan, Masaryk University, CzechiaEduardo Zorita, Helmholtz Centre for Materials and Coastal Research (HZG), Germany
Copyright © 2023 van der Schot, Abermann, Silva, Jensen, Noël and Schöner. This is an open-access article distributed under the terms of the Creative Commons Attribution License (CC BY). The use, distribution or reproduction in other forums is permitted, provided the original author(s) and the copyright owner(s) are credited and that the original publication in this journal is cited, in accordance with accepted academic practice. No use, distribution or reproduction is permitted which does not comply with these terms.
*Correspondence: Jorrit van der Schot, am9ycml0LnZhbi1kZXItc2Nob3RAdW5pLWdyYXouYXQ=
†ORCID: Tiago Silva, orcid.org/0000-0003-1477-7198