- 1School of Atmospheric Sciences, Sun Yat-sen University, and Southern Marine Science and Engineering Guangdong Laboratory (Zhuhai), Zhuhai, China
- 2Huzhou Meteorological Bureau, Huzhou, China
- 3Guangdong Province Key Laboratory for Climate Change and Natural Disaster Studies, Sun Yat-Sen University, Zhuhai, China
- 4Key Laboratory of Tropical Atmosphere-Ocean System, Sun Yat-Sen University, Ministry of Education, Zhuhai, China
The sensitivity of planetary boundary layer (PBL) parameterization schemes in a marine boundary layer jet and associated precipitation is investigated in this study. Six PBL parameterization schemes in the Weather Research and Forecasting Model, including YSU, MYJ, MYNN, ACM2, BouLac, and UW schemes, are examined in simulating a marine boundary layer jet (BLJ) over South China Sea and associated coastal precipitation during a warm-sector heavy rainfall event (19–20 May 2015) near the coast of South China. The results show that YSU, MYJ, MYNN, and BouLac schemes can generally reproduce the coastal warm-sector heavy rainfall with 6-h accumulated precipitation exceeding 50 mm, but not for the ACMs and UW schemes. No convection initiation occurs in the ACM2 run, while rainfall is located to further north with weaker intensity in the UW run. Meanwhile, weakest and strongest BLJs are simulated in the ACM2 and UW runs, respectively. In the ACM2 run, the weaker BLJ with the maximum wind speed less than 17 m s−1 induces weaker convergence and lifting in the upwind side of the coastal terrain as well as less water vapor transport to the coastal area, which thus inhibit convection initiation. On the contrary, the too strong BLJ in the UW run with large area of wind speed greater than 18 m s−1 causes the northward movement of convection along with cold pools, and rainfall moves further north accordingly. The differences in BLJs’ strength among PBL schemes are attributed to varying simulated low-level vortex on the northern side of the BLJ through veering ageostrophic winds. The intensity of the simulated low-level vortex is affected by variations in boundary layer mixing over land and associated vertical temperature stratification under different PBL schemes.
1 Introduction
The pre-summer rainy season over southern China (April—June) is the first rainy season on the mainland of China, which contributes approximately half of the annual precipitation (Luo et al., 2017) and causes severe floods or mudslides and large economic and human losses (Zhou et al., 2003). Heavy rainfall during the pre-summer rainy season often occurs near the front or in the warm sector hundreds of kilometers away from the front, which are regarded as frontal heavy rainfall and warm-sector heavy rainfall, respectively (Ding, 1994; Luo et al., 2017). Differences and similarities between the two types of heavy rainfall in South China are found in their initiation and maintenance mechanisms (Luo, 2017).
Previous studies have documented that the southerly marine boundary layer jet (BLJ), as one type of low-level jet (LLJ), play an important role in warm-sector heavy rainfall (Luo et al., 2017; Du and Chen, 2018; Zhang and Meng, 2018). Du and Chen (2018), Du and Chen (2019a), Du and Chen (2019b), Du et al. (2020a) and Du et al. 2022) demonstrated that the spatial structure and temporal evolution of the BLJ exert a significant influence on the convection initiation and development of warm-sector heavy rainfall. Based on statistical analysis (Wu et al., 2020; Li and Du, 2021), most warm-sector heavy rainfall cases are accompanied by the LLJs. Zhang and Meng (2018) used ensemble sensitivity analyses to examine the controlling factors of a persistent warm-sector rainfall event over southern China, and found that the LLJ was essential in rainfall intensity. In addition, the LLJs interacting with local terrain at the coastal area and the cold pools are important for the initialization and maintenance of warm-sector heavy rainfall over southern China (Wu and Luo, 2016; Du et al., 2020b).
Lack of obvious synoptic-scale forcings (e.g., a front or shear line), the formation mechanisms of warm-sector heavy rainfall over southern China have not been well understood compared to frontal heavy rainfall, and thus its quantitative precipitation forecast (QPF) skill remains rather low (Luo, 2017; Luo et al., 2017). Ensemble-based analyses showed that warm-sector rainfall events have a large ensemble spread, which indicated their limited practical predictability (Du and Chen, 2018; Zhang and Meng, 2018; Wu et al., 2020). Zhang and Meng (2019) demonstrated that the quantitative precipitation forecasting skill in warm-sector heavy rainfall associated with a LLJ was generally lower than that without LLJ.
The formation of LLJs is attributed to inertial oscillation driven by turbulent vertical mixing in the boundary layer (Blackadar, 1957), diurnal thermal contrast (Holton, 1967) and their combination (Du and Rotunno, 2014). Since PBL schemes in the numerical simulation parameterize the vertical turbulent transport of momentum and heat, different PBL schemes may produce varying boundary layer structures and thus affect the simulated performance of LLJs (Salmond and McKendry, 2005; Steeneveld et al., 2008; Steeneveld, 2014). Smith et al. (2018) evaluated the WRF model’s ability to simulate nocturnal LLJs through three common boundary layer parameterization schemes, and found Quasi-Normal Scale Elimination (QNSE) run performed slightly better than Yonsei University (YSU) runs and the Mellor–Yamada Nakanishi Niino (MYNN) runs. Storm et al. (2009) demonstrated that different PBL schemes have the capability to capture some essential characteristics of the observed LLJs, such as location and timing, while the simulated LLJ wind speeds were sensitive to the PBL schemes.
A warm-sector heavy rainfall event occurred during 19–20 May 2015 at coast of South China with the maximum daily rainfall reaching 542 mm (Wu and Luo, 2016), which was one of the most intense heavy rain events during the pre-summer rainy season of that year (Luo et al., 2017). The ensemble forecasts from the European Center for Medium-Range Weather Forecasts (ECMWF) initialized at 0000 UTC 19 May or 1200 UTC 19 May completely missed this warm-sector rainfall event over the east coastal area of Guangdong Province (Shen et al., 2020). Wu and Luo (2016) analyzed this coastal warm-sector rainfall event by observations and documented that a mesoscale boundary, formed between the cold dome and the warm-and-moist air from the ocean (marine BLJ), caused the formation and maintenance of the quasi-linear-shaped MCS. Wu et al. (2020) further studied this same case by ensemble-based sensitivity analysis on the practical and intrinsic predictability and demonstrated that a stronger low-level southerly wind (marine BLJ) over the sea and a considerable surface cooling over the northern mountains were favorable for the warm-sector convection initiation. However, how the strength of simulated upstream marine BLJ influences the simulated warm-sector heavy rainfall event in the WRF model worth further study, and the response of the BLJ over the South China Sea to the planetary boundary layer (PBL) parameterization schemes is still not clear.
The objective of the current study is to examine the sensitivity of planetary boundary layer parameterization schemes in simulating warm-sector heavy rainfall over southern China associated with a marine boundary layer jet. Data and methodology used in the present study are provided in Section 2. Section 3 briefly introduces the warm-sector rainfall event we studied. The relationships between the BLJ and coastal warm-sector rainfall under different PBL schemes are investigated in Section 4. Section 5 presents the sensitivity of PBL parameterization schemes on the BLJ. Finally, concluding remarks and discussion are given in Section 6.
2 Data and method
2.1 Observational data
The radar reflectivity obtained from the S-band weather radar in Shanwei, Guangdong (station number: Z9660; the red asterisk marked in Figure 1A) is utilized to illustrate the convection initiation and upscale growth in the warm-sector heavy rainfall event. The precipitation amount at 1-h intervals from 289 surface weather stations in the analysis domain (Figures 1B, C) are used, and these weather stations are densely distributed over southern China.

FIGURE 1. (A) Domain configurations of D01 and D02 and terrain height (units: m, shaded). The circle with a radius of 230 km is centered at the S-band weather radar in Shanwei; (B) Horizontal distribution of accumulated rainfall (mm, colored dots) during 1200 UTC 19 to 0000 UTC 20 May 2015 based on surface observations from surface weather stations; (C) Horizontal distribution of 6-h accumulated rainfall (mm, colored dots) during 1500 UTC 19 to 2100 UTC 20 May 2015. The location of colored dots represents the location of these weather stations. Grey shading represents topography height (m), and Mount Lianhua and Mount Emeizhang are labeled.
2.2 Numerical model
The Weather Research and Forecasting (WRF) Model (WRF-ARW, version 4.0) was applied in this study to simulate the warm-sector heavy-rainfall event. The model is initialized at 1200 UTC 18 May 2015 with the initial and lateral boundary conditions every 6 h from National Center for Environmental Prediction (NCEP) FNL operational global analysis data with spatial resolutions of 1
The physical parameterizations used in both two domains include the Thompson microphysics scheme (Thompson et al., 2008), the Rapid Radiative Transfer Model for Global Climate Models (RRTMG) longwave and shortwave radiation schemes (Iacono et al., 2008), and the unified Noah land surface model scheme (Livneh et al., 2011). The Kain–Fritsch convection parameterization scheme (Kain, 2004) is used in D01 but not applied in D02. This model configuration is commonly used in this area and achieves good performance in simulating heavy rainfall events (Du and Chen, 2019a).
The PBL parameterization schemes and associated surface layer schemes are varied in the simulations. Six PBL schemes were applied to examine the sensitivity of the PBL schemes, including 1) the Mellor-Yamada-Janjic PBL Scheme (MYJ) (Janjić, 2002), 2) the Yonsei University PBL Scheme (YSU) (Hong et al., 2006), 3) Mellor–Yamada Nakanishi Niino (MYNN) Level 2.5 PBL Scheme (Nakanishi and Niino, 2006), 4) Asymmetric Convection Model 2 PBL Scheme (ACM2) (Pleim, 2007a; Pleim, 2007b), 5) Bougeault-Lacarrere PBL Scheme (BouLac) (Bougeault and Lacarrere, 1989), and 6) University of Washington (UW) Boundary Layer Scheme (Bretherton and Park, 2009). MYJ scheme is applied with associated MYJ surface layer scheme, while the other five PBL schemes are used with revised MM5 Monin-Obukhov surface layer scheme (Jiménez et al., 2012). MYJ scheme, MYNN2.5 scheme, BouLac scheme and UW scheme are local schemes, while YSU scheme and ACM2 scheme are non-local scheme. Considering YSU scheme is widely used to simulate warm-sector heavy rainfall events and boundary layer jet over Southern China (Zhang and Meng, 2019; Dong et al., 2020; Du et al., 2014; Du et al., 2020), and the warm-sector heavy rainfall event we studied was well simulated with YSU scheme, the YSU scheme is regarded as a control run in the present study.
2.3 Momentum balance analysis
The momentum balance analysis is conducted to investigate the controlling forcings that cause the difference of simulated LLJ by various boundary layer schemes. The horizontal momentum equation can be written as
Where the local acceleration of the x and y wind component (term I) could be decomposed into horizontal advection (term II), the Coriolis force acting on ageostrophic wind (term III), and the residual in the x and y directions (term IV).
Since the LLJ’s direction is not along the x or y direction, the horizontal momentum from (x, y) coordinates are transformed into right-hand coordinates (x’, y’), with the y’ axis pointing to the LLJ’s direction (Zhang et al., 2003; Du et al., 2014). In this way, the wind speed in the y’ axis direction could be written as
where
The momentum balance in the y’ direction (along the LLJ’s direction) can be written as:
3 Case overview
On 19–20 May 2015, a warm-sector heavy rainfall event occurred along the coastal area of Guangdong province (Figure 1B and Figure 2). This heavy rainfall was mainly maintained during 1200 UTC 19 May to 0000 UTC 20 May (Wu et al., 2020), with the 12-h accumulated precipitation (1200 UTC 19-0000 UTC 20 May) exhibits a west-east-oriented precipitation area to the south of the Mount Lianhua where rainfall amounts at 21 stations exceed 100 mm (Figure 1B).
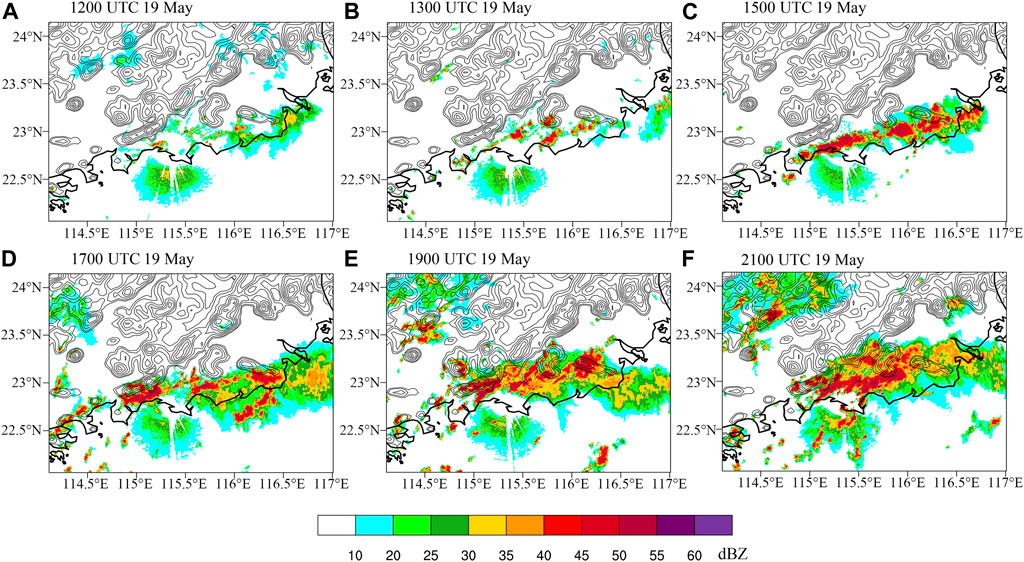
FIGURE 2. (A–F) Temporal evolution of composite radar reflectivity (unit: dBZ, shaded) from the S-band radar from 1200 UTC 19 May to 2100 UTC 19 May. Contour lines represent topography height in an interval of 100 m.
Figure 2 presents the temporal evolution of the composite radar reflectivity observed by the Shanwei S-band radar. The convection was initiated (composite radar reflectivity exceeds 35 dBZ) after sunset at around 1200 UTC 19 May (Figure 2A), and developed into a quasi-stationary well-defined nocturnal rain band along the coast and over the south of the Mount Lianhua (Figures 2B–F), leading to persistent local rainfall for more than 12 h. During this rainfall event, a boundary layer jet at 925 hPa was present over South China Sea (Shen et al., 2020), and yields a wind-speed convergence zone near the coast, where the warm-sector heavy rainfall mainly occurs (Wu et al., 2020). More detailed descriptions on this case have been introduced by Wu and Luo (2016) and Wu et al. (2020).
4 Variations of LLJ and rainfall with PBL schemes and their relationship
Figure 3 shows the temporal evolution of simulated radar reflectivity simulated by the YSU scheme. Similar to the observations, the simulated warm-sector convection was triggered over the south of the Mount Lianhua, with the radar reflectivity greater than 30 dBZ at 1200 UTC 19 May, and then was developed and maintained near the coastal terrain. The initiation and maintenance of the warm-sector heavy rainfall can be well captured by the YSU scheme, although the simulated radar reflectivity is weaker than the observations (Figure 2).
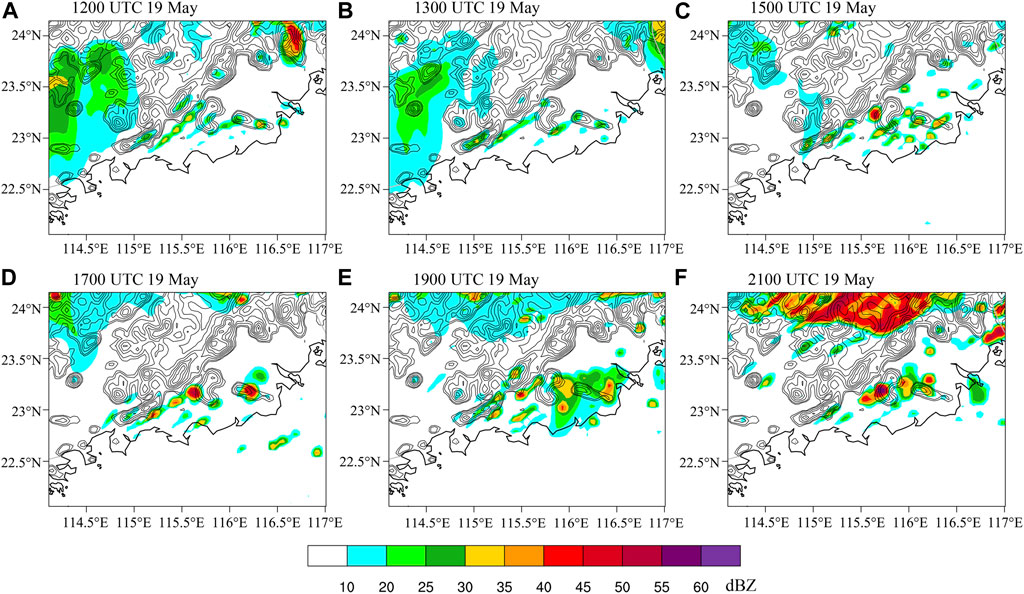
FIGURE 3. As in Figure 2, but simulated by the YSU scheme. Contour lines represent topography height in an interval of 100 m.
The variations in the 6-h accumulated precipitation from 1500 UTC to 2100 UTC 19 May, which is the most obvious period of precipitation, among the six runs with different boundary layer parameterization schemes (YSU, MYJ, MYNN2.5, ACM2, BouLac, and UW) and the observations greater than 25 mm (black dots) are presented in Figure 4. The ACM2 run did not simulate the warm-sector rainfall at all without convection initiation (Figure 4D), while simulated rainfall in the UW run is much weaker and tends to further north (Figure 4F). Except for the ACM2 and UW runs, other sensitivity runs (MYJ, MYNN, and BouLac) generally reproduce the warm-sector coastal heavy rainfall as the control run with 6-h accumulated precipitation over 50 mm (Figures 4A–C, E). The equitable threat scores (ETS) with 25-mm threshold and a radius of 20 km (5 grid points) of 6-h accumulated precipitation simulated by six schemes are calculated through a neighborhood-based method (Clark et al., 2010; Zhang and Meng, 2019). If an event is observed at a grid point, this grid point is a hit if the event is forecast at any grid point within a circular radius. Unlike the traditional point-to-point criteria, the neighborhood-based criteria avoids the punishment of small displacement errors in decent forecasts (Ebert 2008; Squitieri and Gallus 2016). Result shows that the ETS of YSU scheme (0.75) is not only significantly greater than that of ACM2 scheme (0.0) and UW scheme (0.0), but also slightly higher than the ETS of MYJ scheme (0.44), MYNN scheme (0.30) and BouLac scheme (0.52). Therefore, the simulation by YSU scheme is reasonable to select as the control run in this study.
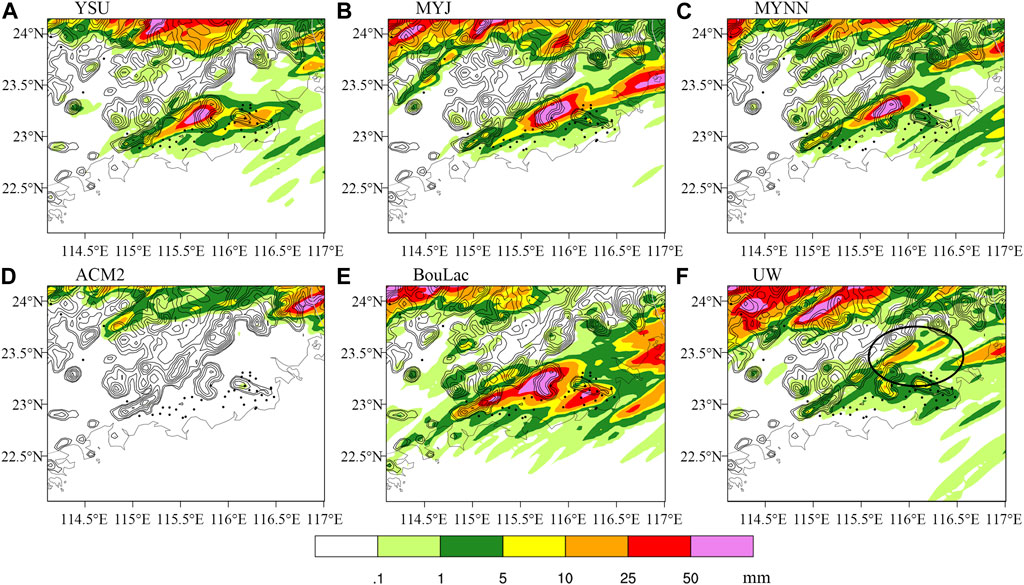
FIGURE 4. The simulated 6-h accumulated rainfall amount (shaded, mm) form 1500 UTC to 2100 UTC 19 May in the (A) YSU, (B) MYJ, (C) MYNN, (D) ACM2, (E) BouLac and (F) UW run. Black dots represent observed 6-h accumulated rainfall greater than 25 mm.
Previous studies have documented that the warm-sector heavy rainfall over southern China is closely related to the marine BLJ (Zhang and Meng, 2018; Wu et al., 2019; Zhang and Meng, 2019; Du et al., 2020a). Therefore, variations in the 950-hPa horizontal wind field simulated by different boundary layer parameterization schemes are examined (Figure 5). All sensitivity runs with different boundary layer schemes can successfully simulate the BLJ over South China Sea with wind speed greater than 12 m s−1 but with different intensity. Among those sensitivity experiments, the ACM2 run simulates the weakest BLJ with the maximum wind speed less than 17 m s−1 (Figure 5D), while the UW run simulates the strongest BLJ with the wind speed over large area greater than 18 m s−1 (Figure 5F). The coastal heavy rainfall was not well reproduced in the both runs (ACM2 and UW, Figure 4).
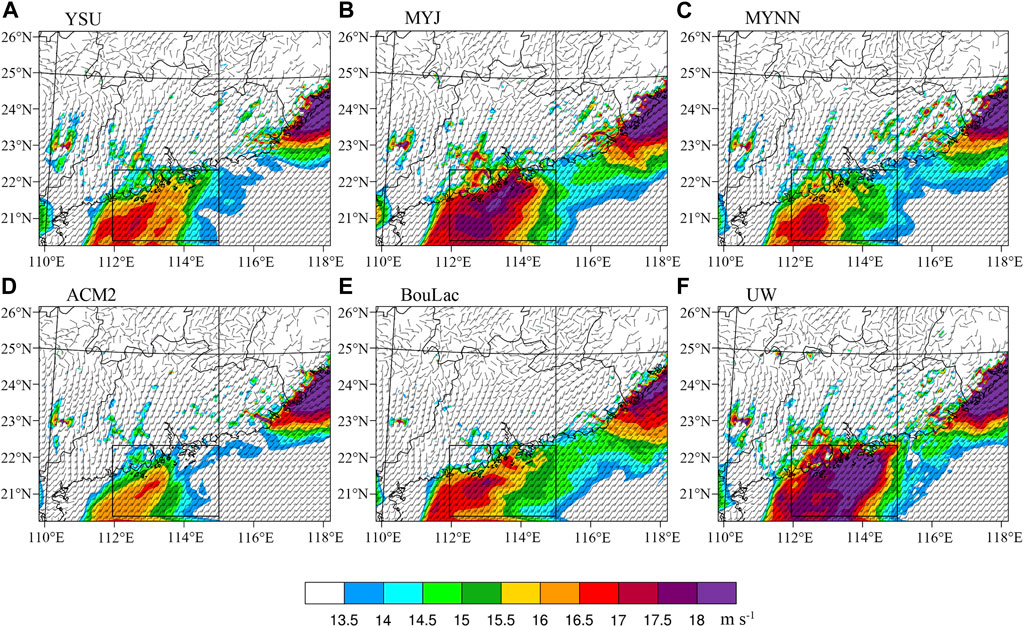
FIGURE 5. The 950-hPa horizontal wind field simulated by the (A) YSU, (B) MYJ, (C) MYNN, (D) ACM2, (E) BouLac and (F) UW scheme.
The temporal evolution of area-averaged wind speed among different PBL schemes is further presented in Figure 6. Since the location of low-level jet varies in different PBL schemes, the analysis region (black box in Figure 5) was selected to cover the center of maximum wind speed as much as possible in all schemes. Similarly, the simulated BLJ intensity undergoes strongest or weakest during the most analysis period in the UW (black line in Figure 6) or ACM2 (red line in Figure 6) runs, respectively. Next, we will explore whether the strongest or weakest BLJs simulated by the UW scheme and the ACM2 scheme leads to their poor ability to simulate the initiation and maintenance of warm-sector heavy rainfall event. Therefore, the following research mainly focus on the comparison of YSU scheme, ACM2 scheme and UW scheme in details.
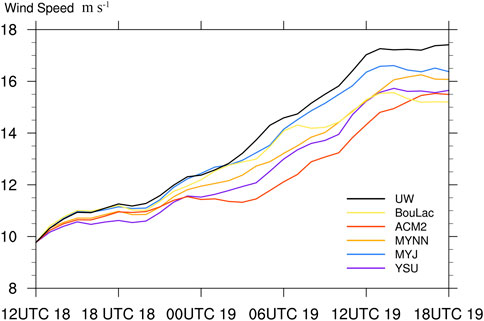
FIGURE 6. Temporal evolution of area-averaged 950-hPa wind speed over the black box in Figure 5A of different boundary layer schemes form 1200 UTC 18 May to 1800 UTC 19 May.
In order to investigate the reasons of the poor ability to simulate the initiation and maintenance of the warm-sector heavy rainfall between the ACM2 and UW runs, the difference of specific humidity at 950 hPa in the ACM2 scheme or the UW scheme and the YSU scheme are compared in Figure 7. Compared with the YSU run, the specific humidity over the south side of coastal terrain in the ACM2 run is apparently smaller by 1.5 g kg−1 (Figure 7A), which is not favorable for convection initiation. On the contrary, the specific humidity around the coastal terrain in the UW run is larger than that in the YSU run by 0.6 g kg−1, especially in the leeward slope of the coastal terrain (Figure 7B) due to the stronger upstream BLJ over the South China Sea.
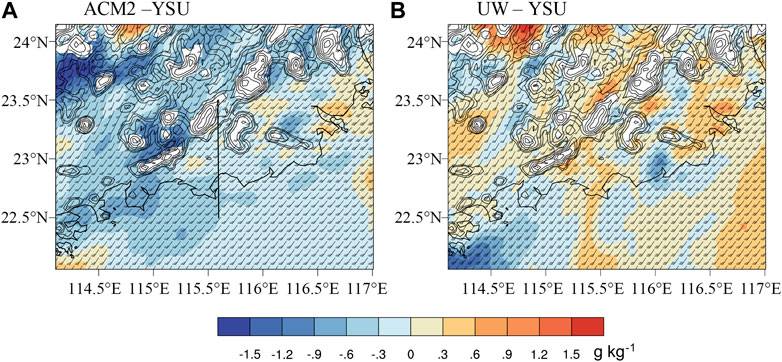
FIGURE 7. Difference of 950-hPa specific humidity at 1200 UTC 19 May between (A) the ACM2 scheme and YSU scheme, (B) the UW scheme and YSU scheme.
Furthermore, the vertical cross section of vertical motion around the rainfall center (along the black line in Figure 7A) are shown in Figure 8 at 1300 UTC 19 May. In the YSU run, the vertical cross section shows upward motions on the windward slope of coastal terrain (Figure 8A), and turn to downward motion near the mountain top and leeward slope. The difference in meridional wind and vertical motion between the ACM2 run and control run (Figure 8B) shows that the low-level meridional winds in the ACM2 run is weaker than those in the YSU scheme at around 22.8°N–23.2°N, leading to the weaker upward motion near the coastal area (Figure 8B). The upward motions in the ACM2 run are located over the sea at around 22.5°N–22.8°N (Figure 8B), where downward motions occur in the YSU run (Figure 8A). On the contrary, the low-level meridional winds simulated by the UW scheme is stronger than those in the YSU run, causing stronger upward motions in the upslope of the coastal terrain at 23.2°N (Figure 8C).
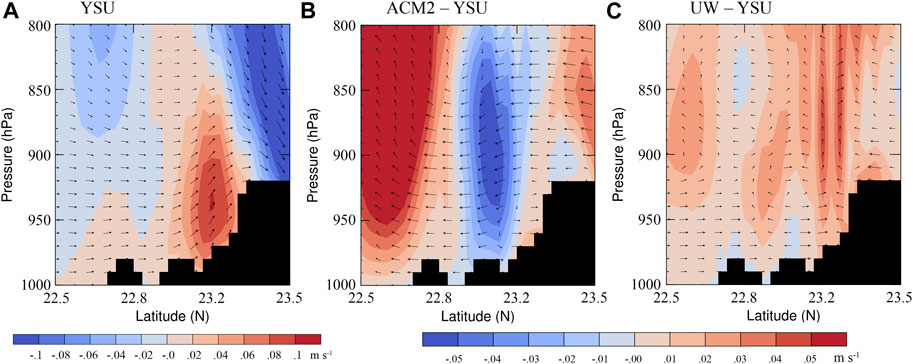
FIGURE 8. Vertical cross section of vertical motion (shading; m s−1) and wind vectors (meridional wind vs. 100
The insufficient specific humidity and upward motion in the ACM2 run indicated unfavorable conditions for the initiation of warm-sector rainfall, while the sufficient water vapor and stronger upward motion in the UW run should be beneficial to convection initiation and growth. However, the precipitation simulated by the UW scheme is much weaker and occurs to further north compared to the control run. Figure 9 presents the temporal evolution of radar reflectivity simulated by the UW scheme. Compared with the YSU scheme (Figure 3), the UW run can successfully trigger convection with the maximum radar reflectivity greater than 35 dBZ at 1,200–1300 UTC 19 May (Figures 9A, B), which is even stronger than that in the YSU run. However, after 1500 UTC 19 May, the UW run could not successfully capture the development and maintenance of convection in the windward slope of coastal terrain (Figures 9C–F). At 2100 UTC 19 May, the simulated warm-sector rainfall in the UW run developed and got matured on the lee side of Mount Emeizhang, with the maximum radar reflectivity of 55 dBZ. Different from the UW run, both the radar reflectivity observed by Shanwei S-band weather radar and simulated in the YSU run show that the convection is maintained locally and confined along the coast, especially over the southern windward slope of Mount Emeizhang (Figures 2C–F; Figures 3C–F).
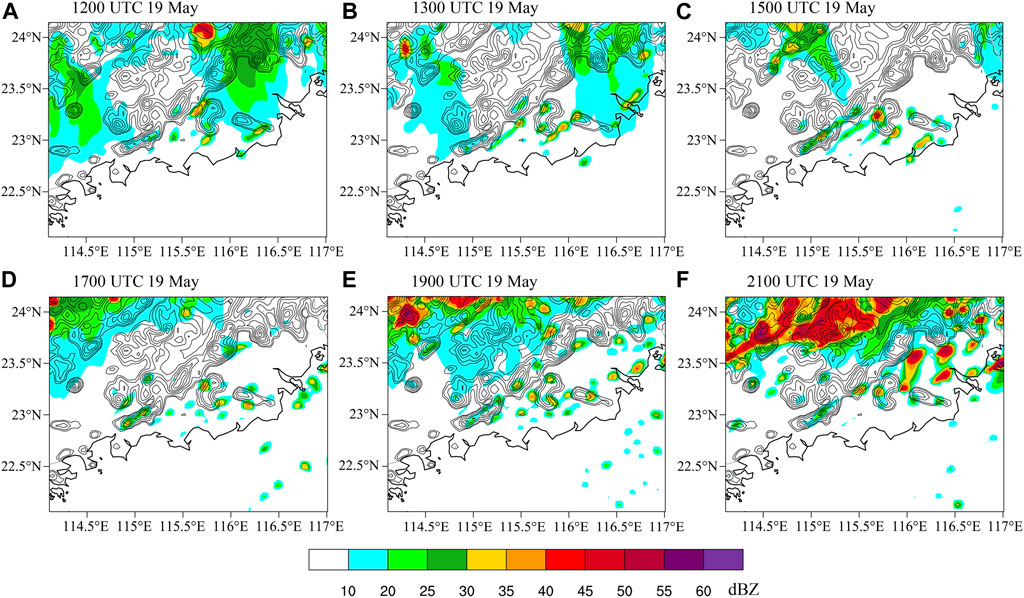
FIGURE 9. As in Figure 3, but simulated by the UW scheme.
Previous studies have documented that the cold pool generated by convection (during 0500 UTC to 1100 UTC 19 May, not shown) is an important factor for the locally development and maintenance of rainstorm over the windward slope of coastal terrain (Wu and Luo, 2016). The cold pools simulated by the UW and YSU scheme are further compared in Figure 10. Cold pool is identified as thermal buoyancy,
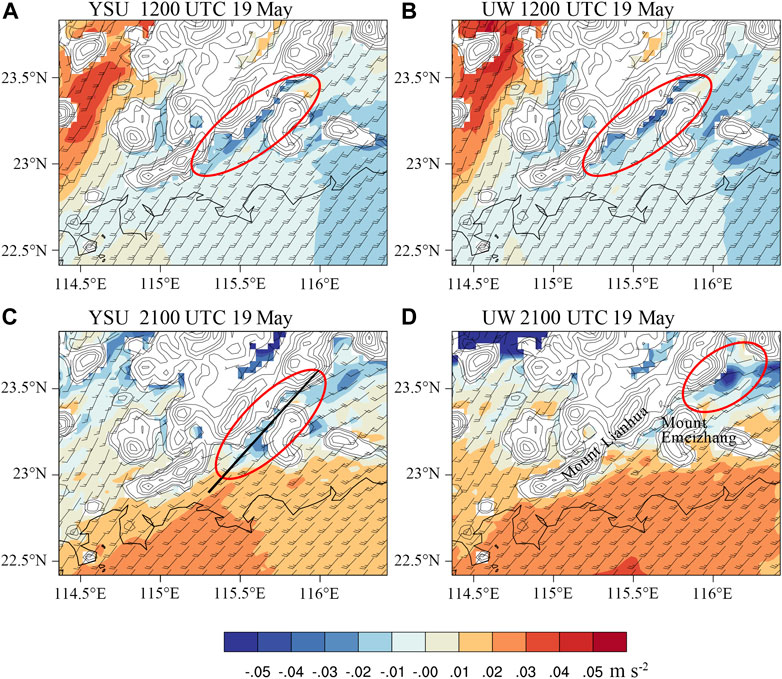
FIGURE 10. Thermal buoyancy (shaded) with wind vectors at 250 m in the (A,C) YSU scheme run, (B,D) UW scheme run at (A,B) 1200 UTC 19 May and (C,D) 2100 UTC 19 May.
Vertical cross sections of the thermal buoyancy and vertical motion along the black line in Figure 10 at 2100 UTC 19 May are further shown in Figure 11 to illustrate the uplift effect at the leading edge of the cold pool. In the YSU run, the south edge of the cold pool and related vertical motion expand southeastward to 23.1°N. In contrast, the south edge of the cold pool and strong upward motion simulated in the UW run are located to farther north (23.2°N). Since the BLJ in the UW run is stronger, the cold pool generated by previous convection moved to the northeastward accompanied by the southwesterly BLJ, rather than maintained locally. Therefore, at around 2100 UTC 19 May, the warm-sector heavy rainfall simulated in the UW run developed on the lee side of Mount Emeizhang.
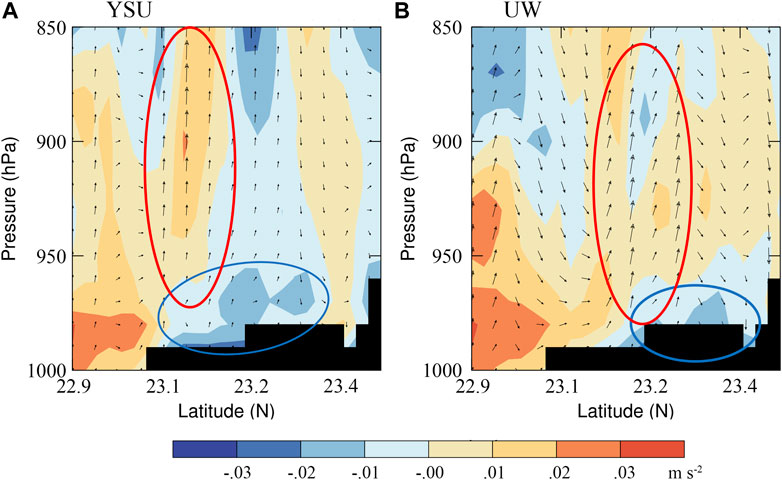
FIGURE 11. Vertical cross sections of thermal buoyancy (shading; ms−2) and wind vectors (meridional wind vs. 100 times of vertical motion) at 2100 UTC 19 May in the (A) YSU scheme run and (B) UW scheme run.
5 Sensitivity of PBL parameterization schemes on LLJ
As mentioned in the previous section, the BLJ intensity has an important influence on the occurrence and development of the warm-sector rainfall. Thus, the sensitivity of different boundary layer parameterization schemes on the BLJ intensity will be further discussed in this section.
Figure 12 shows the 950-hPa geostrophic and ageostrophic winds at 1200 UTC 19 May simulated by different boundary layer schemes (YSU, ACM2, and UW). The geostrophic winds are obtained from the smoothed geopotential height by applying a low-pass Barnes’s filter (Barnes, 1964), and the ageostrophic winds are calculated by subtracting the geostrophic winds from filtered total wind (Zeng et al., 2019; Du et al., 2020a). Due to the small area of inner domain (D02), proper filtered results cannot be obtained from D02. Thus, filtered geostrophic and ageostrophic winds are obtained from D01 instead. A low-pressure vortex (red box in Figures 12A, D) occurred over the eastern coastal area, and the BLJ was located on the southwest of the vortex. The vortex intensity is varied among the three sensitivity experiments. The vortex simulated by the UW scheme is strongest with a largest area of the geopotential height lower than 475 geopotential meters at 950 hPa, and the minimum geopotential height reaches 470 geopotential meters. The corresponding southwesterly geostrophic and nearly southerly ageostrophic wind over the southwest or south side of the vortex (especially over the South China Sea) become strongest in the UW run. On the contrary, the vortex simulated by the ACM2 scheme becomes weakest, with the minimum geopotential height of 477.3 geopotential meters. Accordingly, the geostrophic and ageostrophic winds associated with the vortex are weakest in the ACM2 run. As for the YSU scheme, the intensity of the geostrophic wind, ageostrophic wind and vortex is between the ACM2 scheme and UW scheme.
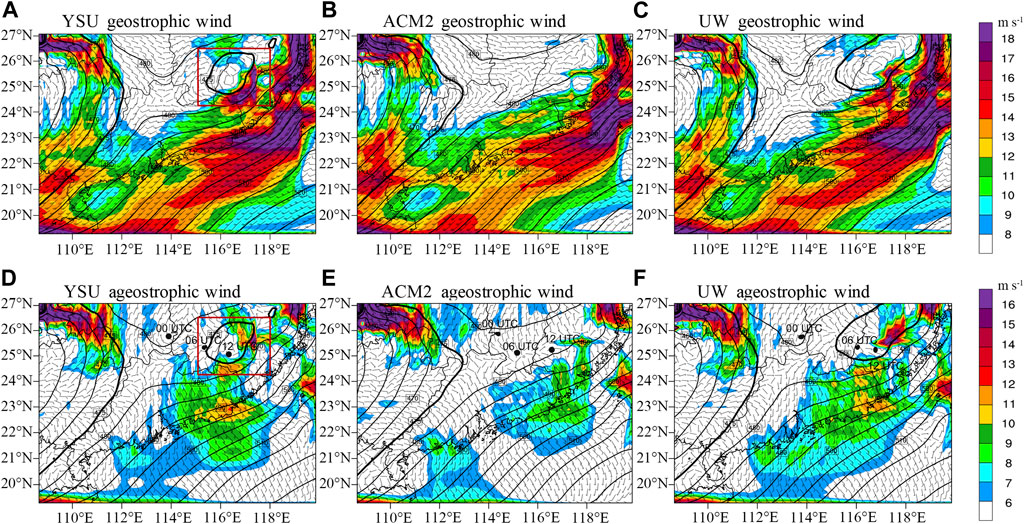
FIGURE 12. Horizontal distributions of (A,C) geostrophic wind and (D–F) ageostrophic wind velocity (shading; ms−1) and wind vectors at 950 hPa at 1200 UTC 19 May in the (A,D) YSU scheme run, (B,E) ACM2 scheme run and (C,F) UW scheme run. Black spots in Figures 12D–F represent the minimum geopotential height of the vortex at 0000 UTC, 0600 UTC and 1200 UTC 19 May in the YSU scheme run, ACM2 scheme run and UW scheme run, respectively.
Furthermore, the momentum budgets at 950 hPa over the BLJ region are calculated for the different sensitivity experiments, as shown in Figure 13. The local acceleration of the BLJ in the UW run (black line in Figure 13A) is apparently larger than that in the YSU run and in the ACM2 run especially during 2000 UTC 18 May to 1000 UTC 19 May (between the two dash lines in Figure 13A), and the ACM2 run presents the minimum local acceleration (red line in Figure 13A). Hence, individual terms in the horizontal momentum equation are calculated averaged over 2000 UTC 18 May to 1000 UTC 19 May. It is found that the smaller (larger) effect of Coriolis force on ageostrophic wind is one of reasons for the weaker (stronger) BLJ simulated by the ACM2 scheme (UW scheme) (Figure 13B). The veering ageostrophic winds are found in the three sensitivity experiments but with different rotation amplitudes (Figure 13C). The results above indicate the role of inertial oscillation, which makes the ageostrophic winds gradually veer to southwesterly that is the direction of the BLJ. The strongest inertial oscillation in the UW run leads to the strongest BLJ. In addition to the inertial oscillation, the horizontal advection also contributes to the difference of the BLJ intensity. Since the low-pressure vortex moves from west to east (black spots in Figures 12D–F), the effect of horizontal advection is attributed to the movement of the vortex.

FIGURE 13. (A) Temporal evolution of the local acceleration of the BLJ (winds at 950 hPa) simulated by different PBL schemes, (B) individual terms in the horizontal momentum equation at the 950-hPa level averaged over 2000 UTC 18 May to 1000 UTC 19 May, and (C) clockwise rotation of mean 950-hPa ageostrophic wind, averaged over the black box in Figure 5A.
The differences in the vortex intensity simulated by different boundary layer schemes might be caused by varying turbulence intensity. The vertical velocity variance
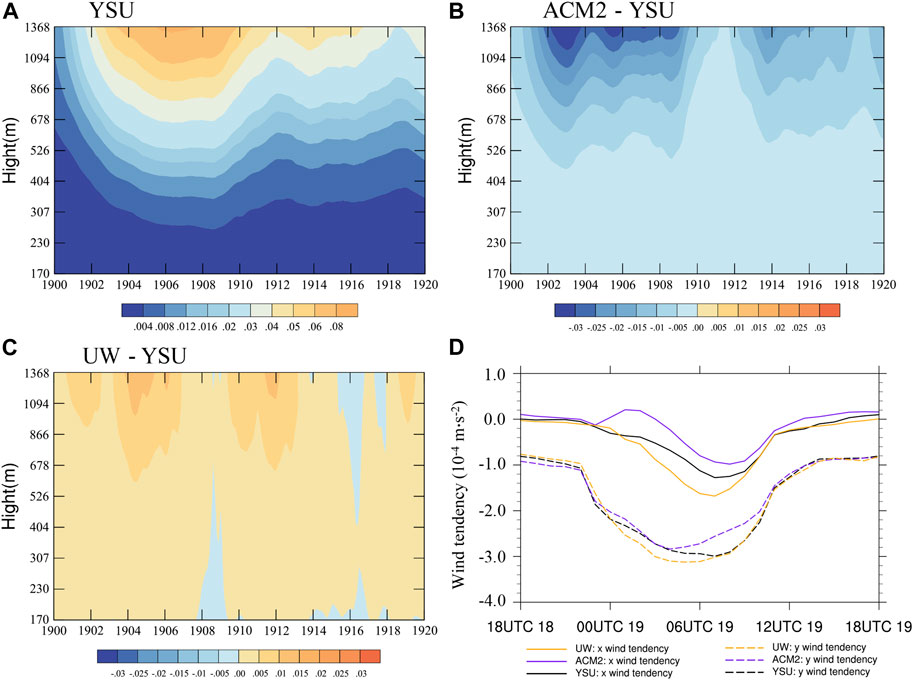
FIGURE 14. Temporal evolution of the vertical velocity variance

FIGURE 15. (A) Vertical profile of the difference of temperature between the ACM2 scheme and YSU scheme (purple line), and between UW scheme and YSU scheme (orange line) averaged over the low-level disturbance (red box in Figure 12D) at 0900 UTC 19 May; and the differences of
The wind tendencies contributed by PBL parameterization are also used to estimate turbulent mixing intensity directly. The wind tendencies in the x and y directions are averaged over the land of domain 2 below 1 km height. Figure 14D shows that the negative wind tendencies in the UW (ACM2) scheme are more (less) apparent compared to the YSU scheme, especially during the daytime (0000 UTC 19 May to 1200 UTC 19 May). The results indicate that PBL schemes produce weakest turbulent mixing in ACMs and strongest turbulent mixing in UW, which is consistent well with
Furthermore, varying temperature stratification caused by the boundary layer turbulent mixing can affect the intensity of low-pressure vortex. Compared to the YSU scheme, the lower temperature at the upper layer due to the weaker turbulent mixing of the ACM2 scheme (Figure 15A) mainly accounts for the weaker low-pressure disturbance at 950 hPa simulated by ACM2 scheme. The change of geopotential height (z) can be expressed as (Markowski and Richardson, 2010):
where
Because of the larger (small) vertical temperature gradient in ACM2 (UW) scheme (Figure 15A), the negative change of geopotential height above 950 hPa simulated by the ACM2 (UW) scheme is less (more) than that in YSU scheme (Figures 15B, C), resulting in a weaker (stronger) low-pressure vortex simulated by the ACM2 (UW) scheme.
The reason from the PBL schemes itself might play an important role in BLJ formation. The UW scheme is characterized by the use of moist-conserved variables, an explicit entrainment closure, downgradient diffusion of momentum, and conserved scalars within turbulent layers (Bretherton and Park, 2009), so the entrainment parameterization of the UW moist turbulence scheme and the updraft microphysics can be easily extended (Park and Bretherton, 2009), indicating stronger turbulent mixing intensity. Yang et al. (2013) also documented that the UW scheme with a moist turbulence parameterization overpredict the height of the low-level jet and the wind speed. The turbulent mixing intensity of the ACM2 scheme is relative weak in this case, so the higher temperature near the surface layer cannot be fully mixed with the lower temperature in the upper layer during the daytime, resulting in a weaker vortex and further smaller effect of Coriolis force on ageostrophic wind. According to Hong et al. (2006), the YSU scheme decreases boundary layer mixing in the mechanically induced forced convection regime, so that the excessive mixing in the mixed layer in the presence of strong winds is resolved. Jiménez et al. (2012) also documented that an increase in Prandtl number for unstable conditions is utilized the YSU scheme, which will result in weaker mixing during daytime. Under these circumstances, the turbulent mixing intensity simulated by YSU scheme is weaker than that in UW scheme in this study, resulting in weaker BLJ compared with that in UW scheme.
6 Summary and discussion
In this study, the WRF model is used to investigate the sensitivity of planetary boundary layer (PBL) parameterization schemes in simulating boundary layer jet (BLJ) over South China Sea and its downstream warm-sector heavy rainfall during 19–20 May 2015 at the coast of South China.
Six PBL parameterization schemes are examined in the present study including YSU, MYJ, MYNN, ACM2, BouLac, and UW. Expect for the ACMs and UW schemes, YSU, MYJ, MYNN, and BouLac schemes can generally simulate the warm-sector coastal heavy rainfall with 6-h accumulated precipitation exceeding 50 mm. No convection initiation is found in the ACM2 run, while simulated coastal rainfall is relatively weak and occurs to further north in the UW run.
All the six boundary layer schemes can simulate the boundary layer jet over the South China Sea with a wind speed greater than 12 m s−1 at 950 hPa, but with the varying jet’s intensity. The ACM2 run simulates the weakest BLJ, while the UW run produces the strongest BLJ among the sensitivity experiments.
Compared with the YSU run, the weaker BLJ induces weaker convergence and lifting as well as less water vapor transport over the south side of Mount Lianhua in the ACM2 run, which are not favorable for the convection initiation and growth. On the contrary, the UW scheme can successfully simulate the convection initiation of warm-sector heavy rainfall on the south side of mountains with a maximum radar reflectivity of 35 dBZ, but the development and maintenance of convection in upwind side of Mount Emeizhang are not well preformed. The too strong BLJ in the UW run results in the northward movement of the cold pool associated with convection, and thus yields the development of convection on the leeside of Mount Emeizhang.
Variations in boundary layer mixing over land among different PBL schemes results in different vertical temperature stratification and further affects the intensity of low-pressure vortex at low levels. The weaker (stronger) mixing intensity of ACM2 scheme (UW scheme) induces the weaker (stronger) low-pressure vortex. Furthermore, the varying intensity of the low-pressure vortex with different PBL schemes causes different strength of BLJs on the south side of the vortex through veering ageostrophic wind.
The sensitivity of different PBL schemes in precipitation has been widely discussed in previous studies. The evolution of convective systems and associated rainfall is found to be highly sensitive to the PBL parameterization (Xu and Zhao, 2000; Que et al., 2016). Previous studies have also pointed out high sensitivity of simulated heavy rainfall in South China to the PBL schemes (Cai et al., 2005; Zhao, 2008; Dong et al., 2019). The different boundary layer schemes cause varying divergence fields, and further affect the rainfall forecasting performance in South China (Cai et al., 2005). However, few studies have focused on the sensitivity of the BLJ over the South China Sea to the PBL parameterization, even if it is known that the southerly marine BLJ plays an important role in warm-sector coastal heavy rainfall (Luo et al., 2017; Du and Chen, 2018; Zhang and Meng, 2018). Thus, we innovatively regard the BLJ as a bridge to explore the effects of PBL schemes on the heavy rainfall associated with BLJs. The results can also implicit the influence mechanisms of BLJs on heavy rainfall from a perspective of numerical simulations and forecasts.
In summary, the present study suggests that simulated marine boundary layer jet over the South China Sea and associated precipitation are sensitive to the PBL schemes. However, it is unreasonable to conclude that one particular scheme is better or worse than others on simulating warm-sector heavy rainfall only through a case study. Besides, the initial perturbations and lateral boundary conditions were also sensitive to heavy rainfall events. Therefore, we plan to simulate more similar warm-sector heavy rainfall events associated with a marine boundary layer jet over southern China, to statistically study which boundary layer scheme is the best on simulating warm-sector heavy rainfall event in South China.
Data availability statement
Publicly available datasets were analyzed in this study. This data can be found here: https://rda.ucar.edu/datasets/ds083.2/index.html#!description.
Author contributions
YS and YD contributed to the idea and research of the study. YS contributed to the data processing and prepared the original draft, YD edited and reviewed the manuscript. All authors have read and agreed to the submitted version.
Funding
The study was supported by the Guangdong Major Project of Basic and Applied Basic Research (2020B0301030004), the National Natural Science Foundation of China (Grant Nos. 42075006, 42122033, and 41875055), and Guangzhou Science and Technology Plan Projects (202002030346).
Conflict of interest
The authors declare that the research was conducted in the absence of any commercial or financial relationships that could be construed as a potential conflict of interest.
Publisher’s note
All claims expressed in this article are solely those of the authors and do not necessarily represent those of their affiliated organizations, or those of the publisher, the editors and the reviewers. Any product that may be evaluated in this article, or claim that may be made by its manufacturer, is not guaranteed or endorsed by the publisher.
References
Barnes, S. L. (1964). A technique for maximizing details in numerical weather map analysis. J. Appl. Meteor. 3, 396–409. doi:10.1175/1520-0450(1964)0030396:ATFMDI.2.0.CO;2
Blackadar, A. K. (1957). Boundary layer wind maxima and their significance for the growth of nocturnal inversions. Bull. Am. Meteorological Soc. 38, 283–290. doi:10.1175/1520-0477-38.5.283
Bonin, T. A., Blumberg, W. G., Klein, P. M., and Chilson, P. B. (2015). Thermodynamic and turbulence characteristics of the south- ern great plains nocturnal boundary layer under differing turbulent regimes. Boundary-Layer Meteorol. 157, 401–420. doi:10.1007/s10546-015-0072-2
Bonin, T. A., Klein, P. M., and Chilson, P. B. (2020). Contrasting characteristics and evolution of southerly low-level jets during different boundary-layer regimes. Boundary-Layer Meteorol. 174 (2), 179–202. doi:10.1007/s10546-019-00481-0
Bougeault, P., and Lacarrere, P. (1989). Parameterization of orography–induced turbulence in a mesobeta–scale model. Mon. Weather Rev. 117, 1872–1890. doi:10.1175/1520-0493(1989)117<1872:pooiti>2.0.co;2
Bretherton, C. S., and Park, S. (2009). A new moist turbulence parameterization in the Community Atmosphere Model. J. Clim. 22, 3422–3448. doi:10.1175/2008JCLI2556.1
Cai, R., Wang, H., Wang, W., and Mao, S. (2005). Comparison analysis of different boundary layer parameterization schemes in the numerical simulation of torrential rain. Guangdong Meteorol. 01, 6–8. doi:10.3969/j.issn.1007-6190.2005.01.003
Clark, A. J., Gallus, W. A., and Weisman, M. L. (2010). Neighborhood-based verification of precipitation forecasts from convection-allowing NCAR WRF model simulations and the operational NAM. Weather Forecast. 25 (5), 1495–1509. Available at:https://journals.ametsoc.org/view/journals/wefo/25/5/2010waf222240. doi:10.1175/2010waf2222404.1
Ding, Y. (1994). Monsoons over China. Netherlands: Kluwer Academic Publishers, 419. doi:10.1007/978-94-015-8302-2
Dong, F., Zhang, L., Chen, W., Li, D., Wang, J., and Zhi, X. (2020). Role of boundary layer jet in the occurrence and development of warm-sector heavy rainfall over SouthSouth China: A case study. IOP Conf. Ser. Earth Environ. Sci. 603, 012023. doi:10.1088/1755-1315/603/1/012023
Dong, M., Ji, C., Chen, F., and Wang, Y. (2019). Numerical study of boundary layer structure and rainfall after landfall of typhoon fitow (2013): Sensitivity to planetary boundary layer parameterization. Adv. Atmos. Sci. 36 (4), 431–450. doi:10.1007/s00376-018-7281-9
Du, Y., and Chen, G. (2019b). Climatology of low-level jets and their impact on rainfall over southern China during the early-summer rainy season. J. Clim. 32, 8813–8833. doi:10.1175/JCLI-D-19-0306.1
Du, Y., Chen, G., Han, B., Bai, L., and Li, M. (2020b). Convection initiation and growth at the coast of SouthSouth China. Part II: Effects of the terrain, coastline, and cold pools. Mon. Weather Rev. 148 (9), 3871–3892. doi:10.1175/MWR-D-20-0090.1
Du, Y., Chen, G., Han, B., Mai, C., Bai, L., and Li, M. (2020a). Convection initiation and growth at the coast of SouthSouth China. Part I: Effect of the marine boundary layer jet. Mon. Weather Rev. 148 (9), 3847–3869. doi:10.1175/MWR-D-20-0089.1
Du, Y., and Chen, G. (2018). Heavy rainfall associated with double low-level jets over southern China. Part I: Ensemble-Based analysis. Mon. Weather Rev. 146, 3827–3844. doi:10.1175/MWR-D-18-0101.1
Du, Y., and Chen, G. (2019a). Heavy rainfall associated with double low-level jets over southern China. Part II: Convection initiation. Mon. Weather Rev. 147, 543–565. doi:10.1175/MWR-D-18-0102.1
Du, Y., and Rotunno, R. (2014). A simple analytical model of the nocturnal low-level jet over the great plains of the United States. J. Atmos. Sci. 71 (10), 3674–3683. doi:10.1175/JAS-D-14-0060.1
Du, Y., Shen, Y., and Chen, G. (2022). Influence of coastal marine boundary layer jets on rainfall in SouthSouth China. Adv. Atmos. Sci. 39, 782–801. doi:10.1007/s00376-021-1195-7
Du, Y., Zhang, Q., Chen, Y., Zhao, Y., and Wang, X. (2014). Numerical simulations of spatial distributions and diurnal variations of low-level jets in China during early summer. J. Clim. 27 (15), 5747–5767. doi:10.1175/JCLI-D-13-00571.1
Ebert, E. E. (2008). Fuzzy verification of high-resolution gridded forecasts: A review and proposed framework. Meteorol. Appl. 15, 51–64. doi:10.1002/met.25
Holton, J. R. (1967). The diurnal boundary layer wind oscillation above sloping terrain. Tellus 19, 199–205. doi:10.1111/j.2153.3490.1967.tb01473.x
Hong, S. Y., Noh, Y., and Dudhia, J. (2006). A new vertical diffusion package with an explicit treatment of entrainment processes. Mon. Weather Rev. 134, 2318–2341. doi:10.1175/MWR3199.1
Iacono, M. J., Delamere, J. S., Mlawer, E. J., Shephard, M. W., and Collins, W. D. (2008). Radiative forcing by long–lived greenhouse gases: Calculations with the AER radiative transfer models. J. Geophys. Res. Atmos. 113, D13103. doi:10.1029/2008JD009944
Janjić, Z. I. (2002). Nonsingular implementation of the mellor–yamada level 2.5 scheme in the NCEP meso model. NCEP Off. Note 437, 61.
Jiménez, P. A., Dudhia, J., González-Rouco, J. F., Navarro, J., Montávez, J. P., and García-Bustamante, E. (2012). A revised scheme for the WRF surface layer formulation. Mon. Weather Rev. 140, 898–918. doi:10.1175/MWR-D-11-00056.1
Kain, J. S. (2004). The Kain–Fritsch convective parameterization: An update. J. Appl. Meteorology 43, 170–181. doi:10.1175/1520-0450(2004)043<0170:tkcpau>2.0.co;2
Li, X., and Du, Y. (2021). Statistical relationships between two types of heavy rainfall and low-level jets in SouthSouth China. J. Clim. 34 (21), 8549–8566. doi:10.1175/JCLI-D-21-0121.1
Livneh, B, Restrepo, P. J., and Lettenmaier, D. P. (2011). Development of a unified land model for prediction of surface hydrology and land-atmosphere interactions. J. Hydrometeorol. 12, 1299–1320. doi:10.1175/2011JHM1361.1
Luo, Y. (2017). Advances in understanding the early-summer heavy rainfall over South China. Glob. Monsoon Syst. Res. Forecast 9, 215–226. World scientific series on asia-pacific weather and climate. World Scientific. doi:10.1142/9789813200913_0017
Luo, Y., Zhang, R., Wan, Q., Wang, B., Wong, W. K., Hu, Z., et al. (2017). The southern China monsoon rainfall experiment (SCMREX). Bull. Am. Meteorological Soc. 98 (5), 999–1013. doi:10.1175/BAMS-D-15-00235.1
Markowski, P., and Richardson, Y. (2010). Mesoscale Meteorology in midlatitudes. Wiley Blackwell. doi:10.1002/9780470682104
Nakanishi, M., and Niino, H. (2006). An improved mellor–yamada level 3 model: Its numerical stability and application to a regional prediction of advection fog. Boundary-Layer Meteorol. 119, 397–407. doi:10.1007/s10546-005-9030-8
Park, S., and Bretherton, C. S. (2009). The university of Washington shallow convection and moist turbulence schemes and their impact on climate simulations with the community atmosphere model. J. Clim. 22 (12), 3449–3469. Available at:https://journals.ametsoc.org/view/journals/clim/22/12/2008jcli2557. doi:10.1175/2008jcli2557.1
Pleim, J. E. (2007a). A combined local and nonlocal closure model for the atmospheric boundary layer. Part I: Model description and testing. J. Appl. Meteorology Climatol. 46, 1383–1395. doi:10.1175/JAM2539.1
Pleim, J. E. (2007b). A combined local and nonlocal closure model for the atmospheric boundary layer. Part II: Application and evaluation in a mesoscale meteorological model. J. Appl. Meteorology Climatol. 46, 1396–1409. doi:10.1175/JAM2534.1
Que, Lin-Jing., Que, Wei-Lun., and Feng, Jin-Ming. (2016). Intercomparison of different physics schemes in the WRF model over the Asian summer monsoon region. Atmos. Ocean. Sci. Lett. 9 (3), 169–177. doi:10.1080/16742834.2016.1158618
Salmond, J. A., and McKendry, I. G. (2005). A review of turbulence in the very stable nocturnal boundary layer and its implications for air quality. Prog. Phys. Geogr. 29, 171–188. doi:10.1191/0309133305pp442ra
Shen, Y., Du, Y., and Chen, G. (2020). Ensemble sensitivity analysis of heavy rainfall associated with three MCSs coexisting over southern China. J. Geophys. Res. Atmos. 125, e2019JD031266. doi:10.1029/2019JD031266
Smith, E. N., Gibbs, J. A., Evgeni, F., and Klein, P. M. (2018). WRF model study of the great plains low-level jet: Effects of grid spacing and boundary layer parameterization. J. Appl. Meteorology Climatol. 57, 2375–2397. doi:10.1175/JAMC-D-17-0361.1
Squitieri, B. J., and Gallus, W. A. (2016). WRF forecasts of great plains nocturnal low-level jet-driven MCSs. Part I: Correlation between low-level jet forecast accuracy and MCS precipitation forecast skill. Weather Forecast. 31 (4), 1301–1323. Available at:https://journals.ametsoc.org/view/journals/wefo/31/4/waf-d-15-0151_1.xml. doi:10.1175/waf-d-15-0151.1
Steeneveld, G.-J. (2014). Current challenges in understanding and forecasting stable boundary layers over land and ice. Front. Environ. Sci. 2, 1–6. doi:10.3389/fenvs.2014.00041
Steeneveld, G.-J., Mauritsen, T., de Bruijn, E. I. F., Vilà-Guerau de Arellano, J., Svensson, G., and Holtslag, A. (2008). Evaluation of limited-area models for the representation of the diurnal cycle and contrasting nights in CASES-99. J. Appl. Meteorology Climatol. 47, 869–887. doi:10.1175/2007JAMC1702.1
Storm, B., Dudhia, J., Basu, S., Swift, A., and Giammanco, I. (2009). Evaluation of the weather research and forecasting model on forecasting low-level jets: Implications for wind energy. Wind Energy 12 (1), 81–90. doi:10.1002/we.288
Thompson, G., Field, P. R., Rasmussen, R. M., and Hall, W. D. (2008). Explicit forecasts of winter precipitation using an improved bulk microphysics scheme. Part II: Implementation of a new snow parameterization. Mon. Weather Rev. 136, 5095–5115. doi:10.1175/2008MWR2387.1
Wu, M., and Luo, Y. (2016). Mesoscale observational analysis of lifting mechanism of a warm-sector convective system producing the maximal daily precipitation in China mainland during pre-summer rainy season of 2015. J. Meteorological Res. 30 (5), 719–736. doi:10.1007/s13351-016-6089-8
Wu, N., Ding, X., Wen, Z., Chen, G., Min, J., Lin, L., et al. (2019). Contrasting frontal and warm-sector heavy rainfalls over south China during the early-summer rainy season. Atmos. Res. 235, 104693. doi:10.1016/j.atmosres.2019.104693
Wu, N., Zhuang, X., Min, J., and Meng, Z. (2020). Practical and intrinsic predictability of a warm-sector torrential rainfall event in the South China monsoon region. J. Geophys. Res. Atmos. 125, e2019JD031313. doi:10.1029/2019JD031313
Xu, L. R., and Zhao, M. (2000). The influences of boundary layer parameterization schemes on mesoscale heavy rain system. Adv. Atmos. Sci. 17, 458–472. doi:10.1007/s00376-000-0036-3
Yang, Q., Berg, L. K., Pekour, M., Fast, J. D., Newsom, R. K., Stoelinga, M., et al. (2013). Evaluation of WRF-predicted near-hub-height winds and ramp events over a pacific northwest site with complex terrain. J. Appl. Meteorology Climatol. 52 (8), 1753–1763. Available at:https://journals.ametsoc.org/view/journals/apme/52/8/jamc-d-12-0267.1.xml. doi:10.1175/jamc-d-12-0267.1
Zeng, W., Chen, G., Du, Y., and Wen, Z. (2019). Diurnal variations of low-level winds and precipitation response to large-scale circulations during a heavy rainfall event. Mon. Wea. Rev. 147, 3981–4004. doi:10.1175/MWR-D-19-0131.1
Zhang, M., and Meng, Z. (2018). Impact of synoptic-scale factors on rainfall forecast in different stages of a persistent heavy rainfall event in south China. J. Geophys. Res. Atmos. 123 (7), 3574–3593. doi:10.1002/2017JD028155
Zhang, M., and Meng, Z. (2019). Warm-sector heavy rainfall in southern China and its WRF simulation evaluation: A low-level-jet perspective. Mon. Weather Rev. 147, 4461–4480. doi:10.1175/MWR-D-19-0110.1
Zhang, Q., Lau, K., Kuo, Y., and Chen, S. J. (2003). A numerical study of a mesoscale convective system over the Taiwan strait. Mon. Weather Rev. 131 (6), 1150–1170. doi:10.1175/1520-0493(2003)131<1150:ansoam>2.0.co;2131<1150:ANSOAM>2.0.CO;2)
Zhao, M. (2008). A review of the research on the effects of boundary layer and land surface process on heavy rain in China. Torrential Rain Disasters 02, 186–190. (in Chinese).
Keywords: warm-sector heavy rainfall, PBL schemes, low-level jet, South China, numerical simulation
Citation: Shen Y and Du Y (2023) Sensitivity of boundary layer parameterization schemes in a marine boundary layer jet and associated precipitation during a coastal warm-sector heavy rainfall event. Front. Earth Sci. 10:1085136. doi: 10.3389/feart.2022.1085136
Received: 31 October 2022; Accepted: 15 December 2022;
Published: 10 January 2023.
Edited by:
Chunlei Liu, Guangdong Ocean University, ChinaReviewed by:
Yu Zhang, Guangdong Ocean University, ChinaJian-Feng Gu, University of Reading, United Kingdom
Copyright © 2023 Shen and Du. This is an open-access article distributed under the terms of the Creative Commons Attribution License (CC BY). The use, distribution or reproduction in other forums is permitted, provided the original author(s) and the copyright owner(s) are credited and that the original publication in this journal is cited, in accordance with accepted academic practice. No use, distribution or reproduction is permitted which does not comply with these terms.
*Correspondence: Yu Du, ZHV5dTdAbWFpbC5zeXN1LmVkdS5jbg==
 Yian Shen
 Yu Du
Yu Du