 Lingxin Huang
 Song Feng2
 Jie Chen
 Yajie Deng
 Fahu Chen
 Wei Huang
95% of researchers rate our articles as excellent or good
Learn more about the work of our research integrity team to safeguard the quality of each article we publish.
Find out more
ORIGINAL RESEARCH article
Front. Earth Sci. , 12 January 2023
Sec. Quaternary Science, Geomorphology and Paleoenvironment
Volume 10 - 2022 | https://doi.org/10.3389/feart.2022.1083899
This article is part of the Research Topic Integration of Records and Simulations in Paleoclimatology View all 7 articles
Tibetan Plateau (TP) is strongly impacted by accelerated anthropogenic warming that already exceeds natural variability. However, the spatial differences in climate and ecosystem response in TP between anthropogenic and natural forcings are unclear. Here, the Köppen–Trewartha climate classification is applied to examine the shifts in terrestrial climate regimes and vegetation distribution in TP by analyzing the WorldClim high-resolution downscaled climate dataset for the mid-Holocene (MH, ∼6 cal ka BP), the present-day (PD, 1960–1990), and in the future (2050s) under the Representative Concentration Pathway (RCP) 4.5 and RCP8.5 scenarios. The results show that the polar climate and the dry climate occupied more than 70% of TP area in the three periods. The MH, dominated by the natural forcing, is featured as having less distribution of dry climate than the PD. The anthropogenic change will promote a transition from a cold climate type to a warmer climate type in the 2050s. The precipitation change is responsible for the differences in climate types between the MH and PD, while warming dominates the evolution of climate types across TP in the 2050s. Moreover, vegetation types can be represented by major climate types in a large proportion of TP. In particular, polar climate regions correspond well to the areas of meadows, and the dry climate regions correspond to the steppes and deserts areas. The large changes in the climate regimes of TP suggest an extensive (shrinking) area of meadows (steppes) under natural forcing and a shrinking area of meadows under anthropogenic warming.
The sixth assessment report of the Intergovernmental Panel on Climate Change (IPCC AR6) pointed out that the anthropogenic warming of the last 50 years has been unprecedented in amplitude and scale over the past 2,000 years (IPCC, 2021). As a driver and amplifier of global climate change (Pan and Li, 1996), Tibetan Plateau (TP) has twice the rate of warming than the global average during the past 50 years (Chen et al., 2015). Given the sensitive and fragile natural environment and ecosystem, the warming not only grows the risk of disasters, such as glacial lake outburst disasters, landslides, and debris flows (Chen et al., 2015; Cui and Jia, 2015), but also has a direct impact on the TP’s snow cover, permafrost, glacier, and vegetation (Yao et al., 2012, 2019). Recent warming results from human activities, predominantly burning fossil fuels, intensifying radiative forcing from anthropogenic greenhouse gas emissions (IPCC, 2021).
In addition to the current warm period, many studies have confirmed that the global climate has been characterized by episodic warm/cold periods. The Holocene is the latest interglacial, during which typical warm periods exist. Shi et al. (1992) used proxies to show that the Holocene Megathermal in China occurred during 8.5–3.0 cal ka BP. Mid-Holocene was defined as 8.4–4.2 cal ka BP based on the global cold events by International Commission on Stratigraphy (Cohen et al., 2018). Seasonal insolation has an irreplaceable role in adjusting the temperature variability due to the differences in the latitudinal and seasonal distribution of solar radiation (insolation) caused by orbital forcing between the mid-Holocene and the present (Otto-Bliesner et al., 2017). Integrated high-quality records of TP, Chen F. et al. (2020) found that TP experienced a warming summer in the mid-Holocene when the pollen records revealed the most extensive forest coverage. The warm period of the mid-Holocene provides a historical analog for TP ecosystem changes under natural conditions because anthropogenic forcing strongly intensifies since 2 cal ka BP (Manoj et al., 2020; Chen et al., 2021). Therefore, a question arises: Is there any difference in ecosystem responses under natural conditions and persistent anthropogenic warming? Answering the question is of great significance for understanding how the TP ecosystem will respond to climate change under continued warming in the future.
The Köppen climate classification is a simply implemented method, and it can be used to assess the impact of climate change on the ecosystem (Koppen, 1936). It considers temperature, precipitation, and their seasonal changes, and then integrates them into an index to classify regional climates. Subsequently, Trewartha and Horn (1980) revised the Köppen climate classification, adding thresholds to different climate types to define climate sub-types. Nowadays, the Köppen-Trewartha climate classification is widely used to describe the potential distribution of natural vegetation based on thresholds of climatic variation (Wang and Overland, 2004; Feng et al., 2012, 2014; Huang et al., 2018; Wu et al., 2021). These thresholds of temperature and precipitation determine the occurrence of various critical ecological processes (Bailey, 2009). Thus, each climate type (major climate type or sub-type) has a positive correlation with the distribution of vegetation (Baker et al., 2010), which can be used to establish the relationship between climate types and regional vegetation types (Huang et al., 2018, 2019). In addition, the Köppen-Trewartha climate classification requires a relatively low degree of temporal accuracy, which makes it possible to understand the relationship between climate types and the evolution of vegetation distribution on a longer timescale (Yoo and Rohli, 2016). Therefore, in this study, we use the Köppen-Trewartha climate classification to investigate climate change and corresponding ecosystem changes in TP in response to the natural condition and anthropogenic warming during the mid-Holocene, the present and projected recent future under different emissions scenarios using high spatial-resolution model data.
WorldClim global high-resolution climate gridded data with a spatial resolution of 2.5 min (∼0.04°) (http://worldclim.org; Hijmans et al., 2005) was used in this study. It includes the data in the mid-Holocene (MH, refers to ∼6 cal ka BP in the study), the present-day (PD, 1960–1990), and the projected future. The projected future refers to the average of 2041–2060 (represented by 2050s). The PD data were interpolated from in-situ data. The data for the MH was downscaled from the Coupled Model Intercomparison Project 5 (CMIP5), which includes nine models of monthly precipitation and maximum and minimum monthly temperature. For the 2050s, the monthly precipitation, monthly maximum, and minimum temperature data from 17 climate models under the Representative Concentration Pathway (RCP) 4.5 and RCP8.5 scenarios were downscaled to 2.5 min resolution. The data of the MH and 2050s were downscaled and calibrated using the PD data as baseline “current” climate. Thus, the downscaled data by the same eight models for both the MH and 2050s are selected. The ensemble mean of the eight models’ data is used for analysis, which is usually more reliable than a single model (Lambert and Boer, 2001).
The unique geographical location and surface characteristics of TP lead to substantial uncertainties in climate simulations (Figure 1). The Asian Precipitation Highly-Resolved Observational Data Integration Towards Evaluation (APHRODITE) dataset, including precipitation (V1101, 1960–1990) and temperature (V1808, 1961–1990), is applied to evaluate the reliability of WorldClim data in this study, which has a spatial resolution of 0.25° (Yasutomi et al., 2011; Yatagai et al., 2012). It is recommended to analyze the TP’s climate (Salunke et al., 2019; Tan et al., 2020). The temperature and precipitation results from WorldClim PD’s data and the APHRODITE dataset show similar spatial distributions (Figures 2A–D). The major differences in mean annual temperature between the two datasets are distributed in the western Himalayas, where WorldClim underestimates the temperature. The annual precipitation in Karakoram is underestimated by WorldClim (Figures 2A–D). Overall, WorldClim datasets could reproduce the TP’s mean annual temperature and precipitation well. Notably, the study aims to compare the climate types in TP among different warm periods, which means the accuracy of the spatiotemporal distribution is more important than absolute values. The vegetation data of the manual digitalization of the 1:1,000,000 vegetation map of China (The China Vegetation Atlas Editorial Committee and Chinese Academy of Sciences, 2001) is utilized to contrast the climate types in TP because the 1:1,000,000 vegetation map of China has more detailed vegetation resources than other global remote sensing data, which covers most of TP (more than 83%).
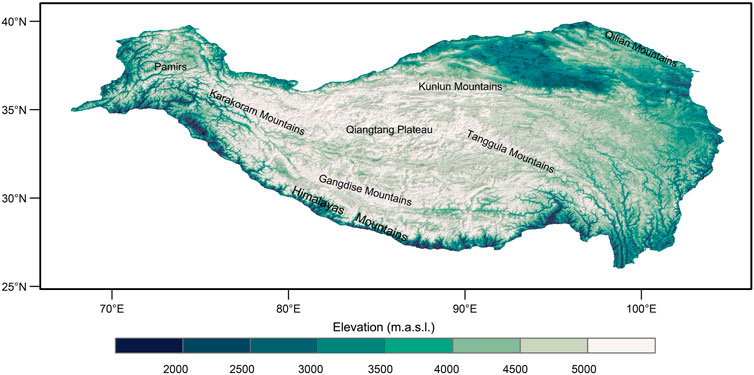
FIGURE 1. The topography (units: m.a.s.l.) of the Tibetan Plateau (TP). The polygon represents the region of TP. The TP boundary data comes from the Scope of Tibetan Plateau Version-2021 (Zhang et al., 2020, the same as below).
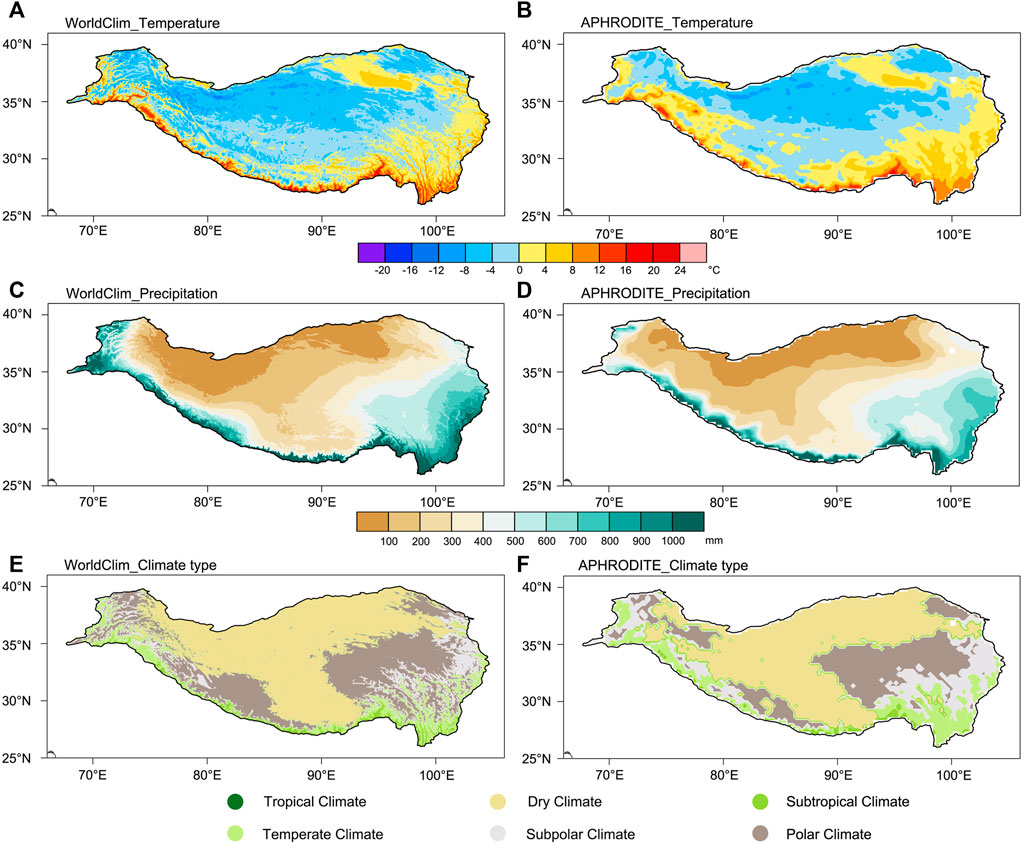
FIGURE 2. Distribution of temperature (A,B) (units: °C), precipitation (C,D) (units: mm) and climate types (E,F) (detailed information in Table 1) across TP. (A,C,E) come from the WorldClim dataset, (B,D,F) come from the APHRODITE dataset. The periods of the plots are 1960–1990, except for the APHRODITE’s temperature in (B) is 1961–1990.
Köppen-Trewartha climate classification (Trewartha and Horn, 1980) is applied to define the climate types of TP in the MH, PD, and 2050s under different scenarios. This classification identifies six climate types, including tropical climate (A), dry climate (B), subtropical climate (C), temperate climate (D), subpolar climate (E), and polar climate (F). The dry climate is defined by effective moisture, while the other types are defined by temperature. As the regions that conform to the dry climate can also include tropical climate, subtropical climate, temperate climate, subpolar climate, and polar climate, while tropical climate, subtropical climate, temperate climate, subpolar climate, and polar climate are mutually exclusive, the regions that meet the criteria of the dry climate are first assessed, followed by the remaining types. In addition, based on seasonal changes in temperature and precipitation, each major climate type can be further divided into climate sub-types. Feng et al. (2014) summarized the criteria for defining climate types. The criteria are listed in Table 1. The climate type in each grid was categorized by its temperature and precipitation in the WorldClim dataset. The spatial difference of climate types was determined by the difference in each grid between the two periods. To further evaluate the role of temperature and precipitation in determining the changes in climate types, we held temperature/precipitation in the PD constant when calculating the MH/RCP4.5/RCP8.5 climate types and then calculated the difference of percentage of climate types between the PD and MH/RCP4.5/RCP8.5. Figures 2E,F show that the distribution of the Köppen-Trewartha climate types are similar in TP between the two datasets, further demonstrating the reliability of WorldClim data.
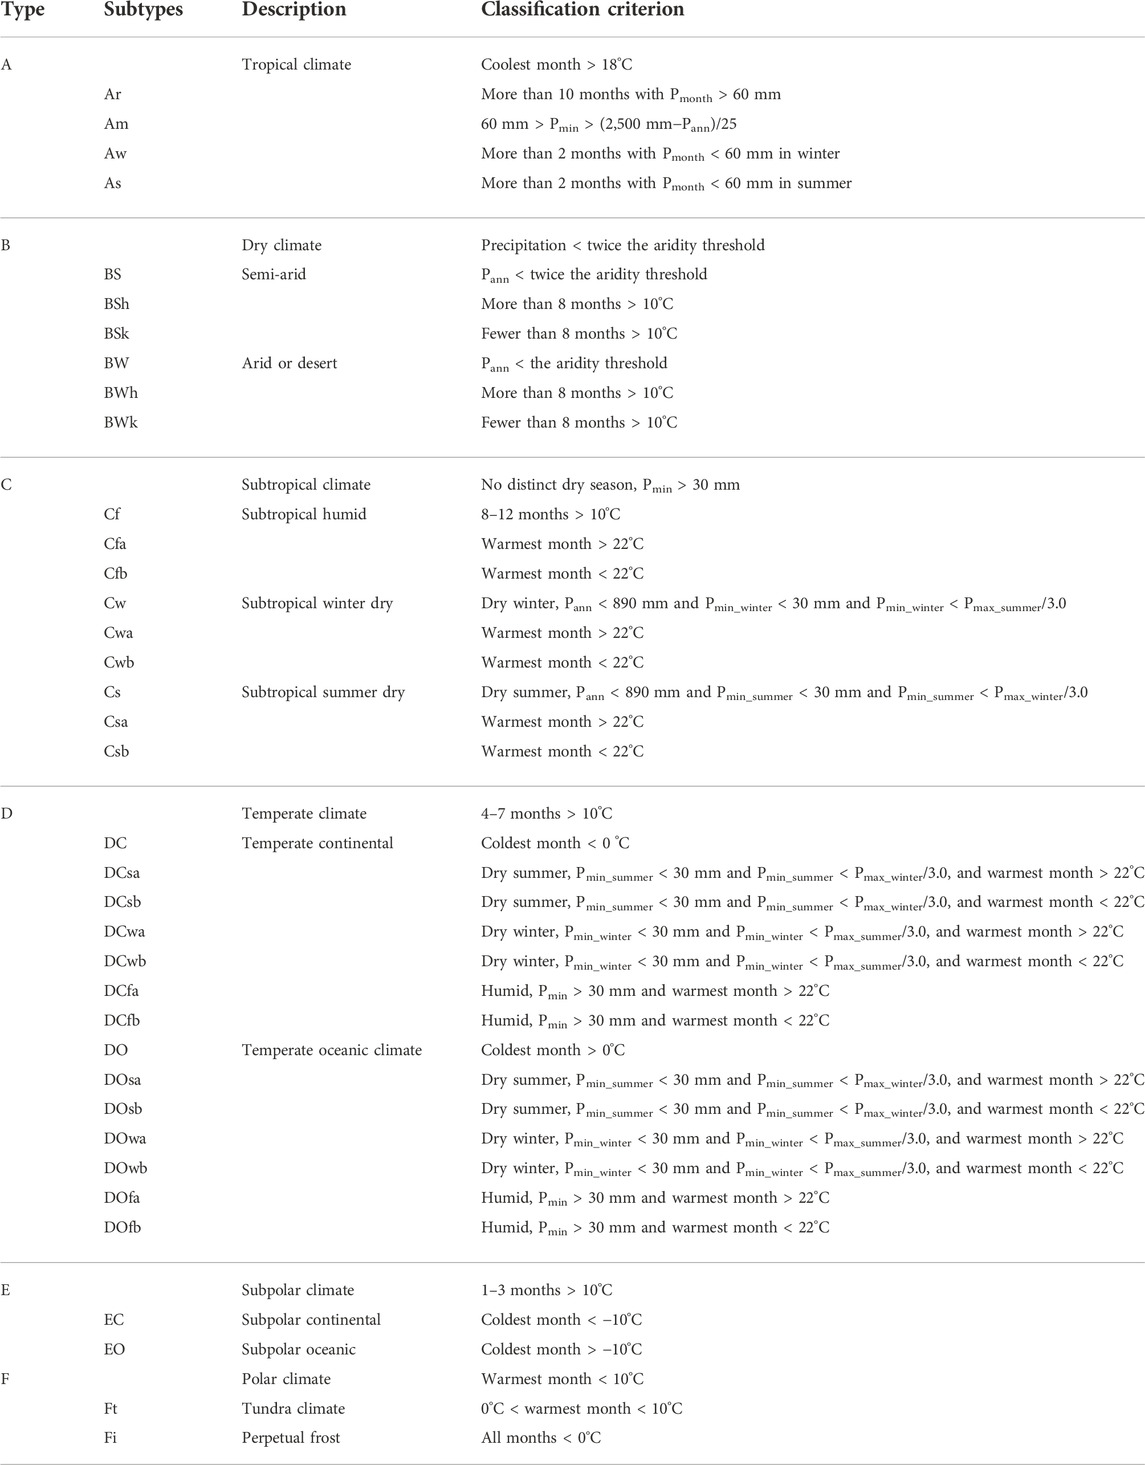
TABLE 1. The criteria used for the Köppen-Trewartha climate classification system. Pmonth and Pann are the monthly and annual precipitation (units: mm), respectively. Pmin, Pmin_winter, and Pmin_summer are the months with minimum precipitation (units: mm) during the winter and summer seasons. Pmax, Pmax_winter, and Pmax_summer are the months with maximum precipitation (units: mm) during the winter and summer seasons. The aridity threshold is defined as 10 × (Tann–10)+3P, Tann is the average annual temperature (units: °C), and P is the percentage of the total precipitation received in the six high-insolation months (April to September in the Northern Hemisphere and October to March in the Southern Hemisphere) (Trewartha and Horn, 1980; Feng et al., 2014).
Tang and Ding (2007) pointed out an insignificant difference between the average temperature recorded by observation and the average temperature calculated from the maximum and minimum temperature. The interchange is reliable under high data accuracy. Since WorldClim high-resolution data has the maximum, minimum, and average temperature for the PD, while only maximum and minimum temperatures are available for the MH and 2050s, the average temperature is calculated as the arithmetic means of the maximum and minimum temperature.
The range of average annual temperature of TP in the three warm periods is from −8°C to 20°C (Figure 3). There is a gradient of increasing values from northwest to southeast, with the highest temperature in the southern margin, which is closely linked to the altitude (Figures 1, 3). The spatial temperature distribution in TP is similar between the MH and PD. TP is predicted to be warm substantially in the 2050s, with the 0°C isotherms moving toward the northwest and the average annual temperature of the southern TP changing from below 0°C to above 0°C. The 0°C isotherms shift northwestward in the RCP8.5 scenario than in the RCP4.5 scenario (Figures 3C,D). The average annual precipitation in TP ranges from 100 mm to 1,000 mm, decreasing from the southeast to the northwest (Figure 4).
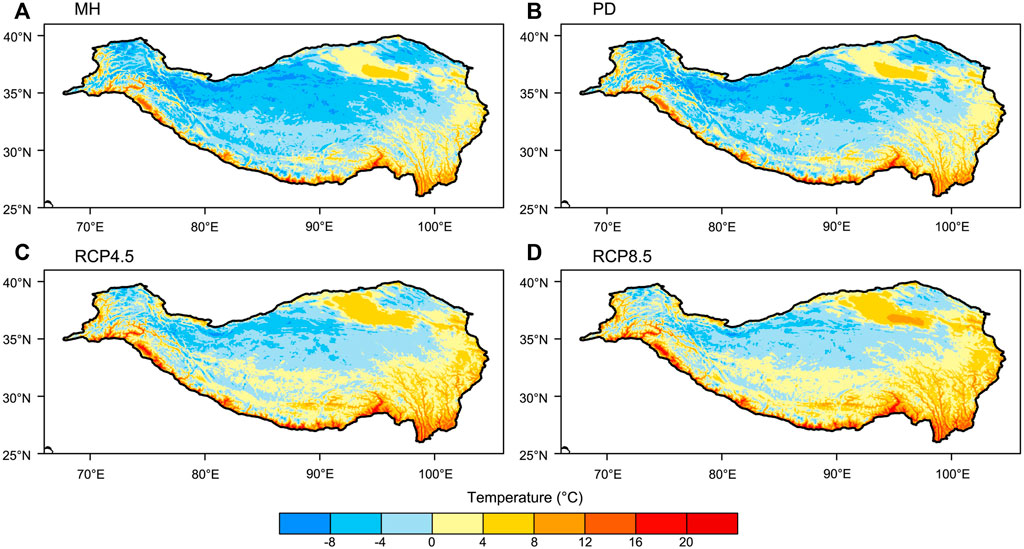
FIGURE 3. Distribution of average annual temperature (units: °C) across TP in the (A) MH, refers to ∼6 cal ka BP; (B) PD, refers to 1960–1990; (C) RCP4.5, (D) RCP8.5, refers to the average for 2041–2060.
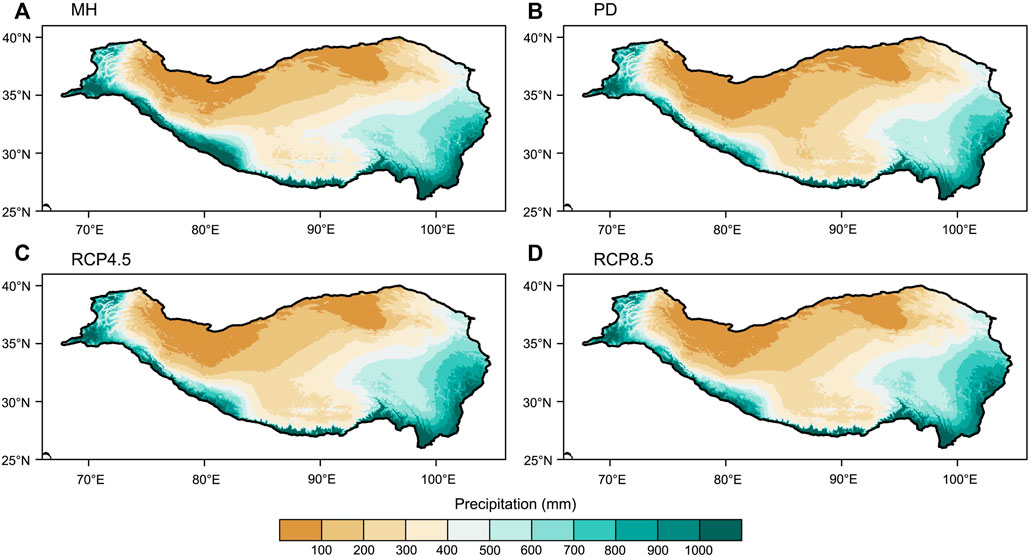
FIGURE 4. Distribution of average annual precipitation (units: mm) across TP. (A) MH, (B) PD, (C) RCP4.5, (D) RCP8.5.
To further understand the spatiotemporal characteristics of the average annual temperature and precipitation of TP in the MH, the PD, and the projected future, the difference between temperature (Figure 5) and precipitation (Figure 6) for each period were analyzed. It should be pointed out that the significance test is inapplicable to our calculation because only monthly climatology data exists in WorldClim dataset for the three periods. Compared with the PD, the average annual temperature in the MH shows overall negative anomalies with a meridional gradient and a maximum negative center in the southern TP (Figure 5A). Compared with the PD, the average annual temperature will increase by more than 2°C in the entire TP in the 2050s under the RCP4.5 scenario. The most pronounced warming appears in the western TP (around Gangdise Mountains and Qiangtang Plateau) with high altitudes (Figures 1, 5B). The warming is more pronounced under the RCP8.5 scenario, which increases about 0.5°C–1°C higher than the RCP4.5, coupled with the same phenomenon at high-altitude areas (Figures 1, 5C,D). In summary, the MH under natural conditions shows a meridional gradient difference in average annual temperature, while increased greenhouse gas emissions caused by anthropogenic changes could lead to more substantial warming of TP in the 2050s, with higher temperature increase at the high-altitude areas.
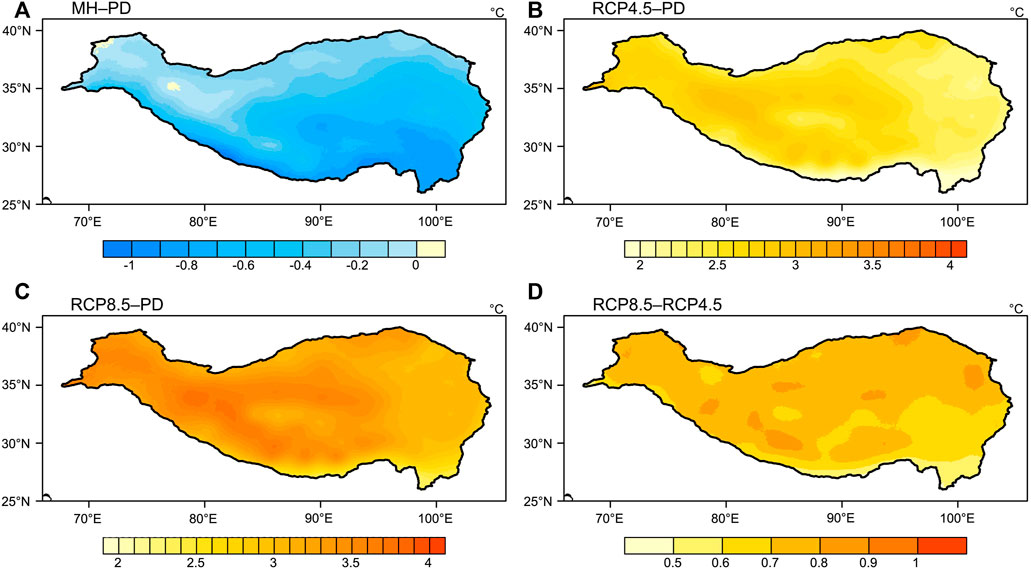
FIGURE 5. Distribution of average annual temperature difference (units: °C) across TP. (A) MH–PD, (B) RCP4.5–PD, (C) RCP8.5–PD, (D) RCP8.5–RCP4.5.
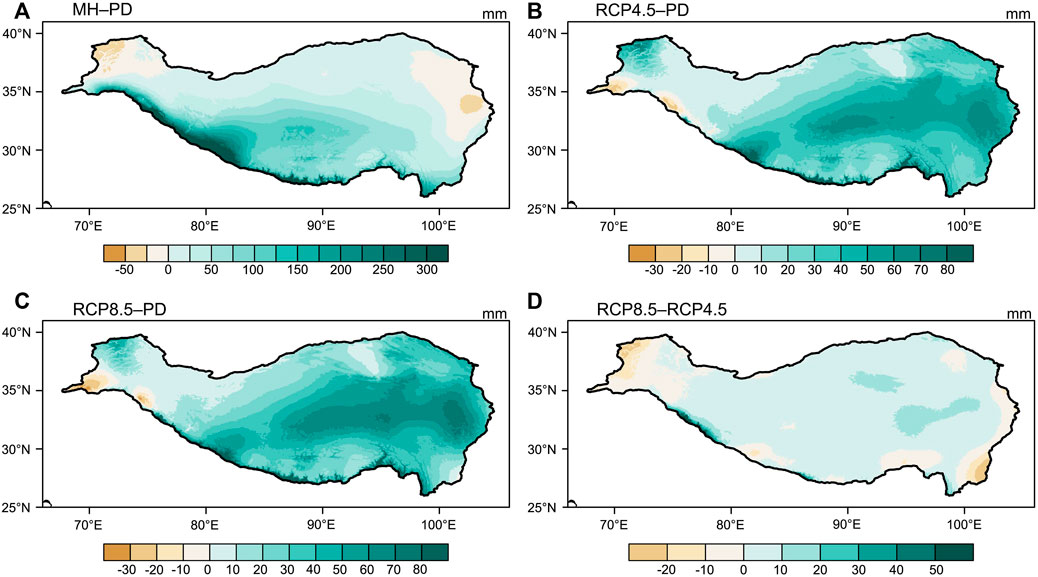
FIGURE 6. Distribution of average annual precipitation difference (units: mm) across TP. (A) MH–PD, (B) RCP4.5–PD, (C) RCP8.5–PD, (D) RCP8.5–RCP4.5.
Precipitation also changes evidently among the three periods. Compared with the PD, the average annual precipitation in the MH increases by more than 300 mm in the southwestern TP, while precipitation decreases in the northwestern TP and northeastern TP and enhances the disparity between southern and northern TP (Figures 4A, 6A). Average annual precipitation in TP is predicted to increase in most of TP in the 2050s under the RCP4.5 scenario by about 20–60 mm compared with the PD. The increasing precipitation is most pronounced in the southeastern TP and southwestern TP (Figure 6B), which may attribute to the enhanced monsoon. The average annual precipitation differences between the PD and RCP8.5 scenario are similar to that of the RCP4.5 scenario (Figures 6B,C). The average annual precipitation in TP will increase by about 0–20 mm under a higher emission scenario in most of TP in the 2050s, except the boundary region of TP, where the average annual precipitation is projected to decrease by about 0–20 mm (Figure 6D). Besides, the distribution of precipitation increase is consistent between the RCP4.5 and RCP8.5 scenarios except for the Pamirs and southeastern TP margins (Figure 6D), indicating the homogeneity effect of the greenhouse gas emissions on increasing precipitation in TP.
Based on the information about the Köppen-Trewartha climate classification listed in Table 1, the climate types in TP during the MH, the PD, and the 2050s were calculated using monthly average temperature and monthly precipitation. The areal percentages of the major climate types for each period were calculated and listed in Table 2. Most regions of TP are occupied by the dry climate and polar climate, accounting for more than 70% of the area of TP (Figure 7; Table 2). In terms of the spatial distribution of climates during the MH, the dry climate occupies most of the northern part of TP, and the polar climate is mainly distributed in the hinterland and southwestern region of TP. The subtropical climate, temperate climate, and subpolar climate are primarily distributed in the southeast and western margins (Figure 7A). The distribution of major climate types in the PD is analogous to the MH, except for the polar climate replaced by the dry climate in the hinterland of TP (Figure 7B). In the context of intensifying climatic warming in the 2050s, the areas of polar climate will shrink. The subtropical climate, temperate climate, and subpolar climate move northward and northwestward towards the hinterland (Figures 7C,D). The distribution of climate sub-types shows that the dry climate is mainly composed of BSk (semi-arid climate, fewer than 8 months >10°C) and BWk (arid climate, fewer than 8 months >10°C) (Figure 8). The dry climate area in the northern TP and hinterland TP are classified as BWk and BSk, respectively. The sub-types of polar climate are mostly an Ft (tundra climate), and subtropical climate is a Cwa (subtropical winter dry climate, warmest month >22°C). The sub-subpolar climate is mostly an EO (subpolar oceanic climate) in the low-elevation areas of the southeastern TP and mainly an EC (subpolar continental climate) in the area extending to the hinterland of TP (Figures 1, 8). Except for the BWk and BSk, major warming in the 2050s will result in large changes to these sub-types, such as DCwb (temperate continental climate, dry winter, warmest month <22°C), DOwb (temperate oceanic climate, dry winter, warmest month <22°C), EO and EC. Compared with the PD, the temperate climate and subpolar climate will extend towards the hinterland of TP, and the proportion of these sub-types is predicted to increase in the 2050s.
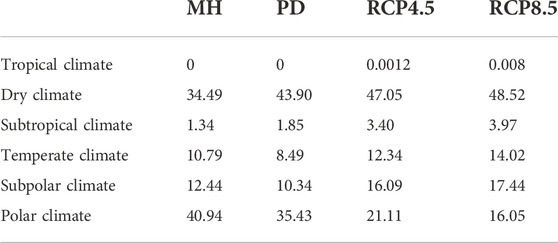
TABLE 2. Areal proportions (%) of the major climate types for selected warm periods.
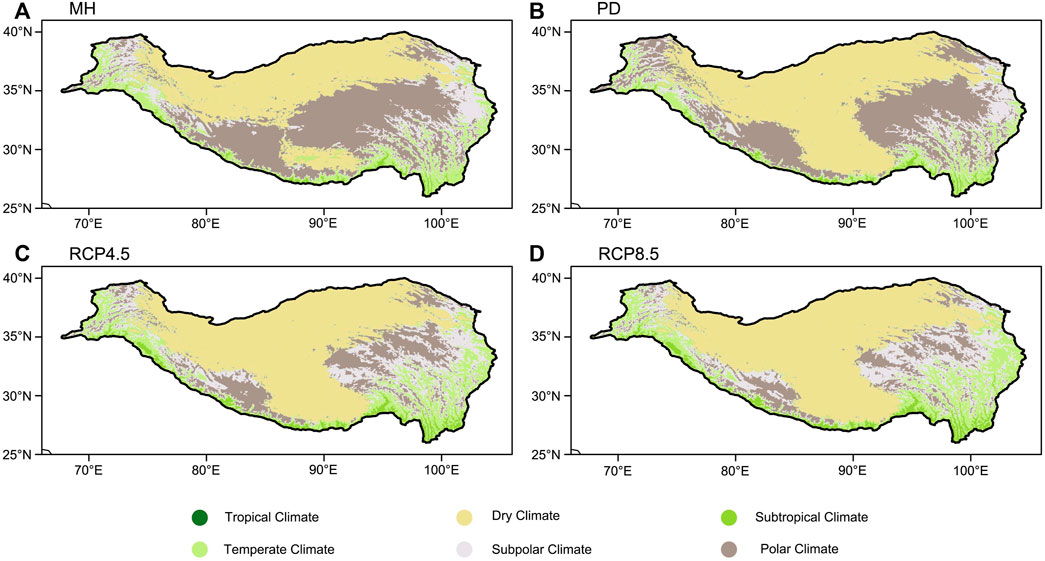
FIGURE 7. Distribution of major climate types (detailed information in Table 1) across TP. (A) MH, (B) PD, (C) RCP4.5, (D) RCP8.5.
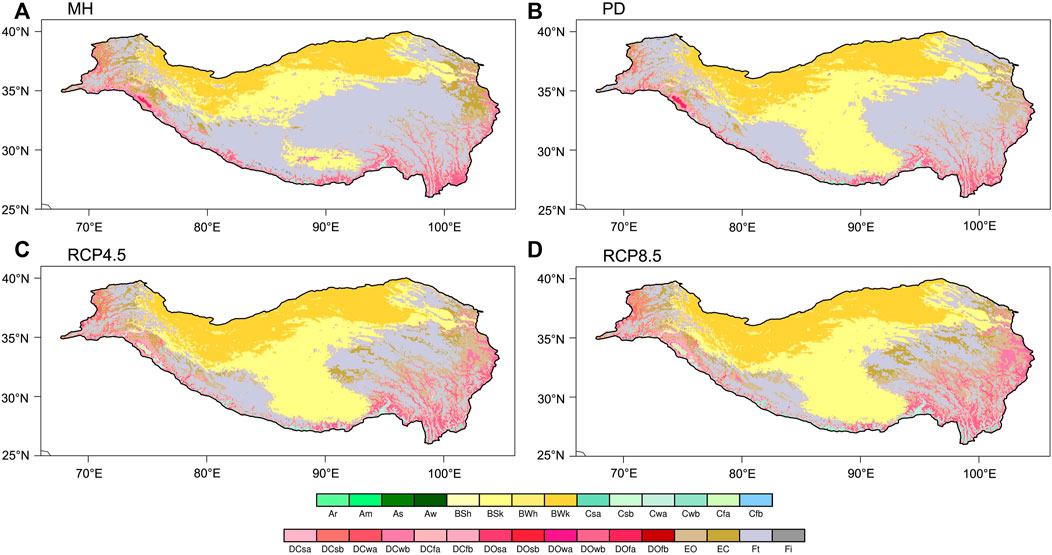
FIGURE 8. Distribution of climate sub-types (detailed information in Table 1) across TP. (A) MH, (B) PD, (C) RCP4.5, (D) RCP8.5.
Figure 9 evaluate further the differences between climate types in TP during the selected warm periods. Compared with the PD, a large proportion of dry climate in the hinterland TP mainly changes to a polar climate, while the areas of temperate climate, subpolar climate, and polar climate increased slightly during the MH (Figure 9A; Table 2). In the 2050s, it is worth noting that tropical climate will appear on TP (Table 2). In addition, a large area in the southern TP will undergo a change from a cold climate type to a warmer climate type in the 2050s, with an apparent shrinkage of the polar climate (Figures 9B,C; Table 2). Compared with the RCP4.5 scenario, climate types show unnoticeable change. A slight transition occurs mainly from a cold to a warmer climate type, especially for the polar climate (Figure 9D). Different scenarios have little impact on the dry climate area (Table 2). It is concluded that natural conditions resulted in a decrease in the dry climate regions in the MH, while anthropogenic change will promote a cold climate type to a warmer one in the 2050s.
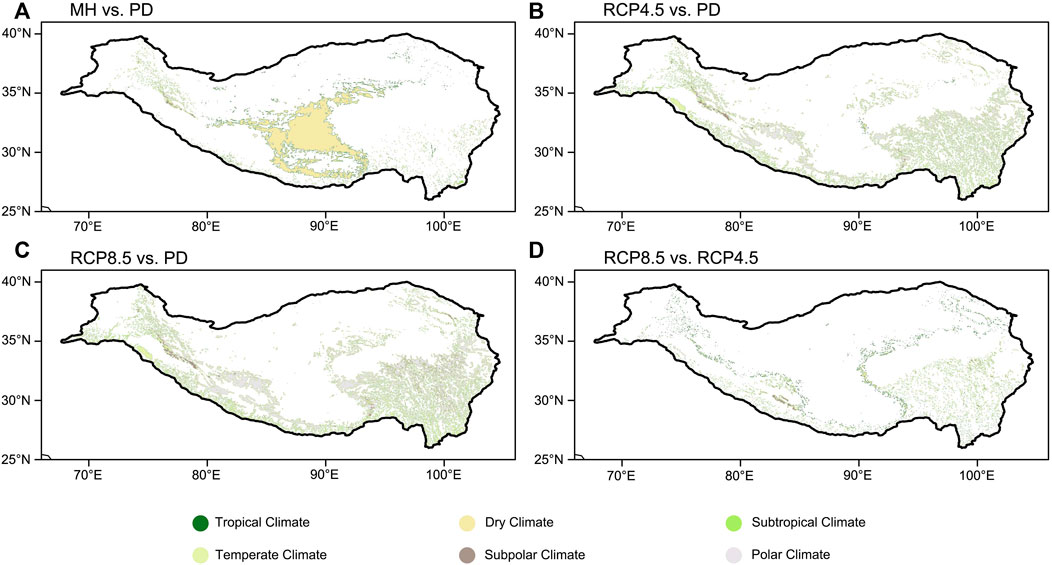
FIGURE 9. Distribution of the difference in major climate types (detailed information in Table 1) across the selected warming periods. (A) MH vs. PD, (B) RCP4.5 vs. PD, (C) RCP8.5 vs. PD, (D) RCP8.5 vs. RCP4.5. Except for white, the colors in the four maps represent the climate types of PD. The white paint inside TP indicates that the major climate types did not change between the two periods.
The change in temperature and precipitation can both lead to the transformation of climate types. The precipitation increased by more than 300 mm in the southwestern TP between the MH and the PD, and 2°C warming over TP in the 2050s. We found that the area experiences a dramatic change in climate types in the MH when using the PD’s precipitation and MH’s temperature (Table 3). It indicates that precipitation changes dominated the shift of climate types in the MH. By contrast, a great change in climate types will occur in the 2050s when using the precipitation of PD and the temperature of the 2050s. It demonstrates that temperature changes dominate the 2050s evolution of climate types across TP. It is also helpful to understand that the dry climate will expand slightly in the 2050s, which is inconsistent with the trend of warming and wetting in TP (Table 2). Strong warming plays a more crucial role than a slight increase in precipitation for the climate types of changes in the 2050s. Notably, the increasing temperature may lead to nearly 20% of the area of climate types across TP changing by the 2050s under the RCP8.5 (Table 3). In conclusion, precipitation changes are primarily responsible for the difference in climate types between the PD and MH, and temperature will lead to changes in the 2050s.
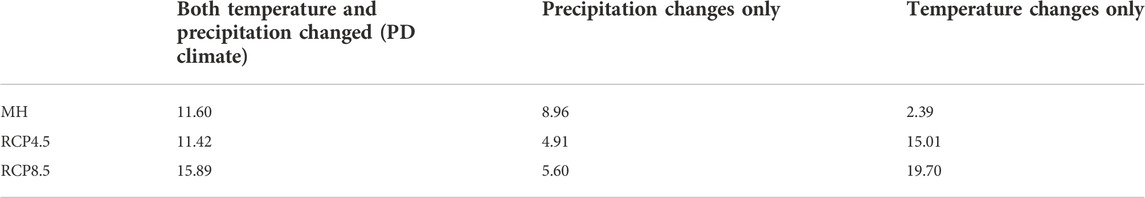
TABLE 3. Changes in the proportions (%) of temperature and precipitation changes, precipitation change only, and temperature change only, in the MH and the future. Precipitation (temperature) change only represents the change in climate types caused by precipitation (temperature).
To further investigate the relationship between Köppen-Trewartha climate types and vegetation in TP, we extracted the mega vegetation groups to compare with major climate types in the PD (Figures 2E,F, 10). The results show that the dry climate regions mainly correspond to steppes and deserts areas in the northern TP; polar climate regions correspond to the meadows areas in the eastern TP and southwestern TP; subpolar climate regions correspond to the shrubs areas in the southeastern TP; the regions of temperate climate and subtropical climate correspond to the needleleaf forests and the broadleaf forests areas respectively in the southern margin. However, climate types and vegetation are inconsistent in the southwestern TP and the ecotone boundary, primarily due to the overestimation of precipitation compared with observation data in the southwestern TP (Figures 2C,D). Since the Köppen-Trewartha classification has more than 30 sub-types, it is challenging to compare climate sub-types to vegetation groups, for the detail is restricted by the data resolution and the regional area of TP. In general, the distribution of the major climate types in TP corresponds well with vegetation mage types in the PD.
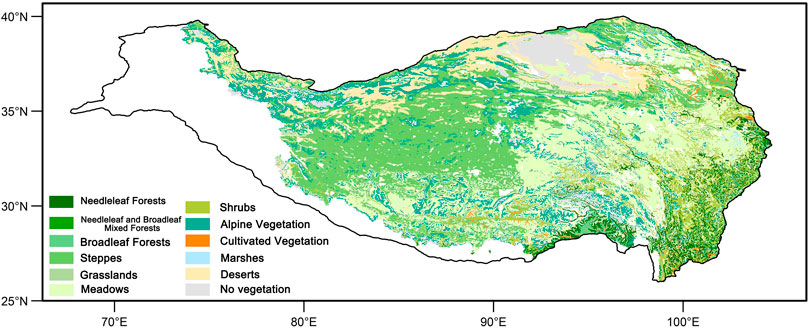
FIGURE 10. Distribution of vegetation types across TP in China during the PD.
Given the relationship between climate types in TP in the PD, it could be inferred that there is an expansion of meadows, shrubs, and forests, and a shrinking of steppes and deserts during the MH, due to stronger monsoonal precipitation (Figures 7A,B, 10). Under the RCP4.5/RCP8.5 scenarios, a prominent shrinking area of the polar climate in the hinterland TP suggests the degradation risk of meadows, and the meadow will mainly be replaced by shrubs in the future (Figures 7B–D, 10). The distribution of shrubs and forests in the southeastern TP may shift northwestward. More specifically, anthropogenic warming may decrease cryophilic plants while thermophilic plants may increase.
Reliable proxies’ records are the basis for the reconstruction (Chen et al., 2022). Meanwhile, the reconstructed temperature in TP during the Holocene is still in debate since different proxies reveal inconsistent results nearby (Chen F. et al., 2020). Our simulation results suggest TP experienced an overall cooling in the MH. During the MH, high northern latitudes received stronger insolation than those in PD, decreasing the meridional radiation gradient. This is opposite to the results in the PD, leading to the meridional temperature gradient anomaly (Figure 5A; Laskar et al., 2004; Wanner et al., 2008). Despite the annual insolation during the PD being weaker than the MH (Laskar et al., 2004; Wanner et al., 2008), the undergoing anthropogenic warming (IPCC, 2021) may be responsible for overcoming the insolation cooling (Figure 5A). Additionally, Paleo-shorelines records show the highest paleo-lake levels in the southwestern TP in the early Holocene and gradually dropped after that, indicating a long-term decline of monsoonal precipitation in the Holocene (Hudson et al., 2015; Zhang et al., 2020). During the MH, insolation was stronger in the summer relative to the PD (Laskar et al., 2004; Wanner et al., 2008), and increased land-sea thermal contrast, brought more monsoonal precipitation in the southwestern TP (Figure 6A; Chen F. et al., 2020; Hudson et al., 2015; Huth et al., 2015), which is consistent with reconstructions.
Palynological records reveal that the proportion of the MH forests was maximum throughout the Holocene, whereas the steppes areas shrunk, and meadows areas expanded around the boundary of meadows and steppes on TP in the MH when comparing them to the late Holocene (Chen F. et al., 2020). The vegetation variation pattern agrees with the spatial variation of climate type in the MH. Therefore, it is suggested that the Köppen-Trewartha can be applied to analyze variations in TP vegetation under natural conditions, which helps obtain vegetation distribution without observation. Some studies have reported that TP experienced a sensation of warming and wetting in recent decades, manifested as significant warming and precipitation increasing (e.g., Yang et al., 2011, 2014; Chen et al., 2015; Bibi et al., 2018; Yao et al., 2019, 2022). In response to climate change, the steppes expanded, and meadows shrank significantly (Chen et al., 2015). Our results of climate type variations in the future indicate a further degradation risk of meadows, while the area of shrubs and forests will slightly increase and northward shift. The variation of vegetation distribution in the future predicted by the Lund-Potsdam-Jena Dynamic Global Vegetation Model (LPJ model) and the coupled biogeography and biogeochemistry model (BIOME4) concluded similar results (Zhao et al., 2011; Gao et al., 2016), indicating the applicability of Köppen-Trewartha climate classification for predicting the future.
Still, we also need to be aware of the limitation of the Köppen-Trewartha climate classification. The actual rate of change of the vegetation in TP is less than that predicted by vegetation models and the Köppen-Trewartha climate classification when using climate types to explain differences in surface vegetation (Epstein et al., 2007). That is, the response of the vegetation to climate change typically lags behind climate change. At the same time, non-climatic factors such as changes in land use, deforestation, and pests may also affect or obscure the response of local vegetation to climate change (Feng et al., 2014). In other words, changes in regional climate types may not directly result in the development of the corresponding vegetation types.
As “the third pole”, TP has developed widespread snow cover, glacier, and permafrost, and it has an impressive influence on its surroundings. The shrinking of the area of polar climate and expansion of the area of other climate types implies substantial changes in the cryosphere over TP, such as glacier retreat, reductions in snow cover, permafrost degradation, and the thickening of the active layer (Wu and Zhang, 2008; Kang et al., 2010; Yao et al., 2012, 2019; Huang et al., 2016; Bibi et al., 2018; Chen J. et al., 2020). Another change that cannot be ignored is the appearance of tropical climate in TP under the RCP8.5, which may indicate that the climate system has approached or exceeded a threshold in the 2050s. In addition, a comparison of the results for the RCP4.5 and RCP8.5 scenarios shows that the changes in climate types across TP are relatively small. The reasons for this are the relatively small differences in temperature and precipitation between the RCP4.5 and RCP8.5 around the 2050s, which result in only minor changes in the climatic and ecological environment of TP. However, compared to the PD, there are major differences in the climate types of TP under the RCP4.5 and RCP8.5 scenarios, and anthropogenic changes will have a huge impact on TP. Although TP has developed a warming and wetting trend and the ecological environment has improved in the recent past, the effects of climate change on TP will intensify in the longer term. There will be a shift to warmer and drier climate types, and the current improvement in the ecological environment may be transient. Therefore, it is imperative to reduce the impact of anthropogenic changes on the environment and ecosystem of TP. Considering the knowledge that the research obtained, policymakers should strengthen the protection of meadows on TP and set up nature reserves on TP in the future.
This study used the Köppen–Trewartha climate classification to examine the shifts in terrestrial climate regimes and ecosystem in the Tibetan Plateau (TP) by analyzing the WorldClim high-resolution downscaled climate dataset for the mid-Holocene (MH, 6,000 cal ka BP), the present day (PD, 1960–1990), and in the future (2041–2060, represented by 2050s).
The results show that natural conditions in the MH led to negative average annual temperature anomalies with a meridional gradient and enlarged the meridional gradient of average annual precipitation between northern TP and southern TP. The anthropogenic forcing resulting from increased greenhouse gas emissions will lead to evident warming of TP, especially in the high-altitude areas, and uniform precipitation increase in the 2050s.
The climate type results show that most regions of TP are occupied by the dry climate and polar climate in the three periods. Compared to the PD, the area of the dry climate in TP decreases in the MH, while anthropogenic change will promote a cold climate type to a warmer type. Further analysis shows that the difference in climate types between the MH and PD is dominated by precipitation, and the warming dominates the changes of climate types across TP in the 2050s.
We further investigate the relationship between Köppen-Trewartha climate types and vegetation in TP. The results reveal that the distribution of climate types in TP corresponds well with the distribution of vegetation types. The changes in climate types suggest that TP experienced an expansion of the meadows, shrubs, and forests and a shrinking of steppes and deserts during the MH compared to the PD. There will be a large redistribution of the surface vegetation. In particular, the meadows will shrink prominently in the 2050s.
The response of the ecosystem of TP to climate change will, in turn, affect the climate. The interaction between the climate system and terrestrial ecosystem is complex and it is essential to analyze it carefully. In this context, a study of climate types is helpful because they are a link between climate change and the ecosystem. Estimating and comparing the 2050s climate types across TP may improve our understanding of how the ecosystem of TP will respond to climate change under natural conditions and in response to human impacts. The feedback of vegetation change across TP climate change under continuing global warming requires further research.
Publicly available datasets were analyzed in this study. This data can be found here: The WorldClim datasets for this study can be found on the website (http://worldclim.org). The 1:1,000,000 vegetation map of China can be accessed at the National Tibetan Plateau Data Center (http://data.tpdc.ac.cn/).
LH: data analysis and interpretation, drafting and revising. SF: design of the work. JC: revising and investigation. YD: investigation. FC: investigation. WH: design of the work, revising, and funding acquisition.
The work was supported by the Strategic Priority Research Program of the Chinese Academy of Sciences (A) (Grant XDA2009000003), the National Key R&D Program of China (Grant 2018YFA0606404), and the National Natural Science Foundation of China (Grant 41877446).
We sincerely thank Drs. Chang Liu, Shengqian Chen, and Yujie Yang provided helpful suggestions. We are grateful to the referees whose comments and suggestions have greatly improved this paper.
The authors declare that the research was conducted in the absence of any commercial or financial relationships that could be construed as a potential conflict of interest.
All claims expressed in this article are solely those of the authors and do not necessarily represent those of their affiliated organizations, or those of the publisher, the editors and the reviewers. Any product that may be evaluated in this article, or claim that may be made by its manufacturer, is not guaranteed or endorsed by the publisher.
Baker, B., Diaz, H., Hargrove, W., and Hoffman, F. (2010). Use of the Köppen–Trewartha climate classification to evaluate climatic refugia in statistically derived ecoregions for the People’s Republic of China. Clim. Change 98, 113–131. doi:10.1007/s10584-009-9622-2
Bibi, S., Wang, L., Li, X., Zhou, J., Chen, D., and Yao, T. (2018). Climatic and associated cryospheric, biospheric, and hydrological changes on the Tibetan Plateau: A review. Int. J. Climatol. 38, e1–e17. doi:10.1002/joc.5411
Chen, D., Xu, B., Yao, T., Guo, Z., Cui, P., Chen, F., et al. (2015). Assessment of past, present and future environmental changes on the Tibetan Plateau. Chin. Sci. Bull. 60, 3025–3035. doi:10.1360/N972014-01370
Chen, F., Zhang, J., Liu, J., Cao, X., Hou, J., Zhu, L., et al. (2020). Climate change, vegetation history, and landscape responses on the Tibetan Plateau during the Holocene: A comprehensive review. Quat. Sci. Rev. 243, 106444. doi:10.1016/j.quascirev.2020.106444
Chen, J., Qin, X., Kang, S., Du, W., Sun, W., and Liu, Y. (2020). Potential effect of black carbon on glacier mass balance during the past 55 Years of laohugou glacier No. 12, western qilian Mountains. J. Earth Sci. 31, 410–418. doi:10.1007/s12583-019-1238-5
Chen, S., Chen, J., Lv, F., Liu, X., Huang, W., Wang, T., et al. (2022). Holocene moisture variations in arid central Asia: Reassessment and reconciliation. Quat. Sci. Rev. 297, 107821. doi:10.1016/j.quascirev.2022.107821
Chen, S., Liu, J., Wang, X., Zhao, S., Chen, J., Qiang, M., et al. (2021). Holocene dust storm variations over northern China: Transition from a natural forcing to an anthropogenic forcing. Sci. Bull. (Beijing). 66, 2516–2527. doi:10.1016/j.scib.2021.08.008
Cohen, K. M., Finney, S. C., Gibbard, P. L., and Fan, J.-X. (2018). The ICS international chronostratigraphic chart. Episodes 36, 199–204. doi:10.18814/epiiugs/2013/v36i3/002
Cui, P., and Jia, Y. (2015). Mountain hazards in the Tibetan Plateau: Research status and prospects. Natl. Sci. Rev. 2, 397–399. doi:10.1093/nsr/nwv061
Epstein, H. E., Kaplan, J. O., Lischke, H., and Yu, Q. (2007). Simulating future changes in arctic and subarctic vegetation. Comput. Sci. Eng. 9, 12–23. doi:10.1109/MCSE.2007.84
IPCC (2021). in Climate change 2021: The physical science basis. V. Masson-Delmotte, P. Zhai, A. Pirani, S. L. Connors, C. Péan, S. Bergeret al. (Cambridge, United Kingdom and New York, NY, USA: Cambridge University Press). doi:10.1017/9781009157896
Feng, S., Ho, C.-H., Hu, Q., Oglesby, R. J., Jeong, S.-J., and Kim, B.-M. (2012). Evaluating observed and projected future climate changes for the Arctic using the Köppen-Trewartha climate classification. Clim. Dyn. 38, 1359–1373. doi:10.1007/s00382-011-1020-6
Feng, S., Hu, Q., Huang, W., Ho, C.-H., Li, R., and Tang, Z. (2014). Projected climate regime shift under future global warming from multi-model, multi-scenario CMIP5 simulations. Glob. Planet. Change 112, 41–52. doi:10.1016/j.gloplacha.2013.11.002
Gao, Q., Guo, Y., Xu, H., Ganjurjav, H., Li, Y., Wan, Y., et al. (2016). Climate change and its impacts on vegetation distribution and net primary productivity of the alpine ecosystem in the Qinghai-Tibetan Plateau. Sci. Total Environ. 554 (555), 34–41. doi:10.1016/j.scitotenv.2016.02.131
Hijmans, R. J., Cameron, S. E., Parra, J. L., Jones, P. G., and Jarvis, A. (2005). Very high resolution interpolated climate surfaces for global land areas. Int. J. Climatol. 25, 1965–1978. doi:10.1002/joc.1276
Huang, W., Feng, S., Liu, C., Chen, J., Chen, J., and Chen, F. (2018). Changes of climate regimes during the last millennium and the twenty-first century simulated by the Community Earth System Model. Quat. Sci. Rev. 180, 42–56. doi:10.1016/j.quascirev.2017.11.019
Huang, W., Yan, J., Liu, C., and Xie, T. (2019). Changes in climate regimes over China based on a high-resolution dataset. Sci. Bull. (Beijing). 64, 377–379. doi:10.1016/j.scib.2019.03.001
Huang, X., Deng, J., Ma, X., Wang, Y., Feng, Q., Hao, X., et al. (2016). Spatiotemporal dynamics of snow cover based on multi-source remote sensing data in China. Cryosphere 10, 2453–2463. doi:10.5194/tc-10-2453-2016
Hudson, A. M., Quade, J., Huth, T. E., Lei, G., Cheng, H., Edwards, L. R., et al. (2015). Lake level reconstruction for 12.8–2.3 ka of the Ngangla Ring Tso closed-basin lake system, southwest Tibetan Plateau. Quat. Res. 83, 66–79. doi:10.1016/j.yqres.2014.07.012
Huth, T., Hudson, A. M., Quade, J., Guoliang, L., and Hucai, Z. (2015). Constraints on paleoclimate from 11.5 to 5.0 ka from shoreline dating and hydrologic budget modeling of baqan tso, southwestern Tibetan Plateau. Quat. Res. 83, 80–93. doi:10.1016/j.yqres.2014.07.011
Kang, S., Xu, Y., You, Q., Flügel, W.-A., Pepin, N., and Yao, T. (2010). Review of climate and cryospheric change in the Tibetan Plateau. Environ. Res. Lett. 5, 015101. doi:10.1088/1748-9326/5/1/015101
Koppen, W. (1936). “Das geographisca system der Klimate,” in Handbuch der Klimatologie. Band I, teil C. Editors W. Koppen, and G. Geiger (Berlin: Gebrüder Borntraeger), 1–44.
Lambert, S. J., and Boer, G. J. (2001). CMIP1 evaluation and intercomparison of coupled climate models. Clim. Dyn. 17, 83–106. doi:10.1007/PL00013736
Laskar, J., Robutel, P., Joutel, F., Gastineau, M., Correia, A. C. M., and Levrard, B. (2004). A long-term numerical solution for the insolation quantities of the Earth. Astron. Astrophys. 428, 261–285. doi:10.1051/0004-6361:20041335
Manoj, M. C., Srivastava, J., Uddandam, P. R., and Thakur, B. (2020). A 2000 Year multi-proxy evidence of natural/anthropogenic influence on climate from the southwest coast of India. J. Earth Sci. 31, 1029–1044. doi:10.1007/s12583-020-1336-4
Otto-Bliesner, B. L., Braconnot, P., Harrison, S. P., Lunt, D. J., Abe-Ouchi, A., Albani, S., et al. (2017). The PMIP4 contribution to CMIP6 – Part 2: Two interglacials, scientific objective and experimental design for Holocene and Last Interglacial simulations. Geosci. Model Dev. 10, 3979–4003. doi:10.5194/gmd-10-3979-2017
Pan, B., and Li, J. (1996). Qinghai-Tibetan Plateau: A driver and amplifier of the global climatic change. J. Lanzhou Univ. Nat. Sci.) 32, 108–115. doi:10.13885/j.issn.0455-2059.1996.01.024
Salunke, P., Jain, S., and Mishra, S. K. (2019). Performance of the CMIP5 models in the simulation of the Himalaya-Tibetan Plateau monsoon. Theor. Appl. Climatol. 137, 909–928. doi:10.1007/s00704-018-2644-9
Shi, Y., Kong, Z., Wang, S., Tang, L., Wang, F., Yao, T., et al. (1992). The Holocene Megathermal climate and environment in China. Sci. China (Ser. B) 22, 1300–1308. doi:10.3321/j.issn:1006-9240.1992.12.003
Tan, X., Ma, Z., He, K., Han, X., Ji, Q., and He, Y. (2020). Evaluations on gridded precipitation products spanning more than half a century over the Tibetan Plateau and its surroundings. J. Hydrol. X. 582, 124455. doi:10.1016/j.jhydrol.2019.124455
Tang, G. L., and Ding, Y. H. (2007). Impacts of the average air temperature derived from maximum and minimum temperatures on annual mean air temperatures series of China. J. Appl. Meteor. 18, 187–192. doi:10.3969/j.issn.1001-7313.2007.02.008
The China Vegetation Atlas Editorial Committee and Chinese Academy of Sciences (2001). 1:1000000 scale vegetation distribution map of China. 1st ed. China: Science Press.
Trewartha, G. T., and Horn, L. H. (1980). An introduction to climate. 5th ed. New York: McGraw-Hill.
Wang, M., and Overland, J. E. (2004). Detecting arctic climate change using Köppen climate classification. Clim. Change 67, 43–62. doi:10.1007/s10584-004-4786-2
Wanner, H., Beer, J., Bütikofer, J., Crowley, T. J., Cubasch, U., Flückiger, J., et al. (2008). Mid- to late Holocene climate change: An overview. Quat. Sci. Rev. 27, 1791–1828. doi:10.1016/j.quascirev.2008.06.013
Wu, B., Lang, X., and Jiang, D. (2021). Köppen climate zones in China over the last 21, 000 years. Geophys. Res. Atmos. 126, e2020JD034310. doi:10.1029/2020jd034310
Wu, Q., and Zhang, T. (2008). Recent permafrost warming on the qinghai-Tibetan Plateau. J. Geophys. Res. 113, D13108–D13122. doi:10.1029/2007jd009539
Yang, K., Wu, H., Qin, J., Lin, C., Tang, W., and Chen, Y. (2014). Recent climate changes over the Tibetan Plateau and their impacts on energy and water cycle: A review. Glob. Planet. Change 112, 79–91. doi:10.1016/j.gloplacha.2013.12.001
Yang, K., Ye, B., Zhou, D., Wu, B., Foken, T., Qin, J., et al. (2011). Response of hydrological cycle to recent climate changes in the Tibetan Plateau. Clim. Change 109, 517–534. doi:10.1007/s10584-011-0099-4
Yao, T., Bolch, T., Chen, D., Gao, J., Immerzeel, W., Piao, S., et al. (2022). The imbalance of the Asian water tower. Nat. Rev. Earth Environ. 3, 618–632. doi:10.1038/s43017-022-00299-4
Yao, T., Thompson, L., Yang, W., Yu, W., Gao, Y., Guo, X., et al. (2012). Different glacier status with atmospheric circulations in Tibetan Plateau and surroundings. Nat. Clim. Chang. 2, 663–667. doi:10.1038/nclimate1580
Yao, T., Xue, Y., Chen, D., Chen, F., Thompson, L., Cui, P., et al. (2019). Recent third Pole’s rapid warming accompanies cryospheric melt and water cycle intensification and interactions between monsoon and environment: Multidisciplinary approach with observations, modeling, and analysis. Bull. Am. Meteorol. Soc. 100, 423–444. doi:10.1175/BAMS-D-17-0057.1
Yasutomi, N., Hamada, A., and Yatagai, A. (2011). Development of a long-term daily gridded temperature dataset and its application to rain/snow discrimination of daily precipitation. Glob. Environ. Res. 15, 165–172.
Yatagai, A., Kamiguchi, K., Arakawa, O., Hamada, A., Yasutomi, N., and Kitoh, A. (2012). Aphrodite: Constructing a long-term daily gridded precipitation dataset for asia based on a dense network of rain gauges. Bull. Am. Meteorol. Soc. 93, 1401–1415. doi:10.1175/BAMS-D-11-00122.1
Yoo, J., and Rohli, R. V. (2016). Global distribution of köppen–geiger climate types during the last glacial maximum, mid-holocene, and present. Palaeogeogr. Palaeoclimatol. Palaeoecol. 446, 326–337. doi:10.1016/j.palaeo.2015.12.010
Zhang, S., Zhang, J., Zhao, H., Xiangjun, L., and Chen, F. (2020). Spatiotemporal complexity of the “greatest lake period” in the Tibetan Plateau. Sci. Bull. 65, 1317–1319. doi:10.1016/j.scib.2020.05.004
Keywords: Köppen-Trewartha classification, Tibetan Plateau (TP), anthropogenic forcing, natural forcing, warm period
Citation: Huang L, Feng S, Chen J, Deng Y, Chen F and Huang W (2023) Changes of Köppen–Trewartha climate types in the Tibetan Plateau during the mid-Holocene, present-day, and the future based on high-resolution datasets. Front. Earth Sci. 10:1083899. doi: 10.3389/feart.2022.1083899
Received: 29 October 2022; Accepted: 17 November 2022;
Published: 12 January 2023.
Edited by:
Xianyong Cao, Institute of Tibetan Plateau Research (CAS), ChinaReviewed by:
Keyan Fang, Fujian Normal University, ChinaCopyright © 2023 Huang, Feng, Chen, Deng, Chen and Huang. This is an open-access article distributed under the terms of the Creative Commons Attribution License (CC BY). The use, distribution or reproduction in other forums is permitted, provided the original author(s) and the copyright owner(s) are credited and that the original publication in this journal is cited, in accordance with accepted academic practice. No use, distribution or reproduction is permitted which does not comply with these terms.
*Correspondence: Wei Huang, d2h1YW5nQGx6dS5lZHUuY24=
Disclaimer: All claims expressed in this article are solely those of the authors and do not necessarily represent those of their affiliated organizations, or those of the publisher, the editors and the reviewers. Any product that may be evaluated in this article or claim that may be made by its manufacturer is not guaranteed or endorsed by the publisher.
Research integrity at Frontiers
Learn more about the work of our research integrity team to safeguard the quality of each article we publish.