
94% of researchers rate our articles as excellent or good
Learn more about the work of our research integrity team to safeguard the quality of each article we publish.
Find out more
ORIGINAL RESEARCH article
Front. Earth Sci., 30 January 2023
Sec. Geohazards and Georisks
Volume 10 - 2022 | https://doi.org/10.3389/feart.2022.1082021
This article is part of the Research TopicAdvances in the Assessment, Monitoring and Mitigation of Multi-Hazard Risks for Critical InfrastructuresView all 4 articles
Prestress loss caused by broken wires can lead to a decline in the carrying capacity of prestressed concrete cylinder pipes (PCCPs). The strengthening of PCCPs using a post-tensioning method is becoming more and more widely utilized to restore strengthened pipes to the needed design capacity and to withstand combined loads. There is no need to drain the pipe during strengthening construction, and this strengthening actively replenishes the prestress loss caused by wire breakage at a cost-effective price. To verify the strengthening effect of this method, a full-scale test and its corresponding three-dimensional finite-element model were established. A three-dimensional numerical model of three continuous prototype pipes was established and accounted for the particularity of the bell and spigot. The numerical model of prestressing wires was optimized in two aspects, which was more in line with the actual situation. The spiral winding method instead of single winding was adopted to apply prestress, and the prestressing wires with a broken point were partitioned into two separate areas due to the bond quality between the mortar coating and the wires. The simulation and the full-scale test both contain the five processes of strengthening with external prestressed strands as follows: pressurized to working pressure→breaking the prestressing wires until visible cracks propagate→gradual depressurization to artesian pressure→the tensioning operation of strands→and pressurized to design pressure. A sensitivity analysis of the related factors of strengthening was performed through finite-element simulation to provide a better understanding of the design. The simulation results were consistent with the data on the full-scale test and indicated the rationality of this process. The strengthening of PCCP with a post-tensioning method can meet the design demand and is a feasible strengthening method. The working pressure and control coefficient of tensioning have the most significant impact on the strengthening effect. Technical recommendations and a better understanding of the application of the post-tensioning method on PCCP are provided in this study.
Prestressed concrete cylinder pipes (PCCPs) are playing an increasingly remarkable role in water conveyance projects in municipal, industrial, and agricultural systems due to their structural merits such as high bearing capacity, strong permeability resistance, and cost-effectiveness. The fractures of prestressing wires can be a consequence of external corrosion, hydrogen embrittlement, or manufacturing defects (Amaechi et al., 2022a). The composites differ from standard materials such as steel (Amaechi et al., 2022b), and the ruptures of PCCP may cause a significant loss to society and make the strengthening of pipes with broken wires essential.
Recent developments of strengthening methods have attracted great attention. To strengthen deteriorating pipes, comprehensive strengthening methods have been proposed such as the replacement (Zhang et al., 2017), internal strengthening methods (such as relining (Smith and Bruny, 2004; Ambroziak et al., 2010; Matthews et al., 2013), slip-lining (Rahman et al., 2012), and carbon fiber-reinforced polymer (CFRP) (Dou et al., 2017a; Dou et al., 2017b; Dou et al., 2018)), and external strengthening methods (Elnakhat and Raymond, 2006). Strengthening with external prestressed strands is prominent, given that draining the pipeline is non-essential for construction. This method is capable of actively replenishing the prestress loss caused by wire breakage (Rahman et al., 2012). Ge and Sunil (2012) presented a literature review of the most commonly used condition assessment technologies and performance prediction methods for PCCP by listing their capabilities and limitations. They also (Ge and Sunil, 2015; Ge, 2016) optimized the finite-element model by considering the prestress residue after wire breakage. Zarghamee M. S. conducted a series of studies on the limit state of PCCP under multiple load conditions (Zarghamee et al., 1988; Heger et al., 1990; Zarghamee et al., 1990; Zarghamee et al., 1993) and failure mechanisms (Zarghamee and Fok, 1990; Zarghamee et al., 2002; Erbay et al., 2007) through experiments and finite-element analysis. Najafi et al. (2011) and Hajali M. [(Hajali et al., 2015), (Hajali et al., 2016)] studied the influence of PCCPs’ carrying capacity by using finite elements for different breaking locations and different numbers of broken wires. Results suggest that the location of broken wires has a pivotal effect on the PCCP carrying capacity. Merrin et al. (2014) utilized finite-element simulation to analyze the interaction between the pipe and soil under external traffic and internal pressure loads. A sensitivity analysis was performed to determine the degree of pipeline characteristics, soil characteristics, and multiple loads on the structural performance of the pipeline. Zhao L.J (Zhao et al., 2019a; Zhao et al., 2019b) developed a theoretical study and a prototype test to confirm the strengthening effect of the post-tensioning method on PCCP.
To verify the strengthening effect of this method, a full-scale test and a three-dimensional numerical model of three continuous prototype pipes were established in this study. The external strengthening method aims at mitigates multi-hazard risks for PCCP.
The numerical model of prestressing wires was optimized, and the concrete damaged plasticity (CDP) was utilized as the constitutive model of the concrete core and the mortar coating considering the decrease in stiffness. The whole process of strengthening with external prestressed strands was simulated in both the finite-element simulation and the full-scale test as follows: pressurized to working pressure →breaking the prestressing wires until visible cracks propagate→gradual depressurization to artesian pressure→the tensioning operation of strands→and pressurized to design pressure. Furthermore, a sensitivity analysis of the related factors of strengthening was performed through finite-element simulation to provide a better understanding of the design.
The three-dimensional finite-element model was conducted with a 2.0-m diameter embedded PCCP (ECP). All components of the pipe and surrounding soil were separately considered in this model. The total length of an ECP with a bell and spigot (GB/T, 2017) is 5.135 m. There was one complete pipe and two parts of a pipe modeled to account for the effect of the bell and spigot (Figure 1). Pipe #1 and Pipe #3 were original and were not processed, while the prestressing wires were cut in Pipe #2 and the pipe was reinforced. In the simulation model, the contact between the bell and spigot was fully considered. The structures of the bell and spigot are appropriately simplified due to their complexity, as shown in Figure 2.
The concrete core, mortar coating, and surrounding soil were meshed into a solid using a three-dimensional eight-node brick element with reduced integration (C3D8R). A three-dimensional truss element (T3D2) was utilized to simulate the prestressing wires and steel strands. To simulate the real form of the prestressing wires as much as possible, the prestressing wires in this finite-element model were spirally wound around the outside of the concrete core at a pitch of 22.1 mm (Figure 3). Considering that the thickness of the cylinder can be ignored compared to the total length of the pipe, the steel cylinder was modeled with a four-node quadrilateral shell element with reduced integration (S4R). The geometric and material properties of the pipe analyzed in this paper are displayed in Table 1. The tensile stress of the strand simulated in this model was 1860
The overall size of the surrounding soil was
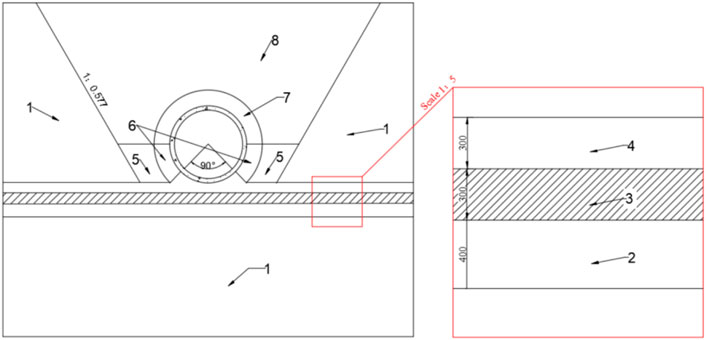
FIGURE 5. Partition of the surrounding soil of PART B: (1) stereogram of the soil; (2) front view of part B as follows: 1—undisturbed section; 2—light disturbed section; 3—moderately disturbed section; 4—severely disturbed section; 5—bottom fill-back; 6—cradle section; 7—buffer section; and 8—upper fill-back (Dimension: mm).
The concrete damaged plasticity (CDP) model (GB, 2010; Hu et al., 2019) was applied to the concrete core and mortar coating. For the steel cylinder, prestressing wires and strands and the elastoplastic stress–strain relationship in tension and compression were utilized in this model, and the Mohr–Coulomb model was suitable for the surrounding soil.
Combined loads acting on the pipe mainly included internal water pressure and the gravity acting on the pipe and the surrounding soil. The bottom of the soil was totally fixed. The top surface of the model was free, and the other four sides of this model were fixed in the normal direction of their surfaces. The working value of the water pressure was
For the interaction between each component, the concrete was completely tied with the mortar coating. The prestressing wires were embedded in the mortar coating, and the cylinder was embedded in the concrete core. The slide between the other materials was ignored in this paper. The friction relationship was applied between the bell and spigot with a coefficient of 0.2, and the same relationship was applied between the pipe and the surrounding soil with a coefficient of 0.35.
The prestress of the wires and strands was applied using the equivalent temperature cooling method. In previous models, the prestress of the wires was considered zero once the break occurred. However, in the majority of the ruptures, pipes fail at the four or eight o′clock orientation (Ge and Sunil, 2015). The bond between the prestressing wires and the mortar coating attributes to the remaining prestress beyond a certain length from the broken point (AWWA, 2015). The corresponding angle of this length was assumed to be
There are various methods for applying prestress, such as the initial strain method, equivalent temperature cooling method, and initial stress method. The second method was adopted to apply prestress in this simulation. The temperature difference is calculated as
The entire analysis process (Figure 7) involves five procedures: (I) pressurizing to the working pressure (
A full-scale test was conducted (Figure 8), and the geometric and material properties of the two pipes were the same as the simulated models.
The monitoring objects include the strains of each component of the pipe and the prestressed strands. Resistance strain gauges were utilized due to their high reliability and strong anti-interference abilities.
Figure 9 presents the layout of monitoring points along the axial direction. Section 1 (S1, 2.5 m) is located in the middle of the zone where all prestressing wires break. Section 2 (S2, 3.0 m) is the zone affected by the broken wires. Section 3 (S3, 4.0 m) is the zone that is sufficiently far from the broken wires. The orientations of the resistance strain gauges are arranged on the concrete core, and the wires were 90°, 180°, 270°, and 360°, respectively. The strain gauges that were chosen were 50 × 3 mm and 10 × 2 mm for the concrete and wires, respectively.
The strain gauges were located on strands at 90°, 180°, 270°, and 360° orientations of S1, as shown in Figure 10. There were a total of nine measuring points. The choice of the strain gauge was 2 × 1 mm for the strands.
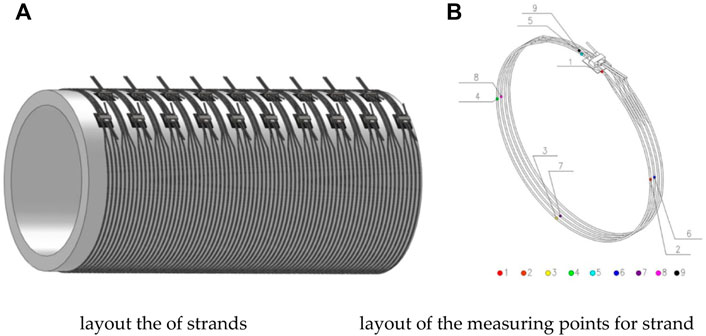
FIGURE 10. Details of the strands. (A) Layout of the strands and (B) layout of the measuring points for the strand.
The prestress of the wires contributed to the initial compressive strains of the concrete core. The pre-strains of the concrete core and the wires were included in the strains obtained by the resistance strain gauges. The real strain of the concrete core and prestressing wires should be revised as follows:
where
The process of the full-scale test and the finite-element simulation both contain the following five stages. The stress response of each component and prestressed strands in each process were analyzed. Once the real strain of the concrete core (Feng, 2008; GB, 2015) reaches
Load stage I) Pressurizing to a working pressure of (
The hoop strains of the concrete core and prestressing wires of Section 2 with the increase of the internal water pressure are illustrated in Figures 11A, B, respectively. The FEM and test in Figures 11A, B correspond to the simulated results and full-scale test results.
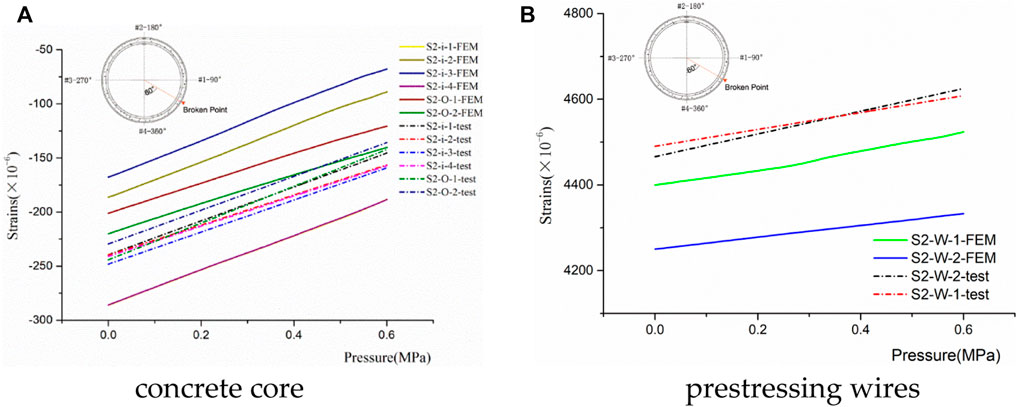
FIGURE 11. Comparison of FEM and test results of the concrete core at load stage I. (A) Concrete core and (B) prestressing wires.
A rise in the water pressure resulted in a linear growth of the strains in the concrete core and prestressing wires. The concrete core and the prestressing wires were primarily responsible for withstanding the internal water pressure, and the concrete core was still under compression. The strains at
There was no crack initiation in the concrete core. The structural integrity condition was good. Figure 11 shows that the simulation results were in agreement with the full-scale test data.
Figure 12 illustrates the stress and strain of the concrete core at a pressure of
Load stage (II) Breaking the prestressing wires until visible cracks propagate (
Figure 13A presents corresponding strains in the prestressing wires with the rate of broken wires measured in the prototype test. Compared to measuring point #2 of Section 1 and Section 2, the strains at measuring point #1 of Section 1 and Section 2 sharply dropped. The bonding between the mortar coating and wires was in a benign state. The wire strains at measuring point 1 decreased to some extent, while the prestress of the broken wires at measuring point 2 remained. The wire breakage has little impact on the prestressing wires of Section 3, which is also due to the bonding.
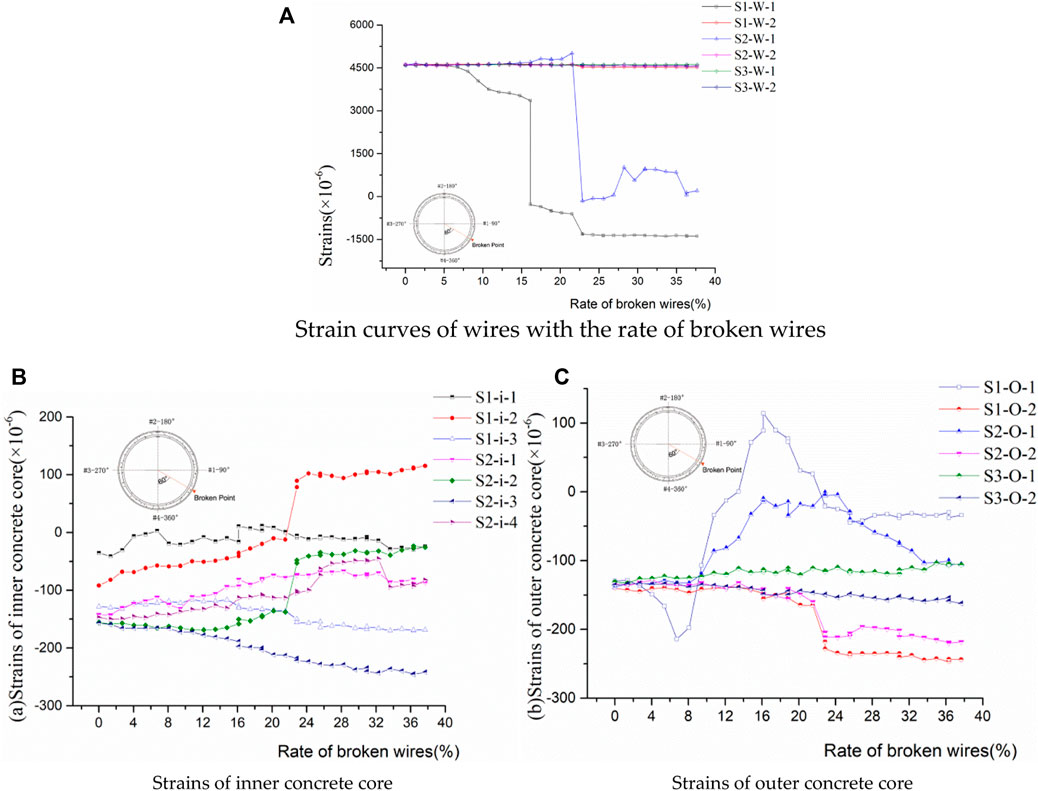
FIGURE 13. Strain curves of wires with the rate of broken wires. (A) Strain curves of wires with the rate of broken wires, (B) strains of the inner concrete core, and (C) strains of the outer concrete core.
Figures 13B, C exhibit the hoop strain in the inner concrete core and the outer concrete core. The strain in the concrete core fluctuated non-linearly with the increase in the rate of broken wires. The strains in the concrete core of S1 and S2 fluctuated. Similar to the situation of prestressed wires, the strains in the concrete core area sufficiently far from the broken wires (Section 3) were less affected by breaking wires. Figure 14 depicts the visible cracks that occurred in the outer concrete core near measuring point #1. The longitudinal cracks rapidly propagated with the growth rate of broken wires. Several narrow branches were induced piecemeal and extra longitudinal cracks simultaneously appeared. The maximum width of the macro-cracks in the outer concrete core at a
The operation of breaking wires was terminated when the rate of broken wires reached 37.7%. Then, the strain of the concrete core was
Load stage (III) De-pressurizing to the artesian pressure of (
Figure 16 illustrates the hoop strains in the concrete core with a decrease of internal water pressure. A decrease in the water pressure decreased the corresponding strains of the concrete core. The stress redistribution of the pipe was induced by dynamic fluctuation. The width of macro-cracks in the outer concrete core at
Load stage (IV) The laying and tensioning operation of the strands as (
The tensioning operation of the strands was performed after depressurization. The strains in the concrete core all exhibited an obvious decrease after the tensioning operation of strains (Figure 17). The width of macro-cracks at the
Load stage (V) Pressurizing to the design value (
A step-by-step pressurization was adopted to increase the water pressure to the design value of
Figure 18 illustrates the strain comparison of each measuring point in the concrete core before and after strengthening of the water pressure at
The stress of the prestressed strands was 1026 N/mm2 through finite-element analysis at a pressure of 0.9 N/mm2 (Figure 20). This is slightly less than the target tensile strength of the prestressed strands and can meet the strengthening requirements.
To investigate the sensitivity of the relating factors and optimize the design of the external strengthening, a series of parametric studies were conducted. In each case, the effect of changing a single parameter by numerical analysis was examined.
The working pressure and depth of the soil above the top of the pipe are the main internal and external load, respectively. These parameters both play an important role in the carrying capacity of the pipe.
The first parameter to examine is the working pressure of the test pipe. The working pressure was
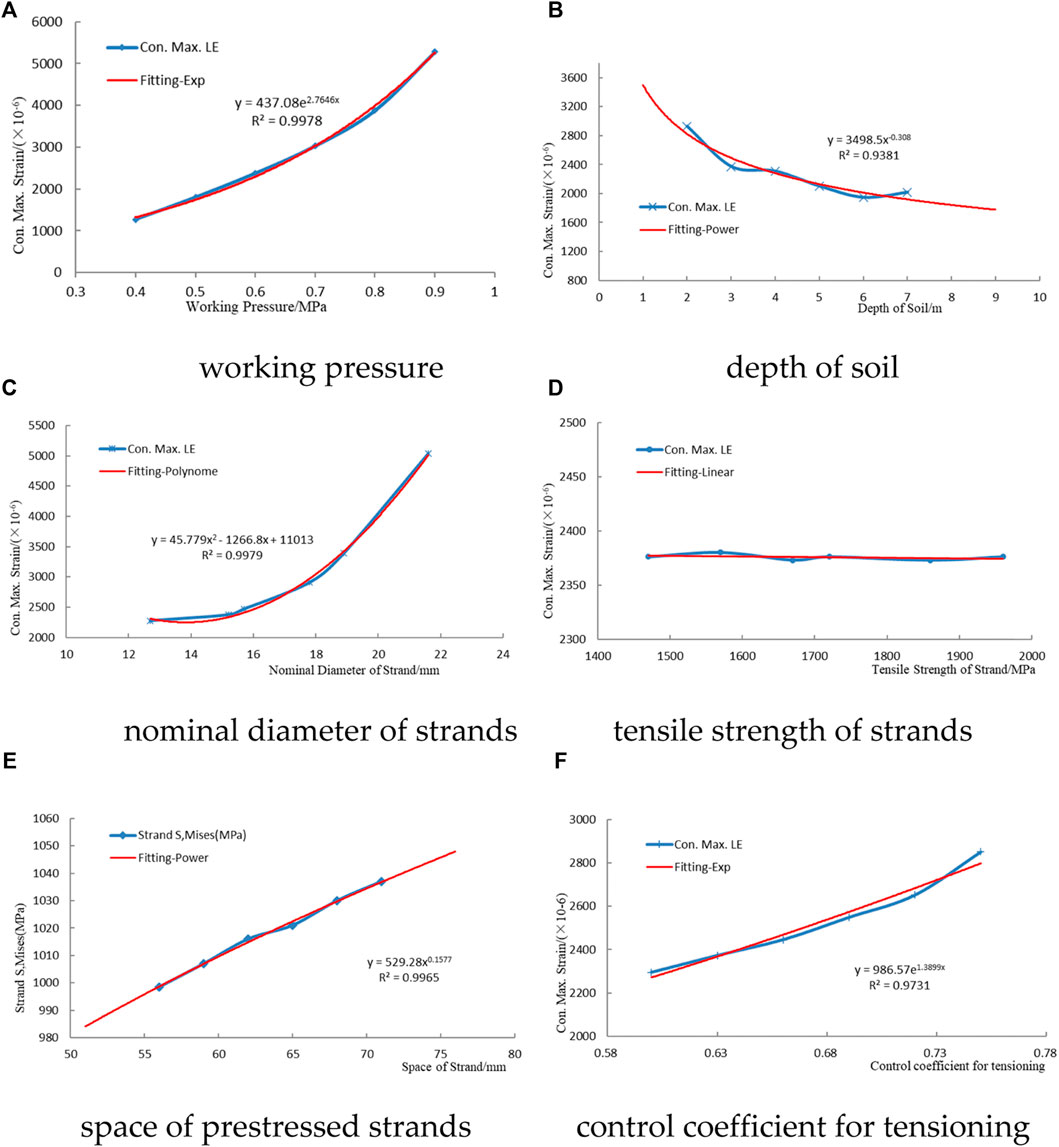
FIGURE 21. Sensitivity analysis of the working pressure. (A) Working pressure, (B) soil depth, (C) nominal diameter of the strands, (D) tensile strength of the strands, (E) space of prestressed strands, and (F) control coefficient for tensioning.
The maximum strain in the concrete core increased exponentially with an increase of the working pressure. The change of the internal water pressure significantly influenced the bearing capacity of the PCCP. The determination coefficient was
The effects of strengthening under different soil depths were analyzed using finite-element analysis. The depth of the soil above the top of the pipe was 2 m, 3 m, 4 m, 5 m, 6 m, and 7 m, while the other parameters remained constant. The maximum strain of the concrete core at the design pressure is considered the final judgment standard (as depicted in Figure 21B).
The maximum strain in the concrete core decreased with an increase of soil depth. The element with the maximum strain was always located at the spigot ring. The trend line is a power function, and the determination coefficient is
The pivotal factors that influence the selection of strands include its nominal diameter and tensile strength. The structural performance of the pipe under different nominal diameters and tensile strengths of the strands was analyzed.
The nominal diameter of the strands was 12.7 mm, 15.2 mm, 15.7 mm, 17.8 mm, 18.9 mm, and 21.6 mm for each case. The corresponding section area at unit length [34] is 98.7
The maximum strain in the concrete core increased as the nominal diameter of the strands increased. The trend line was a second-order polynomial, and the determination coefficient was
The effects of strengthening with different strand tensile strengths were analyzed. The tensile strength of the strands was the only factor that was changed, which was
The maximum value of the strain in the concrete core was nearly unchanged. The variety of tensile strengths had little effect on the carrying capacity of the PCCP. In addition, exorbitant tensile strength does not play a significant role in improving the safety and carrying capacity of the pipe.
The spacing of prestressed strands directly determines the cross-sectional area within the unit length. The effects of strengthening with different spacing of strands were analyzed. The strand space was 56 mm, 59 mm, 62 mm, 65 mm, 68 mm, and 71 mm, while the other parameters remained constant. The maximum stress of the prestressed strands at the design pressure is considered the final judgment standard (as displayed in Figure 21E).
The maximum stress value in the prestressed strands increases with an increase in the strand spacing. The trend line is a power function, and the determination coefficient is
The control coefficient for tensioning is another critical parameter for strengthening. The effects of strengthening with different control coefficients for tensioning were analyzed. The control coefficients for tensioning were 0.60, 0.63, 0.66, 0.69, 0.72, and 0.75, while the other parameters remained constant. The maximum strain of the concrete core at the design pressure is considered the final judgment standard (as described in Figure 21F).
The maximum strain in the concrete core increased exponentially with an increase of the control coefficient for tensioning, and the determination coefficient was
A full-scale test and numerical analysis were conducted to determine the strengthening effect of the post-tensioning method on PCCP. The main discussion points are as follows:
1) The simulation results agreed with the full-scale test data, which indicated the rationality of the simulation and the full-scale test. The reinforced pipe was capable of withstanding the design loads and did not leak after strengthening. The cracks in the outer concrete core at the
2) The spigot ring has the largest strain value during the entire procedure and is the weakest point of the whole pipe. Breaking wires attribute to the apparent loss of prestress within a certain length. The wire prestress resumes to the original state when moving away from the broken point due to the bonding between the mortar coating and the prestress wires.
3) The working pressure and control coefficient for tensioning have the most significant impact on the strengthening effect, followed by the effects of the soil depth above the top of the pipe, the nominal diameter, and the strand spacing. The tensile strength of the strands has little effect on the strengthening of the PCCP with the post-tensioning method. This study presents the comprehensive work needed for strengthening of PCCP with the post-tensioning method.
The original contributions presented in the study are included in the article/Supplementary material; further inquiries can be directed to the corresponding author.
Conceptualization, TD and LZ; methodology, TD; software, CL; writing—original draft preparation, LZ; writing—review and editing, ML.
The authors declare that the research was conducted in the absence of any commercial or financial relationships that could be construed as a potential conflict of interest.
All claims expressed in this article are solely those of the authors and do not necessarily represent those of their affiliated organizations, or those of the publisher, the editors, and the reviewers. Any product that may be evaluated in this article, or claim that may be made by its manufacturer, is not guaranteed or endorsed by the publisher.
Amaechi, C. V., Reda, A., and Kgosiemang, I. M. (2022). Guidelines on asset management of offshore facilities for monitoring, sustainable maintenance, and safety practices. Sensors 22 (19), 7270.
Amaechi, C. V., Chesterton, C., Butler, H. O., Gillet, N., Wang, C., Ja’e, I. A., et al. (2022). Review of composite marine risers for deep-water applications: Design, development and mechanics. J. Compos. Sci. 6 (3), 96.
Ambroziak, M., Kelso, P. E. B., and Sinclair, J. (2010)“Development and construction of the nation’s largest water main rehab project,” in Proceedings of the Pipelines 2010: Climbing New Peaks to Infrastructure Reliability: Renew, Rehab, and Reinvest, held in Keystone, Colorado, August 28-September 1, 2010, 51–60.
AWWA (2015). AWWA C304 standard for design of prestressed concrete cylinder pipe. Denver, CO, USA: American Water Works Association.
Dou, T. S., Cheng, B. Q., Hu, H., Xia, S. F., Yang, J. X., and Zhang, Q. (2018). The prototype test study of prestressed concrete cylinder pipe structure deformation law.The external pressure. J. Hydraul. Eng. 49 (2), 207–215.
Dou, T. S., Cheng, B. Q., Hu, H., Xia, S. F., Yang, J. X., and Zhang, Q. (2017a). The prototype test study of prestressed concrete cylinder pipe structure deformation law.The internal pressure. J. Hydraul. Eng. 48 (12), 1438–1446.
Dou, T. S., Cheng, B. Q., Hu, H., Xia, S. F., and Zhao, L. J. (2017b). The experimental study on CFRP renewal of PCCP with broken wires. China Concr. Cem. Prod. 12, 35–40.
Elnakhat, H., and Raymond, R. (2006). “Repair of PCCP by post tensioning,” in Pipeline Division Speciality Conference 2006, Chicago, Illinois, 12 July 2006, 1–5.
Erbay, O. O., Zarghamee, M. S., and Ojdrovic, R. P. (2007). “Failure risk analysis of lined cylinder pipes with broken wires and corroded cylinder,” in Pipelines 2007: Advances and Experiences with Trenchless Pipeline Projects, Boston, Massachusetts, 8-11 July 2007, 1–10.
Feng, X. Z. (2008). Comparison of ASTM concrete compressive strength and China’s concrete strength grade. Northwest Hydropower 3, 65–67.
GB (2010). GB 50010-2010 Code for design of concrete structures. Beijing: National Standard of the people’s Republic of China.
GB (2015). GB 5224-2014 Steel strand for prestressed concrete. Beijing: National Standard of the people’s Republic of China.
GB/T (2017). Prestressed concrete cylinder pipe. Beijing: National Standard of the people’s Republic of China.
Ge, S. Q. (2016). “PCCP condition assessment are current numerical models too conservative,” in Pipelines 2016, Canada, Calgary, 26-30 September 2016, 527–537.
Ge, S. Q., and Sunil, S. (2015). Effect of mortar coating’s bond quality on the structural integrity of prestressed concrete cylinder pipe with broken wires. J. Mat. Sci. Res. 4, 59–75. doi:10.5539/jmsr.v4n3p59
Ge, S. Q., and Sunil, S. (2012). Failure analysis, condition assessment technologies, and performance prediction of prestressed concrete cylinder pipe (PCCP): A state-of-the-art literature review. J. Perform Constr. Fac. 3, 618–628.
Hajali, M., Alavinasab, A., and Abi Shdid, C. (2016). Structural performance of buried prestressed concrete cylinder pipes with harnessed joints interaction using numerical modeling. Tunn. Undergr. Sp. Tech. 51, 11–19. doi:10.1016/j.tust.2015.10.016
Hajali, M., Alavinasab, A., and Shdid, C. A. (2015). Effect of the location of broken wire wraps on the failure pressure of prestressed concrete cylinder pipes. Struct. Concr. 16 (2), 297–303. doi:10.1002/suco.201400070
Heger, F. J., Zarghamee, M. S., and Dana, W. R. (1990). Limit-States design of prestressed concrete pipe. I: Criteria. J. Struct. Eng. 116 (8), 2083–2104. doi:10.1061/(asce)0733-9445(1990)116:8(2083)
Hu, B., Fang, H., Wang, F., and Zhai, K. (2019). Full-scale test and numerical simulation study on load-carrying capacity of prestressed concrete cylinder pipe (PCCP) with broken wires under internal water pressure. Eng. Fail. Anal. 104, 513–530. doi:10.1016/j.engfailanal.2019.06.049
Matthews, J. C., Selvakumar, A., and Condit, W. (2013). Current and emerging water main renewal technologies. J. Infrastruct. Syst. 19 (2), 231–241. doi:10.1061/(asce)is.1943-555x.0000121
Merrin, J., Hung, H. P., Rajeev, P., Robert, D. J., and Kodikara, J. (2014). “Stress analysis of buried pipes,” in 8th Australasian Congress on Applied Mechanics, ACAM 8, Melbourne, Australia, 23-26 November 2014, 1–10.
Najafi, M., Mielke, R., and Ramirez, G. (2011). “Analysis and testing of a prototype jointing system for bar,” in Pipelines: A Sound Conduit for Sharing Solutions - Proceedings of the Pipelines 2011 Conference, Beijing, China, 26-29 October 2011, 864–871.
Rahman, S., Smith, G., Mielke, R., and Keil, B. (2012). “Rehabilitation of large diameter PCCP: Relining and sliplining with steel pipe,” in Proceedings of the Pipelines 2012: Innovations in Design, Construction, Operations, and Maintenance -Doing More with Less, Miami, Florida, USA, 19-22 August 2012, 494–504.
Smith, G., and Bruny, J. (2004). “Relining prestressed concrete cylinder pipe, A manufacturers perspective,” in Pipelines 2004: Pipeline Engineering and Construction - What's on the Horizon?, San Diego California, United States, 01-04 August 2004 (American Society of Civil Engineers), 1–6.
Zarghamee, M. S., Egger, D. W., and Ojdrovic, R. P. (2002). “Finite-element modeling of failure of PCCP with broken wires subjected to combined loads,” in Pipelines 2002 Beneath Our Feet: Challengers and Solutions - Proceedings of the Pipeline Division Specialty Conference, Cleveland, Ohio, 4-7 August 2002, 1–17.
Zarghamee, M. S., and Fok, K. (1990). Analysis of prestressed concrete pipe under combined loads. J. Struct. Eng. 116 (7), 2022–2039. doi:10.1061/(asce)0733-9445(1990)116:7(2022)
Zarghamee, M. S., Fok, K., and Sikiotis, E. S. (1990). Limit states design of prestressed concrete pipe II: Procedure. J. Struct. Eng. 116 (8), 2105–2126. doi:10.1061/(asce)0733-9445(1990)116:8(2105)
Zarghamee, M. S., Heger, F. J., and Dana, W. R. (1988). Experimental evaluation of design methods for prestressed concrete plpe. J. Transp. Eng. 114 (6), 635–655. doi:10.1061/(asce)0733-947x(1988)114:6(635)
Zarghamee, M. S., Ojdrovic, R. P., and Dana, W. R. (1993). Coating delamination by radial tension in prestressed concrete pipe. I experiments. J. Struct. Eng. 119 (9), 2701–2719. doi:10.1061/(asce)0733-9445(1993)119:9(2701)
Zhang, H., Dong, S., and Zhou, W. (2017). Introduction of the technology for repairing and updating the prestressed concrete cylinder pipe (PCCP) structure. Water $ Wastewater Eng. 53 (8), 104–108.
Zhao, L. J., Dou, T. S., Cheng, B. Q., Xia, S. F., Yang, J. X., Zhang, Q., et al. (2019). Experimental study on the reinforcement of prestressed concrete cylinder pipes with external prestressed steel strands. Appl. Sci.-Base 9 (1), 149. doi:10.3390/app9010149
Keywords: PCCP, post-tensioning method, numerical study, broken wires, full-scale test
Citation: Zhao L, Dou T, Li C and Li M (2023) Experimental and numerical analysis of strengthening prestressed concrete cylinder pipes using a post-tensioning method. Front. Earth Sci. 10:1082021. doi: 10.3389/feart.2022.1082021
Received: 27 October 2022; Accepted: 30 November 2022;
Published: 30 January 2023.
Edited by:
Francesca Bozzoni, Fondazione Eucentre, ItalyReviewed by:
Ahmed Reda, Curtin University, AustraliaCopyright © 2023 Zhao, Dou, Li and Li. This is an open-access article distributed under the terms of the Creative Commons Attribution License (CC BY). The use, distribution or reproduction in other forums is permitted, provided the original author(s) and the copyright owner(s) are credited and that the original publication in this journal is cited, in accordance with accepted academic practice. No use, distribution or reproduction is permitted which does not comply with these terms.
*Correspondence: Lijun Zhao, emhhb2xqQGl3aHIuY29t
Disclaimer: All claims expressed in this article are solely those of the authors and do not necessarily represent those of their affiliated organizations, or those of the publisher, the editors and the reviewers. Any product that may be evaluated in this article or claim that may be made by its manufacturer is not guaranteed or endorsed by the publisher.
Research integrity at Frontiers

Learn more about the work of our research integrity team to safeguard the quality of each article we publish.