 Han Li
 Le Xi
Le Xi Xin-Min Wang3,4*
95% of researchers rate our articles as excellent or good
Learn more about the work of our research integrity team to safeguard the quality of each article we publish.
Find out more
ORIGINAL RESEARCH article
Front. Earth Sci. , 03 January 2023
Sec. Environmental Informatics and Remote Sensing
Volume 10 - 2022 | https://doi.org/10.3389/feart.2022.1079369
This article is part of the Research Topic Advances in Numerical Model, Data Assimilation, and Observations for Hazardous Weather Prediction View all 10 articles
Introduction: In this study, based on the ERA5 dataset, the orographic precipitation characteristics during an extraordinary heavy rainfall event in Henan Province on 19 July 2016 are analyzed.
Methods: In addition, by using the WRF model and the NCEP GDAS/FNL dataset, a high-resolution numerical simulation is carried out, including a series of sensitivity experiments on the Taihang Mountains, Yunmeng Mountain, and low-altitude areas.
Results and Discussion: The distribution of observed precipitation shows that the precipitation over the Taihang Mountains in northern Henan during the daytime on July 19 is significantly enhanced due to the topographic effect compared with that over the plain on the east. The simulation results demonstrate that the distribution of simulated precipitation over the steep terrains on the east side of the Taihang Mountains is closer to the observational precipitation when SRTM-90m is introduced to the WRF model. When the altitude of the Taihang Mountains is lowered by 50%, the accumulated precipitation along the Taihang Mountains in the daytime on July 19 decreases by 26%, accompanied by the northward movement of the heavy precipitation center over the northern Taihang Mountains. In addition, Yunmeng Mountain plays an important role in blocking or diverting the easterly and southeasterly low-level jet. When the terrain elevation of Yunmeng Mountain is reduced, the convergence zone of the wind field in the low level moves to the areas along the Taihang Mountains, which leads to the expansion of the area with heavy rainfall, with the average accumulated precipitation in mountain areas increasing by 7%. In addition, when the low altitude terrain in the study region is reduced by 50%, the center of heavy precipitation obviously moves westward. Combined with the diagnostic analysis of the topographically forced vertical velocity, the results show that the uplift of the low-level jet caused by the low-altitude terrain in northern Henan is one of the reasons that affect the location of the heavy rainfall center.
China is a country with complex terrains and diverse climates. On the whole, the terrain is high in the west and low in the east, and the mountain has a great influence on the weather and climate. Among them, topographic precipitation has always been the focus and difficulty in meteorological scientific research studies and forecasts.
Previous studies have revealed that topography plays a key role in precipitation formation, and the influences of different topographies on precipitation show different characteristics. The main influential mechanisms include dynamic forcings (uplift and convergence), thermal effects (heating on the underlying surface and latent heat release), and cloud microphysical processes influenced by topography (Liao et al., 2007; Houze, 2012; Huang et al., 2020). Moreover, the complex terrain is one of the crucial factors causing local extraordinary heavy rainfall. The intensity and distribution of the topographically forced precipitation vary under different environmental conditions (Ding, 2015; Wang et al., 2018). So far, there have been many significant achievements in deciphering the specific role of the terrain in affecting the precipitation. Based on a statistical analysis of the precipitation characteristics during 53 typhoon incidents affecting Taiwan during 1993–2013, Wu et al. (2015) pointed out that the hourly mean precipitation at the elevation of 500 m above is higher than that at the elevation of 500 m below. For a topographic precipitation process caused by Typhoon Morakot in 2013, Yu et al. (2013) proposed that the topographic effect in northern Taiwan is stronger than that in southern Taiwan on the enhancement of precipitation.
Moreover, the intensity of the topographic effect is related to the background precipitation and the mountainward wind speed caused by large-scale weather systems. Taking a low-pressure system as an example, the southwest warm and humid airflow on the front side and the northeast cold and dry airflow on the back side have different thermal properties and wind directions, resulting in heavy precipitation of different intensities and distributions when encountering mountain areas (Tsai et al., 2018). Meanwhile, forced topographic uplift and vertical wind shear caused by the terrain also can lead to the enhancement of thunderstorm downhill (Wang et al., 2017). Based on the relationship between the characteristics of hourly precipitation and the altitude in the Sichuan Basin, Zhou et al. (2019) indicates that the significant growth areas of precipitation and heavy rainfall days are mainly concentrated in the altitudes of 200–1,200 m. The diurnal changes in the mountain–valley wind can also cause increased night rain on the one side and frequent afternoon heavy rainfall on the other side of the mountain (Zhang et al., 2020). Therefore, the influences of different mountains, altitudes, and slopes on precipitation are different, and the influential mechanisms of different terrains on weather systems and associated precipitation are complex.
Due to the sparse distribution of observation stations and the poor representativeness of the data with low spatio-temporal resolution in mountainous regions with complex terrain, it is difficult to distinguish the effect of small- and medium-scale terrain on precipitation by conventional observations. Hence, many scholars have carried out analyses and research studies on the influence mechanisms of different terrains on precipitation through numerical simulation experiments (Chao et al., 2018; He et al., 2013; He et al., 2015; Wang et al., 2018). The research on multi-source observation data assimilation technology under complex terrain is also helpful to deeply understand the evolution mechanism of topographic precipitation (Shen et al., 2020; Zhong, 2020; Shen et al., 2021). Pontoppidan et al. (2017) conducted a series of simulation experiments with different resolutions on a heavy rainfall event in western Norway in October 2014. It is found that there is no significant improvement for the precipitation simulation by WRF with a finer resolution from 3 km to 1 km, and a reasonable resolution for the model should be related to the complexity of the terrain in the model domain. Milrad et al. (2017) designed a topographic sensitivity experiment for a heavy rainfall case in Alberta, western Canada, based on the WRF model. The results show that the intensity and location of the heavy rainfall center will change obviously when the terrain-smoothing exceeds 25%. Therefore, the numerical simulation is helpful to deeply analyze and effectively understand the critical role of different complex terrains in the evolution of local precipitation.
A regional rainstorm process occurred in North China from 18 to 21 July 2016, which has been widely studied, and meaningful results have been achieved (Lei et al., 2017; Yi et al., 2018; Zhao et al., 2018; Han et al., 2018; Jing et al., 2019). These research studies show that this rainstorm case is mainly affected by the vortex and the surface cyclone system. In particular, because the extraordinary heavy rainfall area is located on the complex terrain along the Taihang Mountains, the precipitation enhancement due to the topographic effect is significant. However, it is still necessary to research further and conduct a detailed study on the specific effect of multi-scale topographies on this rainstorm process, especially the internal relationship between terrain features and precipitation distribution, intensity and evolution, and the mechanism of terrain triggering the precipitation as well. Therefore, in this study, the WRF model is used to carry out high-resolution simulation experiments, and the topographically-forced vertical motion is also diagnostically analyzed. In addition, the characteristics and mechanisms for the influence of the large-scale terrain around the northern part of Henan Province and the local complex topography on the precipitation during the “7.19” process are focused on, aiming to enhance the recognition of the abnormal precipitation in mountainous areas of northern Henan Province and provide a necessary basis for the forecasts of precipitation hazards in mountainous areas.
In this study, the data used for the analysis and diagnosis include the CMA multisource precipitation analysis system (CMPA-Hourly V2.0) dataset, which merges the observational data from automatic meteorological stations of the China Meteorological Administration and the precipitation data retrieved from satellite images from the National Oceanic and Atmospheric Administration (NOAA) adopting the Climate Prediction Center morphing technique (CMORPH) with a horizontal resolution of 0.05 × 0.05 (Yang et al., 2019); the fifth-generation reanalysis dataset from the European Centre for Medium-Range Weather Forecasts (ERA5) dataset; the National Centers for Environment Prediction final reanalysis data from the Global Data Assimilation System (NCEP GDAS/FNL), which are used as the background fields for the model, with a horizontal resolution of 0.25 × 0.25 and temporal resolution of 6 h (http://rda.ucar.edu/datasets/ds083.3); and the digital elevation model (DEM) data from the Shuttle Radar Topography Mission (SRTM, with a resolution of 90 m), which provides high-resolution terrain data for comparative experiments by high-resolution numerical simulation.
The mesoscale model WRF V3.9.1 adopts the non-static equilibrium dynamic framework for double-nested simulations. The center point of the coarse grids is at 113°E, 37°N, and the horizontal grid intervals are 3 km for domain 1 (D01) and 1 km for domain 2 (D02), with the grid numbers for calculation being 401 × 401 and 451 × 451, respectively (Figure 1A). The vertical resolution is 50 layers, with the model top at 50 hPa. The time-step sizes of integration are 18 s for D01 and 6 s for D02, and the integration time for simulation is 36 h from 1200 UTC on 18 July 2016 to 0000 UTC on 20 July 2016. The physical schemes used in the model include the Morrison 2-mom scheme for microphysical processes (Morrison et al., 2009), the Mellor–Yamada–Janjic scheme (MYJ) for planetary boundary layer processes (Janjić, 1994), the rapid radiative transfer model (RRTM) (Mlawer et al., 1997) and the Dudhia schemes for longwave and shortwave radiation options (Dudhia, 1989), the MYJ Monin–Obukhov scheme for near-surface layer processes (Janjić, 1994), and the Noah land surface scheme (Tewari et al., 2004).
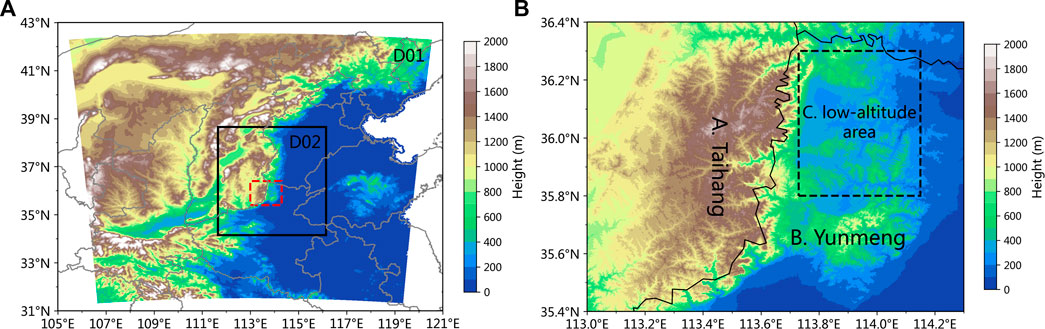
FIGURE 1. Coverage of model domains is denoted by D1 and D2, and the area within the red dotted box indicates the study area in Figure 1B (A). Topographic features of the study area (B).
In this study, the terrains in the study area are mainly divided into three categories (Figure 1B). The first category is the Taihang Mountains, with a north–south orientation. The altitude of the main body of the Taihang Mountains exceeds 1,500 m, with shape slopes on its east and south sides, which mainly causes the topographically forced uplift and blocking-induced convergence of the low-level jet. The second category is Yunmeng Mountain with relatively isolated and bell-shaped terrains, which is located to the south of the Taihang Mountains. The highest altitude is close to 1,000 m. The topographic gradient on its north side is relatively large, while the slope on its south side is relatively gentle. In addition to the topographically forced uplift, this terrain feature also causes the flow around the low-level jet. The third category is the region with complex terrain at low altitudes, which are shown in the dotted box in Figure 1B. The overall altitude is between 300 and 800 m, but the terrain surface fluctuates greatly, and the influential mechanism on the precipitation is complex in this region.
In order to study the influences of the terrain data with different resolutions on numerical simulation results of the “7.19” precipitation process, first, the simulation results with the original terrain and SRTM-90 m terrain, respectively, adopted in the WRF model are compared and analyzed. The specific design schemes are shown in Table 1.

TABLE 1. Experimental schemes for terrains with different resolutions.
In order to study the influential mechanisms of the Taihang Mountains, Yunmeng Mountain, and the low-altitude region with complex terrain in the study area on this precipitation process, four groups of sensitivity experiments with different terrain heights are designed, and the specific schemes are shown in Table 2.
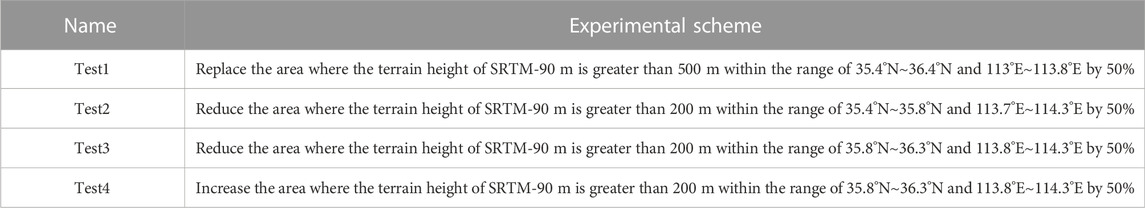
TABLE 2. Schemes for sensitivity experiments with different terrain heights.
The terrains for the schemes of the aforementioned comparative experiments are shown in Figure 2.
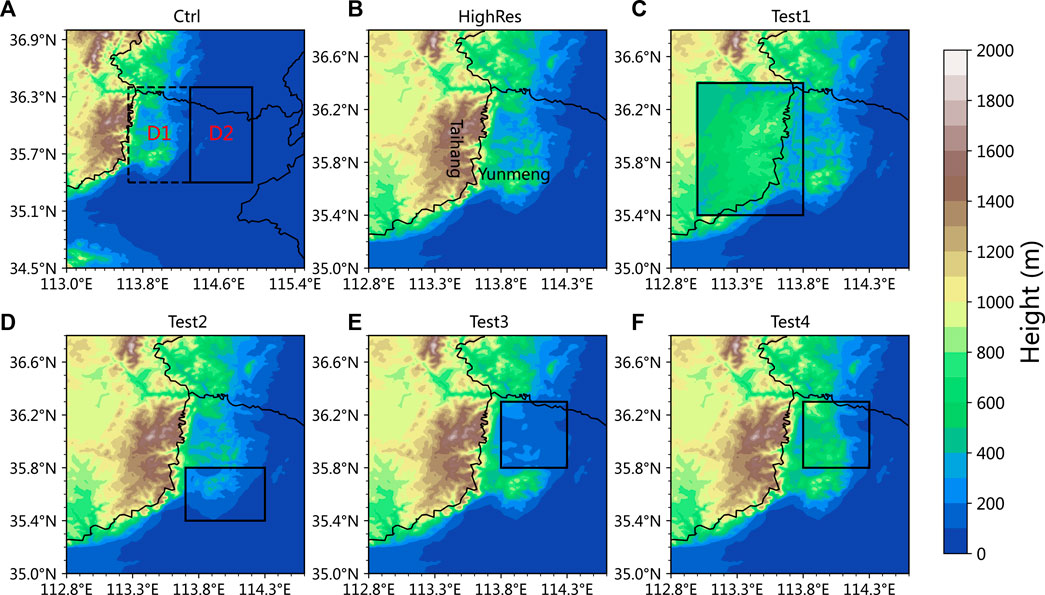
FIGURE 2. Terrains of the control experiment (A) and comparative experiment HighRes (B), Test1 (C), Test2 (D), Test3 (E), Test4 (F). The area within the box indicates the terrain modification region or study region.
The zonally averaged hourly mean rainfall intensity in areas D1 and D2 is shown in Figure 3. It can be seen that during the period from 0000 UTC on July 19 to 1200 UTC on July 19, the hourly mean rainfall intensity in the area D1 is significantly larger than that in the area D2, indicating that the topographic effect on the enhancement of precipitation in this case mainly occurs in the daytime on July 19. Similar results can also be found in the zonally averaged hourly rainfall intensity and 850-hPa wind field in areas D1 and D2. The heavy rainfall in the area D1 mainly occurs before 1200 UTC on July 19 and is significantly stronger than that in the area D2. In addition, the evolution of the 850-hPa wind field shows that there is a continuous easterly jet stream at the lower level in the study area (Figure 4). The sea-level pressure also indicates the development of a ground cyclone, which also represents an increase in ground wind speed. There was also evidence of topographic precipitation characteristics derived from the spatial distribution of observed rainfall, which further indicates that the terrain plays a key role in the enhancement of the precipitation during this stage.
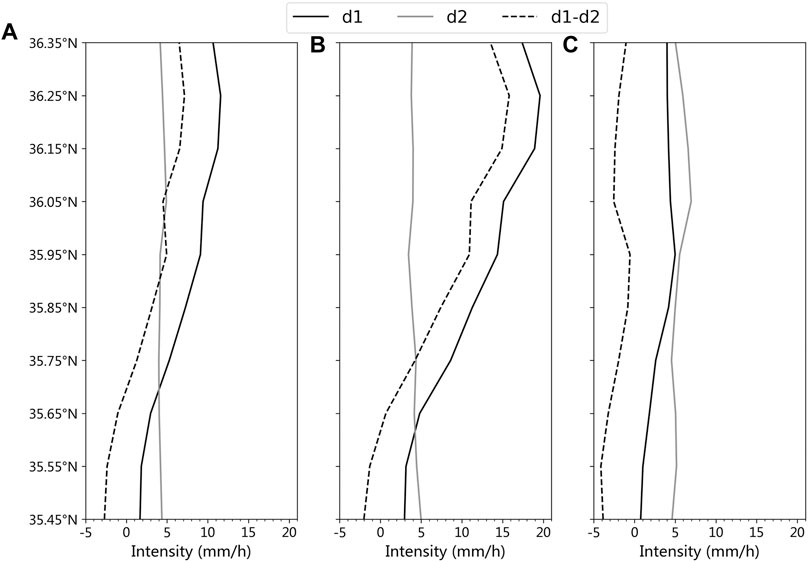
FIGURE 3. Hourly mean precipitation intensity in areas D1 and D2 indicated in Figure 2A and the difference between the two areas from (A) 0000 UTC on July 19 to 0000 UTC on July 20, (B) 0000 UTC on July 19 to 1200 UTC on July 19, and (C) 1200 UTC on July 19 to 0000 UTC on July 20.
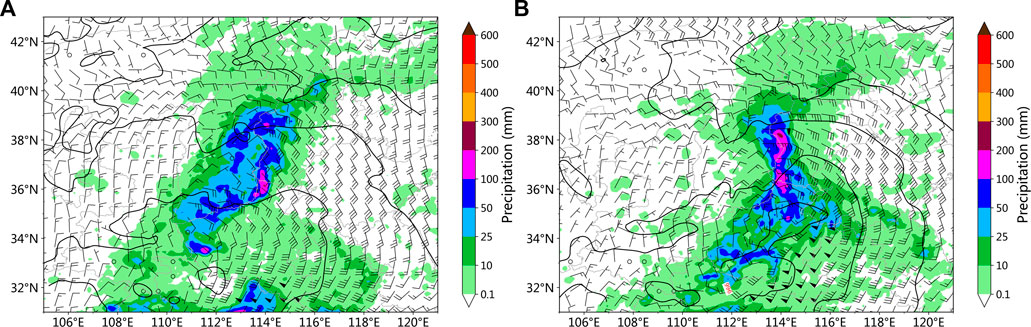
FIGURE 4. Wind field at 850 hPa and sea-level pressure (contour line) at 0000 UTC (A) and 0600 UTC (B) on 19 July 2016. Precipitation from 0000 UTC to 0600 UTC (A) and 0600 to 1200 UTC (B) on 19 July 2016. The wind field and sea-level pressure data are obtained from the ERA5 dataset.
The accumulated precipitation from 0000 to 1200 UTC on 19 July 2016 (Figures 5A–C) shows that the precipitation amount exceeding 100 mm appears in a wide region near the Taihang Mountains (marked as the area D3), while the precipitation amount over 200 mm mainly appears below the altitude of 500 m on the east side of the Taihang Mountains. In the Ctrl simulation experiments, the region with the precipitation of more than 100 mm is close to the observation, but the center of the region with the precipitation over 200 mm extends westward along the Taihang Mountains. By adopting the SRTM-90 m DEM for the HighRes experiment, the simulation results show similar distribution characteristics to the observed precipitation; that is, heavy rainfall (above 200 mm) mainly occurs in the area below the altitude of 500 m. In addition, the precipitation intensity in the area D3 is closer to the observation. Compared with the time series of hourly precipitation intensity simulated by the WRF model (Figure 5E), the Ctrl and HighRes experiments all show the characteristics of weak precipitation in the early daytime and strong precipitation in the late daytime on 19 July 2016. The comparison of the rainfall intensity during the period of heavy rainfall from 0700 to 1100 UTC on July 19 reveals that the simulation results from the HighRes experiment are closer to the observation. The aforementioned results indicate that by interpolating the SRTM-90 m terrain data to the grids with a resolution of 1 km, there is little difference between the interpolated terrain and the original terrain in the model. However, the model with the SRTM-90 m terrain data has a significant impact on the precipitation near the Taihang Mountains, and the distribution of the simulated precipitation is closer to the observation.
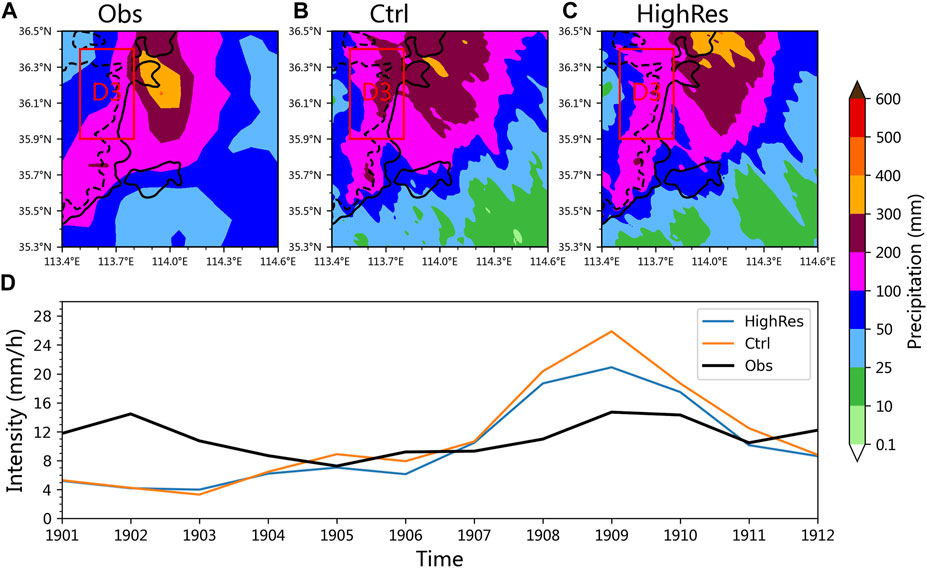
FIGURE 5. (A) Observational precipitation and simulated precipitation in (B) Ctrl and (C) HighRes experiments from 0000 to 1200 UTC on 19 July 2016. The black solid line denotes the 500 m contour line, and the black dotted line denotes the 1000 m contour line. (D) Time series of area-averaged hourly precipitation intensity in the area D1 from 0000 UTC on 19 July 2016 to 0000 UTC on 20 July 2016.
Figure 2 shows that the terrains at high altitudes around the region with heavy rainfall, in this case, are the Taihang Mountains in the west and Yunmeng Mountain in the south. Yunmeng Mountain has an isolated and bell-shaped terrain with the highest altitude close to 1,000 m, while the highest altitude in the south of the Taihang Mountains is more than 1,500 m. In this study, four kinds of terrain sensitivity experiments are designed to study the influence of the terrains in northern Henan on this precipitation case. The schemes are shown in Table 2.
Figure 6 shows the distribution of the accumulated precipitation from 0000 to 1200 UTC on 19 July 2016, simulated by each experiment. With the addition of SRTM-90 m terrain data, the simulated precipitation of HighRes in the D3 area reduced by 24% compared with that of Ctrl, which is much closer to the observation. The Taihang Mountains have a significant blocking effect on the easterly wind due to their high altitude. After the height of the Taihang Mountains is reduced by 50% (Figure 6C), the location and range of heavy precipitation (
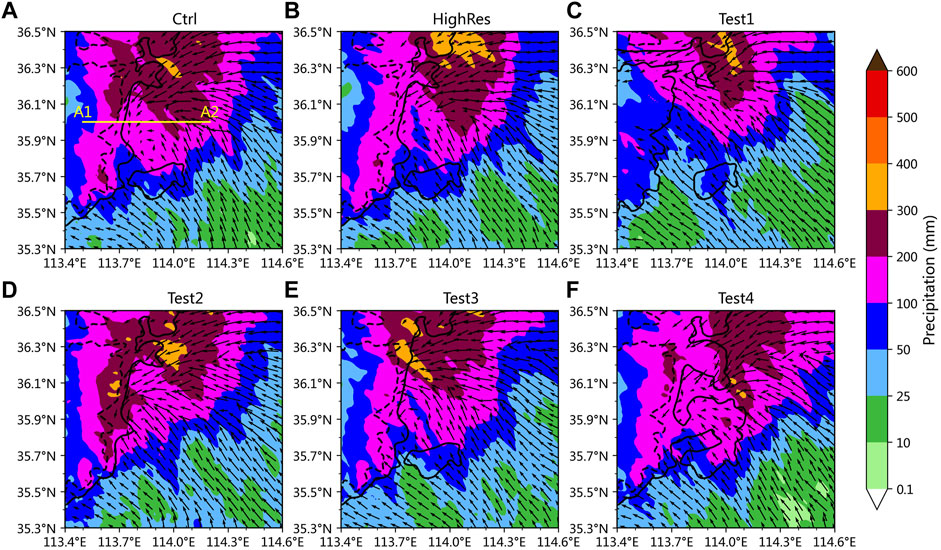
FIGURE 6. (A–F) Simulated precipitation by terrain sensitivity experiments from 0000 to 1200 UTC on 19 July 2016. The vector denotes the wind field at 925 hPa at 0900 UTC on 19 July 2016, simulated by each sensitivity experiment. The black solid line denotes the 500 m contour line, and the black dotted line denotes the 1000 m contour line.
According to the vertical cross sections along the straight line between A1 and A2 of the HighRes, the main precipitation area is located over the east side of the Taihang Mountains from 0700 UTC to 0800 UTC on July 19, rather than the region along the mountains (Figure 7A). The low-level wind field shows that due to the blocking effect of the Taihang Mountains, the mountainward airflow forms a vertical secondary circulation (as shown by A, B, and C in Figure 7A) at 925 hPa and below along the mountains, which blocks the westward movement of the low-level jet. When the terrain height of the Taihang Mountains is reduced by 50% (Figure 7B), the low-level vertical secondary circulation in front of the mountains disappears. Meanwhile, the low-level jet stream of 12 m/s moves down to 925 hPa, and the water vapor convergence center moves westward to the vicinity along the mountains, which leads to strong precipitation at the foot of the Taihang Mountains.
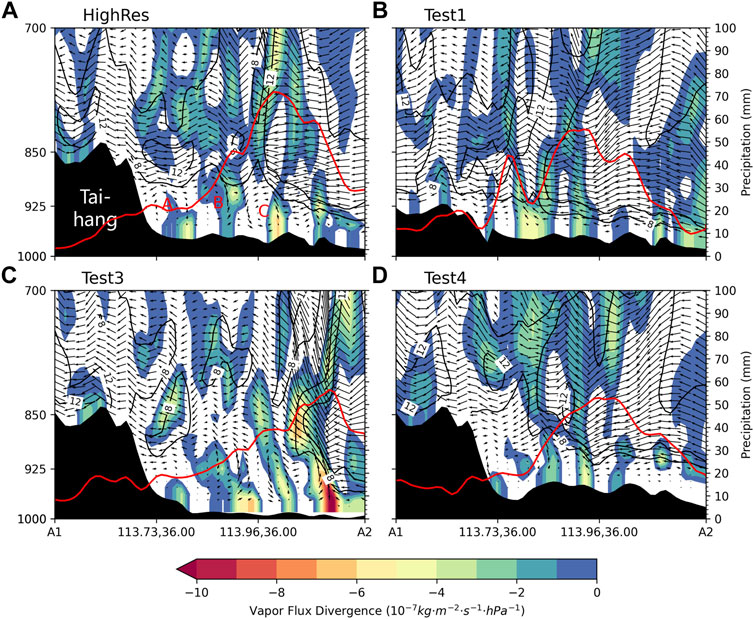
FIGURE 7. Vertical cross sections of the simulation experiment using the HighRes terrain (A), Test1 (B), Test3 (C) and Test4 (D) along the straight line between A1 and A2 (as shown in Figure 6A) at 0700 UTC on 19 July 2016. The red line indicates the hourly precipitation (0700–0800 UTC on 19 July 2016), and the wind vector is the combination of the U-wind component and the vertical velocity (W × 10). The black contour line indicates the U-wind speed exceeding 8 and 12 m/s. The shaded area indicates the vapor flux divergence (units:
Under the background of extreme rainstorm weather circulation, even the low-altitude area still has a topographic uplift mechanism. By reducing the height of the low-altitude area (Figure 7C) in the Test3 experiment, the precipitation intensity is weakened, and the water vapor convergence moves westward. The blocking effect of the Taihang Mountains is affected by the terrain height difference of the windward slope. In the Test4 experiment (Figure 7D), the increase in the height of the low-altitude area leads to the weakening of vertical secondary circulation and the reduction of precipitation intensity. The aforementioned results show that the terrain features of high altitude of more than 1,000 m and steep slope for the Taihang Mountains have a significant blocking effect on the easterly or southeasterly wind, resulting in the variation of the convergence ascending region of the wind field in the lower layer. However, the precipitation intensity is also affected by the uplift mechanism of the low-altitude terrain on the east side of the Taihang Mountains.
When the terrain height of the Yunmeng Mountain is reduced by 50% while other terrains remain unchanged (Figure 6D), the region with precipitation over 200 mm extends southward along the Taihang Mountains, and the region with heavy rainfall on the north side of D1 becomes larger. The area-averaged accumulated precipitation of D1 increases by 7% compared with that in the HighRes experiment. The region with the most significant enhancement of precipitation is D3 located along the east side of the Taihang Mountains, with an average accumulated precipitation increasing by 64%. The results show that although the reduction of terrain height from Yunmeng Mountain makes the low-level jet more prone to move northward, it also leads to a decrease in precipitation intensity caused by topographic lifting or topographic turbulence convergence. From the 925-hPa wind field at 0900 UTC on 19 July 2016, it can be seen that the easterly or southeasterly in the lower layer is blocked or divided by Yunmeng Mountain. When the terrain height of Yunmeng Mountain is lowered, the convergence zone of the low-level wind field moves to the area along the Taihang Mountains, resulting in the westward movement of the heavy rainfall area.
Figure 8 shows the spatial distribution of the 925-hPa wind field, strong hourly precipitation, and water vapor convergence at 0800 UTC on July 19. In the HighRes experiment, the low-level southeast airflow is blocked and split by Yunmeng Mountain. Therefore, the low-level wind speed on the leeward slope of Yunmeng Mountain is weak, and the precipitation is mainly concentrated in the valley between Yunmeng Mountain and the Taihang Mountains. However, after reducing the terrain height of Yunmeng Mountain, the low-level southeast airflow continues to move to the Taihang Mountains (Figure 8C), and an area with the significant water vapor convergence center appears over the southeast side of the Taihang Mountains, resulting in an increase in precipitation. The aforementioned results show that the blocking effect of Yunmeng Mountain on the low-level jet causes the weakening of the low-level mountainward wind on the east side of the Taihang Mountains, thus leading to a decrease in precipitation intensity. The disturbed low-level jet produced by Yunmeng Mountain also affects the water vapor convergence, which leads to the change in the heavy rainfall center.
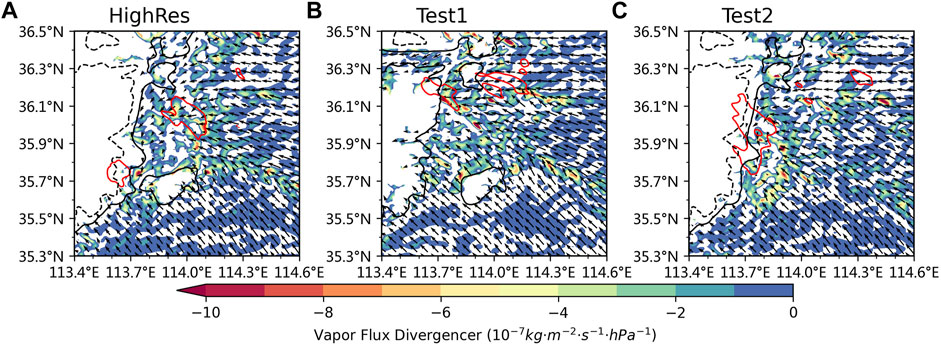
FIGURE 8. Simulated wind field at 925 hPa at 0800 UTC on July 19 and precipitation (red line) exceeding 50 mm/h (0800–0900 UTC on July 19) by HighRes terrain (A), Test1 (B) and Test2 (C). The black solid line denotes the 500 m contour line, and the black dotted line denotes the 1000 m contour line. The shaded area indicates the vapor flux divergence (units:
In order to further analyze the dynamic effects of the complex terrain at low altitude on the precipitation in northern Henan during the “7.19” event, the variation in topographically forced vertical velocity is calculated. The variation in vertical velocity caused by the topographic lifting effect of the windward slope can be estimated by referring to previous studies (Sinclair, 1994; Yu et al., 2013; Cheng et al., 2019), and the formula is as follows:
where
The contour lines in Figures 9A, B show the distribution of
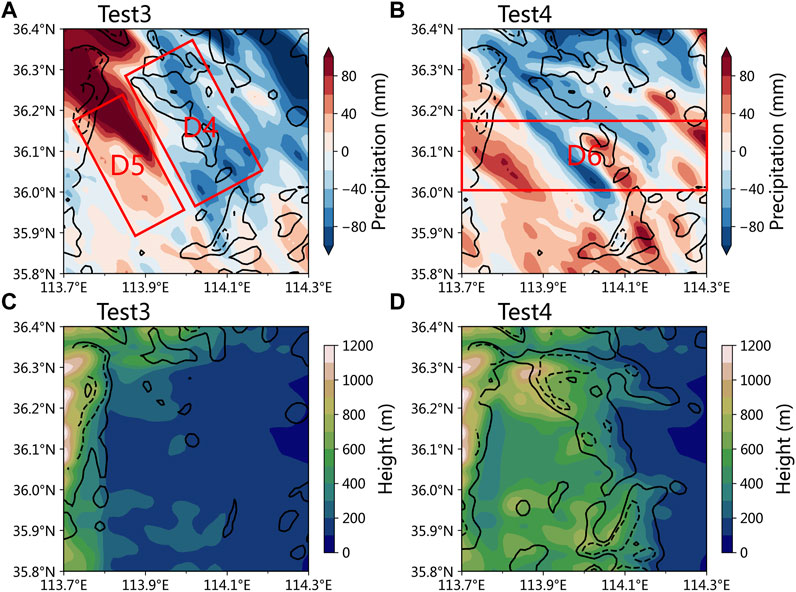
FIGURE 9. (A,B) Shaded regions indicate the difference in accumulated precipitation between the Test3 or Test4 experiment and the HighRes from 0000 UTC to 1200 UTC on July 19, 2016. The solid and dotted lines indicate the average vertical velocity forced by the terrain below 1,000 m in HighRes (contour; the interval is 0.1 m s−1 for the solid line and 0.3 m s−1 for the dashed line). (C,D) Shaded regions indicate the terrain height of the Test3 and Test4 experiments. The solid and dotted lines indicate the average vertical velocity forced by the terrain below 1,000 m in Test3 and Test4 experiments (contour; the interval is 0.1 m s−1 for the solid line and 0.3 m s−1 for the dashed line).
When the low-altitude, complex terrain on the east side of the Taihang Mountains is reduced (Figure 10B), the original precipitation center during the two precipitation stages (0500 UTC and 0900 UTC on July 19) weakens and extends westward. From the variation in simulated vertical velocity before and after the modification of the terrains (Figures 10A, B), the large-value area with ascending motion in low altitude over the east side of the original terrain is mainly located to the east of 113.9°E, while the ascending motion center appears near 113.8°E in the Test3 experiment. According to the changes in
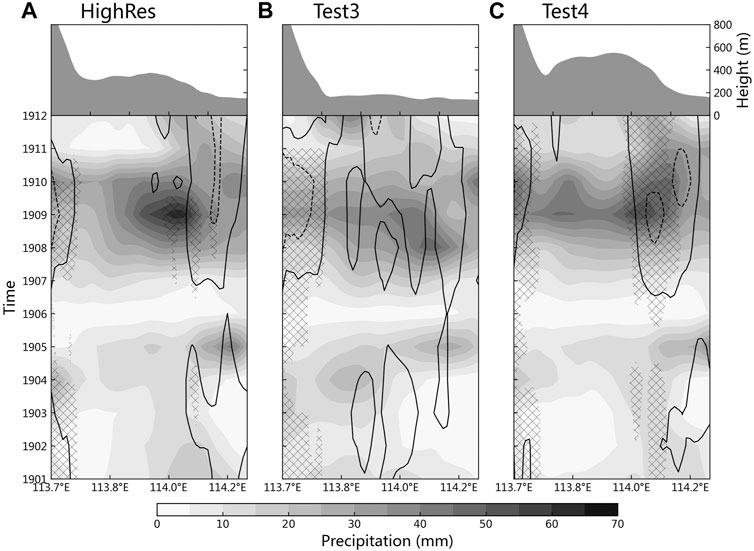
FIGURE 10. Meridionally averaged hourly precipitation, the average vertical velocity below the altitude of 1,000 m (contour; the interval is 0.1 m s−1 for the solid line and 0.3 m s−1 for the dashed line), the vertical velocity due to topographically forced uplift (shaded area filled by diagonal lines, unit: 0.1 m s−1), and the meridionally averaged altitude in the area D6 from 0100 UTC to 1200 UTC on 19 July 2016 in the (A) HighRes, (B) Test3, and (C) Test4 experiments.
In this study, based on the CMPA-Hourly V2.0 and ERA5 reanalysis datasets, the topographical precipitation characteristics during the “7.19” process are analyzed. In addition, the WRF V3.9.1 and NCEP GDAS/FNL reanalysis data are used for the high-resolution numerical simulations, and the SRTM-90 m terrain data are used to carry out high-resolution terrain simulation experiments. The influential mechanisms of different terrains on the precipitation in terrain sensitivity experiments by different schemes are compared. Finally, the vertical velocity forced by the terrain is diagnostically analyzed, and the influence of dynamic uplift forced by the complex terrain with low altitude on the precipitation is investigated. The main conclusions are as follows:
The observational precipitation characteristics show that under the condition of similar environmental dynamic fields (i.e., the wind field at 850 hPa), the precipitation over the mountainous area of northern Henan Province (area D1) is significantly stronger than that over the eastern plain (area D2) from 0000 UTC to 1200 UTC on July 19. The terrain of the northern mountain (area D1) plays an essential role in the precipitation increase during this heavy rainfall event.
he simulations by using terrain data with different resolutions show that there is little difference between the modified terrain and the original terrain of the model. However, by interpolating the SRTM-90 m terrain data to the grids with the resolution of 1 km, the refined terrain still has an obvious impact on the precipitation simulation results. The distribution characteristics of simulated precipitation are closer to the observations, while the lower-resolution terrain leads to the heavy precipitation area in D1 moving toward the region along the Taihang Mountains. Therefore, the refined terrain is beneficial to the model to effectively reproduce the distribution and evolution characteristics of local precipitation in the area with complex terrains.
The results of several terrain sensitivity experiments show that the terrain of the Taihang Mountains plays a crucial role in the precipitation along the mountains. After reducing the terrain by 50%, the accumulated precipitation along the mountains (area D3) during the daytime on July 19 decreases by 26%. However, the terrain change in the Taihang Mountains has little effect on the precipitation over the northern part of the area D1. The precipitation in this region is mainly closely related to the complex terrains at a low altitude of about 500 m in the area D4. In addition, the low-level easterly jet uplifted by the local complex terrain at low altitudes also plays a key role in the variation in the intensity and distribution of heavy rainfall.
The southeasterly in the lower level is blocked or split by Yunmeng Mountain, which is not conducive to the movement of the low-level jet to the area along the Taihang Mountains and the westward movement of the heavy rainfall area. When the terrain height of Yunmeng Mountain is reduced by 50%, the low-level jet is prone to move to the area along the Taihang Mountains, resulting in a corresponding increase in the precipitation on the north side of Yunmeng Mountain and the east side of the Taihang Mountains, corresponding to the increases in the area-averaged accumulated precipitation in D1 by 7%.
The accumulated precipitation decreases by 40–60 mm in the area D4 and increases by 40–80 mm in the area D5 from 0100 to 1200 UTC on July 19 when the low-altitude terrain in the north of the area D1 is reduced by 50%, while the terrains of the Taihang Mountains in the west and Yunmeng Mountain in the south remain unchanged. Moreover, the heavy rainfall center significantly moves westward to the vicinity along the Taihang Mountains. The local terrain in the area D4 leads to remarkable changes in vertical movement, forming a local ascending motion region, which is one of the reasons for increasing the precipitation in this area and further affecting the location of the heavy precipitation center.
In this study, the WRF model is used to carry out the high-resolution terrain simulation experiments for the “7.19” extraordinary heavy rainfall process. The distribution characteristics of topographically forced vertical movement are analyzed, and the specific impact of complex terrain on the precipitation in northern Henan Province is studied. On this basis, some quantitative conclusions have been obtained, and the spatio-temporal variation characteristics of precipitation in different terrain sensitivity experiments have been analyzed. However, the aforementioned conclusions are only limited to the case of the “7.19” extraordinary heavy rainfall process, while the assessment and analysis for multiple cases have not been carried out yet. Therefore, it is necessary to systematically and quantitatively evaluate the precipitation changes caused by the topography-caused lifting, blocking, and convergence. In addition, it is also essential to further study the climatic characteristics for the influence of topography on the precipitation, the thermal effect of complex underlying surfaces related to topography, and the triggering and strengthening mechanisms of convective precipitation by topographic uplift.
Publicly available datasets were analyzed in this study. These data can be found at: https://cds.climate.copernicus.eu/cdsapp#!/dataset/reanalysis-era5-pressure-levels?tab=overview.
HL: data analysis, visualization, and writing—original draft. XW: conceptualization, methodology, and investigation. LX: visualization and writing—review and editing.
This work was supported by China Meteorological Administration Innovation and Development Project (No. CXFZ2022J014), the 2020 National Supercomputing Zhengzhou Center Innovation Ecosystem Construction Technology Special Project (No. 201400210800), Joint Funds of Science and Technology Development of Henan Province (No. 222103810091), Key Project of Henan Meteorological Bureau (No. KZ202101).
The authors declare that the research was conducted in the absence of any commercial or financial relationships that could be construed as a potential conflict of interest.
All claims expressed in this article are solely those of the authors and do not necessarily represent those of their affiliated organizations, or those of the publisher, the editors, and the reviewers. Any product that may be evaluated in this article, or claim that may be made by its manufacturer, is not guaranteed or endorsed by the publisher.
Chao, L., Cui, C., Jiang, X., Wang, X., Lai, A., and Wang, X. (2018). Mechanism analysis of the effect of special topography in middle-lower reaches of yangtze river on local severe precipitation in northeast hubei. Meteor Mon. 44 (09), 1117–1135.
Cheng, L. W., and Yu, C. K. (2019). Investigation of orographic precipitation over an isolated, three-dimensional complex topography with a dense gauge network, radar observations, and upslope model. J. Atmos. Sci. 76 (11), 3387–3409. doi:10.1175/jas-d-19-0005.1
Ding, Y. (2015). On the study of the unprecedented heavy rainfall in Henan Province during 4-8 August 1975: Review and assessment. Acta Meteorol. Sin. 73 (3), 411–424.
Dudhia, J. (1989). Numerical study of convection observed during the winter monsoon experiment using a mesoscale two-dimensional model. J. Atmos. Sci. 46 (20), 3077–3107. doi:10.1175/1520-0469(1989)046<3077:nsocod>2.0.co;2
Han, L., Wang, X., Zhang, X., Lv, L., and Xu, W. (2018). Analysis on extremity and characteristics of the 19 july 2016 severe torrential rainstorm in the north of henan Province. Meteor Mon. 44 (09), 1136–1147.
He, G., Peng, J., and Tu, N. (2015). Terrain construction and experiment for numerical model based on high resolution terrain data. Plateau Meteor 34 (4), 910–922. doi:10.7522/j.issn.1000-0534.2014.00022
He, G., Tu, N., and Zhang, L. (2013). Numerical experiment of terrain effect of vortex rainstorm process on east side of qinghai-xizang. Plateau Meteor 32 (06), 1546–1556. doi:10.7522/j.issn.1000-0534.2012.00150
Houze, R. A. (2012). Orographic effects on precipitating clouds. Rev. Geophys. 50 (1), RG1001. doi:10.1029/2011RG000365
Huang, X., Sun, J., and Liu, W. (2020). The interaction between low-level jet evolution and severe convective rainstorms under topographic effect. Acta Meteorol. Sin. 78 (4), 551–567.
Janjić, Z. I. (1994). The step-mountain eta coordinate model: Further developments of the convection, viscous sublayer, and turbulence closure schemes. Mon. Wea. Rev. 122 (5), 927–945. doi:10.1175/1520-0493(1994)122<0927:tsmecm>2.0.co;2
Jing, Z. Y., Zhou, Y., Shen, X., and Li, X. (2019). Evolution of dynamic and thermal structure and instability condition analysis of the extreme precipitation system in Beijing-Tianjin-Hebei on July 19 2016 [J]. Chin. J. Atmos. Sci. (in Chinese) 43 (4), 930–942. doi:10.3878/j.issn.1006-9895.1812.18231
Lei, L., Sun, J., He, N., Liu, Z., and Zeng, J. (2017). A study on the mechanism for the vortex system evolution and develop-ment during the torrential rain event in North China on 20 July 2016. Acta Meteorologica Sinica 75 (5), 685–699.
Liao, F., Hong, Y., and Zheng, G. (2007). Review of orographic influences on surface precipitation. Meteor Sci Technol 35 (03), 309–316.
Milrad, S. M., Lombardo, K., Atallah, E. H., and Gyakum, J. R. (2017). Numerical simulations of the 2013 Alberta flood: Dynamics, thermodynamics, and the role of orography. Monthly Weather Review 145 (8), 3049–3072. doi:10.1175/mwr-d-16-0336.1
Mlawer, E. J., Taubman, S. J., Brown, P. D., Iacono, M. J., and Clough, S. A. (1997). Radiative transfer for inhomogeneous atmospheres: RRTM, a validated correlated-k model for the longwave. J. Geophys. Res. 102 (14), 16663–16682. doi:10.1029/97jd00237
Morrison, H., Thompson, G., and Tatarskii, V. (2009). Impact of cloud microphysics on the development of trailing stratiform precipitation in a simulated squall line: Comparison of one- and two-moment schemes. Mon. Weather Rev. 137 (3), 991–1007. doi:10.1175/2008mwr2556.1
Pontoppidan, M., Reuder, J., Mayer, S., and Kolstad, E. W. (2017). Downscaling an intense precipitation event in complex terrain: The importance of high grid resolution. Tellus A Dynamic Meteorology and Oceanography 69 (1), 1271561. doi:10.1080/16000870.2016.1271561
Shen, F., Min, J., Li, H., Xu, D., Shu, A., Zhai, D., et al. (2021). Applications of radar data assimilation with hydrometeor control variables within the WRFDA on the prediction of landfalling hurricane IKE (2008). Atmosphere 12, 853. doi:10.3390/atmos12070853
Shen, F., Xu, D., Min, J., Chu, Z., and Li, X. (2020). Assimilation of radar radial velocity data with the WRF Hybrid 4DEnVar system for the prediction of Hurricane Ike (2008). Atmospheric Research 230, 104771. doi:10.1016/j.atmosres.2019.104771
Sinclair, M. R. (1994). A diagnostic model for estimating orographic precipitation. J. Appl. Meteor. 33 (10), 1163–1175. doi:10.1175/1520-0450(1994)033<1163:admfeo>2.0.co;2
Tewari, M., Chen, F., Wang, W., Dudhia, J., LeMone, M. A., Mitchell, K., et al. (January 2004). “Implementation and verification of the unified Noah land−surface model in the WRF model Paper,” in Proceedings of the 20th Conference on Weather Analysis and Forecasting/16th Conference on Numerical Weather Prediction (Seattle, DC, USA: American Meteorological Society), 2165–2170.
Tsai, C. L., Kim, K., Liou, Y. C., Lee, G., and Yu, C. K. (2018). Impacts of topography on airflow and precipitation in the pyeongchang area seen from multiple-Doppler radar observations. Monthly Weather Review 146 (10), 3401–3424. doi:10.1175/mwr-d-17-0394.1
Wang, C., Yu, X., Li, Z., Li, H., and Wang, X. (2017). Investigation of extreme flash-rain events on the impact of Taihang mountain. Meteor Mon 43 (04), 425–433.
Wang, L., Miao, J., and Han, F. (2018). Overview of impact of topography on precipitation in China over last 10 years. Meteor Sci Technol 46 (01), 64–75.
Wang, Y., Miao, J., and Su, T. (2018). A numerical study of impact of topography on intensity and pattern of sea breeze precipitation over the Hainan Island[J]. Plateau Meteor 37 (1), 207–222. doi:10.7522/j.issn.1000-0534.2016.00135
Wu, C. C., Yen, T. H., Huang, Y. H., Yu, C. K., and Chen, S. G. (2015). Statistical characteristic of heavy rainfall associated with typhoons near taiwan based on high-density automatic rain gauge data. Bulletin of the American Meteorological Society 97 (8), 1363–1375. doi:10.1175/bams-d-15-00076.1
Yang, P. A. N., Junxia, G. U., Yu, J., Yan, S. H. E. N., Chunxiang, S. H. I., and Zhou, Z. (2018). Test of merging methods for multi-source observed precipitation products at high resolution over China[J]. Acta Meteorologica Sinica 76 (5), 755–766. doi:10.11676/qxxb2018.034
Yi, X., Chen, H., Sun, X., Wang, Y., Han, T., and Yun, L. (2018). Multi-scale configuration of the 20 july 2016 cyclone-induced severe torrential rain and its relationship with the development of MγCS. Meteor Mon 44 (07), 869–881.
Yu, C. K., and Cheng, L. W. (2013). Distribution and mechanisms of orographic precipitation associated with typhoon Morakot (2009). J. Atmos. Sci. 70 (9), 2894–2915. doi:10.1175/jas-d-12-0340.1
Zhang, H., Chen, H., Yu, H., and Zhang, X. (2020). Diurnal variations and causes of warm season precipitation in qinling and surrounding areas[J]. Plateau Meteorol. 39 (5), 935–946. doi:10.7522/j.issn.1000-0534.2019.00067
Zhao, S., Sun, J., Lu, R., and Fu, S. (2018). Analysis of the 20 july 2016 unusual heavy rainfall in North China and beijing. Meteor Mon 44 (03), 351–360.
Zhong, S. (2020). Advances in the study of the influencing mechanism and forecast methods for orographic precipitation. Plateau Meteorology 39 (5), 1122–1132. doi:10.7522/j.issn.1000-0534.2019.00083
Keywords: extraordinary heavy rainfall, topographic effect, numerical simulation, evolution mechanisms, low-level jet
Citation: Li H, Xi L and Wang X-M (2023) A high-resolution numerical simulation of the “7.19” extraordinary heavy rainfall in Henan Province under topographic effect. Front. Earth Sci. 10:1079369. doi: 10.3389/feart.2022.1079369
Received: 25 October 2022; Accepted: 05 December 2022;
Published: 03 January 2023.
Edited by:
Feifei Shen, Nanjing University of Information Science and Technology, ChinaReviewed by:
Xiaogang Huang, National University of Defense Technology, ChinaCopyright © 2023 Li, Xi and Wang. This is an open-access article distributed under the terms of the Creative Commons Attribution License (CC BY). The use, distribution or reproduction in other forums is permitted, provided the original author(s) and the copyright owner(s) are credited and that the original publication in this journal is cited, in accordance with accepted academic practice. No use, distribution or reproduction is permitted which does not comply with these terms.
*Correspondence: Xin-Min Wang, OTk1Mzc4MzkyQHFxLmNvbQ==
Disclaimer: All claims expressed in this article are solely those of the authors and do not necessarily represent those of their affiliated organizations, or those of the publisher, the editors and the reviewers. Any product that may be evaluated in this article or claim that may be made by its manufacturer is not guaranteed or endorsed by the publisher.
Research integrity at Frontiers
Learn more about the work of our research integrity team to safeguard the quality of each article we publish.