- 1Key Laboratory of Plateau Atmosphere and Environment, Sichuan Province, College of Atmospheric Sciences, Chengdu University of Information Technology, Chengdu, China
- 2Key Laboratory of Land Surface Process and Climate Change in the Cold and Arid Regions, Northwest Institute of Ecological Environment and Resources, Chinese Academy of Sciences, Lanzhou, China
- 3State Key Laboratory of Earth Surface Processes and Resource Ecology, Faculty of Geographical Science, Beijing Normal University, Beijing, China
Precipitation has a significant influence on the topsoil moisture and further impacts the land-atmospheric water and heat exchange process over the Yarlung Zangbo Grand Canyon region (YGC) where exhibits one of the highest frequencies of convective activity in China. The simulated performance of the Community Land Model version 5.0 (CLM5.0) on turbulent fluxes under seven roughness heights for heat transfer (Z0h) schemes at Motuo and Pailong stations over the YGC was evaluated. The results indicate that the CLM5.0 significantly overestimates the surface sensible heat flux (H) while the simulation performance of surface latent heat flux (LE) is better than H. By comparing and analyzing the simulation results, the Z0h schemes suitable for the YGC are selected optimally. The Zeng et al. (J. Hydrometeorol., 2012, 13, 1359–1370) scheme (Z12) is more suitable for the simulations of H, with the simulated RMSE of H at Motuo and Pailong stations on typical sunny days being only 21.63 and 15.13 W m−2, respectively, 81.51% and 76.96% lower than the original Z0h scheme of CLM5.0. The Garratt, J., R and Francey, R., J (Boundary. Layer. Meteorol., 1978, 15, 399–421) scheme (G78) is more suitable for simulating LE in the YGC. The simulated BIAS and RMSE of LE at Motuo station were 9.80% and 21.90% lower than that under the default scheme of CLM5.0 on typical cloudy days. In addition, except for the G78 and CLM5.0 default scheme, the Z0h under the other schemes showed obvious diurnal variation characteristics, and H was positively sensitive to Z0h, while LE was the opposite. Consequently, the optimal Z0h schemes are of great application value for further comparative analysis of the water and heat exchange process between the Grand Canyon land surface and the atmosphere, to better reveal the mechanism of land-atmosphere interactions in the YGC.
1 Introduction
The Yarlung Zangbo Grand Canyon (YGC) on the southeastern edge of the Tibetan Plateau (TP) is located in the frontal zone of the warm and humid Indian Ocean airflow diffusion zone. The warm and humid impinging flow from the Indian Ocean drives northwards along the Grand Canyon into the hinterland of the TP, constituting a “water vapor transport channel” affecting the onset of the rainy season and the intensity of precipitation on the TP (Xu et al., 2008). The YGC plays an essential role in controlling the pattern of precipitation on the Qinghai-Tibet Plateau and South Asia (Lai et al., 2020). The average cumulative precipitation of the nine observation stations located in the YGC in 2019 reached 1902.9 mm. Zhang et al. (2016) claimed that uncertainty in precipitation exerts more influence on the general behavior of land surface models simulations than the vegetation phenology parameter. Additionally, affected by the “water vapor transport channel” in the middle and lower reaches of the Yarlung Zangbo River, the radiative forcing generated by clouds, water vapor, and aerosols in the atmosphere restricts the ground-air temperature differences and evapotranspiration process in this region, creating a unique “water and heat exchange pattern” locally, and the land surface models have encountered serious challenges (Monteith et al., 2010; Xie et al., 2019). The focus was limited to the research of boundary layer physical processes in southeastern Tibet is of great scientific value for the comprehension of the evolution of large-scale synoptic processes, long-term prediction, and climate theory (Ye and Wu, 1998). Researching land-atmosphere interactions in the YGC is an essential measure to reveal the mechanism of land-atmosphere interactions on the nonuniform underlying surface under complex meteorological conditions.
Land-surface processes are physical, biological, and chemical processes that describe the material and energy exchanges between the atmospheric boundary layer and the land surface. Research such as that conducted by Hogue et al. (2005) and LeMone et al. (2008) showed that the National Center for Atmospheric Research (NCAR) land surface model (LSM) greatly overestimated the H and underestimated the ground-air temperature differences during the dry seasons (late autumn and winter). Subsequently, Chen and Zhang. (2009) found that LSM significantly overestimated the surface exchange coefficient for heat (Ch) over various surface vegetation types, and pointed out that the calculation of Z0h needs to consider the influence of vegetation type. In addition, Yang et al. (2007) evaluated the performance of seven land surface models during the Coordinated Enhanced Observing Period (CEOP) and pointed out that, especially in arid and semiarid regions, the land surface models vastly overestimate the late afternoon peak of H, while the simulation of LE is relatively satisfactory since the heat transfer resistances are underestimated.
The land surface models describing the transfer process of surface turbulent heat flux are usually based on the Monin-Obukhov Similarity Theory which depends on Z0h and the aerodynamic roughness length (Z0m). (Sud et al., 1988; Jacobs and De Bruin, 1992). The Z0m depends on the surface geometric roughness (about 1/10 of the average geometric element height), while the Z0h is often determined by the excess resistance to heat transfer (kB−1, where k is the von Kármán constant and B−1 is the Stanton number) which requires accurate parameterization, and based on which, a multifaceted research effort was developed. A host of scholars have concentrated on developing parameterization schemes for kB−1, which are described in detail in Section 3.2 of this paper, where Yang et al. (2008) pointed out that Z0h has obvious diurnal variation characteristics depending on the state of the flow field, and the existing kB−1 schemes in the literature are often developed and evaluated based on in situ observations, which require more testing and evaluation in land surface models to verify their validity.
In summary, an accurate description of Z0h is quickly becoming a key instrument in revealing the mechanism of land-atmosphere interactions, and its accuracy directly affects the performance of atmospheric numerical models (Martano, 2000; Chen et al., 2013). This study compares the simulation performance of CLM5.0 for surface turbulent fluxes in the YGC under various Z0h schemes and selects the optimal schemes suitable for the YGC under complex weather conditions, to better reveal the mechanism of land-atmosphere interactions in the YGC.
2 Research area and data
2.1 Overview of the Yarlung Zangbo Grand canyon area
The YGC forms an inverted U-shaped bend around Namcha Barwa Peak at the eastern end of the Himalayas. It is the largest and deepest canyon on Earth, with a total length of 504.6 km, a maximum depth of 6,009.0 m, and an average depth of approximately 2,268.0 m. The YGC is located at the northernmost end of the northern hemisphere tropics, with an annual average temperature of over 18.0°C and an annual average relative humidity of 70%–80%. It is known as the “tropical green mountain” (Gao, 2008) (see Figure 1 for details). Due to its superior ecological and climatic conditions, a host of tropical organisms, such as semievergreen broad-leaved forests thrive here. The Yarlung Zangbo River flows through the region, forming an exceptionally low-depression terrain, which is the channel of water vapor transport from the Bay of Bengal to the plateau area. The unique narrow channel topography, geomorphology, and the strong water vapor transport effect create the second-largest precipitation zone in the TP, with precipitation in the central region reaching more than 4,000.0 mm (Zhang et al., 2022).
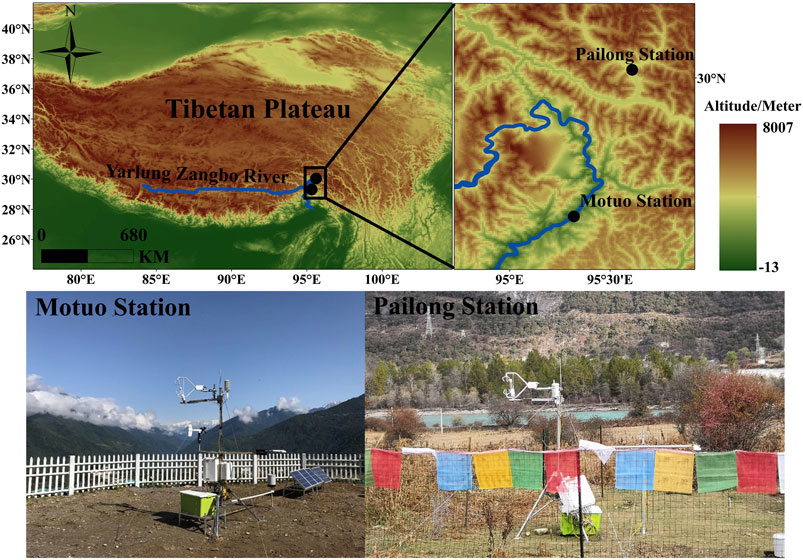
FIGURE 1. Geographical location and topography (Up) and photos (Low) (Chen et al., 2022) of the Yarlung Zangbo River and location of the in situ observation sites.
In this paper, Pailong station (30.04°N, 95.61°E) was selected to represent the entrance to the Grand Canyon area and Motuo station (29.31°N, 95.32°E) to represent the exit, with a large difference in elevation between the two stations: Pailong station is at 2,058.0 m and Motuo station is at 1,154.0 m. The actual plant functional types of the two stations are both predominantly grassland, but there are obvious differences in soil properties, which are described in detail in Section 4.1 of this paper.
This study revised the nested subgrid land units of CLM5.0 according to the actual plant functional types at the two stations, both of which are dominated by non-polar C3 grasses (Zhang et al., 2022), the scheme of modifying plant functional types of CLM5.0 is abbreviated as MPFT. The default land units of CLM5.0 are seriously inconsistent with the actual underlying plant functional types of the two stations: Motuo station has a higher proportion of temperate evergreen coniferous forest (51.23%) and temperate deciduous broad-leaved forest (42.95%) while Pailong station has a high proportion of boreal evergreen coniferous forest (35.15%) and polar C3 grass (39.61%).
2.2 Observation site data
Observations collected by the eddy covariance system (EC) at Pailong and Motuo stations are provided by the Institute of Tibetan Plateau Research Chinese Academy of Sciences and the Northwest Institute of Eco-Environment and Resources. The observations encompass 1 January to 31 December 2019 (Beijing time, CHINA). They include four-component radiation (CNR-1 type, erection height 1.6 m height), a three-dimensional ultrasonic anemometer (CSAT3A type, erection height 2.4 m height), an infrared CO2/H2O gas analyzer (EC150 type, erection height 2.4 m height), and a Campbell CR6 data collector. Quality control of the data is carried out by using the TK3 software package developed by the University of Bayreuth (Mauder and Foken 2015). According to the classification method of surface heat flux data quality status by TK3, the surface heat flux data can only be adopted in this research when the data quality status satisfies QUALITY ASSURANCE (QA) < 4 (Zhang et al., 2022).
2.3 Soil texture datasets
Land surface models use a soil dataset to obtain soil hydraulic and thermal property parameters to simulate surface turbulent heat flux. Liang and Dai. (2008) pointed out that soil texture has a significant impact on the Common Land Model (CoLM) describing the process of water and heat exchange and hydrological processes. Soil organic matter content is a key control factor for soil thermal parameters. Clay and sand have different soil particle sizes and thus have significant differences in particle thermal conductivity, particle heat capacity, maximum hydraulic conductivity, and saturated soil moisture content. Accordingly, accurate quantification of the soil datasets in the research area is a prerequisite for evaluating the simulation performance of land surface models.
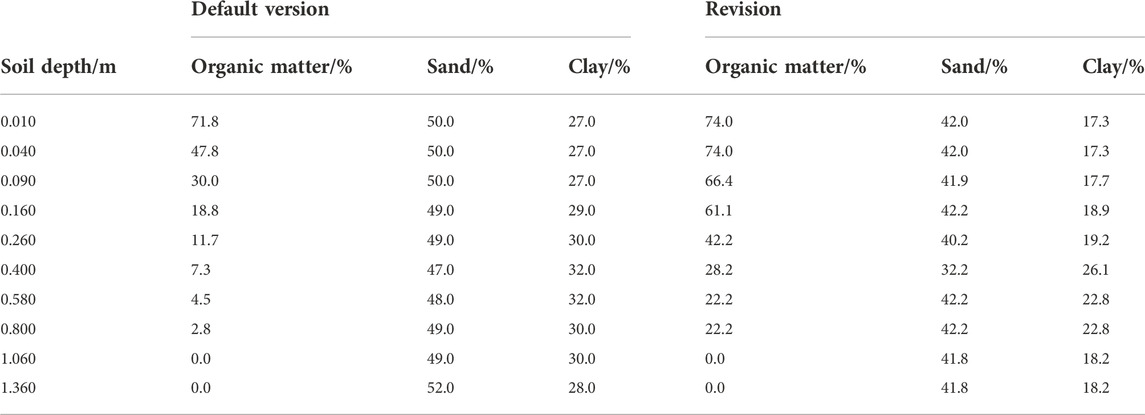
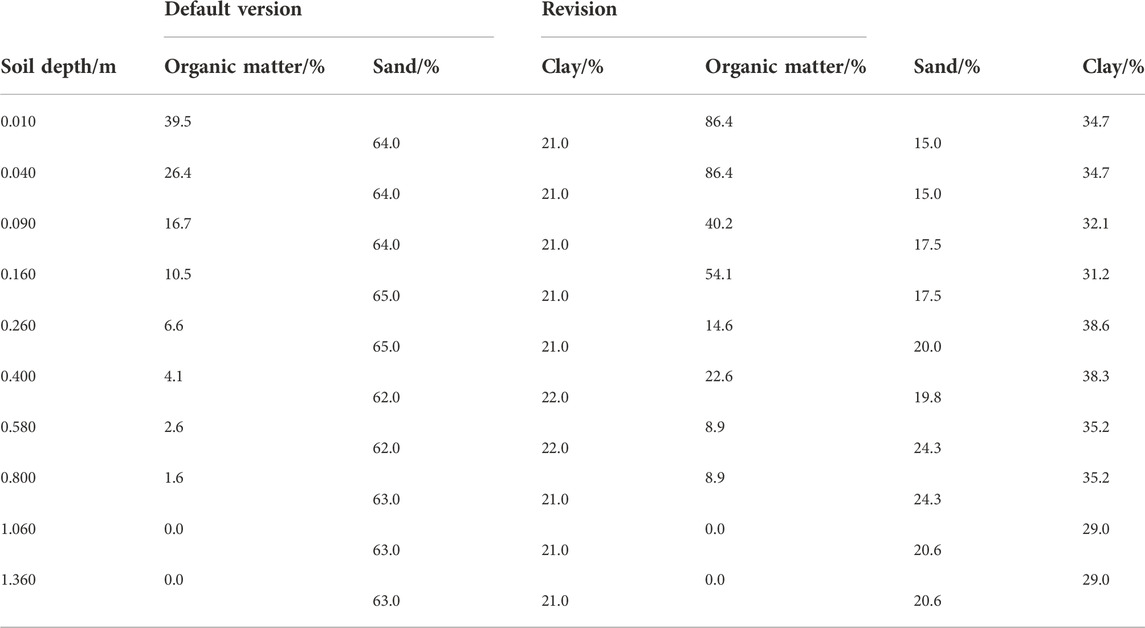
Dai et al. (2019) evaluated the applicability of the soil dataset in the Earth System Model in detail and pointed out that the GSDE (Global Soil Dataset for Earth System Model) (Shangguan et al., 2014) developed by the research team of Sun Yat-sen University applies to the Common Land Model (CoLM). Therefore, the scheme of modifying the soil property dataset of CLM5.0 with GSDE is abbreviated as MSP. The GSDE adopted in this study is detailed in Table 1 and Table 2.
3 Methodology
3.1 Overview of the CLM5.0
The Community Earth System Model (CESM) is a set of models that can be run independently or together to simulate the Earth’s global climate, and CLM5.0 can be used as a land surface module of the CESM coupled with modules such as atmosphere, ocean, and sea ice. CLM5.0 covers four sub-modules: biophysical process, hydrological cycle process, biogeochemical process, and dynamic vegetation process. As the third-generation land surface model developed by NCAR, CLM5.0 is an updated version of CLM4.5, currently, which is one of the most well-established and widely used land surface models (Dickinson et al., 2006). Updated plant photosynthesis and stomatal conductivity schemes are highly beneficial for simulating surface turbulent heat flux over the sparsely vegetated Grand Canyon region. A detailed description of CLM5.0 and its differences in simulated soil hydrothermal transport performance compared to CLM4.5 can be found in Deng et al. (2020).
Two key steps are required to drive CLM 5.0: The first step is to generate surface data to obtain underlying surface characteristics such as plant functional types and soil properties of the area of interest. Another key step, seven atmospheric forcing conditions at Motuo and Pailong stations were used to drive the CLM5.0: precipitation, downward solar radiation, downward longwave radiation, near-surface temperature, humidity, wind, and surface pressure, with half-hourly temporal resolution.
CLM5.0 calculates H (W∙m−2) based on Eq. 1, where
d is the displacement height (m), which is the height at which momentum loss occurs (approximately 2/3 of the canopy height). When a vegetation canopy is present, Z0m,v and Z0h,v are determined by the calculation relationship of Zeng and Wang. (2007), see Eq. 3 for details, where Ztop is the height of the canopy top (m),
3.2 Parameterization schemes of thermal roughness length
Garratt et al. (1978) showed that most natural subsurface KB−1 took a value of 2.0 (hereafter, the G78 scheme). Brutsaert et al. (1982) pointed out that the KB−1 scheme depended on the Reynolds number (Re*), leaf area index, and vegetation canopy structure (hereafter, the B82 scheme). Verhoef et al. (1997) conducted a study of the B82 scheme, which showed that Z0h exhibited significant daily variation characteristics in arid lands. Subsequently, the experimental studies of KB−1 under the vegetated areas gradually prevailed. The scheme of Zeng and Dickinson. (1998) (hereafter, the Z98 scheme), which was applied to the LSM, was found to better describe the heat transfer processes over sparsely and densely vegetated areas. The scheme of Kanda et al. (2007) (hereafter, the K07 scheme) was shown to better describe the heat transfer processes between the land surface and atmosphere in urban canopies. The schemes of Yang et al. (2008) (hereafter, the Y08 scheme), Chen and Zhang. (2009) (hereafter, the C09 scheme), and Zeng et al. (2012) (hereafter, the Z12 scheme) are more applicable to sparsely vegetated areas such as grasslands. The Y08 scheme has been incorporated into the Land Data Assimilation System for arid and semiarid regions, which does not depend on the Z0m and is only a relational function of frictional wind speed and frictional temperature.
The seven Z0h schemes evaluated in this paper are shown in Table 3. Figure 2 shows the value range of ln (Z0h) between the original and revised versions of CLM5.0. The results show that, except for the G78 scheme, all of the ln (Z0h) under the other Z0h schemes have obvious diurnal variation characteristics (in a “U” shape, the value is higher in the morning and evening and lower in the late afternoon) (Chen et al., 2010), and the values of ln (Z0h) after parameterization are significantly lower than the default scheme of CLM5.0, especially for the period of intense turbulent flux exchanges, which is consistent with the research results of Osamu et al. (2002) and Yang et al. (2003). It is worth noting that except for the default scheme, the scheme that integrates MSP and MPFT (referred to as MD scheme) and the G78 scheme, the value of Z0h on typical sunny days is smaller than that on typical cloudy days, which depends on the depends on the flow state under different weather conditions (Yang et al., 2008). The screening method for typical sunny and cloudy days is detailed in Section 3.3.

TABLE 3. Introduction of thermal roughness characterization scheme, where fluid kinematic viscosity (ν) [= 1.5×10⁻⁵ m2 s−1], β = 7.2, Re* = Z0m×u*/ν,Z top is canopy top height (m), RZ0m is the ratio of momentum roughness length.
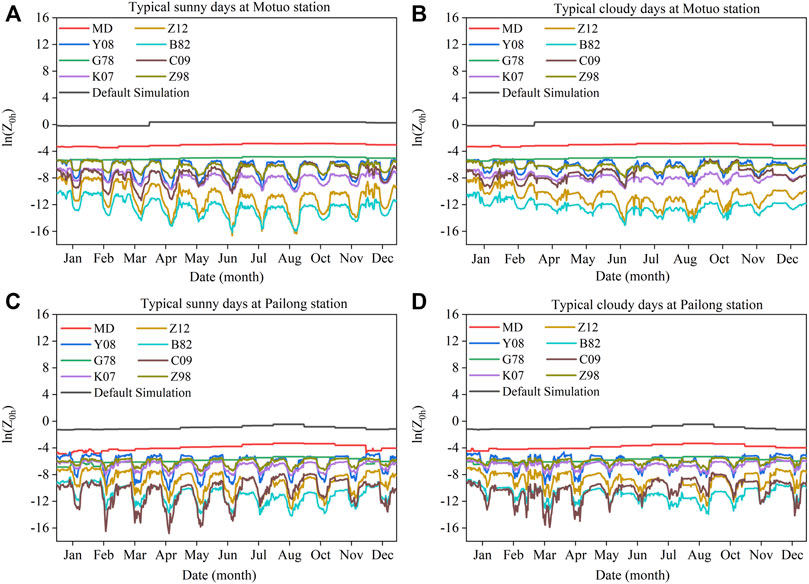
FIGURE 2. Comparison of Z0h between the original and revised versions of CLM5.0 on typical sunny/cloudy days at Motuo and Pailong stations, the scheme that integrates MSP and MPFT referred to as MD scheme.
3.3 Data screening of the clear/cloudy condition
To fully embody the sensitivity of H and LE to the Z0h schemes, the typical sunny/cloudy days of each month of 2019 at Motuo and Pailong stations (excluding the months with serious missing data) are selected by characteristic downward total radiation patterns from the entire simulation period. In general, the total radiation of typical sunny days is a smooth and symmetrical single-peak type, and the daily variations in the total radiation of typical cloudy days are characterized by both single-peak and wave-peak types (the daily maximum of the total radiation of typical cloudy days is roughly half of that under typical sunny days). Moreover, the precipitation on both typical sunny and cloudy days is 0.0 mm (Zhang et al., 2022).
On typical sunny days, the land-atmosphere water and heat exchange process is relatively strong, which can better capture the simulation errors of the CLM5.0 to simulate the H and LE and verify the simulation performance of the improved CLM5.0. The weather conditions on typical cloudy days are more complicated, discussing the simulation performance of CLM5.0 under typical cloudy days will add scientificity to the selection of the Z0h scheme suitable for the Grand Canyon region.
4 Results
4.1 Improvement of underlying surface characteristics
Figures 3, 4 show the simulated H, LE, and statistical parameters at Motuo and Pailong stations under different weather conditions and various Z0h schemes.
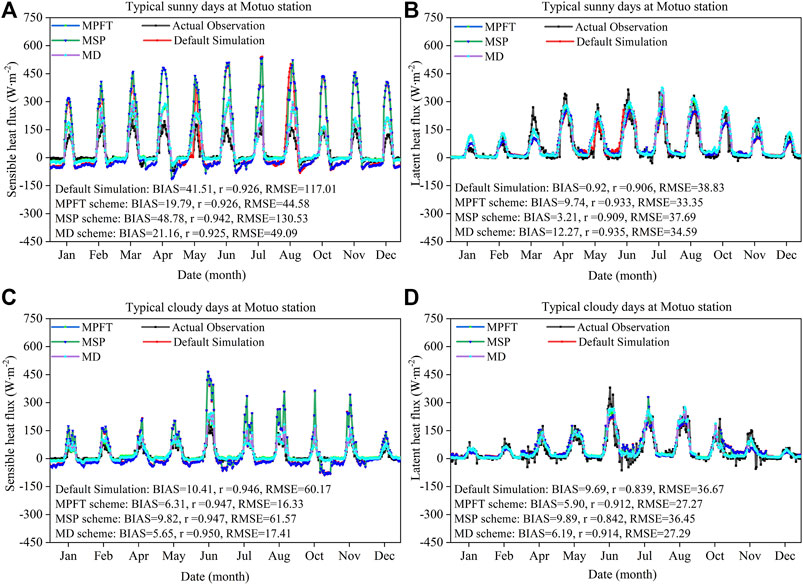
FIGURE 3. Comparison of turbulent fluxes between the original and revised versions of CLM5.0 against observations on the typical sunny/cloudy days at Motuo station, where BIAS represents the simulation deviation, RMSE is the root mean square error, and r is the correlation coefficient, (A and C) H, (B and D) LE, unit: (W∙m−2).
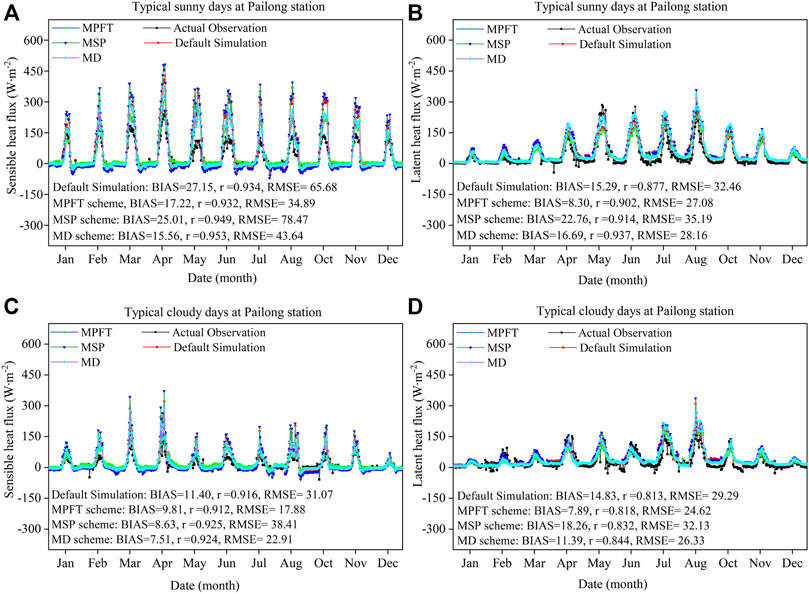
FIGURE 4. As in Figure 3 for Pailong station.
The results show that the MPFT scheme and the MD scheme significantly improve the performance of CLM5.0 for simulating H, while only slightly improving the performance of LE. Under the default scheme of CLM5.0, the simulated mean of H at Motuo station on typical sunny and cloudy days is 2.39 and 1.51 times that of the observations. Under the MPFT scheme H only 1.66 and 1.31 times the observations, RMSE decreases by 61.90% and 72.86%, and the simulated BIAS decreases by 52.32% and 39.39%, respectively. At Pailong station, under the MPFT scheme, the RMSE of H decreased by 46.88% (for sunny days) and 42.45% (for cloudy days) compared with the default scheme, and the BIAS decreased by 36.57% (for sunny days) and 13.95% (for cloudy days). The plant functional types of the two sites are dominated by grassland, while the CLM5.0 defaults to match more than 30% of the temperate evergreen coniferous forests and boreal evergreen coniferous forests. Significant differences exist in the canopy height of different vegetation canopies in CLM5.0, which affects the calculation of Z0h.
Figure 5 further compares the phase change characteristics of ln (Z0h) and
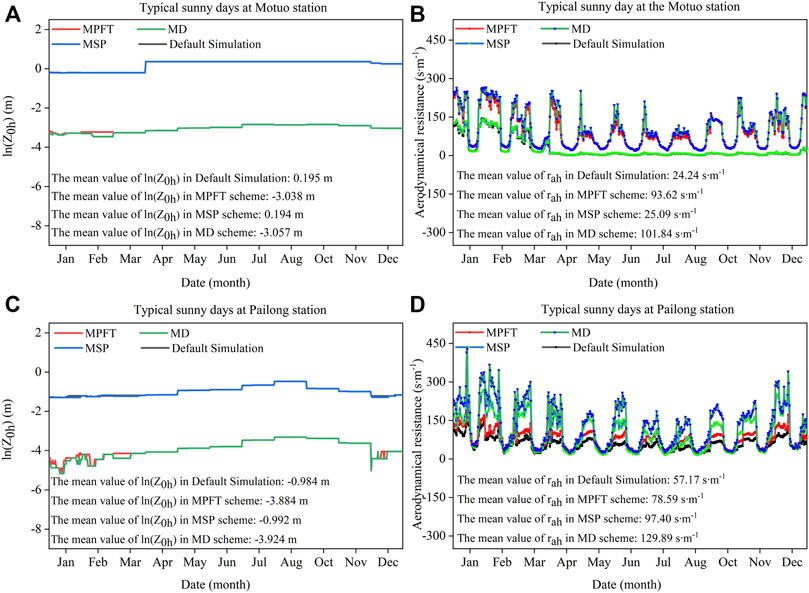
FIGURE 5. Comparison of Z0h (m) and aerodynamic resistance (rah) (s∙m−1) between the original and revised versions of the CLM5.0.
In summary, the simulated mean of CLM5.0 for turbulent fluxes under the MD and MPFT schemes is closer to the observations, and the RMSE is notably reduced. Compared with other schemes, the simulations of turbulent fluxes under the MD scheme are better correlated with observations. In this paper, the sensitivity tests of the turbulent fluxes to different Z0h schemes will be carried out based on the MD scheme.
4.2 Sensitivity tests of parameterization schemes of thermal roughness length
In the previous section, it was pointed out that the modification of plant functional types and soil properties effectively improved the performance of CLM5.0 for simulating H, although it still needs further improvement. On these bases, this paper evaluates the performance of CLM5.0 under the seven Z0h schemes, optimizing the schemes that are suitable for the simulation of CLM5.0 to the turbulent fluxes in the Grand Canyon region and further revealing the mechanism of the water and heat exchange process between the land surface and the atmosphere.
Figure 6 shows that the simulations of H and LE increase rapidly from June to August and then decrease. The Z0h schemes have a positive impact on the simulations of H and LE, clearly lowering the simulation errors of CLM5.0 that overestimate the peak of H and underestimate the peak of LE on typical sunny days. The simulated BIAS of H on typical sunny days is less than 4.00 W m−2 for the Z12, C09, and K07 schemes, in particular, the BIAS and RMSE under the Z12 scheme are only −3.23 and 21.63 W m−2, 107.78% and 81.51% lower than the default scheme (41.51 and 117.01 W m−2). Except for the B82, K07, and Z12 schemes, the simulated BIAS of H under the typical cloudy days is less than 3.00 W m−2 for the other schemes; in particular, the BIAS and RMSE under the G78 scheme are only 1.28 and 13.93 W m−2, 87.25% and 76.84% lower than the default scheme (10.04 and 60.17 W m−2). All seven Z0h schemes overestimated the LE simulations on typical sunny days, with simulated BIAS all greater than 12.00 W m−2. Compared with other schemes, CLM5.0 under the G78 scheme has the best simulation performance for LE, with the simulated RMSE being 34.43 (for sunny) and 28.64 (for cloudy) W∙m−2, while the simulated RMSE is 38.83 (for sunny) W∙m−2 and 36.67 (for cloudy) W∙m−2 under the default scheme.
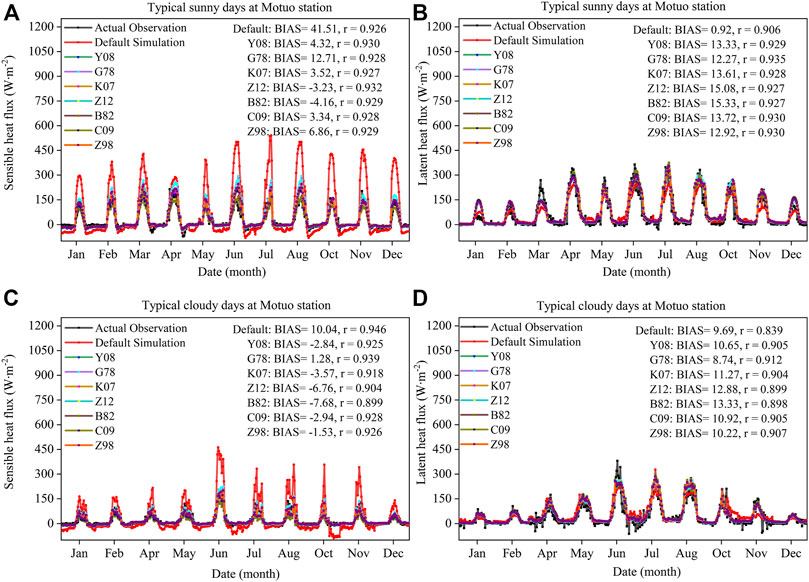
FIGURE 6. Comparison of turbulent fluxes between the original and revised versions with seven Z0h schemes against observations at Motuo stations, where BIAS represents the simulation deviation, r is the correlation coefficient, (A and C) H, (B and D) LE, unit: (W∙m−2).
In this paper, the correlation between the observations and simulations of the original and revised versions of CLM5.0 at Motuo and Pailong stations is discussed successively. Under typical sunny days, the correlation between the observations and the simulations of H under the Z12 scheme is the best, with r increasing from 0.926 (before modification) to 0.932, followed by the Y08 scheme. For the simulations of LE, the G78 scheme is the best, with r increasing from 0.906 to 0.935, followed by the C09 and Z98 schemes. Under typical cloudy days, the r of LE between the observations and the simulations under the G78 scheme is improved from 0.839 to 0.912, while the correlation of H between the observations and the simulations under all of the Z0h schemes worsens: the correlation under the G78 scheme is the best (up to 0.939), while r was 0.946 under the default scheme. It is worth noting that the simulated values of turbulent fluxes between the seven parameterization schemes have excellent correlations, with r all above 0.99.
In general, the Z0h schemes effectively improve the simulation errors of H and significantly increase the correlation between the observations and the LE simulations.
Figure 7 shows boxplots of the simulations of H and LE under the seven Z0h schemes and observations, with the mean and extremum of the data shown with each plot. The box represents the position of 25%–75% after the data are sorted, representing the central characteristics of the data. The upper and lower edges of the box to the cap line are the maximum and minimum values fluctuation range of the data. The points around the box show the distribution of the data, which captures the anomalies and uncertainties of the data.
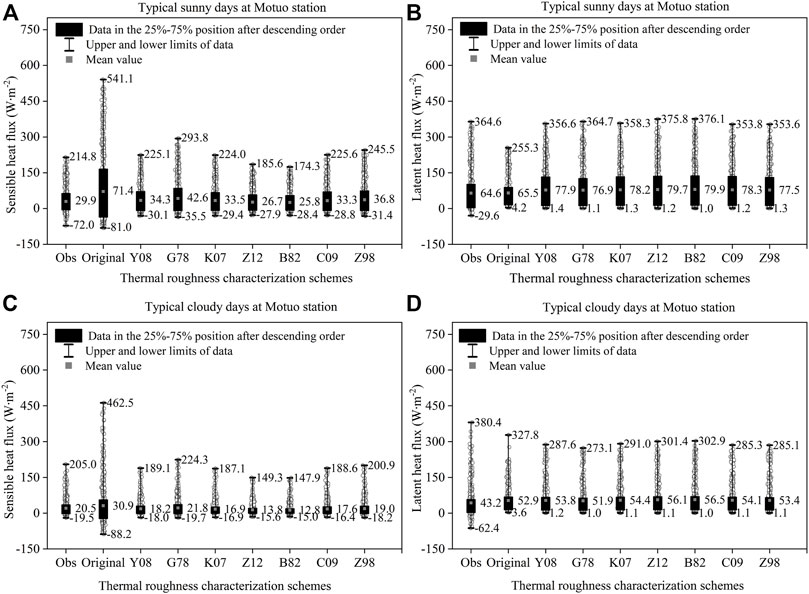
FIGURE 7. Boxplots of the observations and the simulations of H and LE under different Z0h schemes on typical sunny/cloudy days at Motuo station, (A and C) H, (B and D)) LE, unit: (W∙m−2).
Figure 7 better depicts the variation characteristics of turbulent fluxes between the original and revised versions of CLM5.0 at Motuo station. The H under the default scheme has some anomalies that deviate significantly from the box, and the simulated uncertainties are concentrated on the peaks of H and LE. The above-simulated errors are because Z0m and Z0h are equal under the default schemes, while many studies have shown that Z0m and Z0h should differ by an order of magnitude (Hogue et al., 2005; Zeng et al., 2012). A higher Z0h would directly result in a lower
The box and extremum range of H after parameterization are effectively reduced. For typical sunny days, the box range of H under the Z12 scheme at Motuo station is −7.4–58.1 W m−2 with a mean of 26.7 W m−2, and the observations are in the range of −5.6–63.6 W m−2 with a mean of 29.9 W m−2, both of which are closest. For typical cloudy days, the box range of H under the G78 scheme (−2.3–32.3 W m−2) is closest to the observations (−2.0–34.7 W m−2), while all of the Z0h schemes have higher box ranges for LE, the G78 scheme (12.0–125.8 W m−2 for sunny days, 11.8–63.7 W m−2 for cloudy days) is closest to the observations (3.1–101.9 W m−2 for sunny days, 2.9–57.1 W m−2 for cloudy days). The above characteristics are in good agreement with the characteristics such as simulated BIAS, RMSE, and correlations in the original and revised versions of CLM5.0 presented in the previous section.
The previous sections concentrate mainly on the generally simulated errors in the original and revised versions of CLM5.0, while peak values of turbulent fluxes better represent its extreme variability. Comparing the RMSE and BIAS between the observations and the simulations of the turbulent fluxes under the original and revised versions of CLM5.0 during the period of intense turbulent flux exchanges (12:00–16:00) at Motuo station, we can capture the performance of CLM5.0 under different parameterization schemes more accurately.
As shown in Figure 8, the original CLM5.0 significantly overestimates H during the period of intense turbulent flux exchanges, with the BIAS reaching 224.48 and 82.50 W m−2 and the RMSE reaching 226.27 and 84.29 W m−2, for sunny and cloudy respectively. On typical sunny days, CLM5.0 shows the best simulation performance for H under the Z12 schemes, with the simulated BIAS and the RMSE of H being only −12.18 and 13.54 W m−2, respectively, which are reduced by 105.43% and 94.2% compared with the default scheme, followed by the C09, K07, and Y08 schemes. CLM5.0 shows the best simulation performance for H under the G78 scheme on typical cloudy days, with the simulated BIAS and RMSE of H being 2.75 and 5.42 W m−2, respectively, which are 77.08 and 81.54 W m−2 lower than the default scheme, followed by the Z98, Y08, and C09 schemes. Except for the G78 scheme, the Z0h of Motuo and Pailong stations under the other parameterization schemes have obvious daily variation characteristics (see Figure 2 for details). Z0h reaches its daily minimum during the period of intense turbulent flux exchanges, which is conducive to higher
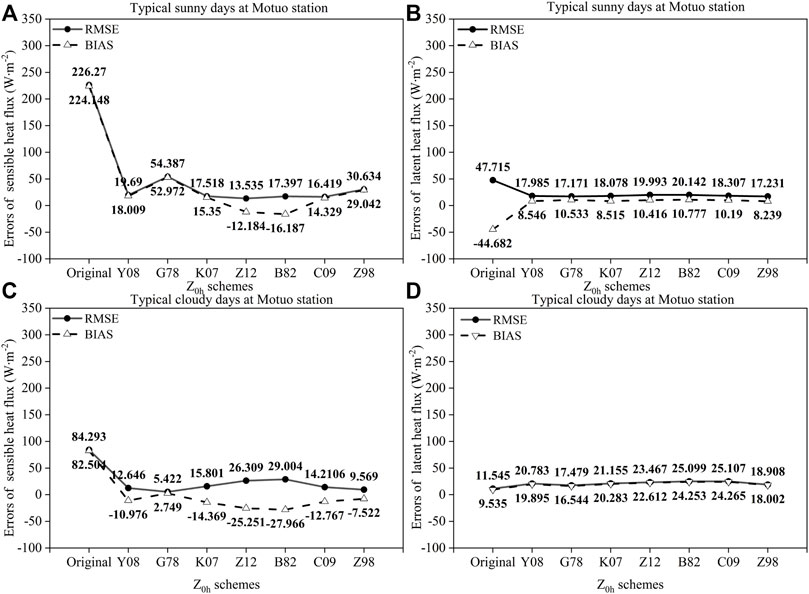
FIGURE 8. Root mean square error (RMSE) and BIAS between simulated and measured values for the period of strong turbulent exchange (12:00–16:00) under the typical sunny/cloudy days at Motuo station, (A and C) error in sensible heat flux (W∙m−2), (B and D) error in latent heat flux (W∙m−2).
The original CLM5.0 simulates the peak of LE during the period of intense turbulent flux exchanges more accurately compared with H while underestimating the peak of LE on typical sunny days, with the simulated BIAS and RMSE reaching −44.68 and 47.72 W m−2, respectively. All of the parameterization schemes obviously improve the above-simulated errors, with the simulated BIAS of LE being in the range of 8.00–11.00 W m−2, including only 8.52 W m−2 for the K07 scheme. For typical cloudy days, the original CLM5.0 is better for LE simulations, with simulated BIAS and RMSE values of only 9.54 and 11.55 W m−2, while the parameterized CLM5.0 increased the overestimated peak LE, of which CLM5.0 has the best simulation performance under the G78 scheme, with simulated BIAS and RMSE values of 16.54 and 17.48 W m−2, respectively. The parameterization schemes effectively improve the simulation errors of the peaks of H and LE on typical sunny days but do not improve LE on typical cloudy days.
In summary, this paper concludes that CLM5.0 with the Z12 and G78 schemes is more suitable for describing the water and heat exchanges between the land surface and the atmosphere at Motuo station, whereas the Z12 scheme is more suitable for the simulations of H on typical sunny days and the G78 scheme is more suitable for the simulations of LE. The performance of the Z12 scheme was enhanced by only modifying the empirical coefficient of the Z0h scheme by Zilitinkevich (1995). Zeng et al. (2012) claim that the H under the Z12 scheme is consistent with those using the Z0h formulation as a function of both u* and u* in Yang et al. (2008) in semi-arid regions. Surface resistance based on the Z0h formulation in Yang et al. (2008) becomes negative in the early morning, which is difficult to interpret physically, while the Z12 scheme would produce even better the H. Z0h becomes the determining factor in the calculations of the surface exchange coefficient for heat (Ch) and thus for the LST and H, Z0h under the Z12 scheme has diurnal variation characteristics, and the value is smaller than that under the G78 scheme, resulting in a larger rah, and the sensible heat is significantly reduced, while the model increases the surface latent heat flux for surface energy balance. It is worth noting that the simulation performance of CLM5.0 for LE is better not only under the original Z0h scheme but also under the seven schemes mentioned above, which are only small differences in the latent heat flux under different schemes. Under the G78 scheme, its KB−1 is constant and has no diurnal variation characteristics. Under the scheme, there is only a small decrease in the near-surface sensible heat flux, and the adjustment of the near-surface latent heat flux is even weaker.
Both Motuo and Pailong stations are located in the YGC, with an altitude difference of 904.0 m. Pailong station is higher in altitude, which makes the
Figure 9 accurately reflects that the H of Pailong station increases rapidly from February to April, while the surface energy is mainly consumed as latent heat during the plateau monsoon of late April to mid-late October. For typical sunny days, the absolute value of the simulated BIAS of H under the Z12, Y08, and K07 schemes is less than 3.00 W m−2, in which the simulated BIAS and RMSE under the Z12 scheme are only −1.93 and 15.13 W m−2, 107.11% and 76.96% lower than the default scheme (27.15 and 65.68 W m−2). For typical cloudy days, the absolute values of the simulated BIAS of H under the seven Z0h schemes are all less than 5.00 W m−2, in which the simulated BIAS and RMSE under the Z12 scheme are only -0.16 and 11.53 W m−2, 101.40% and 62.89% lower than the default scheme (11.40 and 31.07 W m−2). CLM5.0 under the seven characterization schemes increased overrated the mean of LE for typical sunny days, with the simulated BIAS within the range of 19–26 W m−2. Compared with the other schemes, CLM5.0 under the G78 scheme had the best simulation performance, with a simulated RMSE of 30.71 W m−2 (for sunny days) and 27.70 W m−2 (for cloudy), respectively, while the simulated RMSE under the default scheme only reaches 32.46 and 29.29 W m−2.
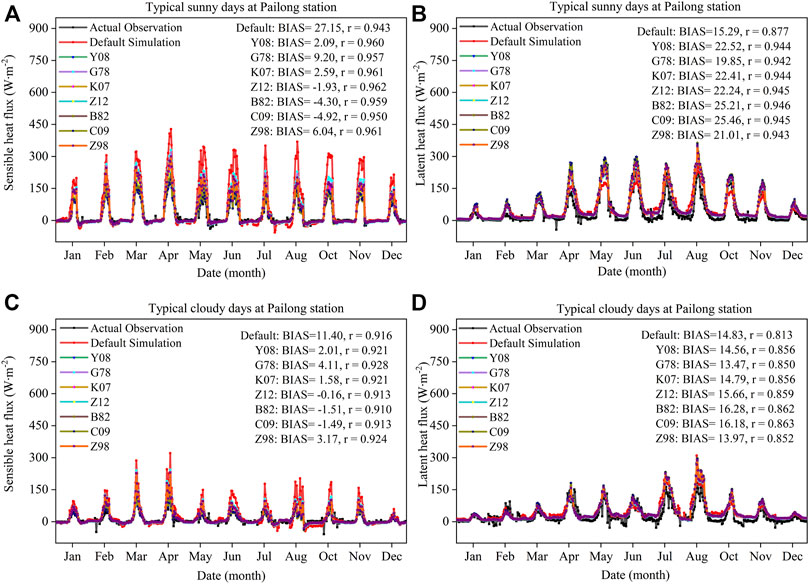
FIGURE 9. Comparison of turbulent fluxes between the original and revised versions with seven Z0h schemes against observations on typical sunny/cloudy days at Pailong stations, where BIAS represents the simulation deviation and r is the correlation coefficient, (A and C) H, (B and D) LE, unit: (W∙m−2).
In this paper, the correlation between the observations and simulations of the original and revised versions of CLM5.0 is discussed successively. For typical sunny days, the correlation between the observations and the simulations of H under the Z12 scheme is the best, with r increasing from 0.943 (before modification) to 0.962, followed by the K07 and Z98 schemes. All of the Z0h schemes increase the r between the observations and the simulations of LE from 0.877 to more than 0.943, of which the B82 scheme reaches 0.946. For the typical cloudy days, the r between the observations and the simulations of LE under the seven characterization schemes increased from 0.813 to more than 0.850, of which the C09 scheme was 0.863. For the typical cloudy days, except for the B82, C09, and Z12 schemes, all of the other schemes improve the correlation between the observations and the simulations of H, of which the G78 scheme increased from 0.916 to 0.928. It is worth noting that the simulated values of turbulent fluxes between the seven parameterization schemes have excellent correlations, with the correlation coefficients all above 0.980.
Figure 10 compares the boxplot of diurnal variations in H and LE between the original and revised versions of CLM5.0 and observations at Pailong station. Simulations of H under the default scheme have a few abnormal points that seriously deviate from the box, but the degree of deviation is smaller than that of Motuo station, and the simulated uncertainties are mainly reflected in the peaks of H and LE. The parameterization schemes effectively narrow the range of the box and extremum of H. For typical sunny days, the box ranges of H under Z12 (−4.9–44.2 W m−2), Y08 (-5.6–53.8 W m−2), and K07 schemes (−5.4–51.9 W m−2) are closest to the observations (−3.3–52.4 W m−2) versus the other schemes, while for typical cloudy days, the box ranges of H under the Z12 scheme (−3.2–16.8 W m−2) are closest to the observations (−1.1–17.3 W m−2). Furthermore, all seven Z0h schemes increase the box range of LE, and the same characteristics as those of Motuo station exist. Compared with the other schemes, the box range of LE under the G78 scheme (18.4–74.8 W m−2 on sunny days, 17.1–49.5 W m−2 on cloudy days) is closest to the observations (4.4–53.7 W m−2 on sunny days, 5.3–40.8 W m−2 on cloudy days). The above characteristics are in high agreement with the characteristics such as simulated BIAS and correlations in the original and the revised version of CLM5.0 presented in the previous section.
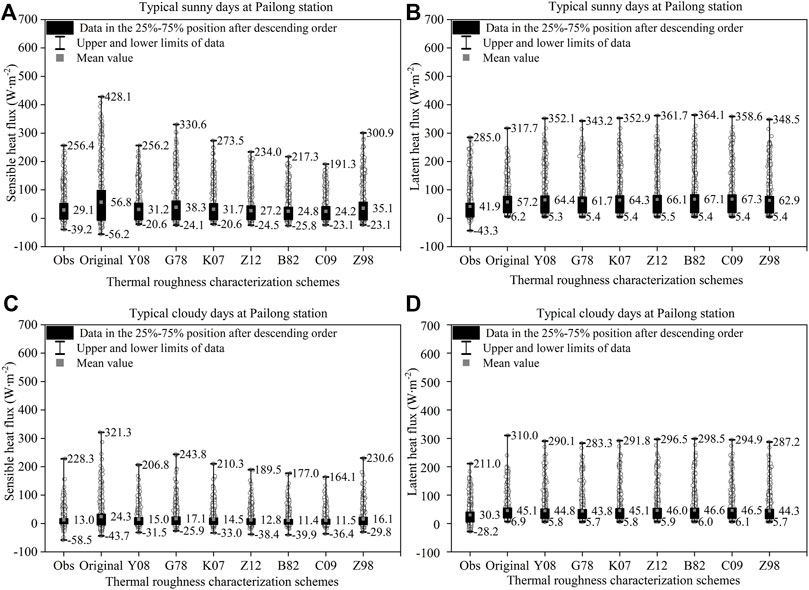
FIGURE 10. Boxplots of the observations and the simulations of H and LE under different Z0h schemes on typical sunny/cloudy days at Pailong station, (A and C) H, (B and D) LE, unit: (W∙m−2).
Figure 11 reflects the phase characteristics of the RMSE and BIAS between the observations and the simulations of the turbulent fluxes under the original and revised versions of CLM5.0 during the period of intense turbulent flux exchanges (12:00–16:00) at Pailong station. The results show that the original CLM5.0 severely overestimates the peak of H, with the simulated BIAS reaching 121.46 (for sunny days) and 50.49 (for cloudy days) W∙m−2 and the RMSE reaching 122.65 (for sunny days) and 51.47 (for cloudy days) W∙m−2. The parameterization schemes effectively improve the above-simulated error. CLM5.0 shows the best simulation performance for the peak of H under the Z12 schemes, with the simulated BIAS and the RMSE for typical sunny days being only -0.02 and 3.96 W m−2, respectively, which are reduced by 100.02% and 96.78% compared with the default scheme, followed by the B82 and C09 schemes. For typical cloudy days, the simulated BIAS and RMSE of the peak of H under the Z12 scheme are 1.19 and 4.17 W m−2, respectively, which are 49.30 and 46.30 W m−2 lower than those of the default scheme, followed by the B82, C09, and Y08 schemes.
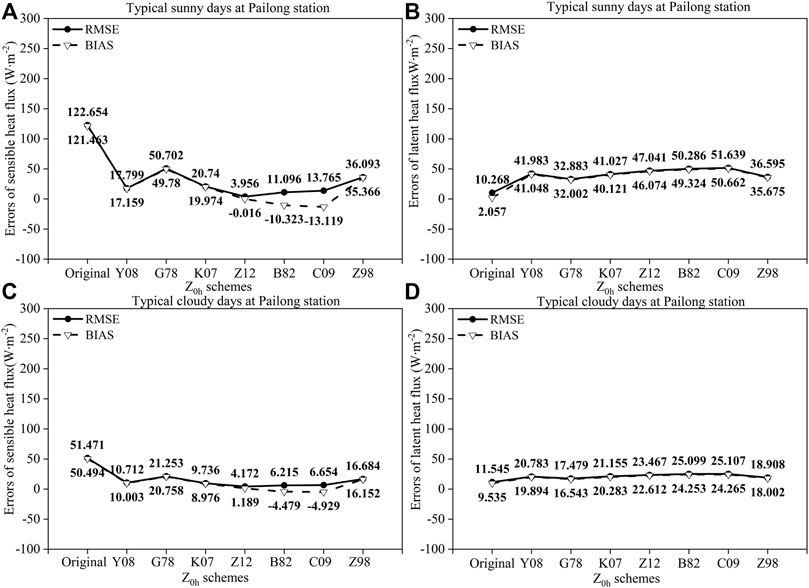
FIGURE 11. Root mean square error (RMSE) and BIAS between simulated and measured values for the period of strong turbulent exchange (12:00–16:00) under the typical sunny/cloudy days at Pailong station, (A and C) error in sensible heat flux (W∙m−2), (B and D) error in latent heat flux (W∙m−2).
The original CLM5.0 simulates the peak of LE at Pailong station during the period of intense turbulent flux exchanges more accurately compared with H, and the above characteristics are also manifested in Motuo station, with simulated BIAS values of 2.06 (for sunny) and 9.54 (for cloudy) W∙m−2 and RMSE values of 10.27 (for sunny) and 11.55 (for cloudy) W∙m−2. However, all of the Z0h schemes overestimated the peak LE. CLM5.0 under the G78 scheme had the best simulation performance, with simulated BIAS values of 32.00 (for sunny days) and 16.54 (for cloudy days) W∙m−2 and RMSE values of 32.88 (for sunny days) and 17.48 (for cloudy days) W∙m−2. Thus, the Z0h schemes have a positive effect on the simulated peak of H at Pailong station, which is also present at Motuo station.
In summary, this paper concludes that for Pailong station, the CLM5.0 under the Z12 scheme is more suitable for the simulations of H, and the G78 scheme is more suitable for the simulations of LE.
To use the M-O similarity theory to accurately calculate the turbulent fluxes, Z0h must be accurately parameterized (Su et al., 2001). Figures 12, 13 intuitively show the phase change characteristics of ln (Z0h) and the mean of H and LE, respectively, between the original and the revised version of CLM5.0 at the two stations.
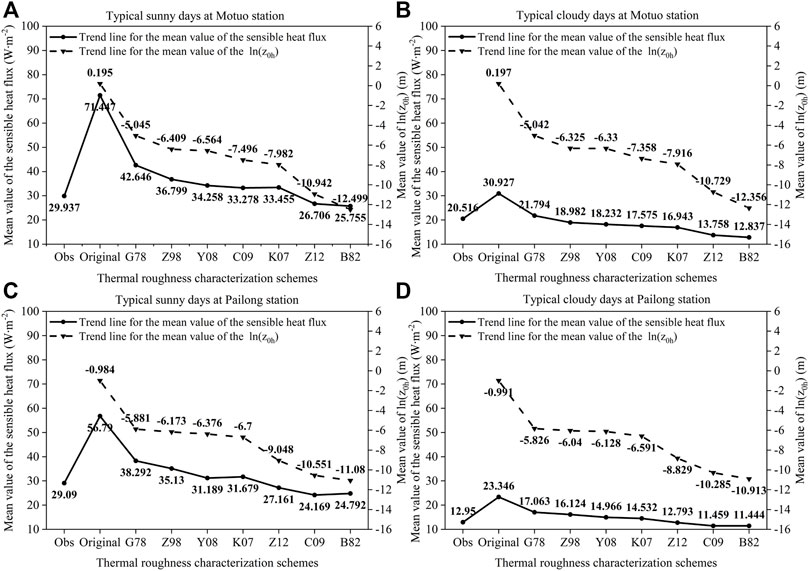
FIGURE 12. Comparison of the simulations of H and Z0h under different Z0h schemes on typical sunny/cloudy days at Motuo and Pailong stations.
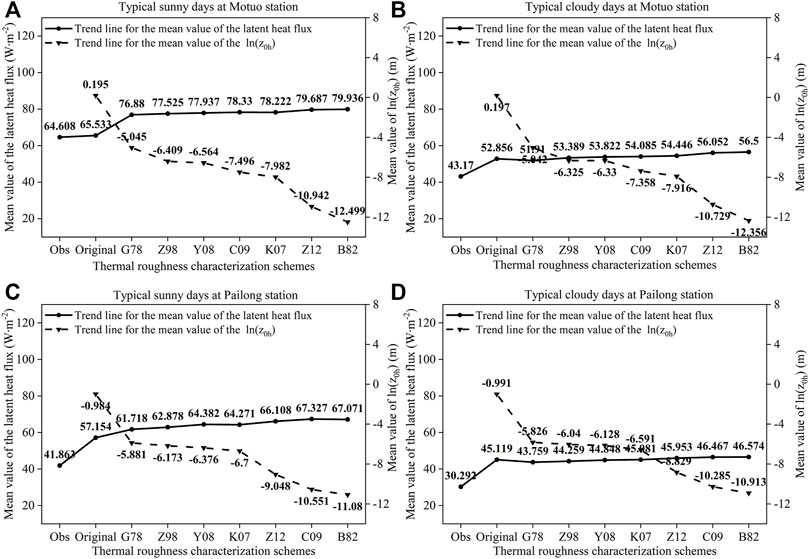
FIGURE 13. Comparison of the Simulations of LE and Z0h under different Z0h schemes on typical sunny/cloudy days at Motuo and Pailong stations.
Figure 12 shows that the simulations of H have a positive change sensitivity to Z0h; with the increase (decrease) of the simulated ln (Z0h), the simulated mean of H increases (decreases), and the larger the difference of simulated Z0h between different schemes, the more obvious the feedback relationship is. The simulated means of ln (Z0h) under the G78 and B82 schemes at Motuo station are -5.045 and -12.499 m (for sunny days), respectively, and -5.042 and -12.356 m (for cloudy days), and thus the mean of H under the G78 scheme is 1.66 (for sunny days) and 1.70 (for cloudy days) times that of the B82 scheme. In addition, the means of ln (Z0h) under the G78 and B82 schemes at Pailong station are -5.881 and -11.080 m (for sunny days), respectively, and -5.826 and -10.913 m (for cloudy days); thus, the means of H under the G78 scheme are 1.54 (for sunny) and 1.49 (for cloudy) times those of the B82 scheme.
Figure 13 shows that the simulations of LE at the two stations have a reverse sensitivity to the simulated Z0h, while the sensitivity is reduced compared to H. The mean LE under the B82 scheme at Motuo station is only 1.04 (for sunny days) and 1.08 (for cloudy days) times that of the G78 scheme. Moreover, the mean LE under the B82 scheme at Pailong station is only 1.09 (for sunny days) and 1.06 (for cloudy days) times that of the G78 scheme.
Although the characterization schemes effectively lower Z0h corresponding to higher
In other words, the Z0h schemes significantly lower H, with a weakening of the degree of heating to the atmosphere, corresponding to a higher
5 Conclusion
Based on the Global Soil Dataset for Earth System Model data and the actual plant functional types at Pailong and Motuo stations in the Yarlung Zangbo Grand Canyon, we discuss the importance of the Z0h schemes in describing the water and heat exchange processes between the land surface and atmosphere in CLM5.0 and compare the performance of the original and revised versions of CLM5.0, obtaining the following conclusions:
1) In this paper, the actual plant functional types and soil properties of the two stations in CLM5.0 are revised, which significantly improves the simulation performance of CLM5.0 for the turbulent fluxes, while the simulation performance of H requires further improvement. On typical sunny and cloudy days, the simulated mean of H at Motuo station is 1.66 and 1.31 times the mean of observations, while the default schemes of CLM5.0 are 2.39 and 1.51 times. Moreover, the r between the LE simulations and observations at the two stations on typical sunny days improved from 0.906 to 0.877 before parameterization to 0.935 and 0.937, respectively.
2) The Z12 scheme is more suitable for simulations of H at Pailong station and the typical sunny days at Motuo station, while the G78 scheme is more suitable for simulations of H under the typical cloudy days at Motuo station. On typical sunny days, the simulated BIAS values of H at Motuo and Pailong stations under the Z12 scheme are −3.23 and -1.93 W m−2, 107.78% and 107.11% lower than the default scheme, respectively, on the typical cloudy days, the simulated BIAS of H at Motuo station under the G78 scheme is only 1.28 W m−2.
3) Differences exist among the seven schemes in improving the simulation performance of CLM5.0 for LE. The G78 scheme is more suitable for simulations of LE at the two stations, in which, for typical cloudy days, the simulated BIAS of LE under the G78 scheme at Motuo and Pailong stations is 8.74 and 13.47 W m−2, respectively, while those under the default scheme are 9.69 and 14.83 W m−2.
4) Except for the G78 and the default schemes, the Z0h under the other schemes presented obvious daily variation characteristics. For typical sunny days, the simulated means of ln (Z0h) under the G78 and B82 schemes at Motuo station are −5.045 and −12.499 m, respectively, and the simulated mean of H under the G78 scheme is 1.66 times that of the B82 scheme. The simulated mean of LE under the B82 scheme is 1.04 times that of the G78 scheme.
Hence, the default Z0h scheme of CLM5.0 produces anomalously high Z0h during the daytime in the Grand Canyon region, resulting in a significant overestimation of H, which can be effectively addressed by applying the Z12 scheme, while CLM5.0 has a better simulation effect on LE under the G78 scheme.
Significance statement
A “water vapor transport channel” exists in the Yarlung Zangbo Grand Canyon that affects the onset of the rainy season and the intensity of precipitation on the TP. The radiative forcing generated by clouds, water vapor, and aerosols in the atmosphere restricts the ground-air temperature differences and evapotranspiration process in this region, creating a unique “water and heat exchange pattern” locally. Researching land-atmosphere interactions in the Grand Canyon area by Land-surface models is an essential measure to reveal the mechanism of land-atmosphere interactions on the nonuniform underlying surface under complex meteorological conditions.
Data availability statement
The data analyzed in this study is subject to the following licenses/restrictions: The Eddy Covariance data used in this research are available to obtain from Xuelong Chen at the Institute of Tibetan Plateau Research Chinese Academy of Sciences and Siqiong Luo at the Northwest Institute of Eco-Environment and Resources. Requests to access these datasets should be directed to Xuelong Chen, eC5jaGVuQGl0cGNhcy5hYy5jbg==, and Siqiong Luo, bHNxQGx6Yi5hYy5jbg==.
Author contributions
QZ performed the data analyses, drew the figures, and wrote the manuscript. JW designed the research and also joined the analyses. And the other authors (TZ, YY, YW, GZ, WL, YC, and ZY) contributed to the investigation and analysis.
Funding
This research was funded by the Second Tibetan Plateau Scientific Expedition and Research (STEP) program (2019QZKK0105); National Natural Science Foundation of China (41971308) and the Scientific Research Foundation of CUIT (KYTZ201821).
Acknowledgments
The authors are grateful to the Institute of Tibetan Plateau Research Chinese Academy of Sciences and the Northwest Institute of Eco-Environment and Resources for providing the data. Thanks are also to two reviewers for their constructive comments and suggestions.
Conflict of interest
The authors declare that the research was conducted in the absence of any commercial or financial relationships that could be construed as a potential conflict of interest.
Publisher’s note
All claims expressed in this article are solely those of the authors and do not necessarily represent those of their affiliated organizations, or those of the publisher, the editors and the reviewers. Any product that may be evaluated in this article, or claim that may be made by its manufacturer, is not guaranteed or endorsed by the publisher.
References
Brutsaert, W., H. (1982). Evaporation into the atmosphere: Theory, history, and applications. D Reidel, Dordrecht, Netherlands, 299.
Chen, F., Schaake, J., Xue, Y., Pan, H., Koren, V., Duan, Q., et al. (1996). Modeling of land surface evaporation by four schemes and comparison with FIFE observations. J. Geophys. Res. 101, 7251–7268. doi:10.1029/95JD02165
Chen, F., and Zhang, Y. (2009). On the coupling strength between the land surface and the atmosphere: From viewpoint of surface exchange coefficients. Geophys. Res. Lett. 36, L10404. doi:10.1029/2009GL037980
Chen, X., Su, Z., Ma, Y., Yang, K., Wen, J., and Zhang, Y. (2013). An improvement of roughness height parameterization of the surface energy balance system (SEBS) over the Tibetan plateau. J. Appl. Meteorol. Climatol. 52, 607–622. doi:10.1175/JAMC-D-12-056.1
Chen, X., Xu, X., Wang, G., Chen, D., Ma, Y., Liu, L., et al. (2022). INVC-investigation of the water vapor channel within the Yarlung Zangbo Grand canyon, China (No. EGU22-2088). Vienna, Austria: EGU General Assembly 2022, 23–27. EGU22-2088. doi:10.5194/egusphere-egu22-2088May 2022
Chen, Y., Yang, K., Zhou, D., Qin, J., and Guo, X. (2010). Improving the Noah land surface model in arid regions with an appropriate parameterization of the thermal roughness length. J. Hydrometeorol. 11, 995–1006. doi:10.1175/2010JHM1185.1
Dai, Y., Shangguan, W., Wei, N., Xin, Q., Yuan, H., Zhang, S., et al. (2019). A review of the global soil property maps for Earth system models. Soil 5, 137–158. doi:10.5194/soil-5-137-2019
Deng, M., Meng, X., Lyv, Y., Zhao, L., Li, Z., Hu, Z., et al. (2020). Comparison of soil water and heat transfer modeling over the Tibetan Plateau using two Community Land Surface Model (CLM) versions. J. Adv. Model. Earth Syst. 12, e2020MS002189. doi:10.1029/2020MS002189
Dickinson, R. E., Oleson, K. W., Bonan, G., Hoffman, F., Thornton, P., Vertenstein, M., et al. (2006). The community land model and its climate statistics as a component of the community climate system model. J. Clim. 19, 2302–2324. doi:10.1175/JCLI3742.1
Gao, D., Y. (2008). Earth science and society. Nature 30, 301–303. (in Chinese). doi:10.1038/nature06595
Garratt, J., R., and Francey, R., J. (1978). Bulk characteristics of heat transfer in the unstable, baroclinic atmospheric boundary layer. Bound. Layer. Meteorol. 15, 399–421. doi:10.1007/BF00120603
Hogue, T. S., Bastidas, L., Gupta, H., Sorooshian, S., Mitchell, K., and Emmerich, W. (2005). Evaluation and transferability of the Noah land surface model in semiarid environments. J. Hydrometeorol. 6, 68–84. doi:10.1175/JHM-402.1
Jacobs, C. M. J., and De Bruin, H. A. R. (1992), The sensitivity of regional transpiration to land-surface characteristics: Significance of feedback, J. Clim.CO, 5, 6832–7698. doi:10.1175/1520-0442(1992)005<0683:TSORTT>2.0
Kanda, M., Kanega, M., Kawai, T., Moriwaki, R., and Sugawara, H. (2007). Roughness lengths for momentum and heat derived from outdoor urban scale models. J. Appl. Meteorol. Climatol. 46, 1067–1079. doi:10.1175/JAM2500.1
Lai, H. W., Chen, H. W., Kukulies, J., Ou, T., and Chen, D. (2021). Regionalization of seasonal precipitation over the Tibetan Plateau and associated large-scale atmospheric systems. J. Clim. 34, 2635–2651. doi:10.1175/JCLI-D-20-0521.1
LeMone, M. A., Tewari, M., Chen, F., Alfieri, J. G., and Niyogi, D. (2008). Evaluation of the Noah land surface model using data from a fair-weather IHOP_2002 day with heterogeneous surface fluxes. Mon. Weather Rev. 136, 4915–4941. doi:10.1175/2008MWR2354.1
Liang, X., and Dai, Y. (2008). A sensitivity study of the common land model on soil textureand soil brightness. Clim. Environ. Res. 13, 585–597. (in Chinese).
Martano, P. (2000), Estimation of surface roughness length and displacement height from single-level sonic anemometer data, J. Appl. Meteorol. Climatol.EOSRLA>2.0.CO, 39, 7082–7715. doi:10.1175/1520-0450(2000)039<0708
Mauder, M., and Foken, T. (2015). Documentation and instruction manual of the eddy-covariance software package TK3. http://www. bayceer. uni-bayreuth. de/mm/de/software/soft-ware/software_dl. Php.
Monteith, J. L. (2010). An empirical method for estimating long-wave radiation exchanges in the British Isles. Q. J. R. Meteorol. Soc. 87, 171–179. doi:10.1002/qj.49708737206
Osamu, T., Hirohiko, I., and Ichiro, T. (2002). Analysisof aerodynamic and thermodynamic parameters on the grassy marshland surface of Tibetan Plateau. Prog. Nat. Sci. 12, 36–40.
Qu, W., Henderson-Sellers, A., Pitman, A. J., Chen, T. H., Abramopoulos, F., Boone, A., et al. (1998), Sensitivity of latent heat flux from PILPS land-surface schemes to perturbations of surface air temperature, J. Atmos. Sci.SOLHFF>2.0.CO, 55. , 19092–21927. doi:10.1175/1520-0469(1998)055<1909
Shangguan, W., Dai, Y., Duan, Q., Liu, B., and Yuan, H. (2014). A global soil data set for Earth system modeling. J. Adv. Model. Earth Syst. 6, 249–263. doi:10.1002/2013MS000293
Su, Z., Schmugge, T., Kustas, W. P., and Massman, W. J. (2001), An evaluation of two models for estimation of the roughness height for heat transfer between the land surface and the atmosphere, J. Appl. Meteorol.Co, 40. 9332–1951. doi:10.1175/1520-0450(2001)040<1933:AEOTMF>2.0
Sud, Y. C., Shukla, J., and Mintz, Y. (1988), Influence of land surface roughness on atmospheric circulation and precipitation: A sensitivity study with a general circulation model, J. Appl. Meteor Climatol.IOLSRO>2.0.CO, 27. 10362–11054. doi:10.1175/1520-0450
Verhoef, A., De Bruin, H. A. R., and Van Den Hurk, B. J. J. M. (1997), Some practical notes on the parameter kB-1 for sparse vegetation, J. Appl. Meteor Climatol.SPNOTP>2.0.CO, 36. 560–572. doi:10.1175/1520-0450(1997)036<0560
Xie, J., Yu, Y., Li, J. L., Ge, J., and Liu, C. (2019). Comparison of surface sensible and latent heat fluxes over the Tibetan Plateau from reanalysis and observations. Meteorol. Atmos. Phys. 131, 567–584. doi:10.1007/s00703-018-0595-4
Xu, X., Lu, C., Shi, X., and Gao, S. (2008). World water tower: An atmospheric perspective. Geophys. Res. Lett. 35, L20815. doi:10.1029/2008GL035867
Yang, K., Koike, T., Ishikawa, H., Kim, J., Li, X., Liu, H., et al. (2008). Turbulent flux transfer over bare-soil surfaces: Characteristics and parameterization. J. Appl. Meteorol. Climatol. 47, 276–290. doi:10.1175/2007JAMC1547.1
Yang, K., Koike, T., and Yang, D. (2003). Surface flux parameterization in the Tibetan Plateau. Bound. Layer. Meteorol. 106, 245–262. doi:10.1023/A:1021152407334
Yang, K., Rasmy, M., Rauniyar, S., Koike, T., Taniguchi, K., Tamagawa, K., et al. (2007). Initial CEOP-based review of the prediction skill of operational general circulation models and land surface models. J. Meteorological Soc. Jpn. 85, 99–116. doi:10.2151/jmsj.85A.99
Ye, D., Z., and Wu, G., X. (1998). The role of the heat source of the Tibetan Plateau in the general circulation. Meteorl. Atmos. Phys. 67, 181–198. doi:10.1007/bf01277509
Zeng, X., and Dickinson, R., E. (1998), Effect of surface sublayer on surface skin temperature and fluxesJ. Clim.EOSSOS>2.0.CO, 11, 5372–5550. doi:10.1175/1520-0442(1998)011<0537
Zeng, X., and Wang, A. (2007). Consistent parameterization of roughness length and displacement height for sparse and dense canopies in land models. J. Hydrometeorol. 8, 730–737. doi:10.1175/JHM607.1
Zeng, X., Wang, Z., and Wang, A. (2012). Surface skin temperature and the interplay between sensible and ground heat fluxes over arid regions. J. Hydrometeorol. 13, 1359–1370. doi:10.1175/JHM-D-11-0117.1
Zhang, Q., Wen, J., Wu, Y., Chen, Y. L., Li, Y., Q., et al. (2022). Characteristics analysis of the land-atmospheric water & heat exchanges over the Yarlung Zangbo Grand canyon region. Plateau Meteorol. 41, 1–14. (in Chinese).
Zhang, Y., and Li, J. (2016). Impact of moisture divergence on systematic errors in precipitation around the Tibetan Plateau in a general circulation model. Clim. Dyn. 47, 2923–2934. doi:10.1007/s00382-016-3005-y
Keywords: Yarlung Zangbo Grand canyon, precipitation, water and heat exchange, CLM5.0, roughness length
Citation: Zhang Q, Wen J, Zhang T, Yang Y, Wu Y, Zhang G, Liu W, Chen Y and Yan Z (2023) The impacts of roughness length on the simulation of land-atmosphere water and heat exchanges over the Yarlung Zangbo Grand canyon region. Front. Earth Sci. 10:1077791. doi: 10.3389/feart.2022.1077791
Received: 23 October 2022; Accepted: 14 November 2022;
Published: 10 January 2023.
Edited by:
Chenghai Wang, Lanzhou University, ChinaCopyright © 2023 Zhang, Wen, Zhang, Yang, Wu, Zhang, Liu, Chen and Yan. This is an open-access article distributed under the terms of the Creative Commons Attribution License (CC BY). The use, distribution or reproduction in other forums is permitted, provided the original author(s) and the copyright owner(s) are credited and that the original publication in this journal is cited, in accordance with accepted academic practice. No use, distribution or reproduction is permitted which does not comply with these terms.
*Correspondence: Jun Wen, andlbkBjdWl0LmVkdS5jbg==
 Qiang Zhang
 Jun Wen
 Tangtang Zhang
 Yiting Yang1
 Yueyue Wu
 Ge Zhang
 Zhitao Yan