 Shuxian Jiang
 Mehdi Mokhtari2*
94% of researchers rate our articles as excellent or good
Learn more about the work of our research integrity team to safeguard the quality of each article we publish.
Find out more
ORIGINAL RESEARCH article
Front. Earth Sci., 10 January 2023
Sec. Solid Earth Geophysics
Volume 10 - 2022 | https://doi.org/10.3389/feart.2022.1075151
This article is part of the Research TopicRock Physics of Unconventional ReservoirsView all 11 articles
Eagle Ford Formation has significant heterogeneity due to the existence of marl and interbedded limestone layers. The objective of this paper is to study the elastic properties of different layers in the Eagle Ford Formation. To achieve the goal, the relationships between compressional and shear velocities in marl and limestone layers were investigated in two representative Eagle Ford wells. These empirical equations can be used to estimate the shear velocity in Eagle Ford wells without sufficient well log data. Moreover, correlations between elastic properties and GR were obtained. Among all layers in the Eagle Ford Formation, marl layers of the lower Eagle Ford have the lowest averaged values of compressional velocity, shear velocity and dynamic Young’s modulus, while the limestone layers of the upper Eagle Ford have the highest averaged values of these three elastic parameters. In addition, the effect of elastic properties of shale layers on the aspect ratio of unconfined and confined fractures were evaluated. The influence of Young’s modulus contrast of shale layers on the aspect ratio of confined fractures was remarkable.
In the unconventional reservoir stimulation, hydraulic fracturing design is usually performed in layered shales, which are stratified by layers with distinct mechanical properties. Elastic parameters are crucial to seismic imaging, wellbore stability and hydraulic fracturing treatment. The elastic parameters including compressional velocity, shear velocity, Young’s modulus, Poisson’s ratio, and minimum horizontal stress can be obtained from mechanical well logs. However, the high expense of the mechanical well logging limits the usage of well logs. Therefore, it is time and cost efficient to estimate elastic properties from conventional well logs.
Compressional and shear velocities are widely used in geological and geophysical applications. Pickett, 1963 popularized the use of compressional and shear velocity ratio as a lithology indicator. In addition to lithology, porosity is also related to sonic velocities in shaly sandstone or carbonate rocks (Rafavich et al., 1984; Han et al., 1986). The relationship between compressional velocity and shear velocity were investigated in formations with different lithologies (Hossain et al., 2012). This relationship can be used to predict shear velocity for wells lack of shear velocity data. Castagna et al. 1985) developed a positive linear relationship between compressional velocity and shear velocity according to velocity and field seismic measurement in mudrocks. Greenberg and Castagna (1992) developed coupled equations to estimate shear velocity in porous rocks. Vernik et al., 2002 developed the non-linear relationship between compressional and shear velocity, especially for low velocity sandstone. In shale formations, sonic velocities are influenced by gamma ray intensity, clay content and TOC (Xu and White, 1995 and, Xu and White, 1996, Altowairqi et al., 2015). The compressional and shear velocities of synthetic shale samples were measured. Results showed that sonic velocities were negatively related to TOC and clay content.
Although previous researchers have investigated the elastic properties of the Eagle Ford Formation (Hsu and Nelson, 2002; Yang et al., 2019; Kim, 2021), most of the results focused on the average values of reservoir properties over a certain depth interval or on presentative shale samples. Little research has been done on the characterization and quantification of the elastic properties in marl and interbedded limestone layers. In this study, the correlations of velocities as well as correlations of elastic properties and gamma ray or clay content in marl and limestone layers of the Eagle Ford Formation will be developed respectively. Moreover, the effect of elastic moduli on fracture aperture of layered shale is discussed in this study.
The well in this study is on the southwest side of the San Marcos arch and is close to the Edwards Reef Margin and the Sligo Reef Margin. It is in the jointed zone of the gas condensate and dry gas zone. Vertically, the Eagle Ford Formation can be divided into the Upper and Lower Eagle Ford based on previous research (Donovan et al., 2015; Breyer et al., 2016; Zumberge et al., 2016) as shown in Figure 1.
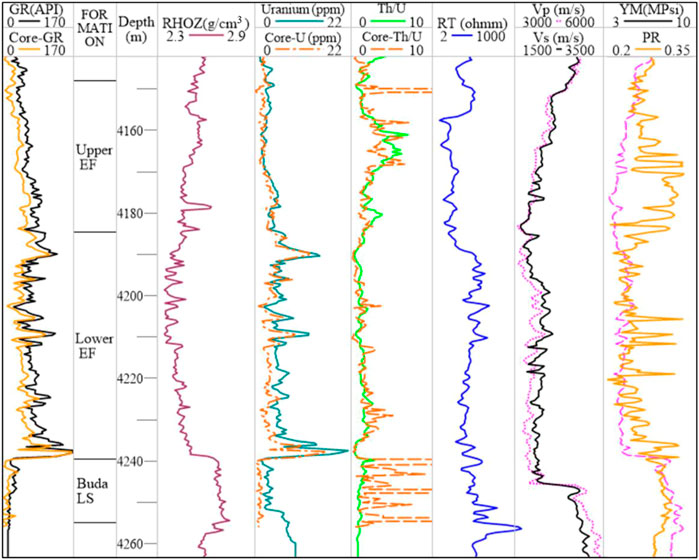
FIGURE 1. Well logs of the studied Eagle Ford well in Dewitt County, Texas.
There are obvious differences in the well logs of the Eagle Ford Formation and the Buda Limestone. Buda Limestone has much lower gamma ray intensity, higher density, lower Uranium, higher Thorium/Uranium ratio (Th/U), higher compressional and shear velocities than the Eagle Ford Formation. The Th/U ratio is a redox indicator of the depositional environment. In most of the Eagle Ford black shales, the Th/U ratio is less than 2, indicating anoxic environment (Jiang and Mokhtari, 2019).
The Lower Eagle Ford can be differentiated from the Upper Eagle Ford with higher gamma ray intensity, high Uranium concentration, low Th/U ratio and higher resistivity (plotted in logarithmic scale). The gamma ray intensity and spectral gamma intensity from well logs and core measurement are shown in Figure 1. The gamma ray intensity from core measurement is close to data from well logs and can be used in logging depth correction. It can be seen from the spectral gamma ray data that the Th/U ratio in the Lower Eagle Ford is much lower than in the Upper Eagle Ford. As shown in Figure 1, the Th/U ratios measured from cores have more variations than the Th/U ratios from well logging, though the trends of the two curves are quite the same. Since the hand-held spectral core gamma instrument collects Th, U and K data every 0.17 ft (5 cm) along the core samples, it can collect spectral gamma of layers with different characteristics. Additionally, compared with spectral gamma logging, spectral core gamma measurement can avoid well bore environmental distortion.
Based on well log and core sample analysis, there are distinct differences in reservoir properties of the marl and limestone layers. As depicted in Figure 2, samples from the marl layers are darker and flakier than those from limestone layers. XRD results show that the calcite content of marl layers ranges from 30% to 70% and clay content ranges from 20% to 50%. The interbedded limestone layers contain less clay (5%–30%) and more calcite (55%–90%) than marl layers.
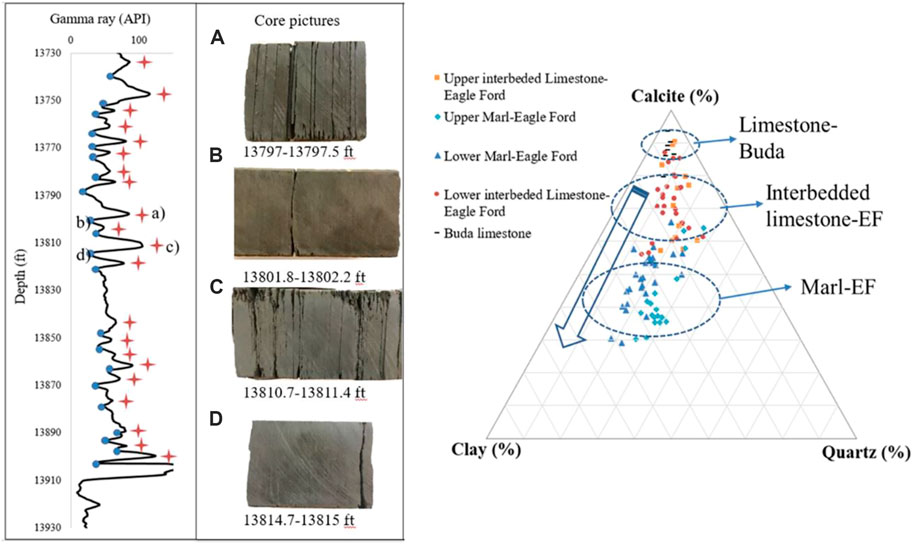
FIGURE 2. Left: Marl and limestone layers of the Eagle Ford Formation in Dewitt County, Texas (A,C) Core samples from marl layers; (B,D) core samples from limestone layers. Right: Ternary plot of the marl and limestone layers in the Eagle Ford and Buda Formation.
Castagna et al. (1985) raised an empirical correlation according to water saturated mudrocks that are mainly composed of quartz and clay minerals. It is commonly referred as mudrock line with Eq.1. In 1993, Castagna et al. raised sonic velocity correlations in carbonate rocks. For water saturated limestone, the compressional velocity can be expressed as Eq.2. These empirical correlations are valid for specific formations and variations in rock properties such as mineralogy and porosity can affect the accuracy of the estimation results. Eq. 1 is widely used in the shear velocity estimation in clastic silicate rocks that are composed primarily of clay and quartz. It can provide us with reasonable results of shear velocity for consolidated rocks with compressional velocity greater than 2.6 km/s. However, the mudrock line underestimated shear velocity for unconsolidated sediments and may not work well in calcite-rich shales. Eq. 2 shows the empirical correlations of compressional and shear velocities in water saturated limestone of a certain area, and it may not applicable in other areas.
Here we develop the correlation between compressional and shear velocity in Eagle Ford Formation and adjacent Buda Limestone (Figure 3). Buda Limestone is included in the analysis since it can be treated as the boundary of shale with highest calcite content. The correlations raised by Castagna et al. were plotted. The Castagna line 1985) can fit some of the data in the Eagle Ford, but it starts to diverge when the velocity increases and cannot fit the Buda limestone data. The Castagna et al., 1993 has a similar tend but still deviates from the data. As shown in Figure 3, there is a good positive linear relationship between compressional and shear velocity with R2 value of 0.96. The correlations in different layers of the Eagle Ford well in Dewitt County are summarized in Table 1. For wells without shear velocity data, Vs can be estimated based on the proposed correlations, especially in the marl layers of Upper Eagle Ford, interbedded limestone layers of Lower Eagle Ford and the Buda Limestone layers.
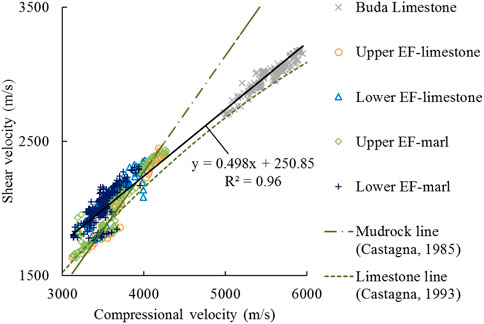
FIGURE 3. Correlations of compressional and shear velocity in Dewitt County.
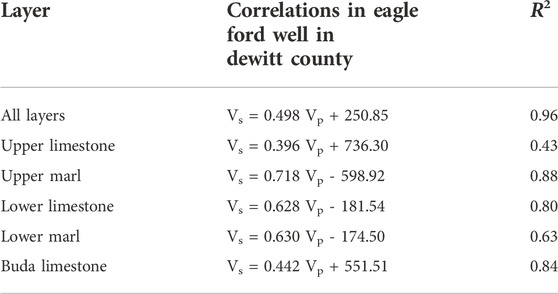
TABLE 1. Correlations of compressional and shear velocity of Eagle Ford well in Dewitt County (in m/s).
The elastic properties of different layers and the correlations between elastic properties and gamma ray intensity are shows in Figures 4, 5, 6, 7 and Tables 2, 3. According to Figures 4, 5, compressional and shear velocities have a power law relationship with gamma ray. The Buda Limestone on the upper left of the figures shows the lowest gamma ray (ranging from 18 API to 48 API) and highest compressional velocity (ranging from 4981 m/s to 5949 m/s) and shear velocity (ranging from 2701 m/s to 3181 m/s). Compared with the Buda Limestone layer, the Eagle Ford layers have much lower sonic velocities.
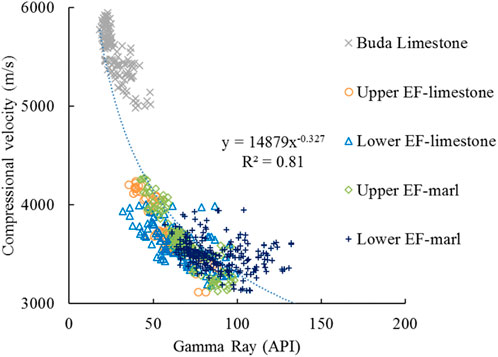
FIGURE 4. Correlations of compressional velocity and gamma ray in different layers.
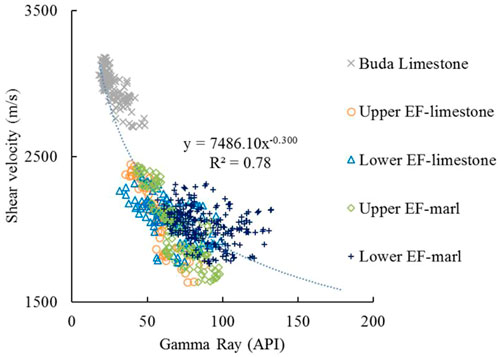
FIGURE 5. Correlations of shear velocity and gamma ray in different layers.
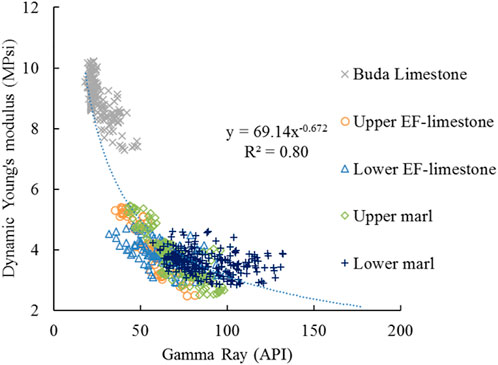
FIGURE 6. Correlations of dynamic Young’s Modulus and gamma ray in different layers.
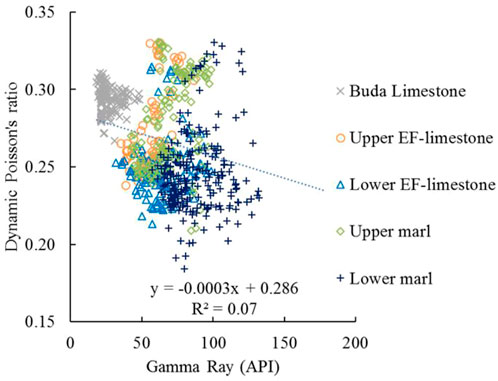
FIGURE 7. Correlations of dynamic Poisson’s ratio and gamma ray in different layers.
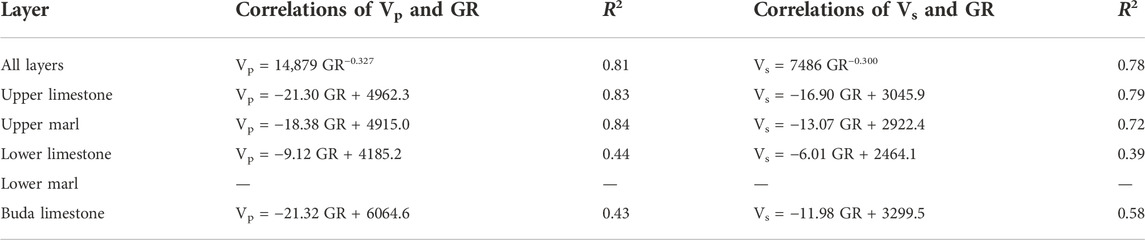
TABLE 2. Correlations of compressional velocity, shear velocity and gamma ray of Eagle Ford well in Dewitt County (in m/s).
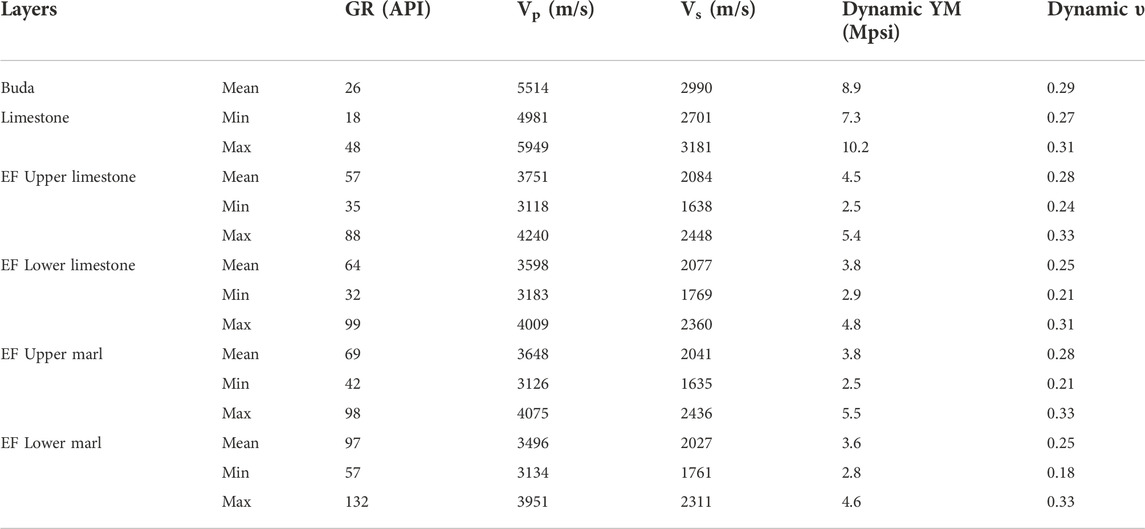
TABLE 3. Summary of parameters in different layers of the Eagle Ford and adjacent formation in Dewitt County.
Among the marl and interbedded limestone layers in the upper and lower Eagle Ford, marl layers of the lower Eagle Ford have the highest average value of gamma ray 97 API and lowest average values of compressional velocity 3496 m/s and shear velocity 2027 m/s. In contrast, interbedded limestone layers of the upper Eagle Ford have the lowest average values of gamma ray 57 API and highest average value of compressional velocity 3751 m/s and shear velocity 2084 m/s.
Table 2 shows the correlation of compressional velocity, shear velocity and gamma ray in different layers of the Eagle Ford well in Dewitt County (in m/s). In the marl and interbedded limestone layers in the Upper Eagle Ford, there is a good negative linear relationship between the sonic velocities and gamma ray intensity. However, in the Lower Eagle Ford and Buda Limestone, there is a weak or no correlation between compressional velocity, shear velocity and gamma ray. Attention should be paid when R2 is used to evaluate the fit of nonlinear relationships. Since R2 is calculated based on the linear regression model assumption, the increase of R2 does not always relate to better nonlinear models.
Based on compressional and shear velocities, the mechanical properties such as dynamic Young’s modulus and dynamic Poisson’s ratio can be obtained through Eqs 3, 4.
where Ed is the dynamic Young’s modulus of rock, MPsi; υm is the dynamic Poisson’s ratio of rock, dimensionless; ρb is density of rock, g/cm3; Vp is the compressional velocity of rock, m/s; Vs is the shear velocity of rock, m/s.
The mechanical properties of different layer and the correlation of mechanical properties with gamma ray intensity are shown in Figures 6, 7 and Table 3. Figure 6 depicts the relationship between dynamic Young’s modulus and gamma ray. Young’s modulus decreases with gamma ray and the data points fall into two clusters. Buda limestone shows the higher dynamic Young’s modulus with an average value of 8.9 Mpsi and the Eagle Ford Formation has much lower dynamic Young’s modulus. Among the marl and interbedded limestone layers in the upper and lower Eagle Ford, marl layers of the lower Eagle Ford have the lowest averaged value of dynamic Young’s modulus (3.6 Mpsi) while the limestone layers of the upper Eagle Ford have the highest averaged value (4.5 Mpsi).
In addition to the cross plots of compressional velocity, shear velocity and dynamic Young’s modulus against gamma ray, the relationships between dynamic Poisson’s ratio and gamma ray in different layers are also explored. As shown in Figure 7, there is no obvious difference among the three formations and no linear correlation between Poisson’s ratio and gamma ray. There is no obvious difference in Poisson’s ratio in the Eagle Ford Formation and the Buda Limestone. The average values of Poisson’s ratio in the Buda Limestone, Upper Eagle Ford, and Lower Eagle Ford are 0.29, 0.28, and 0.25, respectively.
For a better understanding of the elastic properties of the Eagle Ford Formation, another well located in La Salle County, Texas was studied. Figure 8 shows the maturity level of samples from the two wells. Samples from La Salle County are in the oil window and most samples from Dewitt County are in the condensate gas and dry gas window.
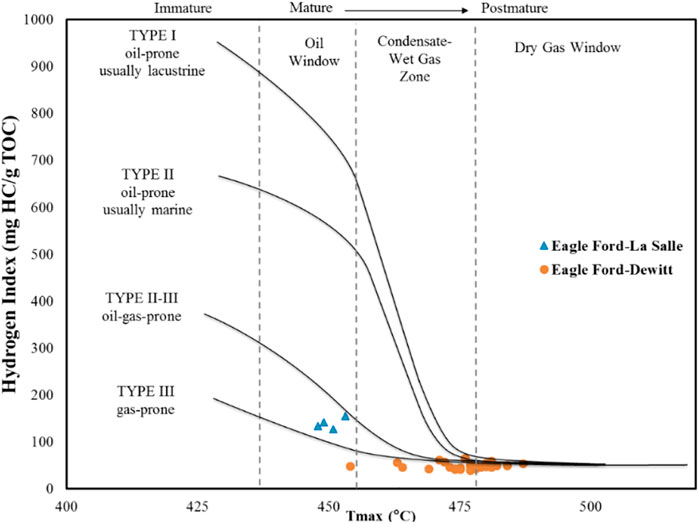
FIGURE 8. Maturity level of two Eagle Ford wells.
The well log information of the well in La Salle County is shown in Figure 9. The Eagle Ford Formation has higher gamma ray intensity, lower compressional and shear velocities, lower calcite content than the overlying Austin Chalk and the underlying Buda Limestone. The contact between the Upper and Lower Eagle Ford is marked by an increase in the gamma ray, especially the Uranium concentration. Additionally, the Lower Eagle Ford, which has higher organic richness, shows lower bulk density and higher resistivity than the Upper Eagle Ford.
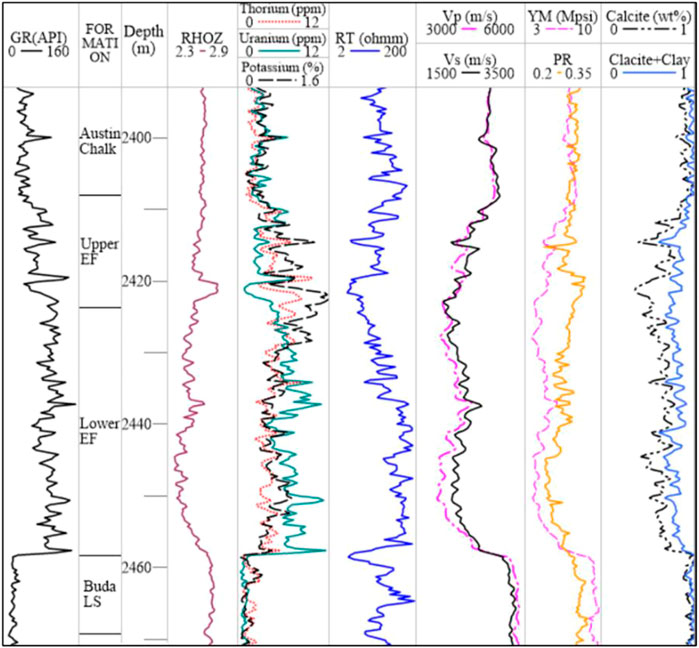
FIGURE 9. Well logs of a well in LaSalle County, showing the Eagle Ford shale and the adjacent formation unit.
At depth interval 2420 m–2423 m, the peak of potassium in the Upper Eagle Ford indicates the existence of ash bed layer (Mokhtari et al., 2016), which has much higher clay content than other parts of the formation. The features of ash bed are consistent with the results of Kiipli et al. (2008). Ash bed layers differ from the host rock by high concentrations of Al, P, Zr, Pb, and K as well as high clay content.
According to the contents of calcite and clay, we set a threshold of 75 API for categorizing limestone and marl layers in the upper Eagle Ford and a threshold of 105 API in the Lower Eagle Ford. The correlations between compressional and shear velocity in the Eagle Ford Formation and adjacent Buda Limestone are shown in Figure 10.
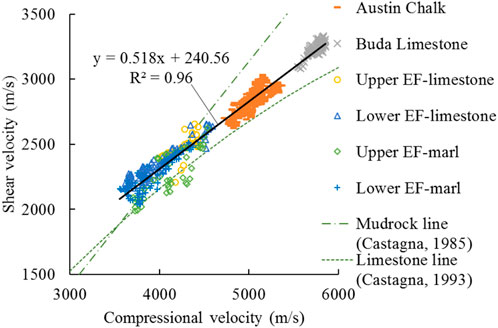
FIGURE 10. Correlations of compressional and shear velocity in La Salle County.
There is a good positive linear relationship between compressional and shear velocity. Among the three correlations, Vs = 0.518 Vp + 240.56 is the best fit line for the data of Eagle Ford, the overlying Austin Chalk and the underlying Buda Limestone. The correlations in different layers of the Eagle Ford well in La Salle County are summarized in Table 4. For wells without shear velocity data, Vs can be estimated based on the proposed correlation, especially in the Lower Eagle Ford Formation.
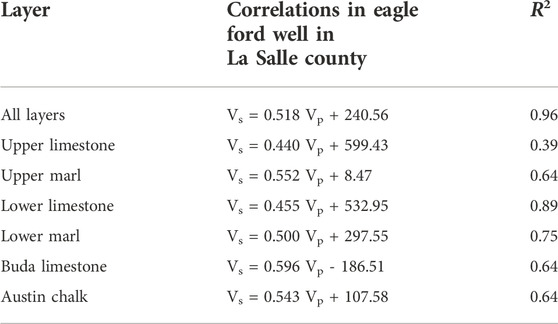
TABLE 4. Correlations of compressional and shear velocities of Eagle Ford well in La Salle County (in m/s).
The elastic properties of different layer and the correlation between elastic properties and gamma ray intensity and clay content are shown in Figures 11, 12, 13, 14 and Table 5. According to Figures 11, 12, and Table 5, compressional and shear velocities have good negative linear relationships with gamma ray. The Buda Limestone on the upper left of the figures shows the lowest gamma ray (ranging from 17 API to 40 API) and highest compressional velocity (ranging from 5546 m/s to 5857 m/s) and shear velocity (ranging from 3082 m/s to 3333 m/s). The Austin Chalk has higher gamma ray (ranging from 23 API to 113 API), lower compressional velocity (ranging from 4728 m/s to 5370 m/s) and shear velocity (ranging from 2624 m/s to 3031 m/s) than the Buda Limestone.
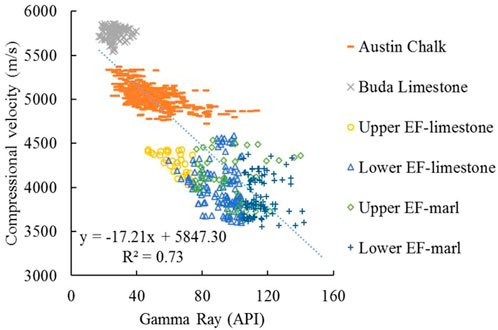
FIGURE 11. Correlations of compressional velocity and gamma ray in different layers.
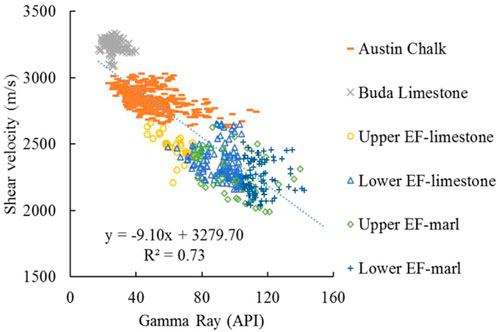
FIGURE 12. Correlations of shear velocity and gamma ray in different layers.
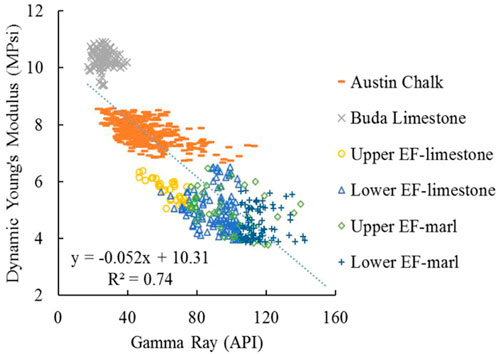
FIGURE 13. Correlations of dynamic Young’s Modulus and gamma ray in different layers.
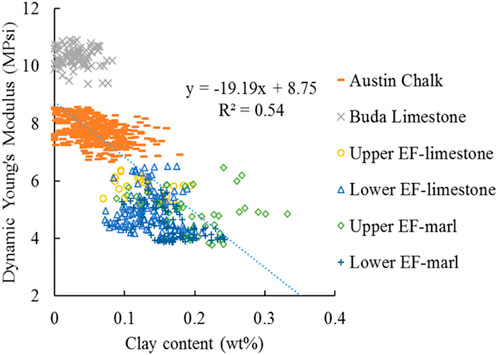
FIGURE 14. Correlations of dynamic Young’s Modulus and clay content in different layers.
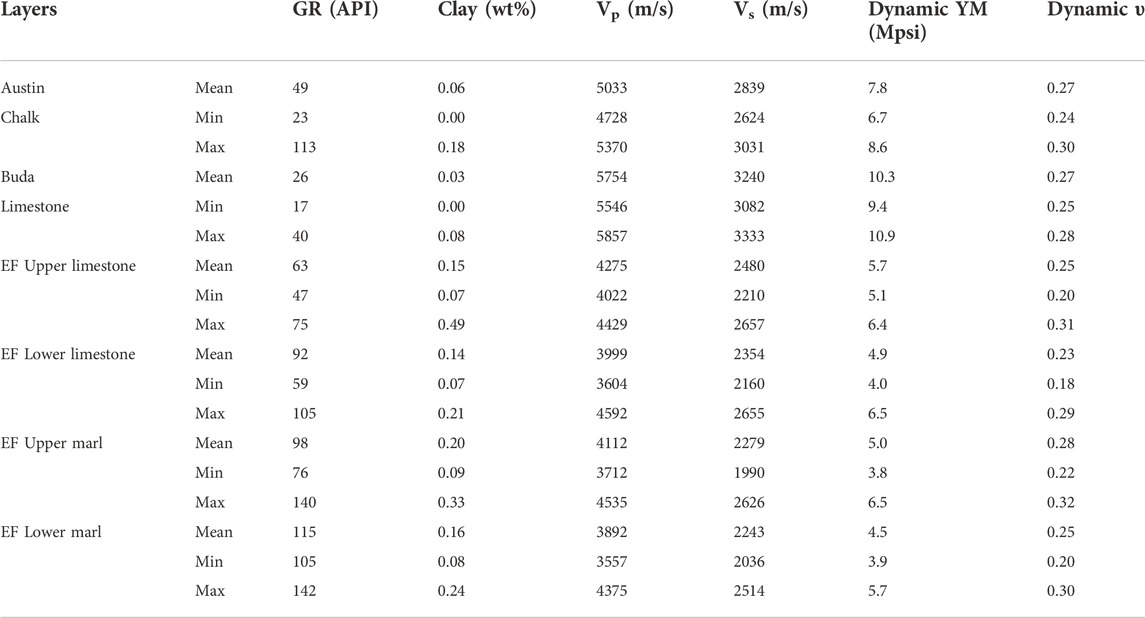
TABLE 5. Summary of elastic parameters in different layers of the Eagle Ford and adjacent formation in La Salle County.
Among the marl and limestone layers in the upper and lower Eagle Ford, marl layers of the lower Eagle Ford have the highest average value of gamma ray 115 API, lowest average values of compressional velocity 3892 m/s and shear velocity 2243 m/s. In contrast, limestone layers of the upper Eagle Ford have the lowest average values of gamma ray 63 API and highest average value of compressional velocity 4275 m/s and shear velocity 2480 m/s. The correlations of compressional velocity, shear velocity and gamma ray show that there is a weak or no relationship between sonic velocities and gamma ray in different layers of the Eagle Ford well in La Salle County.
Figure 13 depicts the relationship between dynamic Young’s modulus and gamma ray. Young’s moduli decrease with gamma ray and the data points fall into three clusters. Buda limestone shows the highest Young’s modulus with an average value of 10.3 Mpsi and the Eagle Ford Formation has the lowest Young’s modulus. Among the marl and limestone layers in the upper and lower Eagle Ford, marl layers of the lower Eagle Ford have the lowest averaged value of Young’s modulus (4.5 Mpsi) while the limestone layers of the upper Eagle Ford have the highest averaged value (5.7 Mpsi).
Figure 14 depicts the relationship between dynamic Young’s modulus and clay content. Similarly, there is a clear difference among the group of Austin Chalk, Buda Limestone and Eagle Ford Formation. But the negative linear relationship between Young’s modulus and clay content is relatively weak.
The comparison of elastic parameters in different layers of two Eagle Ford wells is shown in Table 6. Buda Limestone has the least variations in gamma ray intensity, compressional and shear velocities and Young’s moduli in these two wells. Compressional and shear velocities of the well in La Salle County are more than 11% higher than the well in Dewitt County in marl and limestone layers of the Eagle Ford Formation. It can be seen from the comparison of mechanical properties of two Eagle Ford wells that dynamic Poisson’s ratio of two wells is similar while dynamic Young’s modulus in La Salle County is more than 25% higher than in Dewitt County.
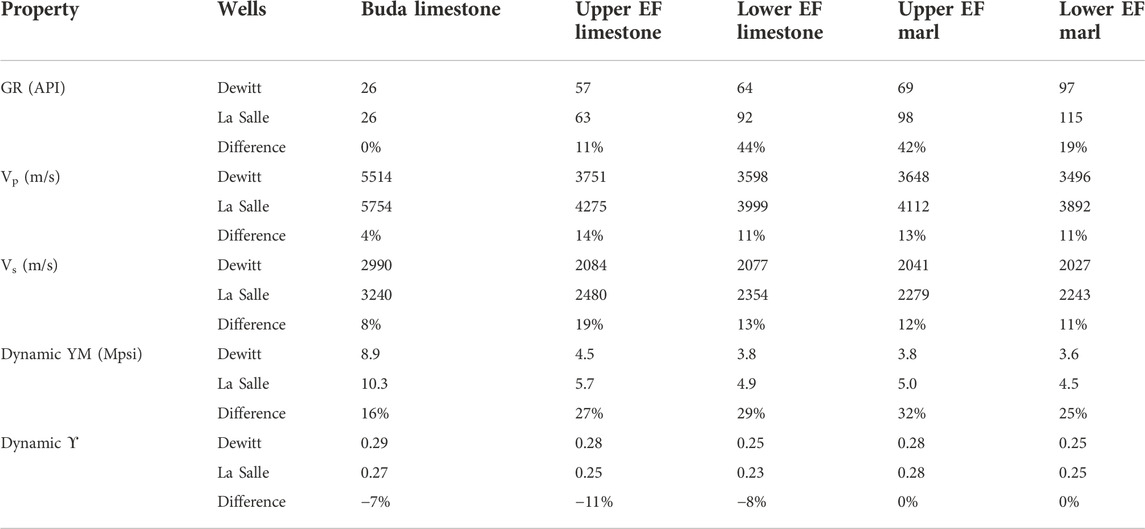
TABLE 6. Comparison of elastic parameters in different layers of two Eagle Ford wells.
The San Marcos Arch traverses the Eagle Ford play and extends towards the Gulf of Mexico southeasterly. The Edwards City shelf margin and the Sligo shelf margin spread toward southwest in parallel and then separate. In this study, the well in La Salle County is on the north side of the Edwards City shelf margin, while the well in Dewitt County is close to the Edwards Reef Margin and the Sligo Reef Margin. Both of these two wells are on the southwest side of the San Marcos arch. Therefore, caution should be paid when these results are generalized to other areas, such as Fayette county and Lavaca county, which are on the northeast side of the San Marcos arch.
Characterization of elastic properties of the marl and limestone layers in shale formations is crucial to hydraulic fracture design. The aperture or aspect ratio of fractures can be affected by factors such as layer thickness ratio, overburden stress and so on. The modulus contrast between adjacent layers is an essential factor in the investigation of fracturing behaviours and the effect of elastic properties on fracture aperture should be analyzed.
The FEM models of layered shale with an unconfined fracture and confined fractures are shown in Figure 15. In the numerical modelling, several assumptions are made: 1) there is no slip and opening along the layer boundaries; 2) there is a plane strain condition for the entire model; 3) the marl layers that are adjacent to the middle limestone layer have the same elastic properties. The bottom boundary is fixed in the y direction and the middle point of the bottom boundary is fixed in the x direction, so uy(B)=0 and ux(B)=0 at x=0. A constant displacement condition is imposed along the left and right boundaries, so ux(L)= -ux and ux(R)=ux.
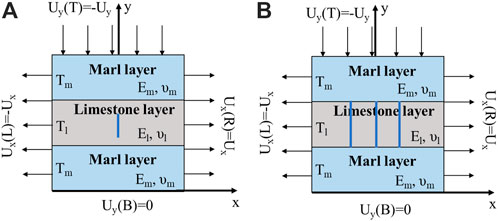
FIGURE 15. FEM model and its boundary conditions of layered shale. (A) Unconfined fracture model; (B) confined fracture model with three fractures (revised from Bai et al., 2000).
In the unconfined fracture model of layered shale (Figure 15A), El, υl, and Tl are the Young’s modulus, Poisson’s ratio and thickness of the limestone layer. Em, υm, and Tm are the Young’s modulus, Poisson’s ratio and thickness of the limestone layer. W and T are the width and overall thickness of the layers. H is the fracture height and εxx (ave) is the average strain in the x direction. In the confined fracture model (Figure 15B), three fractures are equally spaced and the fracture height is equal to the thickness of the limestone layer. S is the distance between fractures.
In order to investigate the effects of elastic properties of the marl and limestone layers on the fracture aspect ratio, one parameter is changed at one time and other parameters are kept constant. Figure 16 shows that the relative change of the unconfined fracture aspect ratio is positively related to the ratio of the Young’s modulus of the limestone layer to that of the marl layer (El/Em).
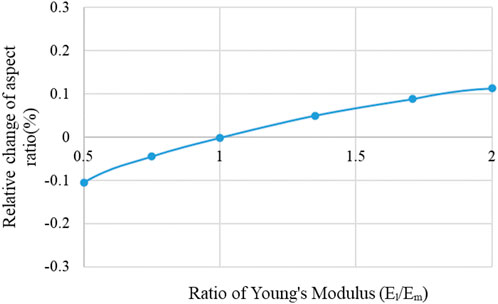
FIGURE 16. Correlations of relative change of aspect ratio and Young’s modulus ratio of adjacent layers in unconfined fracture model (υm=υl=0.25, εxx (ave)=0.002, H/Tl=0.1, Tl=0.2m, Tm=0.3 m).
According to the elastic properties of the Eagle Ford Shale in Dewitt County (shown in Table 3), the Young’s modulus ratio of the Upper Eagle Ford Shale ranges from 1.0 to 2.2, while the ratio of the Lower Eagle Ford Shale ranges from 1.0 to 1.7. According to the elastic properties of the Eagle Ford Shale in La Salle County (shown in Table 5), the Young’s modulus ratio of the Upper Eagle Ford Shale ranges from 1.3 to 1.7, while the ratio of the Lower Eagle Ford Shale ranges from 1.0 to 1.7. Therefore, the relative change of aspect ratio with respect to the Young’s modulus ratio is less than 0.1%.
Figure 17 illustrates the variations of the relative change of aspect ratio with Poisson’s ratio. As shown in Table 3, the Poisson’s ratio of the Upper and Lower Eagle Ford Shale in Dewitt county ranges from 0.21 to 0.33 and 0.18 to 0.33, respectively. As shown in Table 5, the Poisson’s ratio of the Upper and Lower Eagle Ford Shale in La Salle County ranges from 0.20 to 0.32 and 0.18 to 0.30, respectively. Therefore, the absolute value of relative change of aspect ratio with respect to the ratio of Poisson’s ratio is less than 0.01%.
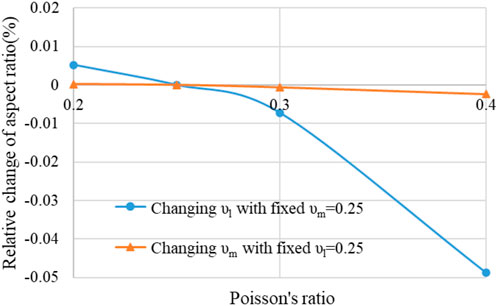
FIGURE 17. Correlations of relative change of aspect ratio and Poisson’s ratio in unconfined fracture model (Em=El=5 MPsi, εxx (ave)=0.002, H/Tl=0.1, Tl=0.2m, Tm=0.3 m).
It can be concluded from Figures 16, 17 that the influence of elastic properties of the Eagle Ford Shale on the aspect ratio of the unconfined fracture can be negligible in these two areas.
The effect of elastic properties of the layered shale on the aspect ratio of confined fractures is shown in Figures 18, 19. Figure 18 shows the relative change of aspect ratio increases with the ratio of the Young’s modulus of limestone layer to that of the marl layer. In addition, the relative change of aspect ratio increases significantly when the ratio of fracture spacing to layer thickness is low.
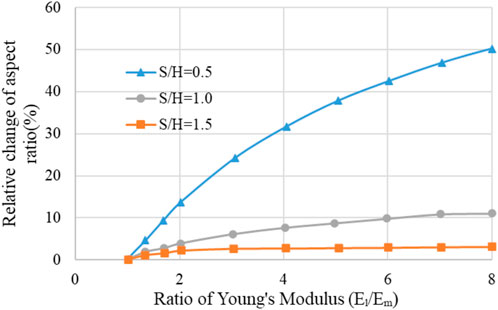
FIGURE 18. Correlations of relative change of aspect ratio and Young’s modulus ratio of adjacent layers in confined fracture model (υm=υl=0.25, εxx (ave)=0.002, Tl=H=0.2m, Tm=0.3 m).
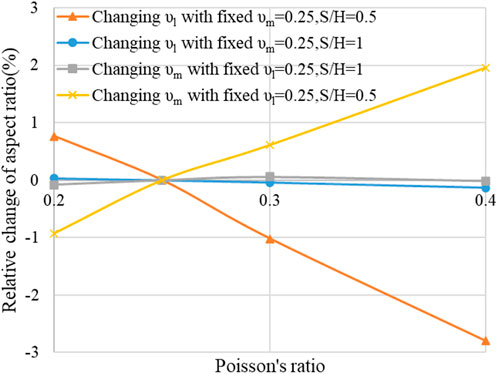
FIGURE 19. Correlations of relative change of aspect ratio and Poisson’s ratio in confined fracture model (Em=El=5 MPsi, εxx (ave)=0.002, Tl=H=0.2m, Tm=0.3 m).
Taking the Eagle Ford Shale in Dewitt County as an example, the ratio of Young’s modulus ranges from 1.0 to 2.2 and from 1.0 to 1.7 in the Upper and Lower Eagle Ford, respectively. The corresponding relative change of aspect ratio can reach up to 14% when S/H equals 0.5.
Correlations of the relative change of aspect ratio and Poisson’s ratio in the confined fracture model are shown in Figure 19. Taking the Eagle Ford Shale in La Salle County as an example, the Poisson’s ratio ranges from 0.20 to 0.32 and from 0.18 to 0.30 in the Upper and Lower Eagle Ford respectively. The corresponding relative change of aspect ratio is less than 1%, indicating the effect of Poisson’s ratio on aspect ratio is negligible.
The elastic properties of the marl and limestone layers in the Eagle Ford Shale were analyzed in this study. Additionally, the effect of elastic properties on aspect ratio of unconfined and confined fractures were evaluated. The following conclusions can be drawn:
(1) Shear velocity has a positive linear relationship with compressional velocity in the Eagle Ford and adjacent formations. Two relationships including Vs = 0.498 Vp + 250.85 and Vs = 0.518 Vp + 240.56 were developed for two wells with R2 value of 0.96. Correlations of shear velocity and compressional velocity in marl and interbedded limestone layers of Eagle Ford Formation were obtained.
(2) There are power law or negative linear relationships between compressional velocity, shear velocity, dynamic Young’s modulus and gamma ray intensity in the Eagle Ford well in Dewitt County and La Salle County. No correlation between Poisson’s ratio and gamma ray or clay content exists.
(3) Comparison of elastic properties shows that there are more variations in dynamic Young’s modulus, less variations in compressional and shear velocities and no obvious difference in dynamic Poisson’s ratio.
(4) The effect of Young’s modulus ratio on the aspect ratio of confined fractures is remarkable when the ratio of fracture spacing to layer thickness is low, while the influence of elastic properties contrast of shale layers on the aspect ratio of the unconfined fracture can be negligible in the Eagle Ford wells in Dewitt County and La Salle County.
The original contributions presented in the study are included in the article/supplementary material, further inquiries can be directed to the corresponding author.
SJ: investigation, data analysis, writing—original draft, MM: methodology, supervision, JS: software, validation.
The authors declare that the research was conducted in the absence of any commercial or financial relationships that could be construed as a potential conflict of interest.
All claims expressed in this article are solely those of the authors and do not necessarily represent those of their affiliated organizations, or those of the publisher, the editors and the reviewers. Any product that may be evaluated in this article, or claim that may be made by its manufacturer, is not guaranteed or endorsed by the publisher.
Altowairqi, Y., Rezaee, R., Evans, B., and Urosevic, M. (2015). Shale elastic property relationships as a function of total organic carbon content using synthetic samples. J. Petroleum Sci. Eng. 133, 392–400. doi:10.1016/j.petrol.2015.06.028
Breyer, J. A., Denne, R. A., Kosanke, T., and Spaw, J. M. (2016)., 110. Texas, U.S.A, 369–389.Facies, fractures, pressure, and production in the Eagle Ford shale (cretaceous) between the san Marcos arch and the maverick basin. AAPG Mem.
Castagna, J. P., Batzle, M. L., and Eastwood, R. L. (1985). Relationships between compressional-wave and shear-wave velocities in clastic silicate rocks. Geophysics 50 (4), 571–581. doi:10.1190/1.1441933
Castagna, J. P., Batzle, M. L., and Kan, T. K. (1993). Rock physics – the link between rock properties and AVO response. Investigations Geophys. 8, 135–171.
Donovan, A. D., Gardner, R. D., and Pramudito, A. (2015). Chronostratigraphic relationships of the woodbine and Eagle Ford groups across Texas. Gulf Coast Assoc. Geol. Soc. Trans. 4, 67–87.
Greenberg, M. L., and Castagna, J. P. (1992). Shear-wave velocity estimation in porous rocks: Theoretical formulation, preliminary verification and applications. Geophys. Prospect. 40 (2), 195–209. doi:10.1111/j.1365-2478.1992.tb00371.x
Han, D., Nur, A., and Morgan, D. (1986). Effects of porosity and clay content on wave velocities in sandstones. Geophysics 51 (11), 2093–2107. doi:10.1190/1.1442062
Hossain, Z., Mukerji, T., and Fabricius, I. L. (2012). Vp-Vs relationship and amplitude variation with offset modelling of glauconitic greensand. Geophys. Prospect. 60, 117–137. doi:10.1111/j.1365-2478.2011.00968.x
Hsu, S., and Nelson, P. (2002). Characterization of Eagle Ford shale. Eng. Geol. 67 (1–2), 169–183. doi:10.1016/s0013-7952(02)00151-5
Jiang, S., and Mokhtari, M. (2019). Characterization of marl and interbedded limestone layers in the Eagle Ford Formation, DeWitt county, Texas. J. Petroleum Sci. Eng. 172, 502–510. doi:10.1016/j.petrol.2018.09.094
Kiipli, T., Soesoo, A., Kallaste, T., and Kiipli, E. (2008). Geochemistry of telichian (silurian) K-bentonites in Estonia and Latvia. J. Volcanol. Geotherm. Res. 171 (1), 45–58. doi:10.1016/j.jvolgeores.2007.11.005
Kim, J. (2021). New geomechanical application utilizing MWD gamma ray logs: An Eagle Ford case study. J. Petroleum Sci. Eng. 196, 108043–108113. doi:10.1016/j.petrol.2020.108043
Mokhtari, M., Honarpour, M. M., Tutuncu, A. N., and Boitnott, G. N. (2016). Characterization of elastic anisotropy in Eagle Ford shale: Impact of heterogeneity and measurement scale. SPE Reserv. Eval. Eng. 19 (3), 429–439. doi:10.2118/170707-PA
Pickett, G. R. (1963). Acoustic character logs and their applications in formation evaluation. J. Petroleum Technol. 15 (6), 659–667. doi:10.2118/452-PA
Rafavich, E., Kendall, C. H., and Todd, T. P. (1984). The relationship between acoustic properties and the petrographic character of carbonate rocks. Explor. Geophys. 15 (3), 193. doi:10.1071/eg984193
Vernik, L., Fisher, D., and Bahret, S. (2002). Estimation of net-to-gross from P and S impedance in deepwater turbidites. Lead. Edge 21 (4), 380–387. doi:10.1190/1.1471602
Xu, S., and White, R. E. (1995). A new velocity model for clay-sand mixtures. Geophys. Prospect. 43 (1), 91–118. doi:10.1111/j.1365-2478.1995.tb00126.x
Xu, S., and White, R. E. (1996). A physical model for shear-wave velocity prediction. Geophys. Prospect. 44 (4), 687–717. doi:10.1111/j.1365-2478.1996.tb00170.x
Yang, S., Wu, K., Xu, J., Li, J., and Chen, Z. (2019). Roles of multicomponent adsorption and geomechanics in the development of an Eagle Ford shale condensate reservoir. Fuel 242, 710–718. doi:10.1016/j.fuel.2019.01.016
Keywords: elastic properties, marl layer, limestone layer, eagle ford shale, aspect ratio, fracture
Citation: Jiang S, Mokhtari M and Song J (2023) Comparative study of elastic properties of marl and limestone layers in the Eagle Ford formation. Front. Earth Sci. 10:1075151. doi: 10.3389/feart.2022.1075151
Received: 20 October 2022; Accepted: 11 November 2022;
Published: 10 January 2023.
Edited by:
Qiaomu Qi, Chengdu University of Technology, ChinaReviewed by:
Peng Zhu, Chengdu University of Technology, ChinaCopyright © 2023 Jiang, Mokhtari and Song. This is an open-access article distributed under the terms of the Creative Commons Attribution License (CC BY). The use, distribution or reproduction in other forums is permitted, provided the original author(s) and the copyright owner(s) are credited and that the original publication in this journal is cited, in accordance with accepted academic practice. No use, distribution or reproduction is permitted which does not comply with these terms.
*Correspondence: Mehdi Mokhtari, bXhtNDQ4N0Bsb3Vpc2lhbmEuZWR1
Disclaimer: All claims expressed in this article are solely those of the authors and do not necessarily represent those of their affiliated organizations, or those of the publisher, the editors and the reviewers. Any product that may be evaluated in this article or claim that may be made by its manufacturer is not guaranteed or endorsed by the publisher.
Research integrity at Frontiers
Learn more about the work of our research integrity team to safeguard the quality of each article we publish.