 Hu Tao
 Shao-Wei Lei
- School of Civil Engineering, Lanzhou Jiaotong University, Lanzhou, China
Rainfall is the main influencing factor causing slope erosion, landslide, and instability in loess; thus, it is vital to comprehend the process of rainfall erosion on various slope surfaces and water penetration inside the slope. In this paper, the loess sample is from Heifangtai in Gansu Province, and triaxial shear tests were conducted on loess with roots under varying water contents to evaluate the slope-reinforcing impact of roots. The slope surface erosion process was analyzed using a soil moisture sensor and matric suction meter to monitor the variation of matric suction in the middle slope and slope foot in response to varying precipitation levels. The numerical simulation approach is utilized to analyze the fluctuation of slope stability under the effect of varying rainfall intensities and humid heat, and the analytical solution of the safety factor is compared to the model solution. The results indicate that the shortest generation time for bare slope runoff is 6 min, whereas the greatest generation time for the Bermuda grass slope is 12 min; the shorter the period, the less water penetration and the simpler it is to reach the slope erosion stage. The slope’s rise increases runoff velocity, strengthening water resistance on the slope surface. When the test slope is 30°, the maximum mass of scouring sediment on the bare slope is 15.2 g from 24 to 36 min, compared to 14.7 g from 24 to 36 min when the test slope is 60°. The amount of scouring reduces as the slope increases. The slope safety factor declined from 3.51 to 2.84 after 24 h of heavy rain, and the loss rate accelerated as the rainfall intensity increased.
1 Introduction
The dichotomy between infrastructure construction and environmental conservation has become more pronounced with China’s development. Simultaneously, the original structure of soil mass and original vegetation have been lost, resulting in a significant number of exposed soil slopes and rock slopes that cause serious water and soil loss and environmental imbalance (Huang et al., 2018; Xin and Lin, 2020; Xie et al., 2021; Li et al., 2022). Traditional slope protection can effectively reduce the instability and erosion of the slope surface. However, the protective effect will be significantly weakened as the strength of the material structure decreases (Yu-Liang et al., 2020; Liu and Han, 2021; Zhang et al., 2022a). Traditional slope protection offers numerous advantages over vegetation protection technologies. Widespread use of environmental protection technologies can lessen the environmental effect of highway building (Bai et al., 2017; Yanguang and Xiaoxia, 2018; De Yong et al., 2020; Fu et al., 2020) and improve the ecological environment (Yi, 2012; Saifuddin and Normaniza, 2016; Yan et al., 2021). The soil structure is loose and broken in loess regions, and water loss is significant. In the loess region, it is vital to restore the natural environment, avoid landslides and debris flows, and regulate soil erosion.
Rainfall infiltration is an essential factor in inducing landslides (Dwivedi and Shrivastava, 2019; Huang F. et al., 2022; Zhang et al., 2022b; Lee et al., 2022; Yang et al., 2022). Up to 90% of slope instability can be attributed to landslides, water, and soil loss caused directly or indirectly by natural rains. The environment strongly influences the occurrence of landslides, and the likelihood of their occurrence may be predicted by selecting representative samples and models (Huang et al., 2020a; Huang et al., 2020b; Huang Fao. et al., 2022; Chang et al., 2022; Liu et al., 2022). During rainfall, slope vegetation can reduce slope runoff, with the reduction increasing with the extent of the plant covering (Baofu et al., 2016; Zhang M. et al., 2020). Planting can reduce the pore water pressure to improve the shear strength of soil and reduce the permeability of soil (Indraratna et al., 2006; Ng et al., 2013; Kokutse et al., 2016; Temgoua et al., 2016); which can improve the stability of the ecological slope and prevent shallow landslide (Xu et al., 2015; Wang, 2019). It is demonstrated that the roots can improve soil shear resistance (Schwarz et al., 2010; Naghdi et al., 2013; Kokutse et al., 2016), and the water content of the soil with roots and length density of roots can be utilized as indications of slope stability. (Osman and Barakbah, 2006; Lou et al., 2020). Wang et al. (2020) conducted comparative experiments on the impacts of herbaceous plants on slope protection and slope stability analyses in 2020. Likitlersuang et al. (2014) found that the root system helps to reduce rainwater infiltration, retard the rise of the water table and increase the shear strength of the soil. In terms of the scouring test, the area of the local scouring area is dependent on scour hole size, topography, hydraulic parameters, scouring procedure, etc. (Sui et al., 2006; Farhoudi and Shayan, 2014; Petersen et al., 2015; Lin and Jiang, 2019; Xiao et al., 2021), and scour evolution can be estimated with empirical methods (Wei et al., 2018).
In conclusion, much research has been undertaken on scouring tests in embankment, revetment, and bridge, with a primary emphasis on observing and predicting hydraulic parameters, scour depth, and so on. (Zhang S. et al., 2020; Orr et al., 2020; Wienberg et al., 2020; Wang et al., 2021). Few scholars, in contrast, conduct experimental research on the evolution law of vegetation slope scour features and combine experimental with numerical simulation to determine the stability of the ecological slope. In terms of experimental research, due to the regional specificity of loess (Inal and Yiitolu, 2012), the selection of plant species needs to correspond to local conditions. Few reports on the vegetation slope protection test in Heifangtai (Qiang et al., 2016; Li et al., 2021). The numerous factors affecting the erosion and stability of ecological slopes can be analyzed using comparative field surveys and outdoor experiments.
In this study, the erosion quantity and slope erosion of an ecological slope with diverse plants under rainy circumstances are evaluated by combining experiment and numerical simulation. Monitoring the slope volume moisture content and matric suction with sensors yields the changing slope erosion sediment and matric suction law. The numerical simulation parameters are derived from the triaxial shear test results, which are more accurate than the empirical formula calculation; also, the indoor test may produce favorable scouring circumstances and enhance the test’s practicability and dependability. Moreover, PLAXIS 3D and geo studio 2012 are used to simulate the change of slope safety factor during rainfall infiltration. The slope’s analytical solution expression is developed and compared to the model solution in order to validate the accuracy of the numerical simulation results.
2 Study area and materials
The research area is located in the northwest interior with a dry environment and little annual precipitation. Recent years have had an average temperature of 9.9°C, with the lowest temperature reaching -18.2°C and the highest temperature reaching 36.8°C (Zhang and Wang, 2017). The average precipitation is 287.6 mm, from 178.8 to 431.9 mm. Time distribution is irregular, and the average annual evaporation is 1593.4 mm. Since precipitation is significantly less than evaporation, it is difficult for rainwater to permeate the ground and generate groundwater. Hence the natural moisture content of Heifangtai loess is often below 10%. The primary sources of groundwater in Heifangtai are irrigation water and rainfall infiltration. (Xu et al., 2012; Rqz et al., 2016; Xing et al., 2017).
The groundwater level has risen dramatically since the penetration of irrigation water and rains, which recharges the groundwater. Due to the high water sensitivity and structure of loess, an increase in water content would soften the soil, reducing its mechanical strength, destroying the particle structure of the soil skeleton, dissolving soluble salts, and diminishing the cementation degree. Under gravity and precipitation, the soil layer of the landslide mass continually creates tension cracks and subsidence zones at the rear border of the slope, and irrigation water penetration is further intensified, laying concealed hazards for the landslide’s occurrence. A map of the geographical location of the study area is shown in Figure 1. The test soil is derived from naturally deposited loess in Heifangtai, which is Q3 Malan loess. The loess has a natural moisture content of 3.2%, a dry density of 1.29 g/cm3, a relative particle density of 2.63, a plastic limit of 17.8%, and a liquid limit of 23.7%. According to the classification of foundation soil in the Code for Design of Building Foundation (GB50007-2011), the loess is silt. According to the screening technique, the mass of soil particles smaller than 0.005 mm represents 16% of the entire mass, 0.005–0.05 mm represents 60% of the total mass, and greater than 0.05 mm represents 24% of the whole material.
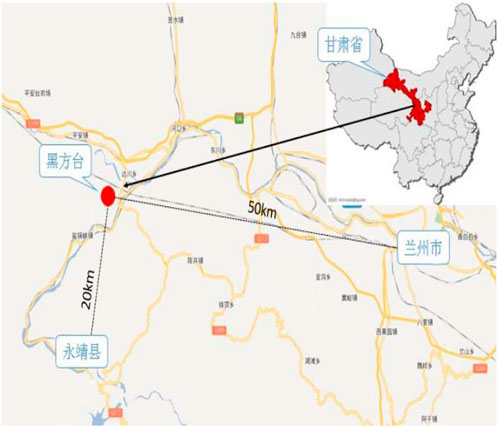
FIGURE 1. Location map of the study area.
3 Methodology
During this research, experiments and numerical simulations were adopted(Abedi-Koupai et al., 2020; Vishweshwaran and Sujatha, 2021; Voinov et al., 2021), triaxial shear tests were conducted under varying water contents and root contents of soil containing roots, as well as testing on the anti-scour capability of slopes under varying slope protection vegetations. The soil moisture sensor and matric suction meter were used to monitor the change of matric suction in the middle slope and slope foot under varying rainfall intensities in order to analyze the slope surface erosion at varying rainfall timings (Zhang Y. et al., 2020; Likitlersuang et al., 2020; Wang et al., 2021). In terms of numerical simulation, the PLAXIS 3D is used to model the water infiltration law of slope and the change of slope stability under the influence of vegetation, and the analytical solution and numerical simulation solution are derived for comparison.
3.1 Triaxial shear test
The test soil is collected from the loess that has accumulated naturally at the base of the Heifangtai slope. According to the geological survey, the loess is the Q3 Malan loess. The loess has a natural moisture content of 3.2%, and its original volumetric moisture content was 3.7%. The dry density of the soil mass is 1.29 g/cm3, and the relative density of the particles is 2.63. The plastic and liquid limits of the soil mass are 17.8% and 23.7%.
The distribution of particles is 14.1% for the size less than 0.005 mm, 77.8% for particles with sizes 0.005–0.075 mm, and 8.1% for particles with sizes greater than 0.075 mm. According to the classification of foundation soil in the Code for Design of Building Foundation (GB50007-2011), the loess is silty soil. After being crushed, sieved, and dried in the natural air, the soil is formed into test samples with varied moisture contents ranging from 8% to 18% along a 2% gradient and four triaxial samples with the same moisture content. As shown in Figure 2A,B, triaxial tests are conducted on the samples under confining pressures of 50 kPa, 75 kPa, 100 kPa, and 125 kPa. Since the pace of soil consolidation under natural circumstances is sluggish, the unconsolidated and undrained condition is used to shear the sample at a rate of 0.8 mm/min. By charting the strength envelope of the Mohr Circle, soil cohesion (c/α) and the internal friction angle(φ) can be determined.
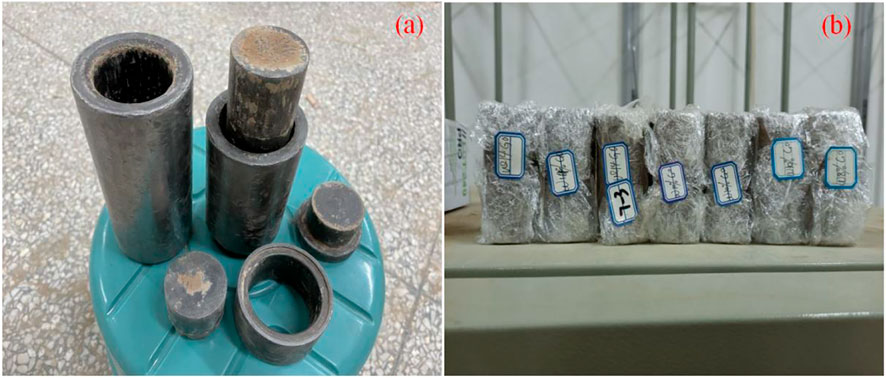
FIGURE 2. (A) Triaxial sample preparation devcie (B) triaxial sample.
3.2 Slope scouring test
3.2.1 Early slope maintenance
As shown in Figure 3A,B, the slope size is 145 cm×95 cm×15 cm, and the size of each test area is 60 cm×30 cm×15 cm. The slope is adjustable through the side bracket. The slope is built up layer by layer, considering regional plant-growing circumstances. The sand gravel layer with a thickness of 2 cm is the lowest layer, followed by the fine sand layer with a thickness of 1 cm, and then the soil layer. A sufficient amount of fine sand is applied to the topsoil layer to increase the soil’s water retention. The basic parameters of soil are obtained through the triaxial test and physical and mechanical test; then, the soil is evenly spread on the slope model and uniformly compacted to ensure compactness. A specific foam board separates each planting area on the slope, and a specified number of holes are provided for soil moisture sensors to assess the water content at various slope positions. Bonding the foam board to the contact surface of the slope using neutral glass glue ensures that the side and bottom of the slope remain impermeable, directing all runoff to the slope surface. Manila grass, Bermuda grass, and Evergreen were planted from left to right on the experimental slope. The instrument for watering and healing is a tiny sprinkler. Before plant germination, a plastic film with the high-light transmission was applied to the slope’s surface. When the plants reached a height of over 3 cm, the plastic sheet was removed until the growth exceeded the requirements of the test.
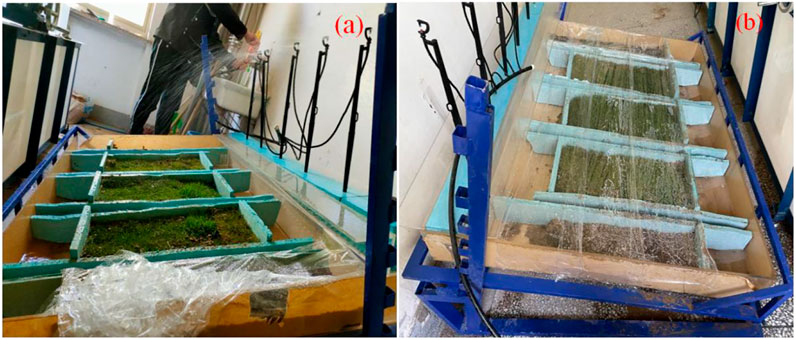
FIGURE 3. (A) Manually watering lope (B) Preliminary maintenance of slope.
3.2.2 Scour test model
The growth of plants is shown in Figure 4A. Under different rainfall intensities, the erosion resistance tests of vegetation slopes and bare slopes are carried out respectively, and the rainfall, runoff, rainfall duration, water flow and sediment amount are measured and recorded; as shown in Figure 4B, the erosion process is also described through recording site phenomena and photos.
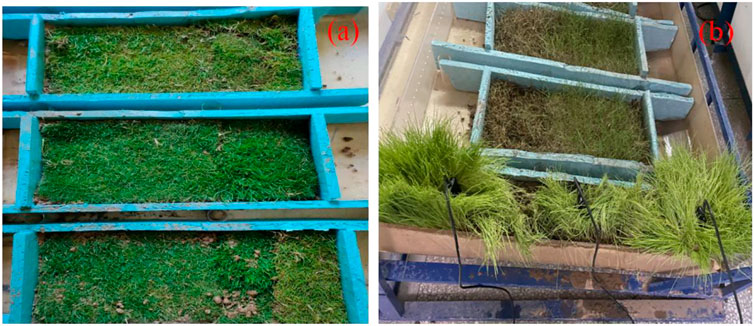
FIGURE 4. (A) Initial growth of slope (B) Layout of slope sensors.
3.2.3 Rainfall devices and materials
The rainfall simulation devices mainly include spray, nozzle, needle, and suspension. The nozzle-type rainfall device is used in this experiment, as shown in Figure 5A below. The number of rainfall sprinklers is twelve, and their horizontal and vertical spacing is 26 cm and 37 cm, respectively. Before replicating the rainfall test, the on-site rainfall test must be conducted to check that the nine sprinklers can produce rainfall simultaneously and cover the whole test area. The rainfall simulation system comprises mainly a hand-operated water pressure pump, a tap water pipe, a sprinkler, a water tank, a runoff collection bottle, etc. Furthermore, a soil humidity sensor, an industrial USB-to-RS485 conversion device, a mobile phone, a stopwatch, a scale, a shovel, plastic film, an electronic scale, and a thermometer are required, as well as the appropriate interior physical and mechanical test equipment. The slope settings are shown in Figure 5B–D
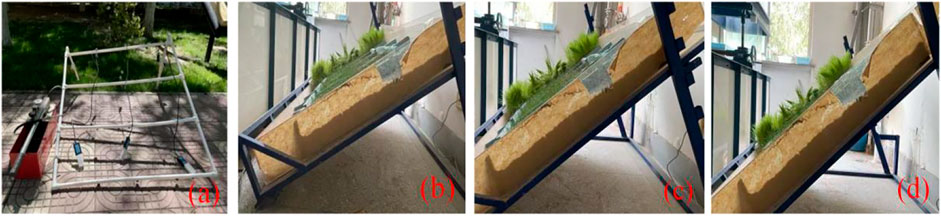
FIGURE 5. (A) Rainfall device (B) 30° slope (C) 45° slope (D) 60° slope.
3.2.4 Test procedure
1) The simulation test device shall be placed, and the slope surface arranged according to the test design scheme. Considering that the solidification effect will increase with time, the arranged slope surface will be placed for 3 days first, and then the scouring test shall be carried out to ensure the testing effect.
2) At the same height as the slope’s lower side and the slope’s surface, a lower opening is designed to make the rainwater flow into the runoff collection bottle. The rainfall device is parallelly set to the slope test model; The runoff collection bottle is placed at the bottom of the slope to ensure the accuracy of rainwater collection. The liquid level is recorded using the manual booster pump before the rainfall starts.
3) Adjust the manual pressure pump and prepare the experiment.
4) Start the flushing test, shake the handle of the booster pump at a constant speed, keep the sprinkler head rainfall uniform, and record the liquid level of the booster pump at the end of each rainfall.
5) The rainfall time under each working condition is approximately the same, different rainfall intensities are used for the test, and the water quality in the runoff collection bottle is collected every 15 min.
6) Wait for the soil in the collected rainwater to settle, pour out the upper clean water and put the remaining mixture into the oven to dry and weigh.
3.2.5 Hydrological parameters of rainfall test
During the rainfall simulation test, six rain gauges were randomly placed around and in the centre of the slope as the measuring points to calculate the uniformity of rainfall on the simulated slope. Before the simulated rainfall test, the pre-rainfall test was carried out, and the corresponding rainfall uniformity coefficient was calculated to be 0.945, which meets the requirement of rainfall uniformity coefficient K ≥ 0.8 for the field rainfall simulation test. By adjusting the rainfall intensity of the sprinkler, the sprayed rainwater can evenly cover each slope surface, and the actually measured rainfall intensity is 3.6 mm/(min * m2).
3.3 Determination of soil moisture content and slope erosion
As illustrated in Figure 6A,B, the water content monitoring device is a soil moisture sensor, and the matric suction monitoring device is a vacuum gauge tensiometer instrument that can measure the soil matric suction (b). In this test, 485 high-precision soil moisture monitor is used to measure the real-time change of the volume water content of the slope, with a range of 0%–100% and an accuracy of ±0.5%–1%. The monitoring meter is buried 8 cm deep at the top, bottom, and center of the slope. The tensiometer is filled with water and lets to stand overnight prior to measurement. Several sets of data are collected for verification purposes, then recorded after the sensor measurement criteria have been satisfied. As the change in substrate suction lags after the change in rainfall, stable values of substrate suction are measured after rainfall as experimental data to minimize experimental errors. The data acquisition card records and collects the test data.
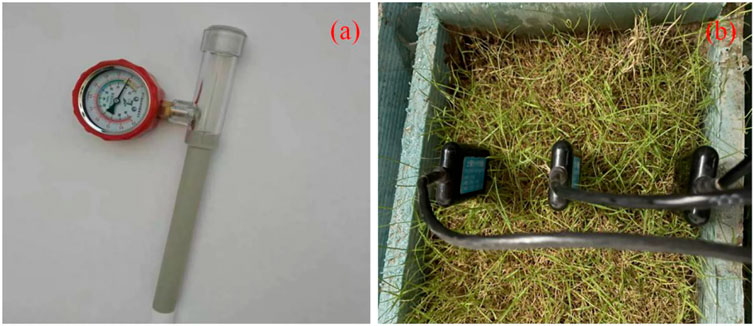
FIGURE 6. (A) vacuum gauge tensiometer (B) layout of moisture sensor.
3.4 Numerical simulation
3.4.1 Basic theory of software hygrothermal coupling
1) Water balance
The water balance of the loess slope can be expressed as:
Where:
Vegetation interception can be estimated by the empirical formula. The empirical model can predict the runoff on the slope, and the calculation formula is:
Where
2) Water evapotranspiration
The evapotranspiration includes the actual evapotranspiration of soil mass and the actual evapotranspiration of vegetation. When there is the vegetation on the slope, the influence of vegetation on soil mass water evaporation should be considered. Vegetation transpiration accounts for a large proportion of the total water evaporation, which is characterised by dynamic changes. The actual slope evaporation is calculated as follows:
Where:
The actual transpiration of vegetation is related to root characteristics and the root water limit function of plants. The calculation formula is:
Where:
Where
The water absorption of the root is usually considered by adding a sink term to the unsaturated soil pore water transport equation (Hopmans and Bristow, 2002; Raats, 2007; Maayar et al., 2009), as follows:
Where
Where
3) Hygrothermal coupling
Under the atmospheric environment, the moisture change of soil slope is mainly affected by rainfall and evaporation. Water transfer includes the seepage of liquid water and the diffusion of gaseous water, a typical coupled process of moisture and heat. This paper adopts geo studio 2012 VADOSE/W and SLOPE/W module coupling analysis.
The temperature of the soil surface can be estimated by Wilson formula:
Where,
Soil heat flux is calculated as follows:
Where
The radiation method is adopted to estimate potential evapotranspiration. The commonly used Hargreaves method is the 1985 Hargreaves formula as follows:
Where the unit of PE is mm/d;
The thermal conductivity of unsaturated soil is calculated as follows:
Where
4) Analytical solution of safety factor for slope under rainfall
Combined with Fredlund’s shear strength theory of unsaturated soil mass summarised, the effective shear strength index corrected by single point area stress is used to express the shear strength index of soil mass with root. The analytical solution of the safety factor is as follows:
Where
3.4.2 Soil parameters and boundary conditions
1) Soil parameters
This paper adopts the non-isothermal flow equation coupled with heat and moisture, and transpiration and evaporation boundary conditions are set. At the same time, PLAXIS 3D and geo studio 2012 are used to simulate the loess slope, and the stratum is divided into three layers, namely, RA soil with roots, RAA soil without roots affected by roots, and SS soil not affected by roots. The soil parameter are determined by the test results; as shown in Figure 7A and Figure 7B, the root layer of vegetation is considered as an independent layer of surface homogeneous composite soil.
2) Hydraulic characteristics of soil mass
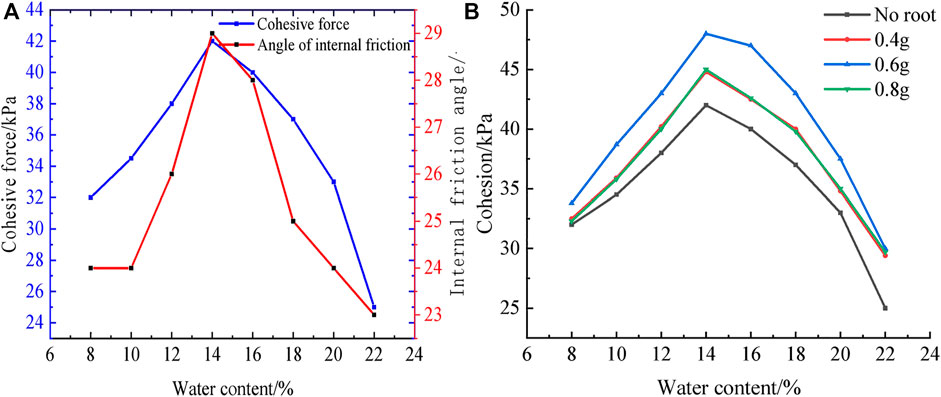
FIGURE 7. (A) Values of soil parameters under different water contents (B) Values of soil parameters under different root content change.
Compared with the soil area without roots, the soil area with roots maintains the matric suction for a long time, and the required volumetric water content under the same matric suction is small. As shown in Figure 8A,B, the saturated permeability coefficient of soil mass in the RA soil with roots area is 0.875 mmh−1, and the desaturated permeability coefficient is 1.5 m−1. For soil mass in the RAA soil without roots affected by roots area, the saturated permeability coefficient is 1.235 mm·h−1, and the desaturated permeability coefficient is 1.6 m−1. The saturated permeability coefficient of soil mass in the SS soil not affected by roots area is 1.595 mm·h−1, and the desaturated permeability coefficient is 1.7 m−1.
3) Boundary conditions
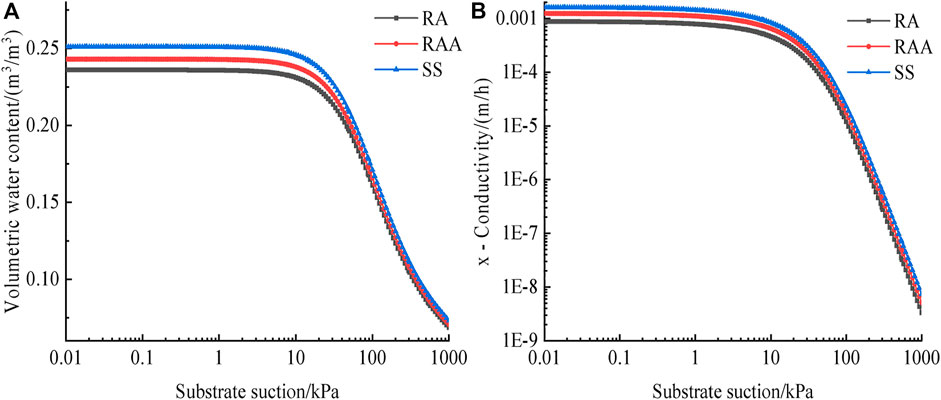
FIGURE 8. (A) Relationship between volumetric water content and matric suction. (B) Relationship between X-conductivity and matric suction.
Considering the maximum rainfall interception rate of plant stems and leaves is generally 4.58%–5.61% (Link et al., 2004), the maximum rate is determined as 5.61% in the model. The groundwater head height of the model is set as 3 m, the side and bottom are impermeable boundaries, and the slope surface is the rainfall boundary. The rainfall intensity is respectively designed as light, moderate, and heavy rain according to the national 24-hour rainfall classification standard, and the rainfall lasts for 24 h. As the slope soil layer distribution shows in Figure 9A, the slope height is 10 m, the slope is 45°, and the model length in x direction, y direction and z direction is 25, 8, and 17 m. The sloping grid is divided into 20589 units and 34859 nodes, as shown in Figure 9B.
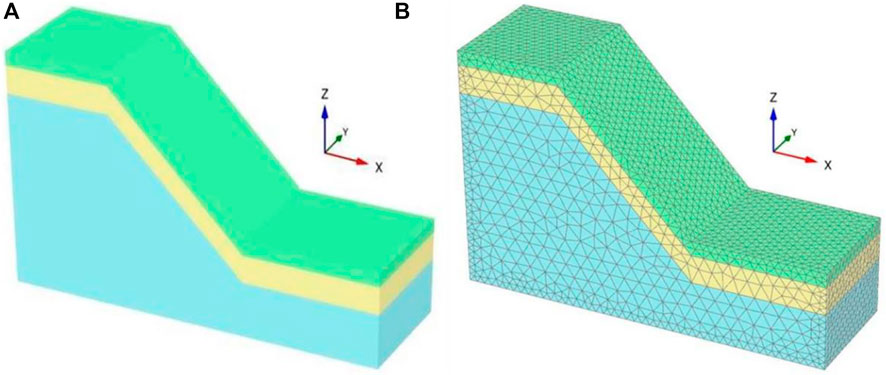
FIGURE 9. (A) soil stratification of slope model (B) grid division of slope model.
The type of the slope soil mass is sandy loam, and it can be divided into three layers; the surface layer is the soil mass with roots in the RA area, with a thickness of 1 m; The second layer is the soil mass in the RAA area without root system, but is affected by the root system, with a thickness of 2 m; The third layer is the soil mass in SS area, which is the soil mass below the root affected area. The slope surface is set as the climate boundary, and the depth of plant action in the climate boundary is assumed to be 1 m. Setting the bottom boundary condition of the model as the constant temperature can make the temperature field inside the slope tend to dynamic equilibrium.
4 Results and discussion of test and numerical simulation
4.1 Triaxial shear test results
Adding a root system can/significantly minimize the strain-softening effect and concurrently increase soil shear strength metrics compared to the absence of a root system (Hallett, 2010; Pollen-Bankhead and Simon, 2010; Park et al., 2021; Su et al., 2021). The closer the sample is to the optimum moisture content, the more pronounced the root reinforcement effect is. Under varying water contents, the deviatoric stress change curve of the sample reveals that, under different strains, the sample achieves a peak value and subsequently decreases quickly to a given residual strength, exhibiting apparent strain-softening features. Comparing the change curves of the water content of 8% and 10%, as depicted in Figures 10A,B, it reveals that as the water content increases, the peak value of residual strength increases, and its occurrence is delayed. When the water content is 14%–17%, the strain-softening phenomenon is weakened, and the peak strength can be kept stable. During ecological slope protection, the soil moisture content should be close to optimal to realize the maximum root reinforcement (Kolodny and Joffe, 1939). Figure 10C demonstrates an ideal root system layout. Because it is difficult to adjust the angle of the root system, this test only analyzes soil stress and strain under horizontal, vertical, and mixed root distribution. The results indicate that the mixed root distribution may achieve the best performance; the mixed arrangement of roots demands the largest stress for the same strain and has the greatest resistance to deformation, followed by the vertical and horizontal root distributions. The sample strength with the root system is better than without the root system.
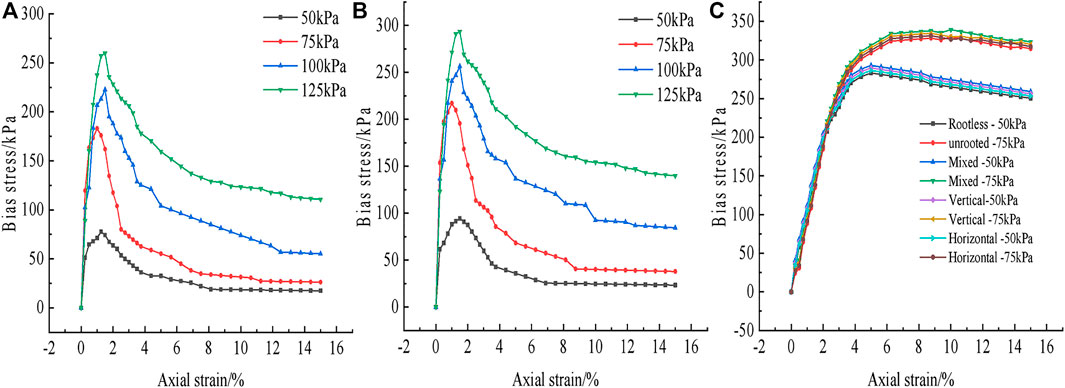
FIGURE 10. (A) Change curve of 8% rootless sample (B) Change curve of 10% rootless sample (C) Change curve of samples with different root distribution methods.
4.2 Scour test results
4.2.1 Effects of plant species and slope gradient on slope runoff
Slope runoff is a complicated change of precipitation water infiltration. The first runoff generation time reflects the link between soil water infiltration and slope runoff and is measured from the commencement of rainfall to runoff generation (Chen, 1997; Miyata et al., 2010; Loáiciga and Johnson, 2018; Mei et al., 2018). For bare slope, manila grass, Bermuda grass, and perennial grass, the runoff generation time is 6, 9, 12, and 10 min, respectively. The shorter the runoff production time, the lower the water infiltration, and the greater the slope’s susceptibility to runoff, leading to slope erosion. Taking the slope gradient of 30° as an example, the rank of runoff generation time is Bermuda grass>Evergreen>Manila grass. The experiment demonstrates that planting herbage at the onset of rainfall can provide sufficient time for rainfall infiltration to effectively prevent rain from splashing on the slope surface, thereby delaying the runoff generation time on the slope surface and inhibiting slope surface runoff and splash erosion. Adjusting the side slope and the support to perform scouring tests under varying slopes allows for measuring the runoff generation time under varying slopes.
4.2.2 Erosion of slope surface under different plant species and slopes
The change of soil mass on the vegetation slope surface is roughly similar during the rainfall scouring process. At the initial stage of 0–2 min, the surface soil mass maintains integrity, with no damage, or runoff. At 2–5 min, it forms a small water pit at the rainwater dripping place, and the integrity of the surface soil mass is still intact, and without rainwater runoff. At 6–7 min, the area of the water pit becomes larger, and the local rainwater collection area gradually appears, with multiple catchment pits on the slope surface. At 8–9 min the water pit area continues to increase. Here, the soil particles are blown off, a small area of local slope surface runoff begins, and the runoff rainwater becomes relatively turbid. Researchers have compared the situation of the gradient of 30°, 45°, and 60°, and found that the steeper the gradient, the shorter the runoff generation time. Besides, the earlier the rain appears turbid, the earlier the rain changes from turbid to clear as well.
4.2.3 Variation of slope scouring amount under different plant species and slopes
As shown in Figure 11A; Figure 11B, when runoff begins to occur on each slope, the rainwater is collected in the runoff collection bottle at an interval of 12 min. Thereafter, the rainwater in each period is left for 24 h, then the sediment is dried and weighed after pouring the upper clean water. Therefore, the sediment quality of each vegetation slope tends to increase with increasing slope. The scour test was performed at 30°, 45°, and 60°. Figure 12 shows the change in sediment quality of the slope under different plant species and gradients during different periods. Because of soil humidification, the moisture content of soil continues to increase. Within 24–36 min, the structure of soil particles became rapidly destroyed, and soil cohesion decreases. The water content of soil particles increased to saturation due to rainwater collection. With the slow loss of sediment on the slope, the sediment content in the water gradually decreased in the later period, and the water gradually changed from turbid to clear.
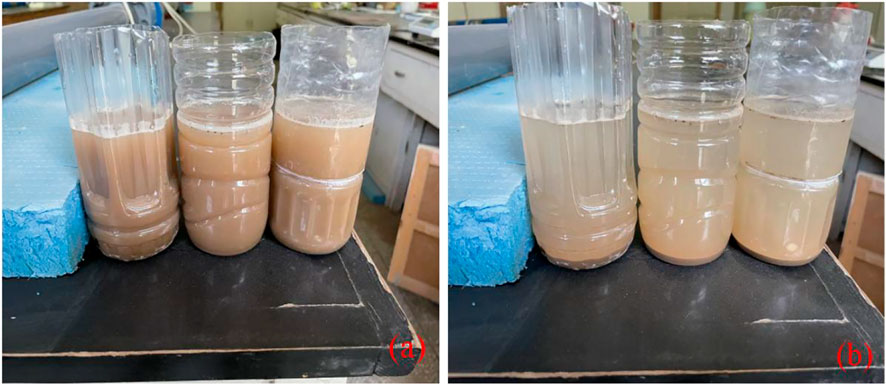
FIGURE 11. (A) Turbid runoff sampling (B) runoff sedimentation samples.
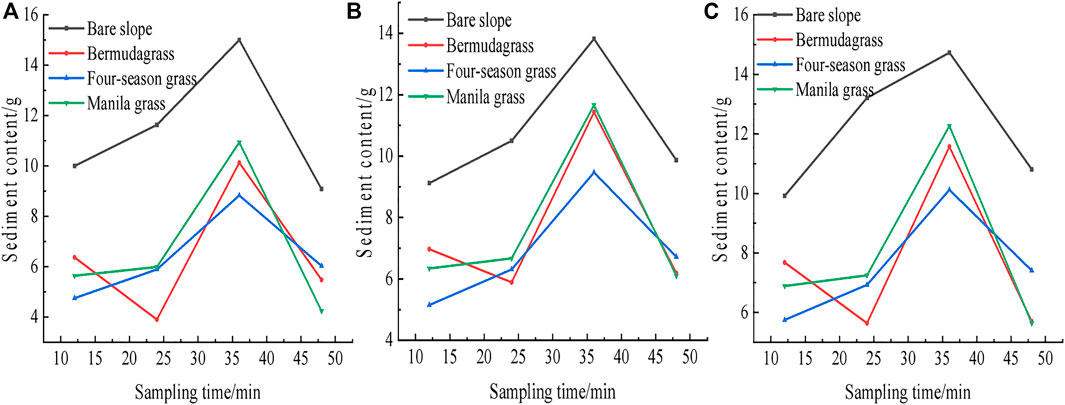
FIGURE 12. Sediment quality of slope surfaces with different vegetations (A) 30° (B) 45° (C) 60°.
4.2.4 Variation of cumulative scouring amount under different plant species and slopes
Within a certain slope range, the larger the slope, the stronger the rainfall scouring capacity, and the greater the cumulative scouring amount of the slope, i.e., the slope has a positive correlation with slope scouring (Figure 13). Notably, an increase in gradient increases the slope runoff velocity, destroying the original slope flow pattern. Besides, the formation of rhombic waves on the undulations of the slope interferes with rainwater scouring, hence strengthening the slope water resistance.
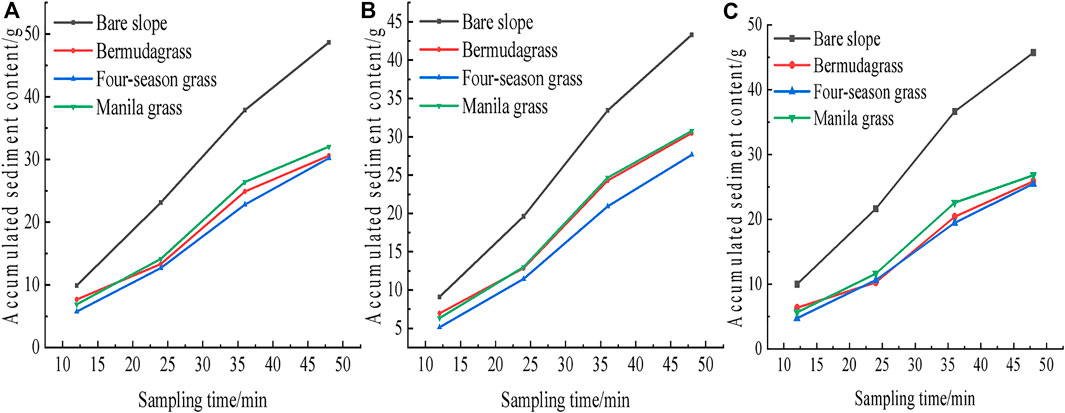
FIGURE 13. Variation of cumulative scour amount of different plants (A) 30° (B) 45° (C) 60°.
4.3 Determination results of soil moisture content and slope erosion
4.3.1 Analysis on change of soil matric suction
As illustrated in Figure 14, the changing trend of soil matric suction first reduces and then stabilizes under continuous rainfall. The reduction rate of matric suction is different under different rainfall intensities. As shown, in the first 5 h of rainfall, the soil matric suction does not significantly change under light, moderate, and heavy rain but rapidly decreases under heavy rain (Figure 14). Within 5–22 h after rainfall, the decrease of soil matric suction under heavy rain and rainstorm becomes faster than that under light rain and moderate rain. At 18–28 h, the soil matric suction decreases to the minimum value, with no apparent change afterward. In the test, the stable value of matric suction is the maximum in light rain, and the minimum in a rainstorm, indicating that the greater the rainfall intensity, the faster the rainfall infiltration rate is, and the more sufficient the rainfall infiltration.

FIGURE 14. (A) Change of soil matric suction at the slope top (B) Change of soil matric suction at the slope foot.
4.3.2 Analysis of slope erosion at different times
With the extension of rainfall time in Figure 15, the slope erosion damage gradually intensifies. In splash erosion, raindrops fall to the soil surface to slap and splash the surface soil, forming mud crusts on the soil surface and filling pores of the soil surface with soil particles. As a result, the permeability of the surface soil decreases, providing favorable conditions for slope runoff. With continuous rainfall, the moisture content of the surface soil gradually increases to a saturation state, runoff appears on the slope, and small runoff ditches are formed at weak places on the slope surface. Under continuous shear force, the runoff ditches are gradually connected to form erosion ditches, gradually expanding and deepening. With the deepening of the erosion ditch, the soil mass on both sides begins to collapse under the action of water force and small tension cracks; consequently, the slope soil mass appears to slide instability with the increase of the cracks.
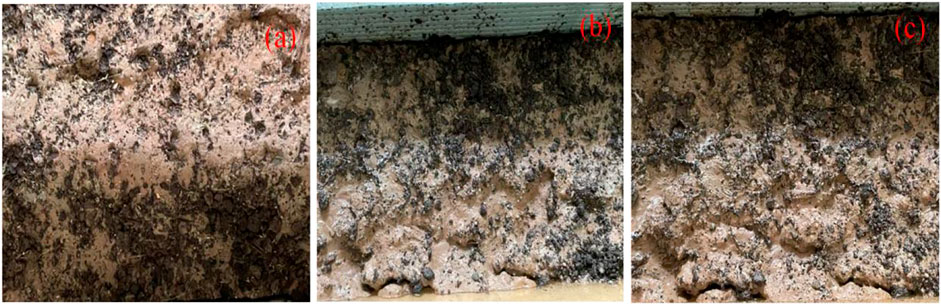
FIGURE 15. Slope erosion at different times (A) Soil erosion in splash erosion stage (B) Soil erosion in sheet erosion stage (C) Soil erosion in gully erosion stage.
4.4 Numerical simulation results
4.4.1 Seepage simulation analysis
In the process of rainfall infiltration, the moisture content of the soil profile becomes stratified, which can be generally divided into saturation area, transition area, conduction area, and wet area from top to bottom (Bodman and Colman, 1944). Under different rainfall intensities, the infiltration depth of the loess slope model presents the rule of maximum slope toe, large slope top platform, and minimum slope middle. With continuous rainfall, the wetting front gradually moves downward, and water content along the depth decreases nonlinearly, whereas that in the area close to the wetting front decreases rapidly. When rainfall time is similar, the greater the rainfall intensity, the deeper the infiltration depth. When rainfall intensity is less than the saturation permeability coefficient, the downward pushing depth of the wetting front is significantly affected by the rainfall intensity (Figure 16). The volumetric water content of the surface soil does not change after reaching a stable value but does not reach the saturated water content. Of note, the final volumetric water content of the surface soil depends on the rainfall intensity and the hydraulic parameters of the soil. For the same rainfall time after the critical point, an increase in rainfall intensity causes the moist front to move downward at a uniform speed, with a deeper depth, and faster speed.
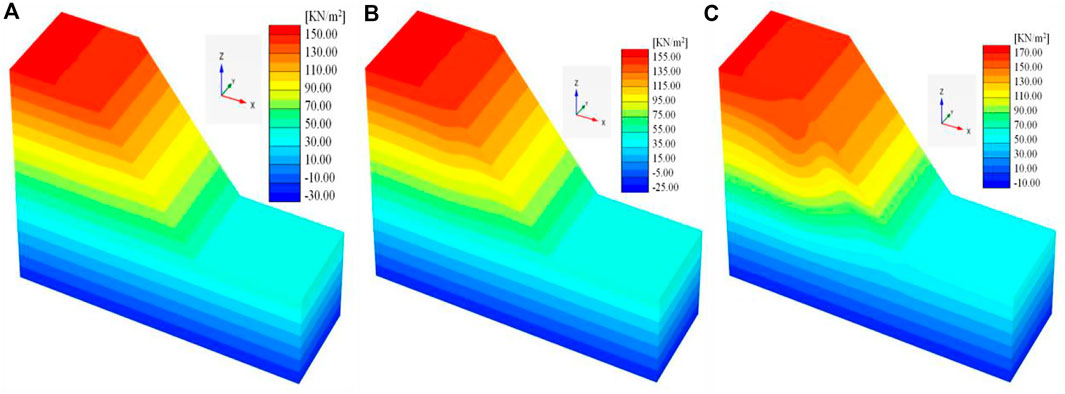
FIGURE 16. Cloud chart of pore water pressure (A) cloud chart of pore water pressure at initial stage, (B) cloud chart of 1 h pore water pressure, and (C) cloud chart of 4 h pore water pressure.
4.4.2 Numerical simulation of the slope stability factor
At the initial rainfall stage, there is no shear stress zone inside the slope. As time goes on, the increment of deviatoric strain first changes significantly at the foot of the slope, and discontinuous plastic areas appear in the slope, followed by areas with large strain at the top of the slope, as shown in Figure 17A; Figure 17B. As shown in Figure 17C, after 4 h of rainfall, a continuous stress deformation zone is formed in the slope’s middle, toe and top, soil cementation capacity is weakened, and the safety factor of the slope decreases. In the case of water inundation, the loess will disintegrate when exposed to water, wetting, softening and reducing its strength, at which point the slope will be damaged due to the collapsing nature of the soil. Under different rainfall intensities, the change of slope safety factor shows a rapid downward trend; it decreases to 2.84 under heavy rain within 24 h and to 3.35 and 3.18 under light rain and moderate rain, respectively. As shown in Figure 18, the gap of slope safety factor under different rainfall intensities increases with the extension of rainfall time, and the decline rate of safety factor increases with the rainfall intensity.
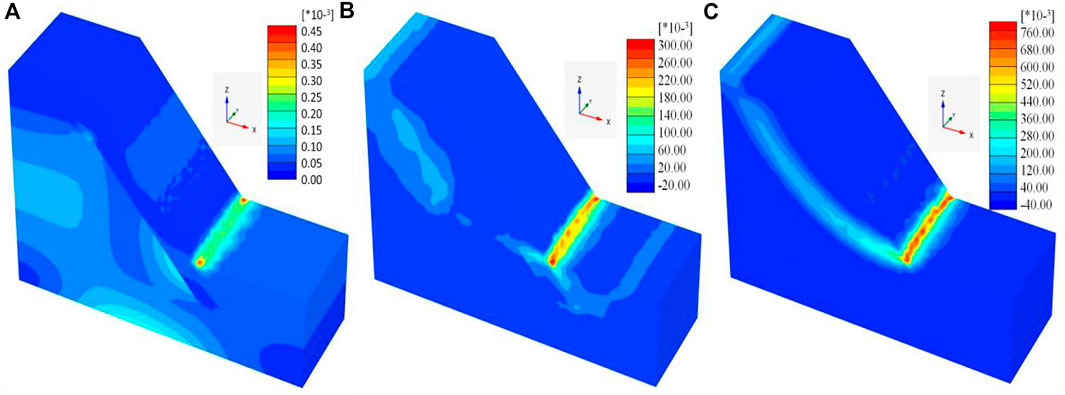
FIGURE 17. Cloud chart of slope shear strain (A) cloud chart of shear strain at initial stage, (B) cloud chart of 1 h shear strain, and (C) cloud chart of 4 h shear strain.
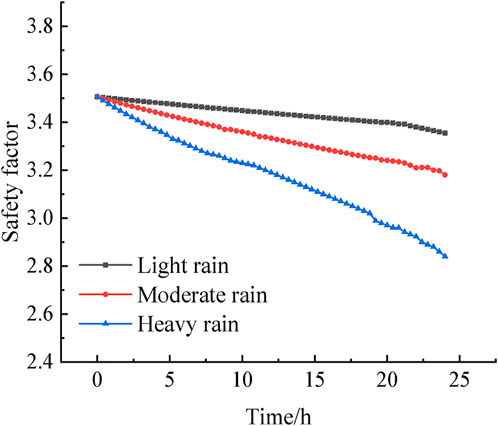
FIGURE 18. Variation of slope stability factor.
4.4.3 Analytical solution of slope stability factor
4.4.3.1 Parameter determination of analytical solution of slope safety factor
in RA, RAA and SS areas, the soil mass weight at different depths is 16.6 kN/m3, 16.9 kN/m3 and 17.2 kN/m3, respectively; The effective shear strength parameters of rooted soil and rootless soil are from laboratory triaxial tests. The rainfall intensity is light, moderate, and heavy, lasting for 24 h. The soil mass calculation parameters in each region are shown in Table 1.
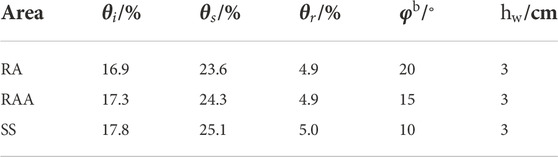
TABLE 1. Parameter values of analytical solution of slope.
4.4.3.2 Comparison of analytical solution and model solution of slope safety coefficient
Figure 19 shows that the model solution is larger under light rain than the analytical solution. With the increase of rainfall, their gap gradually decreases. The model solution is larger than the analytical solution at the initial stage of moderate rain, and the model solution is smaller than the analytical solution 15 h later. The analytical solution under heavy rain is always smaller than the model solution, their gap increases with the increase of rainfall, and the maximum difference between the analytical solution and the model solution is 0.06 under continuous heavy rain. The reason for this discrepancy is related to the values of the parameters of the model, and the accuracy can be improved by calculating the specific parameters at different moments in time and substituting them into the analytical solution.
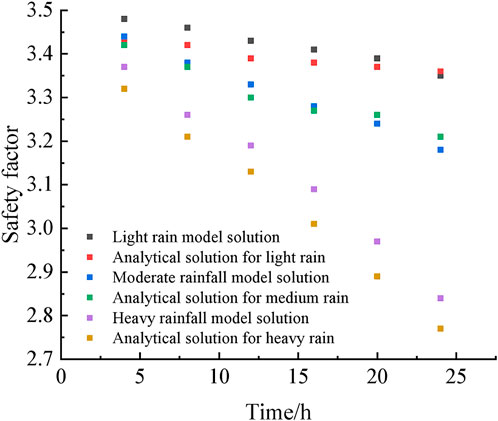
FIGURE 19. Comparison between analytical solution and model solution.
5 Conclusion
1) When the water content is low, the stress-strain curve of the sample shows obvious strain-softening characteristics. With the increase in the water content, the strain-softening phenomenon gradually weakens.
2) The steeper the slope is, the shorter the runoff generation time is, the earlier the rain appears turbidity, and the earlier the rain changes from turbidity to clarity. With the loss of sediment on the slope, the sediment content in the water gradually decreases in the later period, and the water body slowly changes from turbid to clear; In the test, the stability value of matric suction is the maximum in light rain and the minimum in heavy rain.
3) With the deepening of the erosion ditch, the soil mass on both sides begins to collapse under the action of water force and small tension cracks. With the increase of the cracks, the slope soil mass appears to be sliding instability.
4) Under different rainfall intensities, the safety factor of slope decreases with the rainfall, and the decreasing rate increases with the rainfall intensity (Link et al., 2004; Wang et al., 2020).
Data availability statement
The original contributions presented in the study are included in the article/supplementary material, further inquiries can be directed to the corresponding author.
Author contributions
HT, LG, and XS gave detailed guidance on the experimental programme and language revision of the article, while G-QY and M-MZ participated in the whole experiment.
Funding
This work was Supported by the National Natural Science Foundation of China (51969011); Gansu Provincial Education Department High School Research Project:2022CYZC-32;Gansu Provincial Science and Technology Department Project:21JR7RA301;Lanzhou Jiaotong University Youth Fund:2016018;Natural Science Foundation of Gansu Province:(20JR10RA239) Special Funds for Guiding Local Scientific and Technological Development by The Central Government(22ZY1QA005).
Conflict of interest
The authors declare that the research was conducted in the absence of any commercial or financial relationships that could be construed as a potential conflict of interest.
Publisher’s Note
All claims expressed in this article are solely those of the authors and do not necessarily represent those of their affiliated organizations, or those of the publisher, the editors and the reviewers. Any product that may be evaluated in this article, or claim that may be made by its manufacturer, is not guaranteed or endorsed by the publisher.
References
Abedi-Koupai, J., Ansari, S., Mostafazadeh-Fard, B., Shayannejad, M., and Mosaddeghi, M. R. (2020). Experimental study and numerical simulation of soil water and salt transport under dry drainage conditions. Environ. Earth Sci. 79, 89. doi:10.1007/s12665-020-8827-6
Bai, J. G., Wang, J. J., Zhang, Y. L., Wen, X. D., and Wen, N. (2017). Decision analysis of slope ecological restoration based on AHP. Sains Malays. 46 (11), 2075–2081. doi:10.17576/jsm-2017-4611-07
Baofu, L. I., Xiong, H., Lian, L., Sun, X., and Zhou, C. (2016). Nonlinear variation of runoff and its response to climate change in yihe river. Bull. Soil Water Conservation 2016 (04), 175–180. doi:10.13961/j.cnki.stbctb.2016.04.031
Bodman, G. B., and Colman, E. A. (1944). Moisture and Energy conditions during downward Entry of water into soils. Soil Sci. Soc. Am. J. 8, 116–122. doi:10.2136/sssaj1944.036159950008000c0021x
Chang, Z., Catani, F., Liu, G., Huang, F., Meena, S. R., Huang, J., et al. (2022). Landslide susceptibility prediction using slope unit-based machine learning models considering the heterogeneity of conditioning factors. J. Rock Mech. Geotechnical Eng. 07, 009. doi:10.1016/j.jrmge.2022.07.009
Chen, S. (1997). A method of stability analysis taken effects of infiltration and evaporation into consideration for soil slopes. Wuhan, China: ROCK AND SOIL MECHANICS. doi:10.16285/j.rsm.1997.02.002
De Yong, W., Qing, J. Z., Jing, W., and Wei, Y. H. (2020). Three-dimensional geonet ecological slope protection technology and its engineering application. IOP Conf. Ser. Mat. Sci. Eng. 794, 012055. doi:10.1088/1757-899x/794/1/012055
Dwivedi, K., and Shrivastava, K. (2019). Rainfall and runoff estimation of micro watersheds of coastal Navsari. J. Soil Water Conserv. 18 (1), 43. doi:10.5958/2455-7145.2019.00005.5
Farhoudi, J., and Shayan, H. K. (2014). Investigation on local scour downstream of adverse stilling basins. Ain Shams Eng. J. 5, 361–375. doi:10.1016/j.asej.2014.01.002
Fu, H., Zha, H., Zeng, L., Chen, C., and Bian, H. (2020). Research progress on ecological protection technology of highway slope: Status and challenges. Transp. Saf. Environ. 2, 3–17. doi:10.1093/tse/tdaa006
Hallett, K. W. L. A., Bengough, A., Bransby, M., and Hallett, P. (2010). Planting density influence on fibrous root reinforcement of soils. Ecol. Eng. 36, 276–284. doi:10.1016/j.ecoleng.2009.02.005
Hopmans, J. W., and Bristow, K. L. (2002). Current capabilities and future needs of root water and nutrient uptake modeling. Adv. Agron. 77, 103–183. doi:10.1016/S0065-2113(02)77014-4
Huang, X., Wang, L., and Lu, Q. (2018). Vulnerability assessment of soil and water loss in Loess Plateau and its impact on farmers’ soil and water conservation adaptive behavior. Sustainability 10, 4773. doi:10.3390/su10124773
Huang, F., Cao, Z., Jiang, S. H., Zhou, C., and Guo, Z. (2020a). Landslide susceptibility prediction based on a semi-supervised multiple-layer perceptron model. Landslides 17, 2919–2930. doi:10.1007/s10346-020-01473-9
Huang, F., Zhang, J., Zhou, C., Wang, Y., Huang, J., and Zhu, L. (2020b). A deep learning algorithm using a fully connected sparse autoencoder neural network for landslide susceptibility prediction. Landslides 17, 217–229. doi:10.1007/s10346-019-01274-9
Huang, F., Chen, J., Liu, W., Hong, H., Huang, J., and Chen, W. (2022a). Regional rainfall-induced landslide hazard warning based on landslide susceptibility mapping and a critical rainfall threshold. Geomorphology 408, 108236. doi:10.1016/j.geomorph.2022.108236
Huang, Fao., Tao, S., Li, D., Lian, Z., Catani, F., Huang, J., et al. (2022b). Landslide susceptibility prediction considering neighborhood characteristics of landslide spatial datasets and hydrological slope units using remote sensing and GIS technologies. Remote Sens. 14 (18), 4436. doi:10.3390/rs14184436
Inal, M., and Yiitolu, M. (2012). Improvement of bioethanol productivity of immobilised saccharomyces bayanus with using sodium alginate-graft-poly(N-Vinyl-2-Pyrrolidone) matrix. Appl. Biochem. Biotechnol. 168 (2), 266–278. doi:10.1007/s12010-012-9770-0
Indraratna, B., Fatahi, B., and Khabbaz, H. (2006). Numerical analysis of matric suction effects of tree roots. Proc. Institution Civ. Eng. - Geotechnical Eng. 159, 77–90. doi:10.1680/geng.2006.159.2.77
Kokutse, N. K., Temgoua, A., and Kavazovi, Z. (2016). Slope stability and vegetation: Conceptual and numerical investigation of mechanical effects. Ecol. Eng. 86, 146–153. doi:10.1016/j.ecoleng.2015.11.005
Kolodny, L., and Joffe, J. S. (1939). The relation between moisture content and the micro-aggregation or the degree of dispersion in Soil1. Med. Klin. 69, 1845–1849. doi:10.2136/sssaj1940.036159950004000C0002x
Lee, M. L., Koo, C. H., Chong, S. Y., and Chin, D. J. (2022). Laboratory and numerical studies of rainfall infiltration into residual soil slope improved by biomediated soil cover. Water-Sui 14, 744. doi:10.3390/w14050744
Li, B., Xu, Q., Cheng, Q., Liu, T. X., Wang, H. Y., Zheng, G., et al. (2021). Characteristics of discontinuities in Heifangtai landslide area in Gansu, China. Appl. Geophys. 17, 857–869. doi:10.1007/s11770-020-0872-0
Li, P., Chen, J., Zhao, G., Holden, J., Liu, B., Chan, F. K. S., et al. (2022). Determining the drivers and rates of soil erosion on the Loess Plateau since 1901. Sci. Total Environ. 823, 153674. doi:10.1016/j.scitotenv.2022.153674
Likitlersuang, S., Takahashi, A., and Eab, K. H. (2014). Centrifuge modelling of root-reinforced soil slope subjected to rainfall infiltration. Géotechnique Lett. 4, 211–216. doi:10.1680/geolett.14.00029
Likitlersuang, S., Kounyou, K., and Prasetyaningtiyas, G. A. (2020). Performance of geosynthetic cementitious composite mat and vetiver on soil erosion control. J. Mt. Sci. 17, 1410–1422. doi:10.1007/s11629-019-5926-5
Lin, C., and Jiang, W. (2019). Evaluation of vertical effective stress and pile tension capacity in sands considering scour-hole dimensions. Comput. Geotech. 105, 94–98. doi:10.1016/j.compgeo.2018.09.013
Link, T. E., Unsworth, M., and Marks, D. (2004). The dynamics of rainfall interception by a seasonal temperate rainforest. Agric. For. Meteorol. 124 (3-4), 171–191. doi:10.1016/j.agrformet.2004.01.010
Liu, L., and Han, W. (2021). Research on the slope support technology in civil engineering construction. E3S Web Conf. 233, 03012. doi:10.1051/e3sconf/202123303012
Liu, Q., Tang, A., Huang, Z., Sun, L., and Han, X. (2022). Discussion on the tree-based machine learning model in the study of landslide susceptibility. Nat. Hazards 113, 887–911. doi:10.1007/s11069-022-05329-4
Loáiciga, H. A., and Johnson, J. M. (2018). Infiltration on sloping terrain and its role on runoff generation and slope stability. J. Hydrol. S0022169418302762, 561–584 ∼ 597. doi:10.1016/j.jhydrol.2018.04.023
Lou, G., Zhong, Q., and Xie, J. (2020). Nanometer montmorillonite modified fly ash ecological slope protection material and its preparation and application. J. Chem.-NY 2020, 6953594. doi:10.1155/2020/6953594
Maayar, M. E., Price, D. T., and Chen, J. M. (2009). Simulating daily, monthly and annual water balances in a land surface model using alternative root water uptake schemes. Adv. Water Resour. 32, 1444–1459. doi:10.1016/j.advwatres.2009.07.002
Mei, X. M., Zhu, Q. K., Ma, L., Zhang, D., Wang, Y., and Hao, W. (2018). Effect of stand origin and slope position on infiltration pattern and preferential flow on a Loess hillslope. Land Degrad. Dev. 29, 1353–1365. doi:10.1002/ldr.2928
Miyata, S., Kosugi, K., Nishi, Y., Gomi, T., Sidle, R. C., and Mizuyama, T. (2010). Spatial pattern of infiltration rate and its effect on hydrological processes in a small headwater catchment. Hydrol. Process. 24, 535–549. doi:10.1002/hyp.7549
Naghdi, R., Maleki, S., Abdi, E., Mousavi, R., and Nikooy, M. (2013). Assessing the effect of Alnus roots on hillslope stability in order to use in soil bioengineering. J. For. Sci. (Prague). 59, 417–423. doi:10.17221/47/2013-jfs
Ng, C., Woon, K. X., Leung, A. K., and Chu, L. M. (2013). Experimental investigation of induced suction distribution in a grass-covered soil. Ecol. Eng. 52, 219–223. doi:10.1016/j.ecoleng.2012.11.013
Orr, E., Owen, L., Saha, S., Hammer, S., and Caffee, M. (2020). Rockwall slope erosion in the northwestern Himalaya. JGR Earth Surf. 126, e2020JF005619. doi:10.1029/2020JF005619
Osman, N., and Barakbah, S. S. (2006). Parameters to predict slope stability—soil water and root profiles. Ecol. Eng. 28, 90–95. doi:10.1016/j.ecoleng.2006.04.004
Park, J., Kim, I., and Kang, J. K. (2021). Root reinforcement effect on cover slopes of solid waste landfill in soil bioengineering. Sustainability 13, 3991. doi:10.3390/su13073991
Petersen, T. U., Sumer, B. M., B Gelund, J., Yazici, A., Freds E, J., and Meyer, K. E. (2015). Flow and edge scour in current adjacent to stone covers. J. Waterw. Port. Coast. Ocean. Eng. 141, 04014044. doi:10.1061/(asce)ww.1943-5460.0000287
Pollen-Bankhead, N., and Simon, A. (2010). Enhanced application of root-reinforcement algorithms for bank-stability modeling. Earth Surf. Process. Landforms 34, 471–480. doi:10.1002/esp.1690
Qiang, X. U., Peng, D., Xing, Q. I., Dong, X., Huajin, L. I., and Yuanzhen, J. U. (2016). Dangchuan 2∼# landslide of april 29, 2015 in heifangtai area of gansu province: Characteristices and failure mechanism. J. Eng. Geol. 24, 167–180. doi:10.13544/j.cnki.jeg.2016.02.001
Raats, P. A. C. (2007). Uptake of water from soils by plant roots. Transp. Porous Media 68, 5–28. doi:10.1007/s11242-006-9055-6
Rqz, A., Xmm, A., Fyz, B., Syw, A., Zjc, A., Msz, C., et al. (2016). Characterising hydrological processes on loess slopes using electrical resistivity tomography – a case study of the Heifangtai Terrace, Northwest China. J. Hydrol. 541, 742–753. doi:10.1016/j.jhydrol.2016.07.033
Saifuddin, M., and Normaniza, O. (2016). Rooting characteristics of some tropical plants for slope protection. J. Trop. For. Sci. 28 (4), 469–478.
Schwarz, M., Preti, F., Giadrossich, F., Lehmann, P., and Or, D. (2010). Quantifying the role of vegetation in slope stability: A case study in tuscany (Italy). Ecol. Eng. 36, 285–291. doi:10.1016/j.ecoleng.2009.06.014
Su, X., Zhou, Z., Liu, J., Cao, L., and Wang, P. (2021). Estimating slope stability by the root reinforcement mechanism of Artemisia sacrorum on the Loess Plateau of China. Ecol. Modell. 444, 109473. doi:10.1016/j.ecolmodel.2021.109473
Sui, J., Fang, D., and Karney, B. W. (2006). An experimental study into local scour in a channel caused by a 90°bend. Can. J. Civ. Eng. 33, 902–911. doi:10.1139/l06-037
Temgoua, A. G. T., Kokutse, N. K., and Kayazovic, Z. (2016). Influence of forest stands and root morphologies on hillslope stability. Ecol. Eng. 95, 622–634. doi:10.1016/j.ecoleng.2016.06.073
Vishweshwaran, M., and Sujatha, E. R. (2021). Experimental investigation and numerical modeling of a cross-linked biopolymer stabilized soil. Arab. J. Geosci. 14, 1952. doi:10.1007/s12517-021-08260-3
Voinov, N. A., Zemtsov, D. A., Bogatkova, A. V., and Deryagina, N. V. (2021). Study of hydraulic resistance of tangential swirlers. J. Phys. Conf. Ser. 2094, 052029. doi:10.1088/1742-6596/2094/5/052029
Wang, C. H. (2019). Study on stability theoretical of bank slope under coupled conditions. IOP Conf. Ser. Earth Environ. Sci. 304, 042039. doi:10.1088/1755-1315/304/4/042039
Wang, D. Y., Qing-Jun, Z., Wang, J., and Huang, W. Y. (2020). Three-dimensional geonet ecological slope protection technology and its engineering application. IOP Conf. Ser. Mat. Sci. Eng. 794, 012055. doi:10.1088/1757-899x/794/1/012055
Wang, D., Yuan, Z., Jing, D., and Zhao, C. (2021). Response of Grassland slope erosion to vegetation characteristics. IOP Conf. Ser. Earth Environ. Sci. 668 (1), 012013. doi:10.1088/1755-1315/668/1/012013
Wei, M., Yee-Meng, C., and Guan, D. (2018). Temporal development of propeller scour around a sloping bank. J. Waterw. Port. Coast. Ocean. Eng. 144, 06018005. doi:10.1061/(asce)ww.1943-5460.0000465
Wienberg, C., Titschack, J., Frank, N., Pol-Holz, R. D., Hebbeln, D., Eisele, M., et al. (2020). Deglacial upslope shift of NE Atlantic intermediate waters controlled slope erosion and cold-water coral mound formation (Porcupine Seabight, Irish margin). Quat. Sci. Rev. 237, 106310. doi:10.1016/j.quascirev.2020.106310
Xiao, Y., Jia, H., Guan, D., Liang, D., Yuan, S., and Tang, H. (2021). Experimental investigation on scour topography around high-rise structure foundations. Int. J. Sediment Res. 36 (3), 348–361. doi:10.1016/j.ijsrc.2020.10.009
Xie, X., Wang, J., Hou, L., Wang, J., Bin, Z., and Wu, F. (2021). A new method to estimate the cover and management factor for soil loss prediction on the Loess Plateau in China: A case-study using a soybean field. Land Degrad. Dev. 32, 3282–3295. doi:10.1002/ldr.3985
Xin, W., and Lin, Z. (2020). Soil erosion control practices in the Chinese Loess Plateau: A systematic review. Environ. Dev. 34, 100493. doi:10.1016/j.envdev.2019.100493
Xing, Q., Qiang, X., and Liu, F. (2017). Analysis of retrogressive loess flowslides in Heifangtai, China. Eng. Geol. 236, 119–128. doi:10.1016/j.enggeo.2017.08.028
Xu, L., Dai, F. C., Gong, Q. M., Tham, L. G., and Min, H. (2012). Irrigation-induced loess flow failure in Heifangtai platform, north-west China. Environ. Earth Sci. 66, 1707–1713. doi:10.1007/s12665-011-0950-y
Xu, R., Guo, L., Li, X. C., and Dong, Q. (2015). Research on the growth characteristics and slope protection of artemisia ordosica in yan'an area. J. Railw. Eng. Soc. 32 (09), 19–24.
Yan, Y., Chai, Z., Yang, X., Simayi, Z., and Yang, S. (2021). The temporal and spatial changes of the ecological environment quality of the urban agglomeration on the northern slope of Tianshan Mountain and the influencing factors. Ecol. Indic. 133, 108380. doi:10.1016/j.ecolind.2021.108380
Yang, Q., Hao, Z., Cheng, W., Lei, S., Teng, D., Zhang, Y., et al. (2022). Analysis of influencing parameters of the improved model for rainfall infiltration in unsaturated tailings soil. Adv. Civ. Eng. 2022, 1–14. doi:10.1155/2022/7401917
Yanguang, W., and Xiaoxia, L. (2018). Plant slope protection in highway engineering. IOP Conf. Ser. Earth Environ. Sci. 170 (5), 052038. doi:10.1088/1755-1315/170/5/052038
Yi, W. X. (2012). Slope protection with vegetation for waste dump at guangyue road in shanghai. Adv. Mat. Res. 2091, 465–471. doi:10.4028/www.scientific.net/amr.594-597.465
Yu-liang, L., Ying-xin, L., Lian-heng, Z., and T, Y. Y. (2020). Investigation on seismic response of a three-stage soil slope supported by anchor frame structure. J. Cent. South Univ. 27 (8), 1290–1305. doi:10.1007/s11771-020-4367-1
Zhang, F., and Wang, G. (2017). Effect of irrigation-induced densification on the post-failure behavior of loess flowslides occurring on the Heifangtai area, Gansu, China. Eng. Geol. 236, 111–118. doi:10.1016/j.enggeo.2017.07.010
Zhang, M., Hu, D., and Fan, J. (2020a). Study on the application of vegetation protection and ecological restoration technology in stone slope. IOP Conf. Ser. Earth Environ. Sci. 510, 042024. doi:10.1088/1755-1315/510/4/042024
Zhang, S., Wang, X., Xiao, Z., Qu, F., Wang, X., Li, Y., et al. (2020b). Quantitative studies of gully slope erosion and soil physiochemical properties during freeze-thaw cycling in a Mollisol region. Sci. Total Environ. 707, 136191–136191.17. doi:10.1016/j.scitotenv.2019.136191
Zhang, Y., Zhang, X., Bi, Z., Yu, Y., Shi, P., Ren, L., et al. (2020c). The impact of land use changes and erosion process on heavy metal distribution in the hilly area of the Loess Plateau, China. Sci. Total Environ. 718, 137305–137305.9. doi:10.1016/j.scitotenv.2020.137305
Zhang, J., Chen, H., Fu, Z., Luo, Z., Wang, F., and Wang, K. (2022a). Effect of soil thickness on rainfall infiltration and runoff generation from karst hillslopes during rainstorms. Eur. J. Soil Sci. 73, 13288. doi:10.1111/ejss.13288
Keywords: slope scouring, rainfall intensity, matrix suction, safety factor, slope stability
Citation: Tao H, Lei S-W, Gong L, Shi X, Zhang M-M and Yang G-Q (2023) Study on erosion and stability of the ecological slope. Front. Earth Sci. 10:1071231. doi: 10.3389/feart.2022.1071231
Received: 16 October 2022; Accepted: 09 November 2022;
Published: 16 January 2023.
Edited by:
Faming Huang, Nanchang University, ChinaReviewed by:
Partha Das, Netaji Subhas University of Technology, IndiaMiaohua Mao, Yantai Institute of Coastal Zone Research (CAS), China
Shengrui Su, Chang’an University, China
Copyright © 2023 Tao, Lei, Gong, Shi, Zhang and Yang. This is an open-access article distributed under the terms of the Creative Commons Attribution License (CC BY). The use, distribution or reproduction in other forums is permitted, provided the original author(s) and the copyright owner(s) are credited and that the original publication in this journal is cited, in accordance with accepted academic practice. No use, distribution or reproduction is permitted which does not comply with these terms.
*Correspondence: Shao-Wei Lei, bHpqZGxzd0AxNjMuY29t