 Junju Xie1*†
 Wencai Wang2,3†
 Zhao An1,4†Kewei Li1,4Xiufeng Tian2,3Lina Wu5Shude Gao2,3Weidong Zhang3Jie Yuan3
- 1Institute of Geophysics, China Earthquake Administration, Beijing, China
- 2Lanzhou Institute of Seismology, China Earthquake Administration, Lanzhou, China
- 3Gansu Earthquake Agency, Lanzhou, China
- 4School of Earth and Space Sciences, Peking University, Beijing, China
- 5Gansu Meteorological Information and Technical Equipment Support Center, Lanzhou, China
On 8 January 2022, an MS6.9 earthquake occurred in the Menyuan county, Qinghai province at the northeastern margin of the Tibetan Plateau. A dense observatory network consisting of accelerographs and intensity meters has obtained many acceleration recordings in this region, which previously had only a few strong motion recordings. Using acceleration data recorded by 141 accelerographs and micro-electro mechanical system (MEMS)-based intensity meters within 100 km of the causative fault, we investigated the spatial distribution and attenuation characteristics of the near-source ground motion during this event. The observed response spectra were compared with the prediction obtained using the NGA-West2 models. It was found that, in the long-period section of >1.0 s, the acceleration response spectra in the rupture forward direction (southeast of the epicenter) were greater than the prediction, while observations on the northwest side were lower than the prediction. Through the spatial distribution of the ground motion and quantitative analysis of the residuals, we found that the rupture directivity effects on the ground motions were controlled by the spatial azimuth relative to the fault and the along-strike projected length of the rupture, which mainly affected the long-period portion of the >1.0 s. In the rupture forward direction, the spectral accelerations (SAs) with periods of 1.0–10.0 s were enhanced to 1.18–1.56 times the average. In the backward direction (northwest of the epicenter), the SAs with periods of 1.0–10.0 s were only 0.63–0.86 times the average. The rupture directivity effects during the MS6.9 (MW6.6) earthquake exhibited an obvious period-dependence and narrowband characteristics, and the amplification effects were the strongest at 5.0 s. The amplification factors in the straight forward directions were underestimated by the empirical model. Two typical velocity pulse records were observed in the rupture forward direction, and their response spectra were significantly amplified at long periods of greater than 1.0 s, with peak amplification values of 4.0–6.0 near the characteristic period of the pulses. This amplification was related to the resonance excited by a specific periodic pulse. Our study provides a reference of quantifying near-source effects for both moderate and major shallow crustal earthquakes by using MEMS recordings in this region.
1 Introduction
At 01:45 on 8 January 2022, Beijing Time, an MS6.9 earthquake occurred in Menyuan Hui Autonomous County, Qinghai Province (37.77°N, 101.26°E), Western China, with a focal depth of 10 km. The earthquake occurred at the deep intersection of the Tuolaishan Fault Zone and the Lenglongling Fault zone within the Qilian-Haiyuan Tectonic Belt on the northeastern margin of the Tibetan Plateau. The seismic structure was mainly at the western section of the Lenglongliang Fault Zone (112° strike, 88° slope angle), and the faulting occurred at the same time along the Tuolaishan Fault on the western side (Liang et al., 2022). This region is continuously subjected to strong earthquakes with magnitudes >6, such as the magnitude 6.4 earthquakes on 26 August 1986, and 21 January 2016. The Qilian-Haiyuan Tectonic Belt has previously experienced the M8.5 1920 Haiyuan earthquake, the M8.0 1927 Gulang earthquake, the M7.6 1932 Changma earthquake, and the M7.2 1954 Shandan earthquake (Han, 2022). For this Menyuan MS6.9 event, the source model inversion results of the U.S. Geological Survey (USGS) show that the potential seismic fault’s strike, dip, and slip angle were 104°, 88°, and 15°, respectively, and the moment magnitude MW was 6.6, which is consistent with the results of source rupture process inversion and aftershock precision localization from geophysical research by the Institute of Geophysics, China Earthquake Administration (IGPCEA) (USGS, 2022; IGPCEA, 2022), indicating that the earthquake was an almost vertical left strike-slip event. The earthquake affected 5,831 people in Menyuan County, Qilian County, and Gangcha County. Nine people were injured, and 4,052 houses were damaged. Roads, bridges, tunnels, and other infrastructure in the region were damaged to varying degrees, including the Lanzhou-Xinjiang high-speed railway in the Liuhuanggou Bridge and Daliang Tunnel, which suffered serious damage, resulting in the interruption of railway service, economic losses, and detrimental social impacts (Bao et al., 2022). Based on post-earthquake remote sensing image interpretation and field survey findings, Liang et al. (2022) determined that the surface rupture was dominated by tensile fissures, tensile-shear fissures, extrusion bulges, and steep faults in the vicinity of the epicenter, with a total length of 30 km. The surface rupture also consisted of a two-segment rupture zone located in the WNW-ESE direction of the Lenglongliang Fault and the eastern end of the Tuolaishan Fault near the WE direction, with strikes of 291° and 86.9°, respectively. The extension lengths were approximately 20 km and 10 km, respectively (Figure 1). The earthquake damage survey showed that the seismic intensity was critical (IX on the Chinese intensity scale, corresponding to IX on the modified Mercalli intensity scale) in the macro-epicenter region near the Liuhuanggou area where the maximum horizontal displacement was approximately 3.1 m (Gai et al., 2022; CEA, 2022). This area was also where the Lanxin High-Speed Railway Bridge suffered the most serious damage with the largest degree of buckling and deformation.
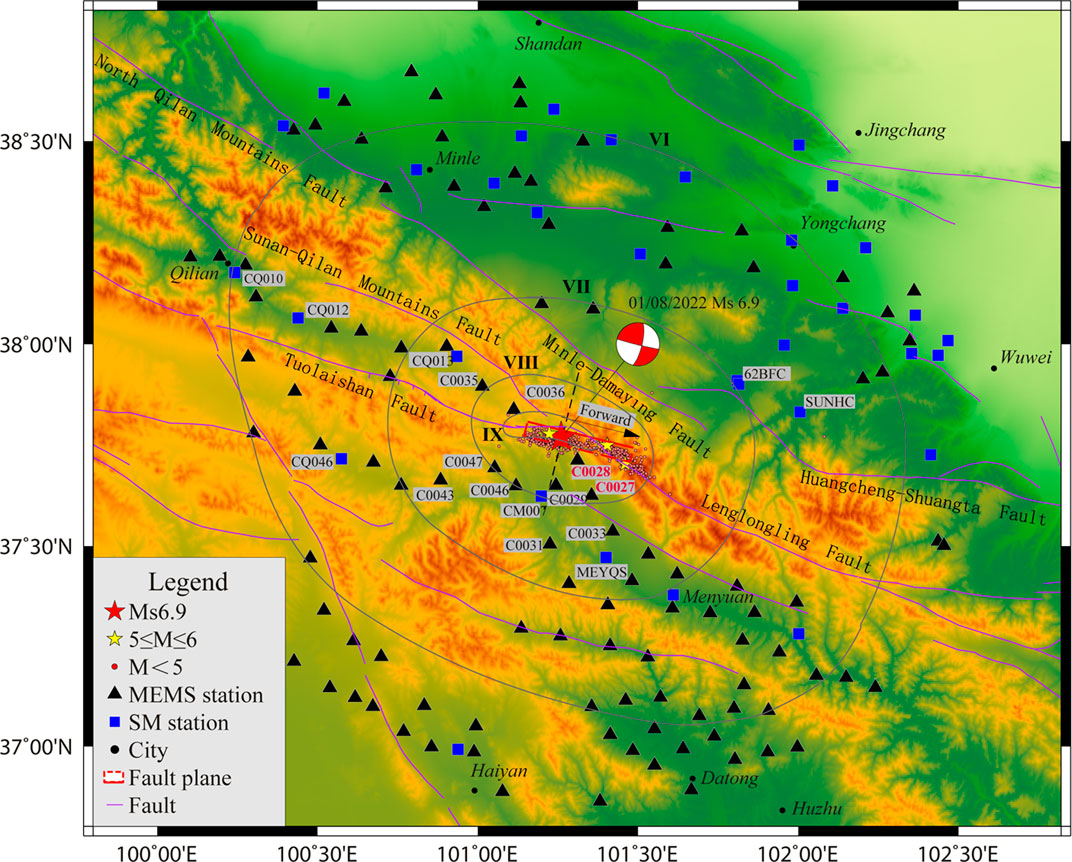
FIGURE 1. Location of the MS6.9 Menyuan earthquake and distribution of strong motion and MEMS recording stations within 100 km of the causative fault. Observation stations (C0028 and C0027) from which standard pulse characteristic recordings were obtained are marked in red labels. The geometry of the fault plane with a rupture length of 30 km and a width of 18 km is from Liang et al. (2022) and was inverted from InSAR deformation data. The gray circles indicate the intensity map provided by the China Earthquake Administration (CEA) (2022). The gray circles from inside to outside denote intensities of IX, VIII, VII, and VI.
Near-fault regions are critical areas for earthquake disaster prevention. Seismic damage surveys of previous destructive earthquakes have shown that the most serious seismic damage to engineering structures and major casualties are often located in the near-fault areas, which is closely related to the peculiar characteristics of the near-fault ground motion (such as hanging wall effects, large velocity pulses, rupture directivity effects, and strong polarity) and the specific nature of their destructive effects (Hall et al., 1995; Champion and Liel, 2012; Xie et al., 2017; Hu et al., 2020). An in-depth analysis of the observed strong ground motion is conducive to understanding the characteristics of the near-fault ground motion and the earthquake damage to engineering structures in the near-fault area. Three-component acceleration recordings from 141 stations within 100 km of the fault were recorded by the Gansu and Qinghai earthquake early warning networks and China’s National Strong Motion Observation Network System (NSMONS) during the MS6.9 Menyuan earthquake. This is the first time that so many recordings have been recorded in the northeastern margin of the Tibetan Plateau. In addition, the Hexi Corridor, adjacent to the epicenter, is an important hub area of the One Belt One Road, and is also the only pathway for many major projects in China (such as West-to-East Gas Transmission, West-to-East Power Transmission, Lanxin High-Speed Railway, and China-Europe Express Train). This is precisely the area where the geological tectonic environment is complex, the fluctuations of the terrain are drastic, and earthquakes are prone to cause abnormal intensity, aggravated damage, landslides, collapses, and other clusters of disaster-related events. Therefore, studying the characteristics of the near-source ground motion of the MS6.9 Menyuan earthquake is of great significance to future urban and rural planning and seismic fortification of major projects in the Hexi Corridor region. In this paper, through comparison of near-source ground motion observations using NGA-West2 models (Bozorgnia et al., 2014), and residual analysis of acceleration recordings within 100 km of the seismic fault, we investigate and quantify the period-dependent effects of the rupture directivity of the Menyuan earthquake on the spatial distribution of the ground motion intensity measures (IMs) and the attenuation characteristics in the northeastern Tibetan Plateau. We anticipate that results of this study will be useful for the improvement of technical knowledge on directivity effects for both moderate and major shallow crustal earthquake events, and for future ground motion model development and seismic hazard assessment in this region.
2 Strong motion recordings and data processing methods
In 2015, the China National Earthquake Intensity Rapid Report and Early Warning Project began construction in the Gansu and Qinghai regions. A total of 1735 observation stations were newly built or reconstructed. Among them, 485 strong motion stations use force-balanced accelerographs, while 1250 intensity stations are equipped with micro-electro mechanical system (MEMS)-based intensity meters. The Gansu and Qinghai Earthquake Early Warning Networks (EEWNs) began trial operation at the end of 2021 and captured a total of 686 three-component acceleration records from 203 accelerographs and 483 intensity meters during the MS6.9 Menyuan earthquake. China’s NSMONS obtained 26 groups of strong motion recordings during the MS6.9 Menyuan earthquake. The strong motion stations are equipped with force-balanced accelerometers with a 16-bit resolution, a measuring range of ±2 g, and a sampling rate of 200 Hz. The intensity stations use MEMS sensors to record three-component acceleration signals in real-time with a 16-bit resolution, a measuring range of ±2 g, and a sampling frequency of 100 Hz. The widespread influence of the earthquake was recorded by stations distributed at fault distances (Rrup) of 0–700 km. There are 141 three-component ground acceleration recordings within Rrup < 100 km, and 230 recordings within 100 km ≤ Rrup < 200 km. Figure 1 shows the distribution of the 141 recording stations within 100 km of the causative fault. The source-to-site distance Rrup for each station was calculated using the earthquake source geometry (Figure 1) provided by Liang et al. (2022), which assumes that the causative fault is a finite fault plane.
The site parameter VS30 of the strong motion stations of the NSMONS in Gansu Province was calculated from the shear velocity (Vs) profiles provided by Xie et al. (2022a). For the strong motion stations of the NSMONS in Qinghai Province, the borehole depth was less than 30 m; and the VS30 was calculated using the regional extrapolation model of northwestern China developed by Xie et al. (2022b). All of the newly built strong motion stations of the EEWN have Vs profiles with depths of greater than 30 m, and the VS30 can be directly calculated. For the intensity stations of the EEWN, due to the lack of Vs profile data, the VS30 was estimated using the proxy-based model proposed by Wald and Allen (2007). The VS30 values of the 141 recording stations within 100 km of the causative fault of the MS6.9 Menyuan earthquake are presented in Supplementary Appendix S1.
The baseline shifts in the near-field recordings have strong effects on the velocity and displacement time histories, particularly on the permanent displacement and long-period response spectra (Boore, 2001; Xie et al., 2013). To avoid missing displacement information, the near-fault recordings were processed using the multi-consecutive-segment baseline correction method (Akkar and Boore, 2009; Xie et al., 2013). For the recordings without permanent displacement, we used a Butterworth band-pass filter with a bandwidth of 0.05–50 Hz for the filtering. Considering the influence of the band-pass filtering and the noise level in the recordings (Ancheta et al., 2014), the lowest usable frequency of the MEMS recordings was 0.0625 Hz (the corresponding usable period is up to 16 s), which was adequate for the purpose of this study. The lowest usable effective frequencies for each recording obtained from both the strong motion seismographs and MEMS instruments are listed in Supplementary Appendix S1. To analyze the reliable high frequency range of the intensity meters, we intercepted noise and earthquake signals from the acceleration recordings of the intensity meters and compared the Fourier amplitude.
Spectra of the noise with ground motion signals. Figure 2 shows the results of the comparisons of two recordings, C0037 and C0056, with good and poor quality, respectively. The good-quality recording of C0037 has high signal-to-noise ratios in the high frequency range up to 40 Hz. The poor-quality recording of C0056 has a low signal-to-noise ratio above 20 Hz and a relatively high level of noise in the vertical component. Overall, the noise level of the recordings during this event obtained by the intensity meters is ∼0.1 cm/s2, and the horizontal recordings of the intensity meters have a relatively high signal-to-noise ratio in the high frequency range up to 20 Hz.
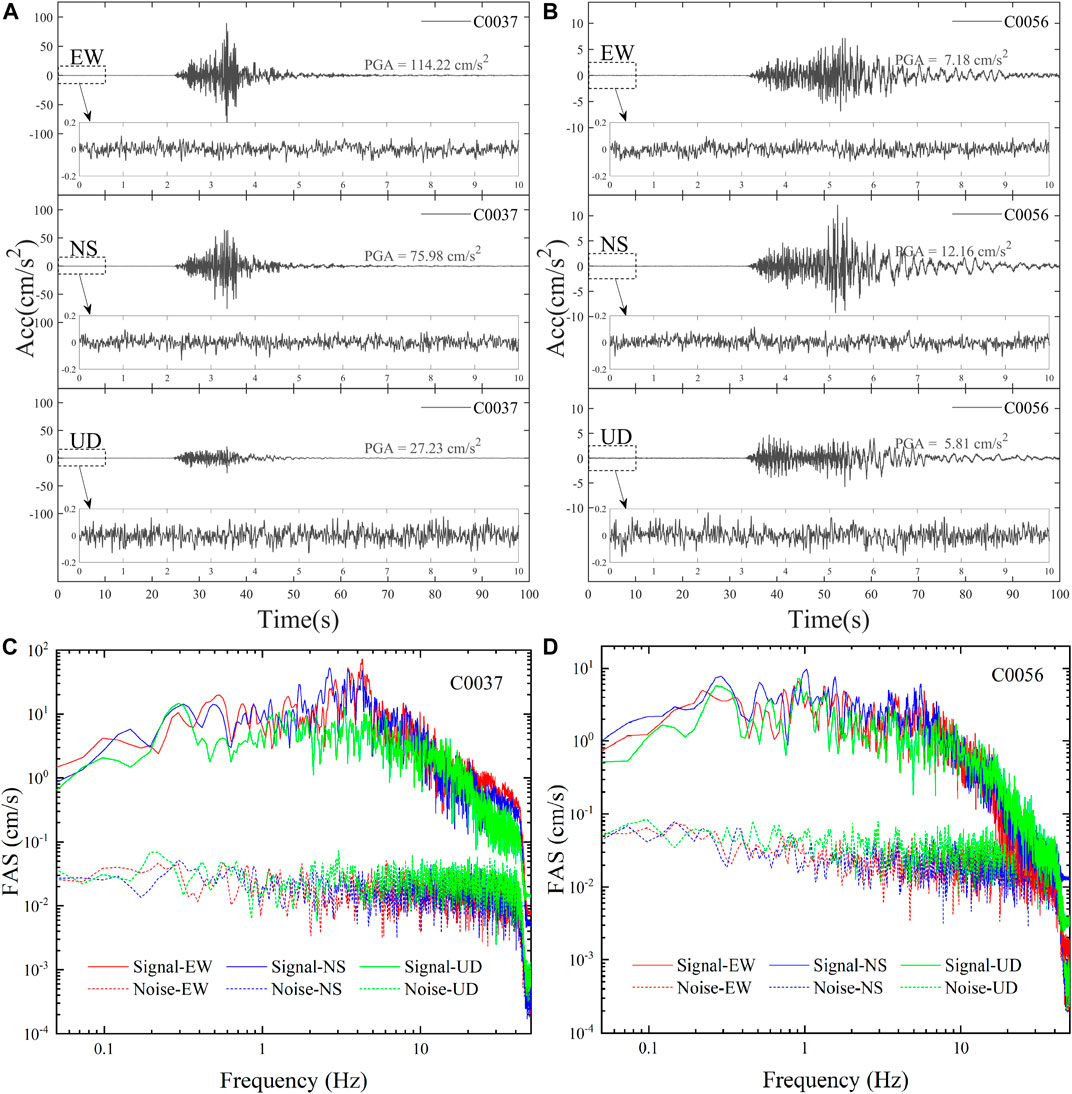
FIGURE 2. Comparisons of the (A–B) three-component time histories and (C–D) Fourier spectrum analysis regarding the noise levels of a standard high-quality record (C0037) and a poor quality record (C0056) from the intensity meters during this earthquake. EW, NS, and UD denote the recordings in the east-west (EW), north-south (NS), and up-down (UD) directions.
3 Variations in spatial distribution of ground motion
3.1 Characteristics of ground motion amplitude
Of the 141 three-component acceleration recordings used in this study, 34 were recorded by strong motion accelerographs and 107 were recorded by MEMS instruments within 100 km of the causative fault. Table 1 shows the basic information and ground motion parameters of 12 recordings within 30 km of the fault. The largest acceleration was observed at the southeast side of the epicenter at the C0028 station (Table 1) in the macroscopic intensity IX zone. The peak ground accelerations (PGAs) in the east-to-west (EW), north-to-south (NS), and up-to-down (UD) directions were 423.5 cm/s/s, 498.2 cm/s/s, and 421.0 cm/s/s, respectively. The peak ground velocities (PGVs) were 32.2 cm/s, 25.2 cm/s, and 12.8 cm/s, respectively. The second largest value was recorded at the C0027 station, which is also located on the southeast side of the epicenter. The recorded PGAs in the EW, NS, and UD directions were 224.9 cm/s/s, 190.8 cm/s/s, and 117.6 cm/s/s, respectively. Figure 3 shows the EW component acceleration and velocity time histories observed within 30 km of the fault (epicentral distance of less than 40 km). Significant discrepancies were found between on the observed ground motion on the southeast and northwest sides of the epicenter. On the southeast side of the epicenter, both the acceleration and velocity increased very rapidly, and the ground motion waveforms (C0028, C0027, C0029, CM007, C0033, and C0031) were characterized by large amplitudes and short durations, with clear pulses in the velocity trace. In contrast, on the ground motions on the northwest side of the epicenter (C0036, C0035, C0047, C0046, CQ013, and C0043) were characterized by small amplitudes and long durations, which demonstrated the clear consequence of the rupture directivity (McGuire, 2004; Hu and Xie, 2011).
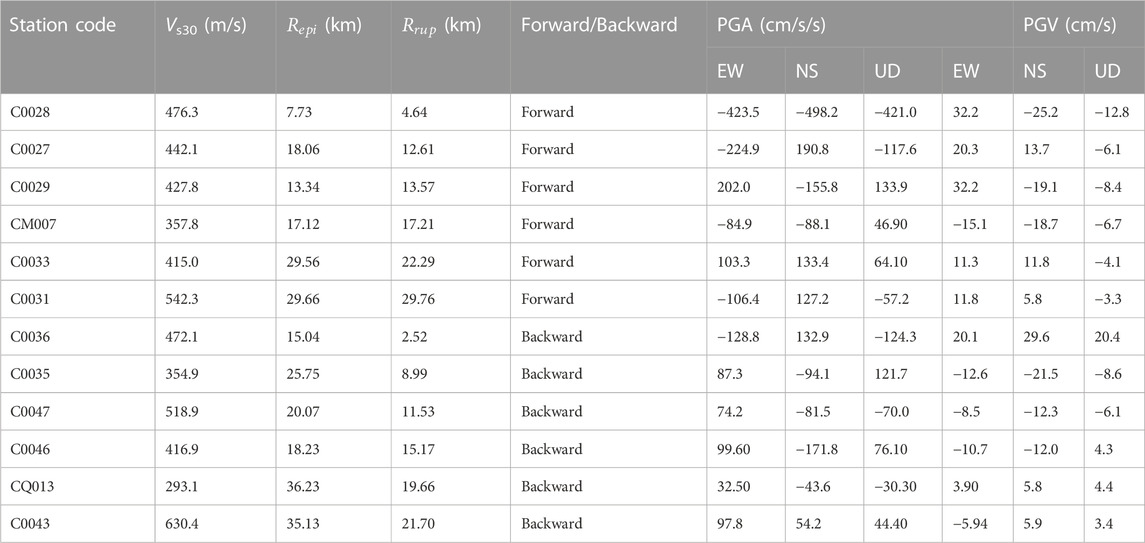
TABLE 1. Ground motion parameters of strong motion recording for stations within 30 km observed in the MS6.9 Menyuan earthquake.
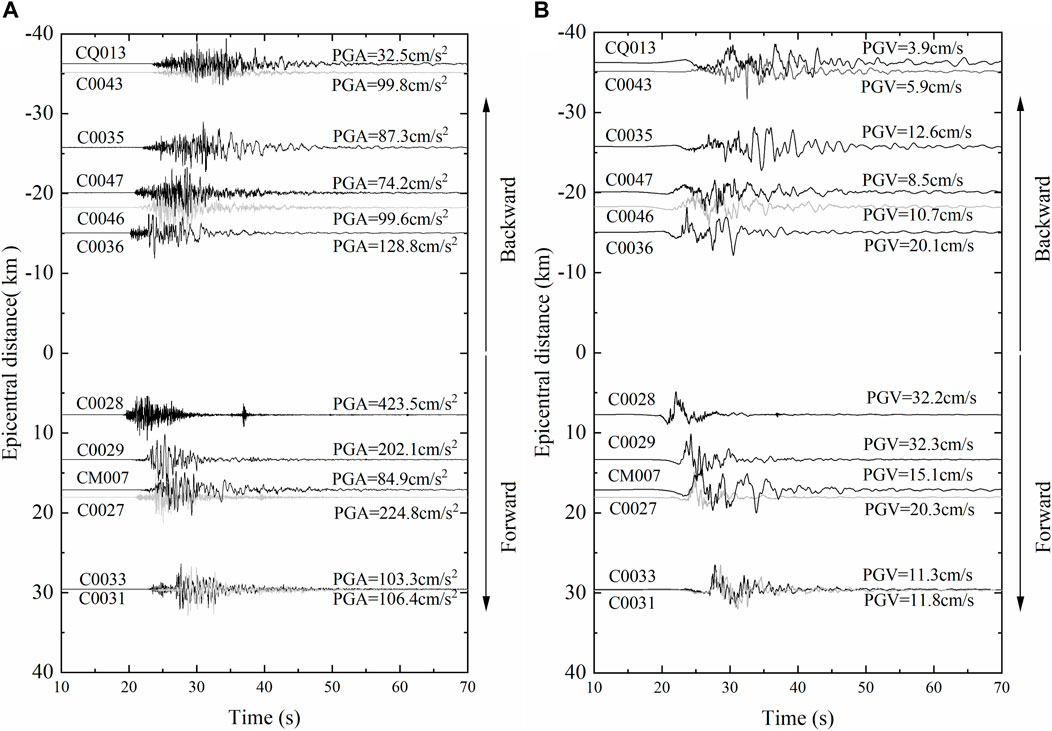
FIGURE 3. Comparison of (A) acceleration and (B) velocity EW component waveforms observed in the forward (southeast) and backward (northwest) regions.
3.2 Comparison of observed spectral acceleration with NGA-West2 empirical model
To examine the ground motion response spectra characteristics observed in the forward and backward directions of the rupture propagation, Figure 4A; Figure 4B compare the observed acceleration spectra of four strong motion stations (CM007, MEYQS, 62BFC, and SUNHC) in the rupture forward direction and four strong motion stations (CQ013, CQ012, CQ010, and CQ046) in the backward direction. The observed data in the forward and backward directions are compared with predictions from the NGA-West2 ground motion models (GMMs), which were developed using crustal earthquake data from active crustal regions around the globe. The main features of the NGA-West2 models are summarized in Supplementary Appendix S2.
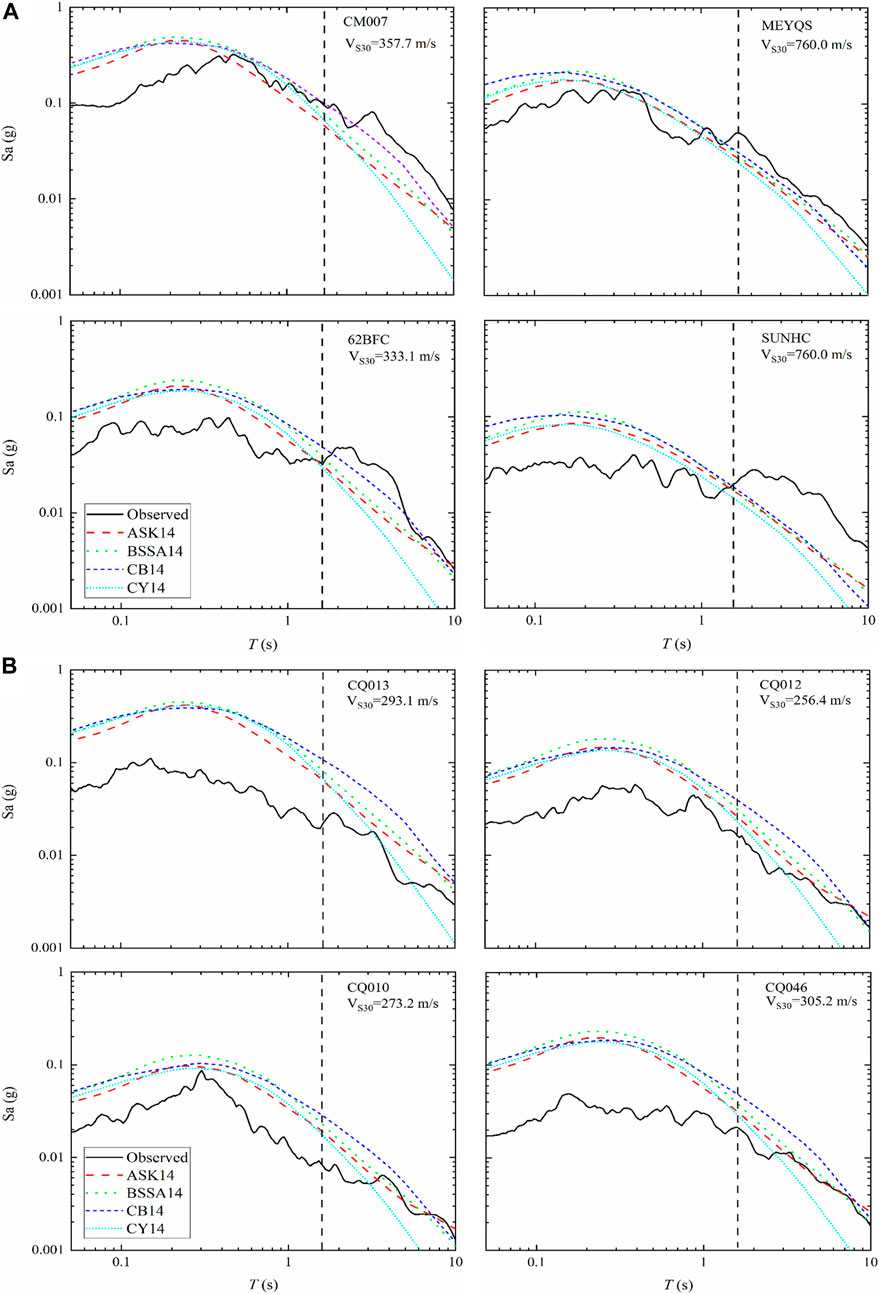
FIGURE 4. Observed horizontal spectral acceleration response in the rupture (A) forward and (B) backward directions and comparison with the predictions of the NGA-West2 models. ASK14, BSSA14, CB14, and CY14 denote the predictions of Abrahamson et al. (2014), Boore et al. (2014), Campbell and Bozorgnia (2014), and Chiou and Youngs (2014), respectively.
The horizontal acceleration spectra of stations CM0077, MEYQS, 62BFC, and SUNHC on the southeast side of the epicenter were lower than those predicted by the NGA-West2 models in the short-period (<1.0 s), while they were significantly higher than the predictions in the long periods (>1.0 s) (Figure 4A). The acceleration spectra observed at CQ013, CQ012, CQ010, and CQ046 on the northwest side of the epicenter (Figure 4B) were lower than the predictions of the NGA-West2 models over the entire period range. Both the time histories and acceleration spectra exhibited significant spatial variations in the ground motion observed in the rupture forward and backward directions.
3.3 Spatial distribution of ground motion
The spatial distribution and characteristics of near-source strong ground motions are clearly dependent on the fault type, fault geometry, and rupture process, which is one of the most significant differences from far-field ground motions. In order to investigate the near-source effects on the strong ground motion during this event, the observations were adjusted to the common shear velocity using the Seyhan and Stewart (2014) model, in which the amplitude and frequency-dependent site effects are a function of VS30, relative to a reference site condition VS30 = 760 m/s. Figure 5 shows the spatial distributions of the PGA, PGV, and spectral accelerations (SAs) for periods of 0.2, 0.5, 1.0, 2.0, 3.0, 7.5, and 10.0 s after site term adjustment. The IMs were calculated as the geometric mean values of two horizontal (EW and NS) ground motion components. The spatial distribution of the IMs during this earthquake was systematically biased by the azimuth of the fault. The ground motions on the southeast side of the fault in the rupture forward direction were much greater than the ground motions on the northwest side of the fault in the rupture backward direction, especially the distributions of the PGV and long-period ground motion.
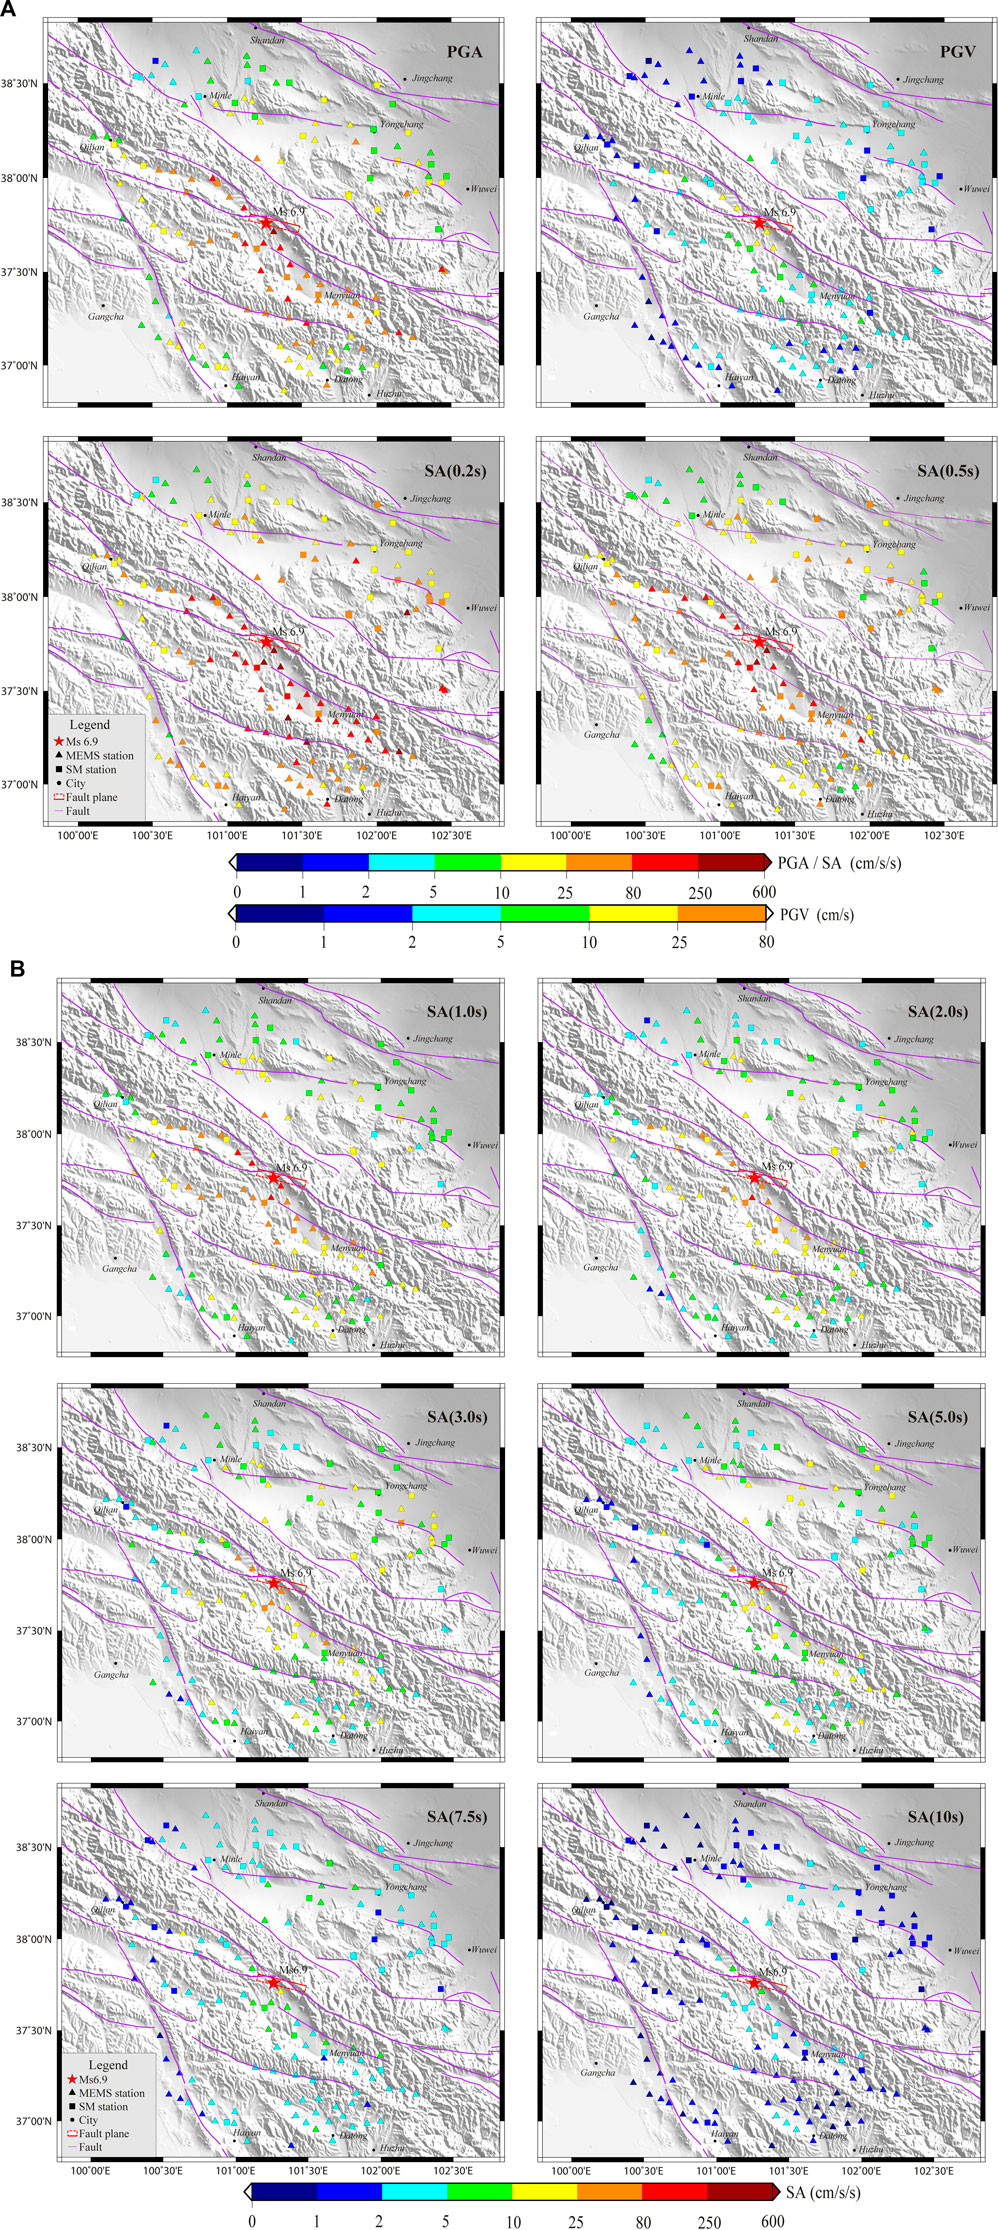
FIGURE 5. Spatial distribution of IMs. (A) PGA, PGV, and short-period ground motion for less than 1.0 s (B) long-period ground motion for >1.0 s.
Based on the strong motion data within a rupture distance of 100 km introduced in the previous section, we developed a simplified GMM for this event to analyze the relationship between the attenuation characteristics of the IMs with the rupture distance Rrup, the functional form is:
where IMs represents the observed PGA, PGV, and spectral acceleration (SA); a, b, c, and d are regression coefficients; and Rrup is rupture distance, which is the shortest distance from the observed station to the fault rupture surface. The second and third terms of the model are the geometric and anelastic terms, respectively. Table 2 presents the regression analysis results, which contain the regression coefficients, determination coefficients (R2), and standard deviation (
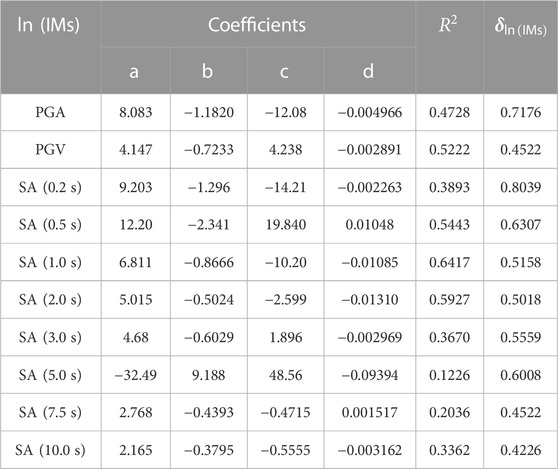
TABLE 2. Regression results for attenuation of various intensity measures (IMs) with
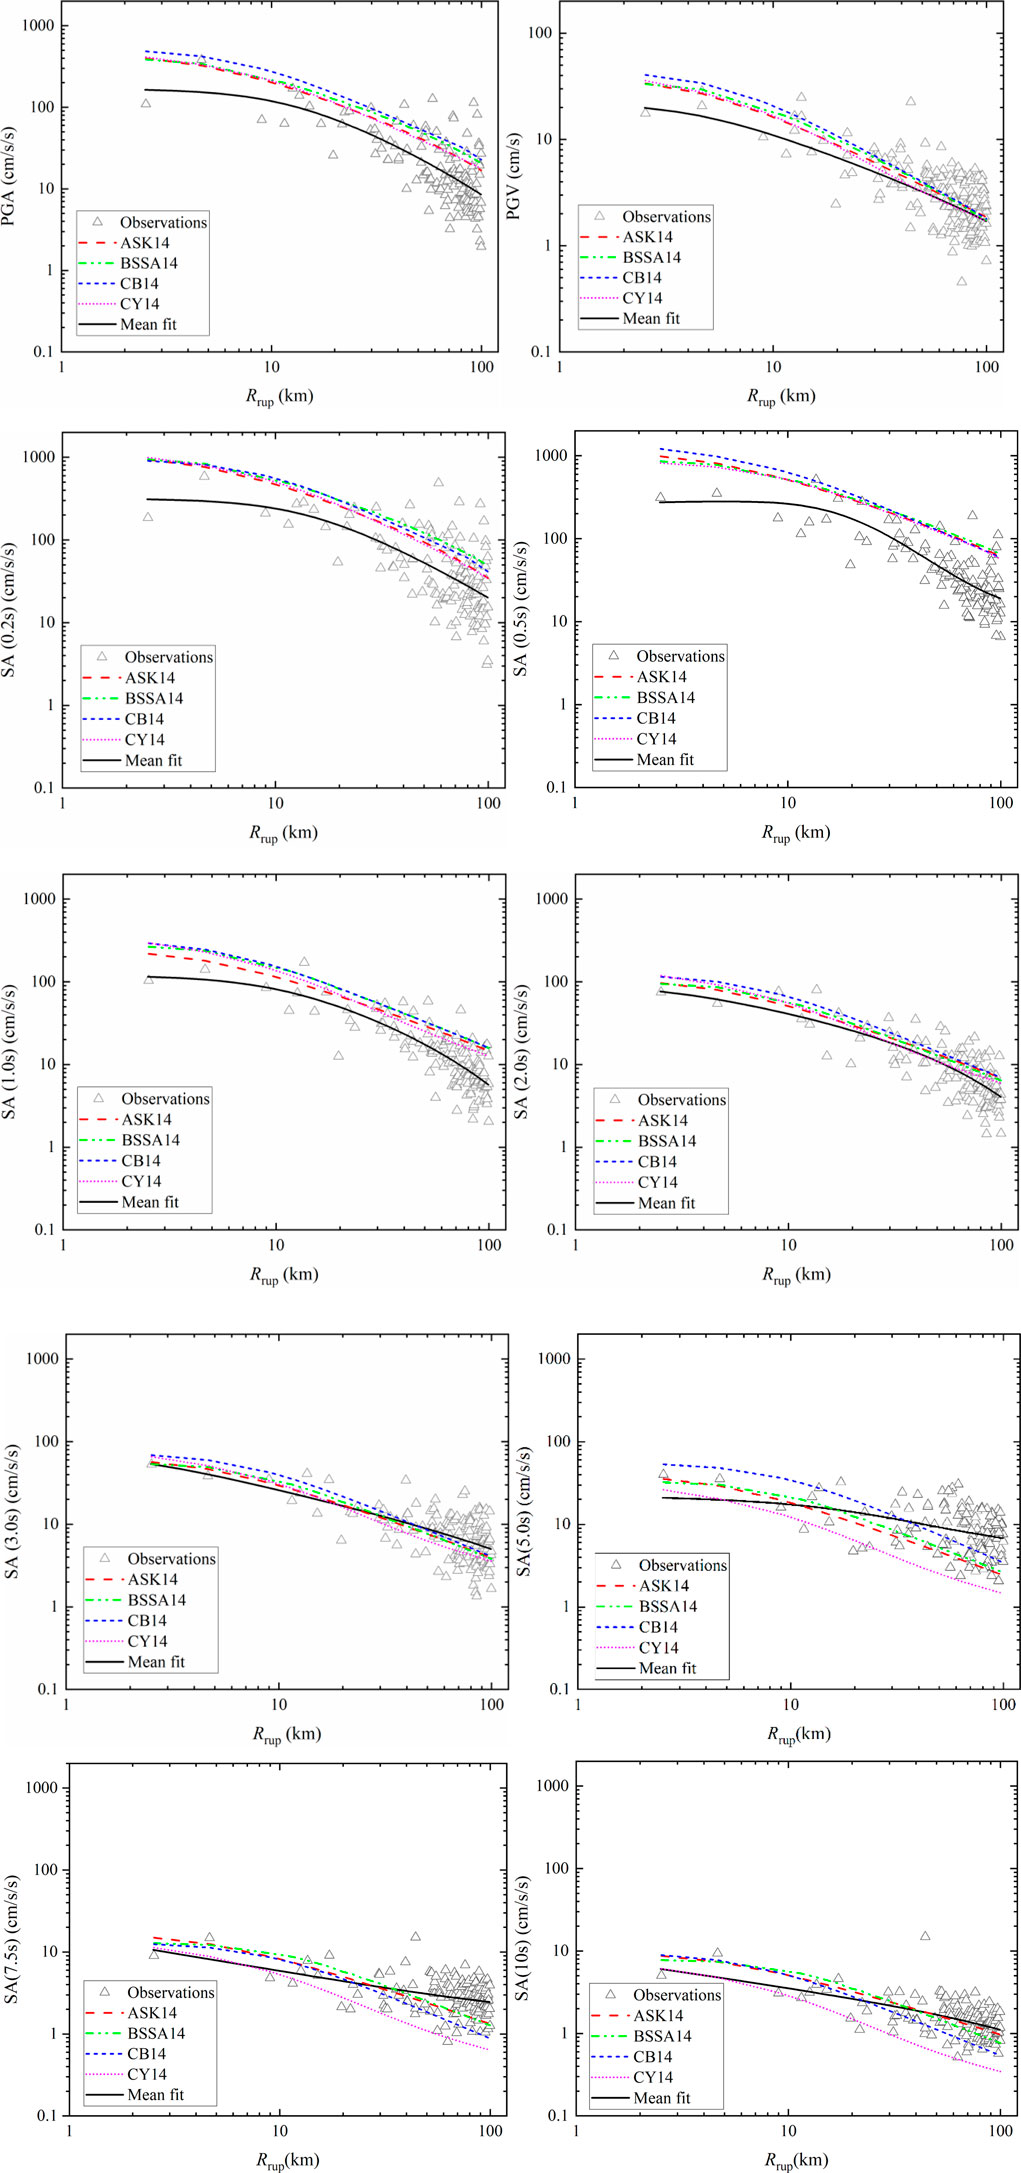
FIGURE 6. Variations in observed horizontal ground motion with Rrup and comparison with NGA-West2 models ASK14, BSSA14, CB14, and CY14, which are the predictions of Abrahamson et al. (2014), Boore et al. (2014), Campbell and Bozorgnia (2014), and Chiou and Youngs (2014), respectively. The mean fit curve denotes the regression results of the observed ground motion of this event. All of the observation data have been adjusted to the site condition of VS30 = 760 m/s based on the Seyhan and Stewart (2014) model (SS14). We used VS30 = 760 m/s for all of the NGA-West2 models.
To investigate the influence of the source rupture directivity on the spatial distribution of the near-field ground motion, we analyzed the logarithmic residuals of the ground motion IMs observed at different azimuths relative to the fault. The residuals were calculated as the difference between each observed ground motion IM, and the estimation using the mean regression relationship for this event:
where Yobs is the observed IMs of each station adjusted to VS30 = 760 m/s, and
Supplementary Figure S1 shows the spatial distribution of the residuals for various IMs. The smallest residuals (−2.0 to −1.0) are located northwest of the causative fault (rupture backward direction) where the observed ground motions are lower than the average values. The ground motions on the southeast side of the fault (rupture forward direction) are higher than the average overall, especially for long periods, and the largest residual is equal to 2.0. These observations indicate that the rupture directivity influences the spatial distribution of the strong ground motions, which is consistent with those observed during the 2008 Wenchuan event and the 2016 Kumamoto earthquake (Wen et al., 2010; Xie et al., 2017).
4 Quantitative analysis of ground motion directivity effects
To investigate the azimuthal variations, and the apparent period-dependence of the observed near-field strong motion, the model proposed by Xie et al. (2017) was used to quantify the effects of the directivity. This model is capable of simultaneously and quantitatively analyzing the amplification effect in the rupture forward direction and the de-amplification effect in the rupture backward direction, and it is an updated version of the Bayless and Somerville (2013) directivity model based on the observed ground motion. We adopted the geometric directivity predictor fg defined by Xie et al. (2017):
where s is the along-strike projected length (in km) of the rupture surface toward the site, and θ is the azimuth angle (in degree) between the rupture direction and the direction of the source to site, which are consistent with the Bayless and Somerville (2013) model. We used cos(θ) to quantify the azimuthal variation in both the rupture forward and backward directions. The value of angle θ is 0 ≤ θ ≤ 180°, where 0 ≤ θ < 90° indicates that the site is located in the rupture forward position and 90° ≤ θ ≤ 180° indicates that the site is located in the rupture backward position (Xie et al., 2017). The definition of
Figure 7 shows the variation in the residuals with parameter θ for various IMs. It can be seen that the residuals of the various IMs exhibit varying degrees of systematic bias with the cosine value of parameter θ and an overall linearly increasing trend. The residuals of most of the observations are positive in the rupture forward direction (cosine values of parameter θ are positive), that is, the observed ground motion is greater than the mean fit; and vice versa. In addition, the residuals reach a positive maximum in the straight forward direction (θ = 0°). This indicates that the straight forward direction has the strongest amplification effect on the ground motion; and the logarithmic residuals of observation near θ = 90° are about zero and represent the weakest rupture directivity effect. The residuals reach a negative maximum in the straight backward direction (θ = 180°). This indicates that the straight backward direction has the strongest de-amplification effect on the ground motion.
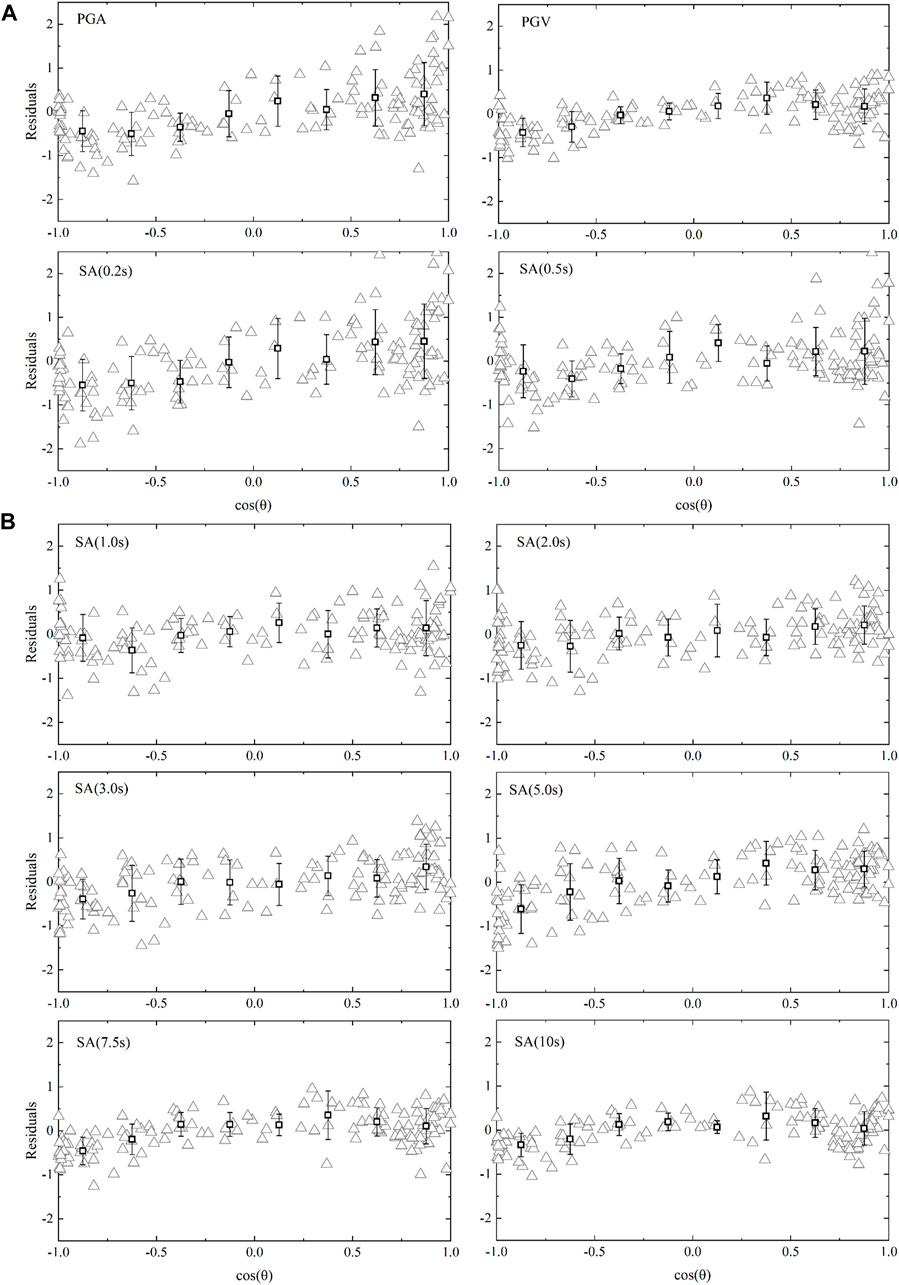
FIGURE 7. Variations in residuals with parameter θ for various IMs (A) PGA, PVG, and short-period ground motions of less than 1.0 s; (B) long-period ground motions of greater than 1.0 s. The vertical bars represent the mean and standard deviation for the binned data.
Figure 8 shows the variation in the residuals with parameter s for various IMs. The residuals of PGA, PGV, and SA of less than 1.0 s increase as the parameter s increases, of which the residuals of the SA (T = 0.2 s) are the most significant. The residuals of the SA greater than 1.0 s also increase with increasing s, indicating that the amplification in the rupture forward direction and the de-amplification in the rupture backward direction gradually increase as the parameter s increases. The residuals of the SA at T = 5.0 s is the most significant. It should be noted that the vast majority of the data are grouped as Rrup > L, and Figure 8 also shows that the directivity effects can still be strong when Rrup > L. This suggests that the distance taper function of the Bayless and Somerville (2013) model may not be appropriate for this event.
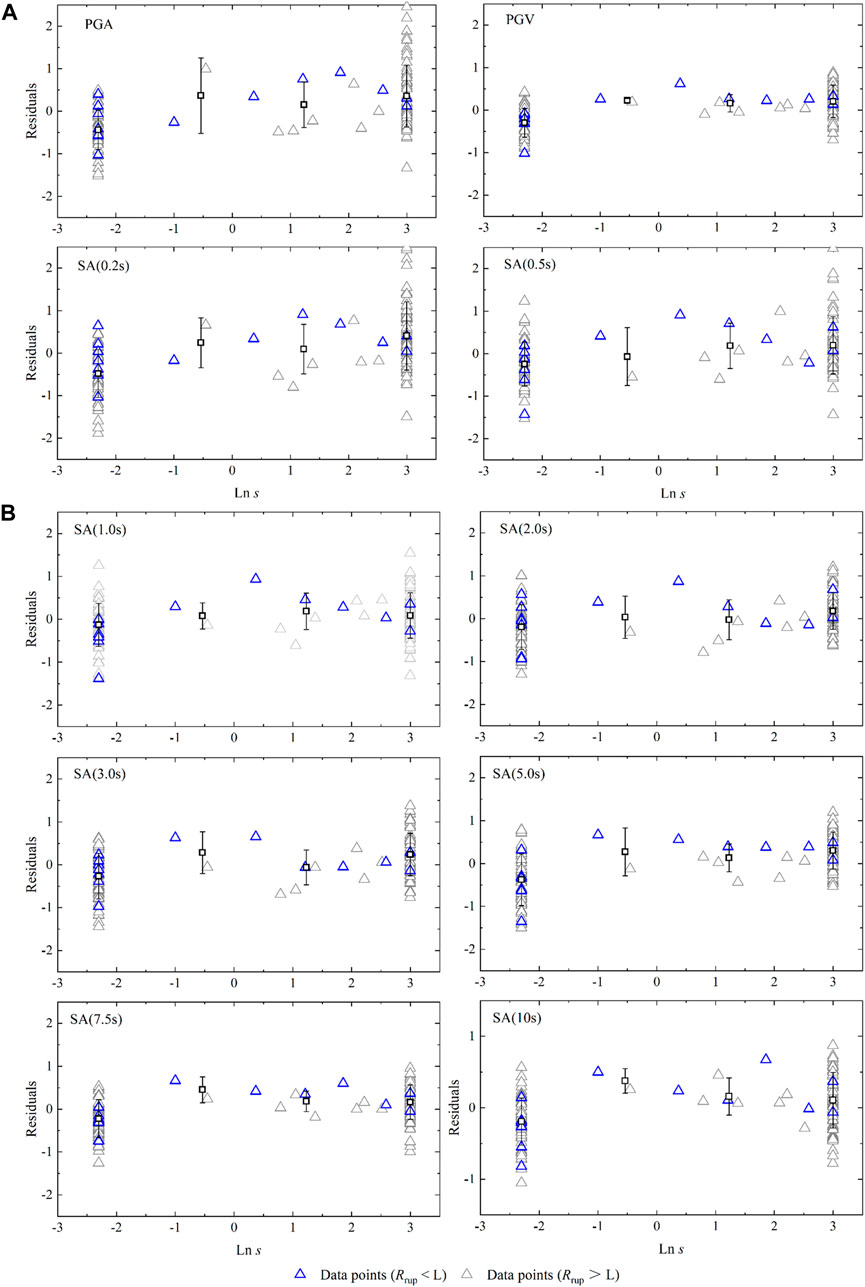
FIGURE 8. Variation in residuals with parameter s for various IMs (A) PGA, PGV, and short-period ground motion of less than 1.0 s; (B) Long-period ground motion of greater than 1.0 s. The data points for Rrup < L and Rrup > L (length of ruptured fault) are both shown in this figure. The data points in the backward region with θ > 90° are depicted as negative distances. The vertical bars represent the mean and standard deviation of the binned data.
Based on the variations in the ground motion residuals with parameter s and parameter θ, we speculate that the residual has a good linear relationship with the directivity effect prediction index
where fD is the residual of the natural logarithm of IM; and C0 and C1 are the regression coefficients of the model. Linear fitting was carried out between the residuals fD and parameter fg.
Table 3 summarizes the regression results for the directivity effect based on Eq. 4. Figure 9 shows the variation in fD with parameter fg and the linear fitting curves for PGV and SA of greater than 1.0 s. The comparison shows that the residuals of the IMs during the MS6.9 Menyuan earthquake increased as parameter fg increased, indicating that the directivity effect manifested in different ground motion periods. However, the degree of significance of the directivity effect of the ground motion varied with the period.
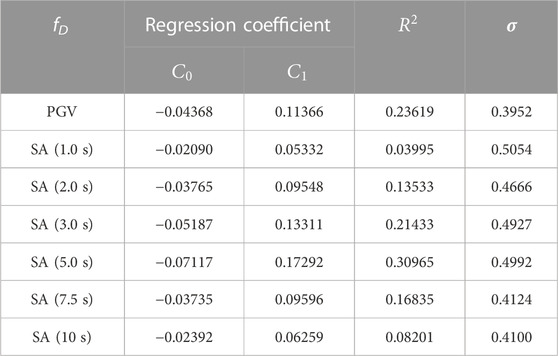
TABLE 3. Summary of regression results for the directivity effect based on the proposed log-linear model.
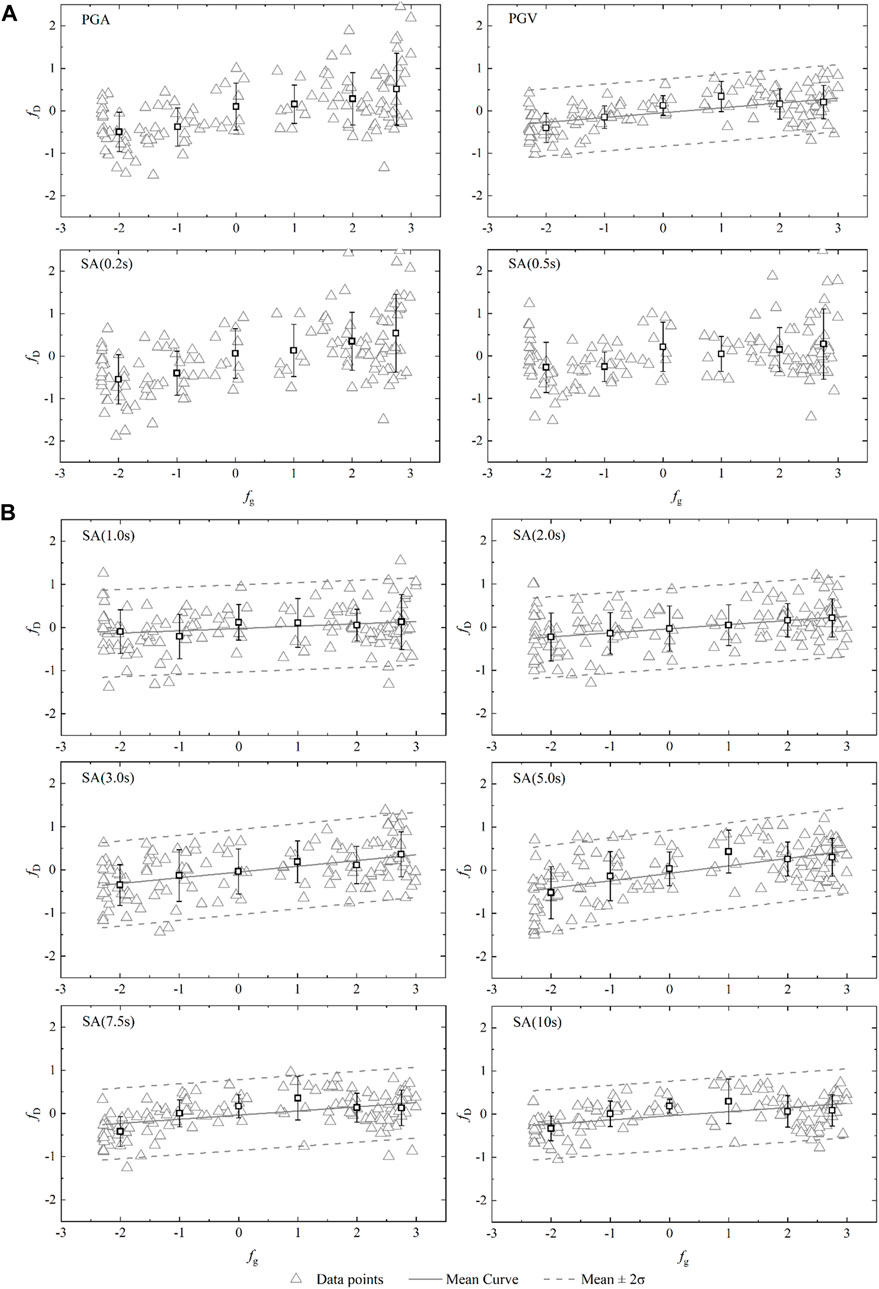
FIGURE 9. Variations in residuals with geometric directivity predictor fg for various IMs (A) PGA, PGV, and short-period ground motion of less than 1.0 s; (B) Long-period ground motion of greater than 1.0 s. The mean curve represents the curve obtained via linear regression of the residuals and the geometric directivity predictor; σ is the root-mean-square error from the linear regression. The vertical bars represent the mean and standard deviation of the binned data.
The directivity effect is generally considered to have a significant effect on ground motion for periods of greater than 1.0 s and a lesser effect on ground motion for periods of less than 1.0 s (Spudich et al., 2013; Xie et al., 2017). During the Menyuan earthquake, the disaster zone was concentrated near the seismic fault, and the long-period ground motions of greater than 1.0 s exhibited an obvious directivity effect. For the PGA and short-period ground motion [i.e., the SA (0.2 s)], the amplification also occurred in the rupture forward direction, but the scattering of the data on characteristic effects was large. The reasons for this phenomenon may be as follows. First, the source mechanism of the MS6.9 Menyuan earthquake was strike-slip with a high inclination, and the seismic wave energy was mainly concentrated along the strike direction of the fault, resulting in a more notable directivity effect, which was not only reflected in the long-period ground motion but also in the short-period ground motion (Xie et al., 2017). Second, the undulating surface of the source area has an important influence on the propagation of seismic waves (Zhang et al., 2008). This region is characterized by typical mountainous landforms. There are many mountains, including the Tuolaishan, Datongshan, Dabanshan, Lenglongling mountains, distributed to the WNW and ESE of the seismic fault. Therefore, the higher short-period ground motion values in the rupture forward direction may be related to the topographic amplification of the ridge area, and the topographic effect of the mountainous areas mainly amplifies the short-period ground motion (Zhang et al., 2021; Xie et al., 2022a).
Figure 10 examines the discrepancy in the rupture directivity effect at different periods during this earthquake. We compared the period-dependent characteristics of this event with large earthquake events that occurred in recent years and the BAY13 model. It can be seen that the MS6.9 (MW6.6) Menyuan earthquake had the strongest directivity effect at a period of 5.0 s, which was higher than that for the period of 3.0 s during the MW6.4 Hualien earthquake (An et al., 2019) but was lower than that for the period of 10.0 s during the MW7.0 Kumamoto earthquake (Xie et al., 2017). These three earthquakes were typical strike-slip earthquakes, and comparison of them revealed that the predominant period of the rupture directivity effect for high-magnitude earthquakes tended to be larger. In the MW7.9 Wenchuan earthquake, the rupture directivity effect was the strongest at a period of 5.0 s and was lower than that of the Kumamoto earthquake, which was related to the source rupture mechanism, i.e., of predominantly thrust faulting. Previous research results have shown that the rupture directivity effect tends to be stronger during strike-slip events (Spudich et al., 2013; Spudich et al., 2014; Xie et al., 2017; An et al., 2019). Comparison with the BAY13 model revealed that on the whole, the BAY13 empirical model significantly underestimated the amplification effects straight ahead in the forward rupture direction, especially near the predominant period. Moreover, the rupture directivity effects exhibit clear period-dependence and band-limited characteristics, with a large discrepancy in the amplification factor at different periods. The prediction curve of the BAY13 model is relatively flat and does not reflect the predominant period characteristics of the rupture directivity effect, especially for the Menyuan and Hualian earthquakes. Sgobba et al. (2021) published an updated.
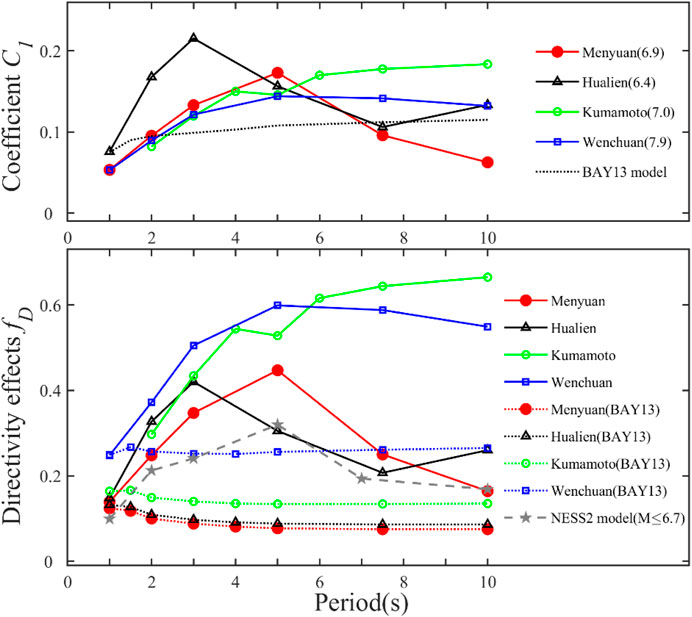
FIGURE 10. Comparison of near-field directivity effects during the Ms 6.9 (Mw 6.6) Menyuan earthquake with the Mw 6.4 Hualien earthquake, Mw 7.0 Kumamoto earthquake, Mw 7.9 Wenchuan earthquake, and the BAY13 model. The NESS2 model denotes the prediction of the adjusted ground motion model developed by Sgobba et al. (2021).
Version of the worldwide dataset of near-source strong motion recordings and developed an adjusted ground motion model that considers the near-source effects. Based on a comparison of the observations recorded during this Menyuan earthquake and the prediction of Sgobba et al. (2021), we found that the adjusted model of Sgobba et al. (2021) can distinguish the influence of the rupture directivity at different periods fairly well, but it slightly underestimates the amplification effects.
Based on statistical regression analysis of the observed data recorded during this event, Table 4 shows the amplification factors in the straight forward direction (θ = 0°) and the de-amplification factors in the straight backward direction (θ = 180°) due to rupture directivity effects. In the straight forward direction, the PGV and SA at periods of T = 1.0, 2.0, 3.0, 5.0, 7.5, and 10.0 s were amplified by 1.35, 1.15, 1.28, 1.42, 1.56, 1.28, and 1.18 times compared with the overall observed average, respectively. In the straight backward direction, the PGV and SA at periods of T = 1.0, 2.0, 3.0, 5.0, 7.5, and 10.0 s were attenuated by 0.74, 0.86, 0.77, 0.69, 0.63, 0.77, and 0.85 times compared with the overall observed average, respectively.
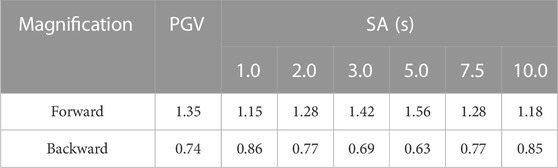
TABLE 4. The amplification and de-amplification coefficients of the directivity effect for various IMs.
5 Velocity pulse
Previous studies have shown that the rupture directivity often results in velocity pulse characteristics in the rupture forward direction (Bray and Rodriguez-Marek, 2004; Xie et al., 2012). We analyzed the velocity pulse characteristics during the Menyuan earthquake using the wavelet method proposed by Shahi and Baker (2011) to further consider the differences in the pulse characteristics in the different observation directions (Baker, 2007; Shahi and Baker, 2011; Xie et al., 2019). We determined that the record is a velocity pulse record when the ground motion in a certain direction exhibits a distinct pulse in the velocity trace. In addition, we did not impose the requirement of PGV>30 cm/s when identifying the velocity pulses. This requirement is one of the determination criteria proposed by Baker (2007), but it may not be appropriate in some cases (Shahi and Baker, 2014). Finally, two velocity pulse records were identified for the MS6.9 Menyuan earthquake. Table 5 lists the main parameters of these two pulse records. The largest pulse amplitude of 43.35 cm/s in the C0028 record appeared in the N12E6° direction and had a characteristic period of 6.56 s. The largest pulse amplitude in the C0027 record was 21.43 cm/s, which occurred in the NE72° direction. The two recording stations (red labels) with obvious velocity pulse characteristics are located on the southeast side of the fault (Figure 1). No clear pulses were identified in the recordings observed on the northwest side of the fault, which is in agreement with the features of the rupture directivity effect, i.e., the directional velocity pulse caused by the rupture directivity effect mainly appears in the forward direction (Bray and Rodriguez-Marek, 2004).
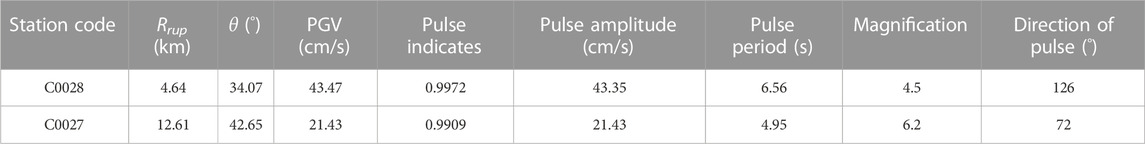
TABLE 5. Main parameters of typical pulse-like recordings for the MS6.9 Menyuan earthquake.
To study the effect of large velocity pulses on the long-period characteristics of ground motion, the long-period signals in pulse records were extracted from the velocity time series at the C0028 and C0027 station using the fourth-order Db wavelets, as shown in Figure 11. The effect of velocity pulses on the response spectra can be analyzed by comparing the response spectra of the original record with response spectra of the residual record after extracting the long-period pulse. Because the original record and the residual record after pulse extraction were obtained from the same station during the same earthquake, the impact of the earthquake source and site was removed. Figure 12 presents a comparison of the acceleration response spectra of the original pulse-like motion and the residual non-pulse ground motion. The shaded area in Figure 12 indicates the amplification area of the pulse action on the acceleration, and Tp denotes the characteristic period of the pulse-like recording. It can be seen that the amplification of the long-period ground motion acceleration response spectra above 1 s by the velocity pulse is significant, and the amplification at station C0027 exceeds 6.0 times. For the different records, the influence region of the amplification is mainly distributed near the characteristic period Tp.
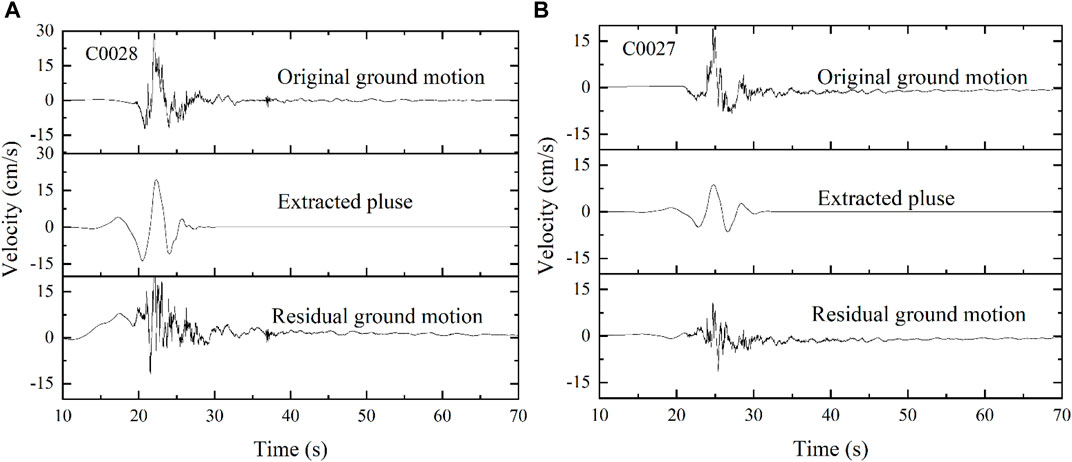
FIGURE 11. Extraction of long-period pulses from original strong motion recording using wavelet method. (A) C0028; (B) C0027.
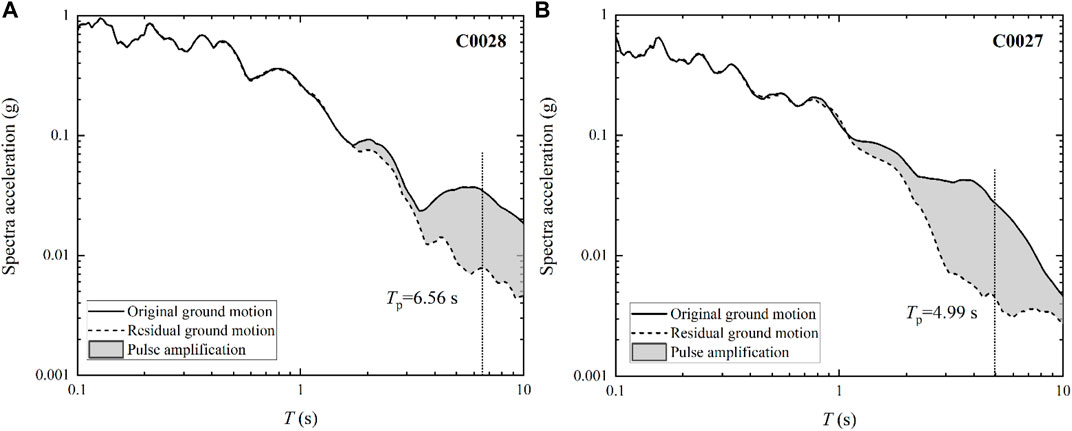
FIGURE 12. Comparison of the acceleration response spectra of the original pulse-like and non-pulse residual ground motion. (A) C0028; (B) C0027.
6 Discussion and conclusion
During the 8 January 2022, Menyuan earthquake, the newly built dense observatory network consisting of accelerographs and intensity meters obtained many acceleration recordings in this region of the northeastern margin of the Tibetan Plateau where strong motion recordings have previously been very rare. However, most of the records were obtained by intensity meters, which makes it challenging to analyze the ground motion characteristics due to the relatively lower signal-to-noise ratio. We investigated the noise level and effective frequency bandwidth range of the recordings from the intensity meters, which are widely used in this region. Based on the 141 three-component acceleration recordings obtained by China’s NSMONS and EEWN within 100 km of the causative fault of the MS6.9 Menyuan earthquake, the rupture directivity effects on the near-field strong ground motion were studied from the aspects of the waveforms recorded in the forward and backward directions of the rupture propagation, the spatial distribution and attenuation of the ground motion IMs, and the velocity pulse characteristics.
The noise level of the recordings from the MEMS instruments was ∼0.1 cm/s2, and the signal-to-noise ratios were relatively high in the frequency bandwidth range of 0.1–20 Hz for the horizontal components. By comparing the observed ground motions with the NGA-West2 models, it was found that the observed PGA, PGV, and short-period SAs (periods of 0.2 and 0.5 s) were relatively weak and were lower than the predictions. The observed medium-period SAs of 1.0, 2.0, and 3.0 s were consistent with the NGA-West2 models. The comparison also suggests that the attenuation of the ground motion in this region was slower than that in the global model, especially for periods of greater than 3.0 s. We attribute this slow attenuation characteristic to the high Q values of the stable crust in this area (Boore et al., 2014; Fu et al., 2019). This slow attenuation may increase the risk of a high-level of strong ground shaking when earthquakes occur in this region, which should be considered in seismic hazard assessments, especially for the construction of long-period structures, such as large multi-span bridges and high-rise buildings.
From the perspective of the spatial distribution, the ground motions observed to the southeastern of the epicenter (rupture forward direction) were characterized by large amplitudes, short durations, and distinct pulses in the velocity traces. To the northwestern of the epicenter (rupture backward direction), the observed waveforms were characterized by long durations and small amplitudes. The ground motion peaks and SAs in the rupture forward direction were higher than those in the rupture backward direction, which indicates a significant rupture directivity effect. The rupture directivity effects on the ground motion were controlled by the spatial azimuth relative to the fault and the along-strike projected length (in km) of the rupture surface toward the site. The rupture directivity effects exhibited significant differences at various periods. In the rupture forward direction, the SAs at periods of 1.0–10.0 s were enhanced by 1.15–1.56 times relative to the average level of this event; while in the rupture backward direction, the SAs at periods of 1.0–10.0 s were only 0.63–0.86 times the average. It is generally believed that the directivity effect mainly affects long-period ground motions of greater than 1.0 s. During this earthquake, the short-period ground motion in the rupture forward direction was also amplified; but the scatter of the data was large, which may be due to the amplification caused by the undulating terrain in the source area. We also noted the potential existence of sediment effects, but we consider their influence to be minor and unable to change the trend of the directivity effects. There is no large or deep basin in this region of the northeastern margin of the Tibetan Plateau. This arid area of China is normally covered by gravel, and the thickness of the sediment is generally less than 20 m (Shi, 1996; Shi and Chen, 2020; Qin et al., 2021).
The rupture directivity effect of the MS6.9 (MW6.6) Menyuan earthquake exhibited clear narrowband characteristics, with the strongest effect occurring around a period of 5.0 s, and this predominant period is between those of the MW6.4 Hualien earthquake and the MW7.0 Kumamoto earthquake. The result is determined by the fault mechanism and the narrowband characteristics of the directivity effects. The rupture directivity effects of strike-slip events are stronger than those of thrust faulting. For larger magnitude earthquakes, the rupture directivity effects tend to affect longer period motions, forming large velocity pulses with longer periods in the rupture forward direction (Shahi and Baker, 2011; Spudich et al., 2013; Spudich et al., 2014). The comparison shows that the BAY13 model may underestimate the amplification effects in the straight ahead rupture forward direction and is not yet able to reflect the predominant period characteristics of the rupture directivity effects, especially for the Menyuan and Hualian earthquakes. However, the adjusted model proposed by Sgobba et al. (2021) can distinguish the influence of the rupture directivity at different periods fairly well, but it slightly underestimates the amplification effects.
In this earthquake, two recordings with obvious velocity pulses were quantitatively identified. All of the pulse recordings were observed in the rupture forward direction (southeast of the fault), which is consistent with the characteristics of the rupture directivity effects. The amplification factor of the response spectra due to the large velocity pulses was up to 4.0–6.0, and the amplification effect was mainly distributed near the characteristic period of the pulse (Tp), which was notably related to resonance excited by a specific periodic pulse.
The directivity effect can significantly amplify the long-period ground motion intensity in the forward direction, which increases the uncertainty in the near-fault ground motion. For instance, the strike-slip MW7.0 Kumamoto earthquake in Japan was significantly affected by directivity effects, and the near-fault ground motion response spectra in the sensitive periods of 0.5–2.0 s for building structures even exceeded those of the MW7.9 Wenchuan earthquake (Xie et al., 2017). The long-period ground motion and large velocity pulses formed in the rupture forward direction often lead to major and irreparable damage to structures (Hall et al., 1995; Champion and Liel, 2012). The results of this paper provide an important reference for considering rupture directivity effects in seismic fortification of engineering structures in the near-source region.
As we know, the analysis of source effects during light magnitude earthquakes could be more challenging due to relatively lower signal-to-noise ratio. Supplementary Figure S2 shows a comparison of noise level of MEMS records observed during the Ms 5.2 aftershock with the Ms 6.9 mainshock by the station C0029. The comparison indicates the noise level was ∼0.1 cm/s2 during the aftershock. Although the signal-to-noise ratio of the aftershock records is smaller than that of the mainshock records, the signal-to-noise ratio of the aftershock records is greater than 3.0 in the frequency range of 0.1–10 Hz, which can meet the needs of our studies. Our results show that the widely used MEMS instruments in Qinghai and Gansu Province, were able to capture the near-source effects in the frequency range of engineering interests for both light and moderate earthquakes. Our analyses provide a potential way to assess rupture directivity effect analyses for future ground motion models and seismic hazard assessment, and for the study of light to moderate magnitude earthquakes in this region of northeastern Tibetan Plateau.
Data availability statement
The original contributions presented in the study are included in the article/Supplementary Material, further inquiries can be directed to the corresponding author.
Author contributions
JX is responsible for proposing idea, writing and editing of the manuscript. WW is responsible for instrument inspection and site condition survey, writing the manuscript, drawing the figure, and editing. ZA are responsible for the improvement of research ideas, writing and editing the manuscript. JX, WW, and ZA are contributed equally to this work and share first authorship. LK is responsible for editing the manuscript and helpful comments. XT and LW are responsible for instrument inspection, research plan and drawing the figures. SG is responsible for constructive comments. WZ and JY is responsible for writing, editing, and data collection. All authors contributed to the article and approved the submitted version.
Funding
This research was jointly financed by the Special Fund of the Institute of Geophysics, China Earthquake Administration (DQJB20B23), Gansu Youth Science and Technology Fund Project (Grant No. 21JR7RA793), the National Natural Science Foundation of China (Grant No. U2039206), and the Basic Scientific Research Fund, Science and Technology Innovation Base of Lanzhou, Institute of Earthquake Forecasting, China Earthquake Administration (Grant No. 2022IESLZ07).
Acknowledgments
We thank the National Strong Motion Observation Network System of the Institute of Engineering Mechanics, China Earthquake Administration for providing NSMONS data support for this study, and we also thank Gansu Earthquake Early Warning Center and Qinghai Earthquake Early Warning Center provided EEW data support for this study. We would like to thank editor Nicola Pino and two reviewers for their helpful comments, which greatly improved the manuscript. The geophysical maps produced in this study are produced using Generic Mapping Tools (GMT; Wessel and Smith, 1991).
Conflict of interest
The authors declare that the research was conducted in the absence of any commercial or financial relationships that could be construed as a potential conflict of interest.
Publisher’s note
All claims expressed in this article are solely those of the authors and do not necessarily represent those of their affiliated organizations, or those of the publisher, the editors and the reviewers. Any product that may be evaluated in this article, or claim that may be made by its manufacturer, is not guaranteed or endorsed by the publisher.
Supplementary material
The Supplementary Material for this article can be found online at: https://www.frontiersin.org/articles/10.3389/feart.2022.1068536/full#supplementary-material
Supplementary Figure S1 | Spatial distribution of residuals for various intensity measures, around the causative fault (rectangle). (A) PGA, PGV and short-period ground motion less than 1.0 s. (B) long-period ground motion above 1.0 s.
Supplementary Figure S2 | Comparison of noise level of MEMS records observed during the Ms 5.2 aftershock with the Ms 6.9 mainshock by the station C0029.
Supplementary Appendix S1 | Station information and ground motion parameters of 140 strong motion recordings observed in the MS6.9 Menyuan earthquake.
Supplementary Appendix S2 | Summary of the main features of NGA-West2 models.
References
Abrahamson, N. A., Silva, W. J., and Kamai, R. (2014). Summary of the ASK14 ground motion relation for active crustal regions. Earthq. Spectra 30 (3), 1025–1055. doi:10.1193/070913EQS198M
Akkar, S., and Boore, D. M. (2009). On baseline corrections and uncertainty in response spectra for baseline variations commonly encountered in digital accelerograph records. Bull. Seismol. Soc. Am. 99 (3), 1671–1690. doi:10.1785/0120080206
An, Z., Xie, J., Li, X., and Wen, Z. (2019). Directivity effects on strong ground motion from the February 6, 2018 MW6.4 Hualien earthquake. Chin. J. Geophys. 62 (12), 4658–4672. (In Chinese). doi:10.6038/cjg2019M0579
Ancheta, T. D., Darragh, R. B., Stewart, J. P., Seyhan, E., Silva, W. J., Chiou, B. S. J., et al. (2014). NGA-West2 database. Earthq. Spectra 30 (3), 989–1005. doi:10.1193/070913eqs197m
Baker, J. W. (2007). Quantitative classification of Near-Fault ground motions using wavelet analysis. Bull. Seismol. Soc. Am. 97 (5), 1486–1501. doi:10.1785/0120060255
Bao, X., Zhang, R., Wang, T., Shama, A., Zhan, R., Lv, J., et al. (2022). The source mechanism and fault movement characterization of the 2022 Mw6.7 menyuan earthquake revealed by the joint inversion with InSAR and teleseismic observations. Front. Environ. Sci. 2022, 823. doi:10.3389/fenvs.2022.917042
Bayless, J., and Somerville, P. (2013). “Bayless-somerville directivity model,” in Pacific earthquake engineering research center. Editor P. Spudich (Berkeley, CA. Chapter 2 of PEER Report No. 2013/09.
Boore, D. M. (2001). Effect of baseline corrections on displacements and response spectra for several recordings of the 1999 Chi-Chi, Taiwan, earthquake. Bull. Seismol. Soc. Am. 91 (5), 1199–1211. doi:10.1785/0120000703
Boore, D. M., Stewart, J. P., Seyhan, E., and Atkinson, G. M. (2014). NGA-West2 equations for predicting PGA, PGV, and 5% damped PSA for shallow crustal earthquakes. Earthq. Spectra 30 (3), 1057–1085. doi:10.1193/070113EQS184M
Bozorgnia, Y., Abrahamson, N. A., Atik, L. A., Ancheta, T. D., Atkinson, G. M., Baker, J. W., et al. (2014). NGA-West2 research project. Earthq. Spectra 30 (3), 973–987. doi:10.1193/072113eqs209m
Bray, J. D., and Rodriguez-Marek, A. (2004). Characterization of forward-directivity ground motions in the near-fault region. Soil Dyn. Earthq. Eng. 24 (11), 815–828. doi:10.1016/j.soildyn.2004.05.001
Campbell, K. W., and Bozorgnia, Y. (2014). NGA-West2 ground motion model for the average horizontal components of PGA, PGV, and 5% damped linear acceleration response spectra. Earthq. Spectra 30 (3), 1087–1115. doi:10.1193/062913EQS175M
Champion, C., and Liel, A. (2012). The effect of near-fault directivity on building seismic collapse risk. Earthq. Eng. Struct. Dyn. 41, 1391–1409. doi:10.1002/eqe.1188
China Earthquake Administration (CEA) (2022). Intensity map of the Ms 6.9 Menyuan earthquake in Qinghai province. (In Chinese) https://www.cea.gov.cn/cea/xwzx/fzjzyw/5646200/index.html.
Chiou, B. S. J., and Youngs, R. R. (2014). Update of the Chiou and Youngs NGA model for the average horizontal component of peak ground motion and response spectra. Earthq. Spectra 30 (3), 1117–1153. doi:10.1193/072813EQS219M
Fu, L., Li, X. J., Wang, F., and Chen, S. (2019). A study of site response and regional attenuation in the Longmen Shan region, eastern Tibetan plateau, SW China, from seismic recordings using the generalized inversion method. J. Asian Earth Sci. 181, 103887. doi:10.1016/j.jseaes.2019.103887
Gai, H. L., Li, Z. M., Yao, S. H., and Li, X. (2022). Preliminary investigation and research on surface rupture characteristics of the 2022 Qinghai menyuan Ms6.9 earthquake. Seismol. Geol. 44 (1), 238–255. (In Chinese). doi:10.3969/j.issn.0253-4967.2022.01.015
Hall, J. F., Heaton, T. H., Halling, M. W., and Wald, D. J. (1995). Near-source ground motion and its effects on flexible buildings. Earthq. Spectra 11 (4), 569–605. doi:10.1193/1.1585828
Han, L. B. (2022). Focal mechanism of 2022 menyuan MS6.9 earthquake in Qinghai Province. Prog. Earthq. Sci. 52 (2), 49–54. doi:10.19987/j.dzkxjz.2022-024
Hu, J. J., and Xie, L. L. (2011). Directivity in the basic parameters of the near-field acceleration ground motions during the Wenchuan earthquake. Chin. J. Geophys. 54 (10), 2581–2589. (In Chinese). doi:10.3969/j.issn.0001-5733.2011.10.015
Hu, J. J., Zhang, Y. J., and Xie, L. L. (2020). Effects of hanging wall/footwall ground motion on aseismic design spectra of China nuclear power plants. J. Vib. Shock 39 (19), 26–31. (In Chinese).
Institute of Geophysics, China Earthquake Administration (IGPCEA) (2022). The rupture process of the 6.9-magnitude earthquake in menyuan county, haibei prefecture, Qinghai province. (In Chinese) https://www.cea-igp.ac.cn/kydt/278809.html.
Liang, K., He, Z. T., Jiang, W. L., Li, Y. S., and Liu, Z. M. (2022). Surface rupture characteristics of the menyuan Ms6.9 earthquake on january 8, 2022, Qinghai Province. Seismol. Geol. 44 (1), 256–278. (In Chinese). doi:10.3969/j.issn.0253-4967.2022.01.016
McGuire, J. J. (2004). Estimating finite source properties of small earthquake ruptures. Bull. Seismol. Soc. Am. 94 (2), 377–393. doi:10.1785/0120030091
Qin, T. W., Wang, S. T., Feng, X. Z., and Lu, L. Y. (2021). A review on microtremor H/V spectral ratio method. Rev. Geophys. Planet. Phys. 52 (6), 587–622. (In Chinese). doi:10.19975/j.dqyxx.2021-003
Seyhan, E., and Stewart, J. P. (2014). Semi-empirical nonlinear site amplification from NGA-west2 data and simulations. Earthq. Spectra 30 (3), 1241–1256. doi:10.1193/063013EQS181M
Sgobba, S., Felicetta, C., Lanzano, G., Ramadan, F., Amico, M., and Pacor, F. (2021). NESS2.0: An updated version of the worldwide dataset for calibrating and adjusting ground- motion models in near source, Bull. Seismol. Soc. Am. 111(5), 2358–2378. doi:10.1785/0120210080
Shahi, S. K., and Baker, J. W. (2014). An efficient algorithm to identify strong-velocity pulses in multicomponent ground motions. Bull. Seismol. Soc. Am. 104 (5), 2456–2466. doi:10.1785/0120130191
Shahi, S. K., and Baker, J. W. (2011). An empirically calibrated framework for including the effects of near-fault directivity in probabilistic seismic hazard analysis. Bull. Seismol. Soc. Am. 101 (2), 742–755. doi:10.1785/0120100090
Shi, L, and Chen, S (2020). The applicability of site characteristic parameters measurement based on micro-tremor’s H/V spectra. J. Vib. Shock 39 (11), 138–145. (In Chinese).
Shi, Y. C. (1996). Characteristics of microtremor of sandy gravel site in Gobi desert, northwest of China. South China J. Seismol. 2, 46–52. (in Chinese).
Spudich, P., Bayless, J. R., Baker, J. W., Chiou, B. S., Rowshandel, B., Shahi, S. K., et al. (2013). PEER Report No. 2013/09 pacific earthquake engineering research center. UC Berkeley, CA.Final report of the NGA-West2 directivity working group
Spudich, P., Rowshandel, B., Shahi, S. K., Baker, J. W., and Chiou, B. S. J. (2014). Comparison of NGA-West2 directivity models. Earthq. Spectra 30 (3), 1199–1221. doi:10.1193/080313EQS222M
USGS (2022). Moment tensor of M6.6 earthquake in northern Qinghai, China). https://earthquake.usgs.gov/earthquakes/eventpage/us7000g9zq/moment-tensor.
Wald, D. J., and Allen, T. I. (2007). Topographic slope as a proxy for seismic site conditions and amplification. Bull. Seismol. Soc. Am. 97 (5), 1379–1395. doi:10.1785/0120060267
Xie, J., Wen, Z., and Gao, M. (2013). Recovery of co-seismic deformation from strong motion records during the Wenchuan earthquake. Acta Seismol. Sin. 35 (3), 369–379. (In Chinese). doi:10.3969/j.issn.0253-3782.2013.03.008
Xie, J., Zimmaro, P., Li, X., and Wen, Z. (2017). Rupture directivity effects on strong ground motion during the 15 April 2016 MW 7.0 Kumamoto earthquake in Japan. Bull. Seismol. Soc. Am. 107 (3), 1265–1276. doi:10.1785/0120160258
Xie, J-J., Wen, Z-P., Li, X-J., Li, Y-Q., Lv, H-S., and Huang, J-Y. (2012). Analysis of velocity pulses for near-fault strong motions from the Wenchuan earthquake based on wavelet method. Chin. J. Geophys. 55 (6), 1963–1972. (In Chinese). doi:10.6038/j.issn.0001-5733.2012.06.017
Xie, J., Li, X., Wen, Z., Jia, L., An, Z., Cui, J., et al. (2022a). Soil profile database and site classification for national strong-motion stations in western China. Seismol. Res. Lett. 93, 1930–1942. doi:10.1785/0220210271
Xie, J., An, Z., Fu, L., Li, K., Li, X., Wen, Z., et al. (2022b). Strong ground motions from the 21 may 2021 MS6.4 yangbi earthquake in western China obtained from a dense network of accelerographs and intensity meters. under review. doi:10.21203/rs.3.rs-977960/v1
Zhang, B., Li, X. J., Lin, G. L., Rong, M. S., Yu, Y. X., Wang, Y. S., et al. (2021). Analysis of strong ground motion characteristics and directivity effect in the near-field for the May 21, 2021 MS6.4 Yangbi earthquake. Chin. J. Geophys. 64 (10), 3619–3631. (In Chinese). doi:10.6038/cjg2021O05
Keywords: Menyuan earthquake, near-source ground motion, long-period, directivity, pulse
Citation: Xie J, Wang W, An Z, Li K, Tian X, Wu L, Gao S, Zhang W and Yuan J (2023) Quantification of rupture directivity effects on strong ground motion during the 8 January 2022 MS6.9 Menyuan earthquake in Qinghai, China. Front. Earth Sci. 10:1068536. doi: 10.3389/feart.2022.1068536
Received: 13 October 2022; Accepted: 28 December 2022;
Published: 12 January 2023.
Edited by:
Nicola Alessandro Pino, National Institute of Geophysics and Volcanology (INGV), ItalyReviewed by:
Baoning Wu, University of Southern California, United StatesFrancesca Pacor, Sezione di Milano, Italy
Copyright © 2023 Xie, Wang, An, Li, Tian, Wu, Gao, Zhang and Yuan. This is an open-access article distributed under the terms of the Creative Commons Attribution License (CC BY). The use, distribution or reproduction in other forums is permitted, provided the original author(s) and the copyright owner(s) are credited and that the original publication in this journal is cited, in accordance with accepted academic practice. No use, distribution or reproduction is permitted which does not comply with these terms.
*Correspondence: Junju Xie, eGllanVuanYwNUBtYWlscy51Y2FzLmFjLmNu
†These authors have contributed equally to this work and share first authorship