
94% of researchers rate our articles as excellent or good
Learn more about the work of our research integrity team to safeguard the quality of each article we publish.
Find out more
ORIGINAL RESEARCH article
Front. Earth Sci., 17 January 2023
Sec. Atmospheric Science
Volume 10 - 2022 | https://doi.org/10.3389/feart.2022.1066610
This article is part of the Research TopicAtmospheric Physics, Atmospheric Environment, and Atmospheric Effects on Human HealthView all 12 articles
A continuous haze event was recorded on November 14th∼17th, 2020 over Shijiazhuang. Two flights of King-air 350 meteorological research aircraft were performed on November 14th and 16th for the retrieval and observations of meteorological elements, aerosols, and black carbon. In this study, we combined airborne data with air pollution data (PM2.5), ground meteorological data, and ERA-5 reanalysis data to describe the vertical distribution of aerosols (namely 0.1–3.0 μm) and black carbon. We further explicated the formation of this haze event. PM2.5 pollution dominated this haze event, and the highest concentration of PM2.5 was 209 μg/m3. The intensity and height of thermal layers highly linked with the vertical transport of pollution. The highest number concentration of aerosols and black carbon was found below the thermal layers on both airborne sounding days. On the 14th, both BC and aerosol concentrations showed unimodal distribution, and the highest concentrations of BC and aerosols were 12683 ng/m3 and 6965.125#/L at 250 m within layer Ⅰ. The intensity of the thermal layer near-ground was weaker on the 16th that the number concentrations of BC and aerosols also remained at high levels in layer Ⅱ. Backward trajectories of air mass indicated the long-range transport of pollution contributed to the high level of pollution on the 16th. Vapor conditions were more favorable for aerosols growth through moisture absorption. The maximum concentration of 943.58#/L was recorded at particles with a diameter of 0.4 μm on the 16th, while 749.26#/L was reached at 0.14 μm on the 14th. The corresponding height was consistent with the height of maximum concentration in the vertical distribution.
Aerosols are the key components in earth-atmosphere system, affecting the global and regional climate (Anderson et al., 2003; Shi et al., 2008; Li et al., 2015), they can also severely harm the ecological environment and human health (Haywood and Boucher, 2000; Bond et al., 2013; Rao et al., 2013; Lei et al., 2016). They lay important forces on atmospheric circulation, precipitation distribution, and weather forecast (Jacobson, 2001). Through absorbing or scattering solar radiation (shortwave radiation), aerosols can heat the atmosphere or cool down the surface. Changing the thermal condition of the atmosphere, aerosols can further affect the vertical dynamic structure of the atmosphere. Therefore, to assess and calculate the direct and indirect radiation forcing from aerosols, we must form a clear picture of the vertical concentration distribution and particle size distribution of aerosols (Haywood and Boucher, 2000; Gobbi et al., 2004; Landman, 2010).
Black carbon (BC) is one of the key components of atmospheric aerosols (Janssen et al., 2012). As a strong absorbing component, BC can only absorb the visible wavelengths (Bond et al., 2013). They warm up the surrounding atmosphere, and to a great extent, this warming can offset the cooling caused by the scattering of atmospheric aerosols, in which BC will further influence local and global climate (Jacobson, 2001; Ramanathan and Carmichael, 2008).
Current instrumentation has been mainly mounted on sounding platforms, such as meteorological towers (Han et al., 2015), tethered balloons (Ran et al., 2016), remote sensing (Strawbridge and Snyder, 2004), and aircraft (Ding et al., 2009). Among, aircraft can collect data of the spatial distribution of aerosols and BC in real time. More importantly, the in-situ detection can reach higher altitudes and cover larger areas. The vertical distribution of aerosol showed a great correlation with the atmospheric structure (Johnson et al., 2000). The accumulation of aerosol particles was often found with thermal layers and high values of relative humidity (Sun et al., 2012; You et al., 2015). The number concentration of aerosols was distinct under different weather conditions and atmospheric structures (Yao et al., 2016). The vertical number concentration of aerosols followed a unimodal distribution (Fan et al., 2007), and the spectral width narrowed with increasing height (You et al., 2015). Li et al., 2014 found the spectral width of aerosols broadened with increasing height over the middle of Shanxi Province, China. In a stable atmosphere, BC concentration was higher in lower layers (Zhang et al., 2012), but evenly distributed in an unstable atmosphere (Lu et al., 2019). Besides, the vertical distribution of BC was different throughout the day (Li et al., 2015), and in different regions (Tan et al., 2022).
Zhang et al. (2013) have found that China was the main contributor to global BC emissions up to a quarter. Shijiazhuang is the capital of Hebei province and is located in the middle and southern parts of Hebei Province. Due to rapid economic growth and accelerated urbanization, this region has been facing severe pollution for past decades. Recent researches have been focused on the aerosols in this region but rarely refers to the BC. Zhai et al. (2011) analyzed the number concentration and particle spectrum of aerosols in the atmosphere based on near-ground aerosols data, as well as the causes of it. During 2005–2007autumn seasons in the Hebei region, Zhang et al. (2011) concluded that high values of aerosol number concentration near the ground were often found under different synoptic weather conditions with records of small wind speed, high relative humidity, and thermal invasion, or on haze days. Sun et al. (2013) analyzed airborne observations of aerosols over the middle and west of North China Plain during the 2010 autumn. They found that the main source of aerosols was from the underlying transport, and the transport efficiency was determined by thermal inversion layers and the wind shear within the boundary layer.
Air quality has been improved over Shijiazhuang region for the past years, however, heavily polluted events still occurred every now and then. Therefore, it is still needed to explore the vertical characteristics and the transport of pollution. We focused on the analysis of both ground and airborne observations for a continuous haze event recorded during November 14th∼ 17th, 2020 over Shijiazhuang. Specifically, we concluded the vertical distribution of both aerosols and BC based on two flights of airborne data, including the concentration, mean diameter, and particle spectrum of aerosols and BC. Potential sources of near-ground aerosols were also discussed.
Data and flight sounding description would be in “Data”. The following sections are in the order of “Weather and Pollution Background”, “Vertical Distribution of Pollutant Concentration”, “Backward Trajectory”, “Aerosol Spectrum Density Distribution”, and “Discussion”.
Ground hourly meteorological data was acquired from Zhengding station (38.15°N, 114.34°E), ground PM2.5 data was sourced from Zhengding (38.15°N, 114.59°E), wind profiler data was from Shijiazhuang (38.07°N, 114.35°E), and the geological distribution was illustrated in Figure 1.
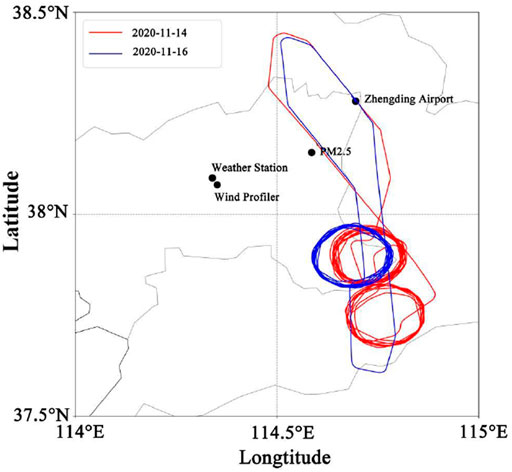
FIGURE 1. Flight trajectory on November 14th (red) and 16th (blue), 2020, and locations of observation stations.
King Air-350 meteorological aircraft was carried out for the vertical observations and the true airspeed was around 250–300 km/h. Two sounding flights were on November 14th 18:50 and 16th 18:00, 2020 (Beijing time). The time in this article would be Beijing Time unless specifically highlighted. The flight tracks were drawn in Figure 1. Under the left flight wing, PCASP-100X (Passive Cavity Aerosol Spectrometer Probe-100X) was mounted for aerosol observations. Meanwhile, the AE-33 model of the aethalometer was mounted for the black carbon acquisition.
The Passive Cavity Aerosol Spectrometer Probe 100-X (PCASP) is manufactured by Droplet Measurement Technologies (DMT). The PCASP-100X is an optical particle counter for measuring aerosol size distributions from 0.1μm to 3 μm in diameter. It uses the Mie scattering theory to derive aerosol particle size distribution (Zhao et al., 2018). The size is divided into 15 bins and the sampling frequency is 1 Hz. The sample flow volume in the PCASP-100X is set to 1 cm3/s. The details and detecting uncertainties of PCASP-100X can be found in Zhao et al. (2018) and Rosenberg et al. (2012).
In this study, Magee Scientific Aethalometer® Model AE33 is used to observe black carbon concentration. Two sample spots are collected from the same input air stream with different accumulation rates and the analysis of air is conducted simultaneously. The two results are combined mathematically to eliminate the “Filter Loading Effect” nonlinearity and accurately measure the aerosol concentration. The analysis will be performed at seven optical wavelengths spanning from the near-infrared (950 nm) to the near-ultraviolet (370 nm). The sequencing of illumination and analysis is performed on a 1Hz time base. This will present a complete spectrum of aerosol optical absorption with one data line every second.
Wind profiler is Doppler radars that have five antenna beams. The radar transmits electromagnetic pulses in five directions, in the order of north, east, south, west, and vertical direction. A wind profiler radar can derive atmospheric motion and wind information from the Doppler shift in the echoes produced under different atmospheric conditions (Wang et al., 2022). We use hourly wind data from the wind profiler manufactured by the China Aerospace Science & Industry Corporation (Liu et al., 2020).
The HYSPLIT-4 model is an open-access model from NOAA’s Air Resources Laboratory and can compute atmospheric transport, dispersion, and deposition of pollutants and hazardous materials (Stein et al., 2015). The model has been widely used in the analysis of air parcel trajectories and atmospheric pollution transportation (Li et al., 2019). The backward trajectory model meteorological background data input from the NCEP GDAS dataset, 4 times daily including 00, 06, 12, and 18UTC (08, 14, 20, 02 as in Beijing Time) output. The geological resolution of the GDAS dataset is 1°×1°.
During November 14th ∼ 17th 2020, a continuous haze event was recorded over the Shijiazhuang region. At 500 h Pa, the meridional circulation spanned over the mid-and high altitudes regions in East Asia. The cold air was impeded from moving southward. On the 13th, (first stage, Figures 2A, 3A), the atmospheric water vapor content was underprovided. The synoptic settings included a high-level ridge, a weak anticyclonic circulation lower level at 850 hPa, and a ground high-pressure field. The atmosphere was clear and cloudless, in favor of radiative cooling. As a result, water moisture and pollutants gradually accumulated near the ground, marking the beginning of this haze event. The second stage lasted from the 13th evening to the 14th daytime as a weak upper-level trough was passing through North China. In mid-to-low levels, moisture was brought by the weak southwest air flow. Near the ground, the uniform pressure field behind the high-pressure ridge further aggravated the pollution level. The synoptic background in the third stage was similar to the first stage, from the 14th nighttime to the 15th morning (Figures 2B, 3B), where the high level was under the control of a high-pressure ridge. The pressure field from high to low levels was even more stable during this time which reinforced the pollution event. The fourth stage was from the 15th afternoon to the 16th. The high-level field was under the control of westerly flows behind the high-pressure ridge. Near the ground, the wind speed was low. The continuous moisture supply facilitated the haze development. The highest concentration of PM2.5 was reached on the 16th at midnight. Afterward, southerly airflow at 850 hPa was getting stronger, and the low-pressure field took over near the ground. However, the cold air was rather to the west and the high-level trough slowly was moving to the east. Near the ground, the wind speed was rather low that cannot disperse atmospheric pollutants. On the 17th, atmospheric pollutants were removed due to the precipitation and the air quality improved.
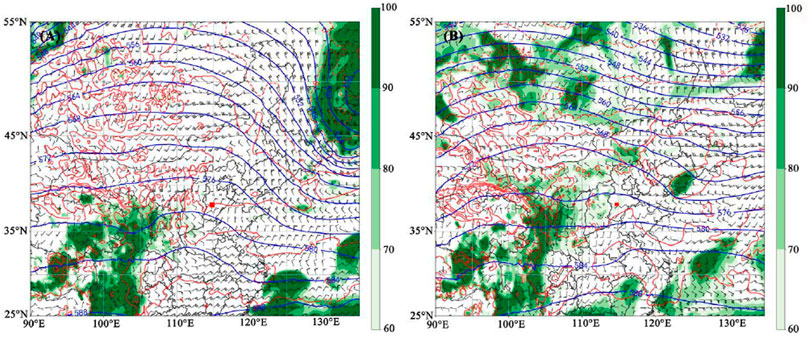
FIGURE 2. Upper-level synoptic weather at 08:00 2020 November 13th (A) and 08:00 2020 November 15th(B), among, blue lines denote 500 hPa geopotential height, red lines denote 850 hPa isothermals, and wind barbs represent wind field at 850 hPa. The red square is Shijiazhuang area.
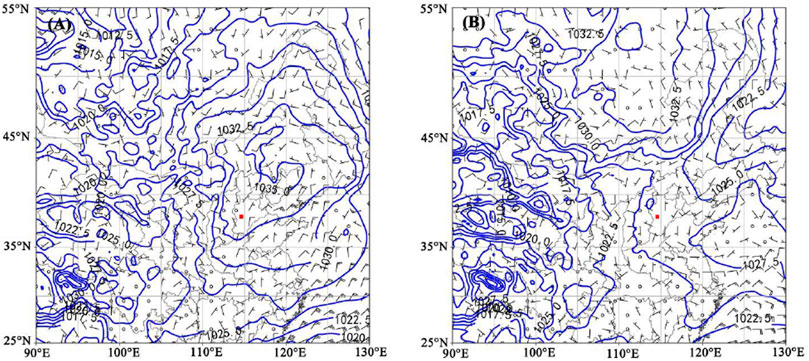
FIGURE 3. Sea level pressure at 08:00 2020 November 13th (A) and 08:00 2020 November 15th (B). The red square is Shijiazhuang area.
During this haze event, stable westerly air was dominated at high levels. In the early stage of this pollution event, water vapor was inadequate in the atmosphere but more sufficient in later stages. In the seal level pressure fields, the cold air was rather weak and located to the North (Figure 3), which was favorable for southwesterly air to transport moisture. Horizontal winds were small near the ground that pollutants were hardly dispersed.
The temporal variation of meteorological elements and pollution levels were shown in Figure 4, covering the whole polluted period between November 14th and 17th. The PM2.5 concentration remained above 75 μg/m3 on the 14th (early stage of the pollution event). It reached the highest concentration on the 16th (pollution accumulated and worsen) with a value of 209 μg/m3 and dramatically dropped below 50 μg/m3 on the 17th (pollution ended). During the 14th and 15th, the diurnal changes of temperature and relative humidity were quite the opposite. Temperature rose during the day but relative humidity decreased, and vice versa at night. Ground winds were mostly easterly and northwesterly and varied around 0.8∼1 m/s. In the afternoon, temperature dropped and the altitude of the boundary layer decreased. Meanwhile, pollution concentration near the ground increased. After the 15th at 14:00, the PM2.5 concentration started increasing from 119 μg/m3 to 209 μg/m3 on the 16th at 02:00. On the 16th, relative humidity remained at 65–75%, and the PM2.5 concentration varied around 150–209 μg/m3. A precipitation event occurred on the 17th. Due to the wet removal, the concentration of PM2.5 dropped dramatically and this pollution event came to an end.
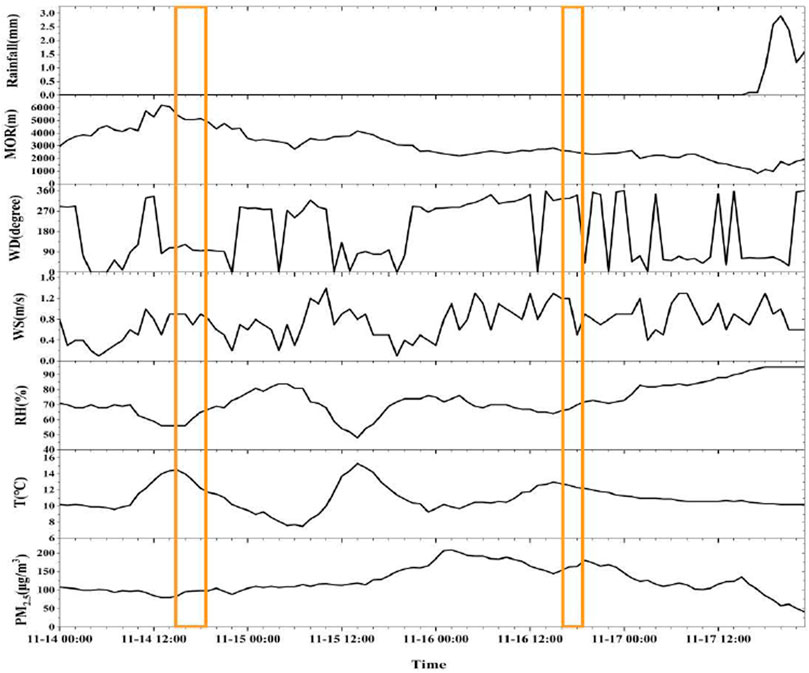
FIGURE 4. Time series of PM2.5, temperature (T), relative humidity (RH), wind speed (WS), wind direction (WD), visibility (MOR), and precipitation during the pollution event. The yellow boxes cover the periods of flight sounding.
As shown in Figure 5, no wind shear was recorded by the ground wind profiler radar before the 15th at 14:00. After that, wind shear was near 700 m and existed till the 17th at 04:00. As mentioned, ground PM2.5 concentration continued rising to the highest value (Figure 4). Afterward, the altitude of wind shear elevated and the pollution level was reduced. During the whole pollution event, the vertical motion of atmospheric air was rather weak which hinders the vertical transportation of pollutants.
King-Air 350 meteorological aircraft was employed on the 14th and 16th to investigate the vertical distribution of pollutants over Shijiazhuang. The properties of air mass can determine the declining rate of potential temperature (əθ/əz). Therefore, different layers were drawn based on the variation of əθ/əz (Yang et al., 2020), and we analyzed the distribution of pollutants in each layer. When the declining rate of potential temperature is zero (əθ/əz=0), the declining rate (γ) is the same as the dry adiabatic declining rate (Γ), define as the neutral layer; When əθ/əz>0, Γ<γ, defines as a stable layer; Otherwise as an unstable layer.
The vertical distribution of BC mass concentration, aerosol number concentration, mean diameter of aerosols, temperature, relative humidity, and the potential temperature was presented in Figure 6. According to the əθ/əz, we defined four layers including ground to 600 m, 600–1,200 m, 1,200–2,000 m, and 2,000 m above (labeled from Ⅰ to Ⅳ in Figure 6). For all four layers, the number of əθ/əz was positive with little variation. During this period, the vertical velocity was less than 1 m/s (Figure 5). All four layers were stable with weak atmospheric convection. Two thermal inversion layers were 1,150–1230m and 2,000–2,300 m, where the 1,150–1230 m layer was stronger with a variation of 2.7°C/100 m.
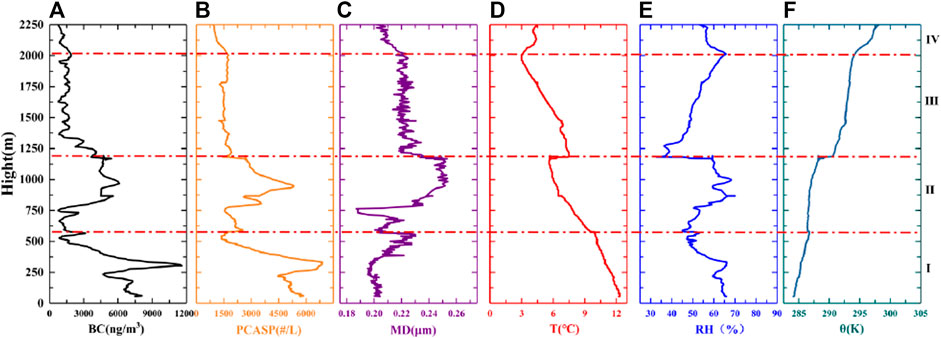
FIGURE 6. The vertical distribution of black carbon (BC) mass concentration (A), PCASP number concentration (B), PCASP mean diameter (MD, (C), temperature (T, (D), relative humidity (RH, (E), and potential temperature (θ, (F) during aircraft descending on 14 Nov 2020.
Layer Ⅰ and Ⅱ were within the same thermal inversion layer (Figure 6D). In layer Ⅰ, both BC and aerosol concentration showed unimodal distribution. The peak concentration of BC and aerosol were 12683 ng/m3 and 6965.125#/L, respectively. The mean particle diameter was around 0.2–0.225 μm. Near the ground, accumulated particles were mostly small particles. As shown in the backtrack trajectory (Figure 8A), pollution transportation from the underlying surface contributed to this heavily polluted layer. Our results accorded with what Sun et al. (2013) previously concluded. Within layer Ⅱ, the BC concentration fluctuated around 4,000–6,000 ng/m3 and the aerosol concentration peaked at 950 m with a value of 5438.416#/L. The mean diameter decreased from the top of layer Ⅰ to 800 m, and the minimum value was 0.188 μm. Near the top of layer Ⅱ (1,000–1200 m), the mean diameter was enlarged up to 0.25 μm. Thermal inversion can restrain the vertical transportation of pollution to the higher atmosphere, and hence, pollutants were accumulated below the thermal inversion layer. The peak values of both relative humidity and pollutant concentration appeared almost at the same altitude. For both layers Ⅰ and Ⅱ, aerosol concentration shows a better correlation result with relative humidity than BC concentration. The correlation coefficient of BC and aerosol concentration in layer Ⅰ is 0.66 and 0.92, respectively, and 0.74 and 0.9 in layer Ⅱ.
A distinct dropping in pollutant concentration was noted within the 1,150–1,200 m inversion layer. The upward transport of pollutants was impeded by this strong thermal inversion. The concentrations of BC and aerosol at 1150 m were 4292 ng/m3 and 2855.219#/L, respectively. At 1200m, the concentrations of BC and aerosol dropped to 537 ng/m3 and 1757.318#/L. Again, due to the thermal inversion, pollutants in layer Ⅱ cannot be transported into layer Ⅲ. Therefore, the concentrations of both BC and aerosol was comparatively low in layer Ⅲ. The concentrations range of BC and aerosol were 500–1500 ng/m3 and 1,200–1800#/L. Meanwhile, the mean diameter of aerosols was 0.22 μm with slight variation. Since the pollution concentration was already low in layers Ⅲ and Ⅳ, the thermal inversion at 2,000 m hardly affected the pollutant concentration.
The vertical profiling on the 16th was dived into three layers, including ground to 350 m, 350–1,000 m, and 1,000–1980 m (labeled as Ⅰ, Ⅱ, and Ⅲ in Figure 7). Two thermal inversion layers were defined in 350–400 m, and 800–1000 m. The 350–400 m inversion was relatively weak with a value of 0.43°C/100 m. Below each inversion layer, the relative humidity increased with height.

FIGURE 7. The vertical distribution of BC mass concentration (A), PCASP number concentration (B), PCASP mean diameter (MD, (C), temperature (T, (D), relative humidity (RH, (E), and potential temperature (θ, (F) during aircraft descending on 16 Nov 2020.
The layer Ⅰ was below the 350–400 m inversion layer. Above this inversion layer, the temperature remained almost unchanged around 400–500 m. This will block the vertical transportation of pollutants, and the pollutant concentration hardly changed with height within layer Ⅰ. The average mass concentration of BC and number concentration of aerosol are 8857.9 ng/m3 and 5964.458#/L. Near the inversion layer (350 m), the BC concentration dramatically dropped to 4000 ng/m3. Within this inversion layer, BC concentration rapidly increased to 9,633 ng/m3 at 400 m. Underlying pollutants can be transported to this altitude and upwards since the thermal inversion was weak (Figure 7D). Meanwhile, the number concentration of aerosols barely changed below and above the inversion layer. The weak thermal inversion near the ground hardly affected the vertical transport of aerosols but affected the BC distribution. Both BC and aerosols concentrations were maintained at relatively high levels in layer Ⅱ. The bottom isothermal layer (400–500 m) and the top inversion layer (800–1,000 m) were responsible for pollutant accumulation in this layer. The peak concentrations of BC and aerosol in the isothermal layer were 10422 ng/m3 and 6283.851#/L. Below the thermal inversion layer, the highest concentrations were 12873 ng/m3 and 6612.291#/L, respectively.
The intensity of thermal inversion in layer 800–1,000 m was 1°C/100 m and the pollutant concentration dropped rapidly within the inversion layer. At 800 m, BC and aerosol concentrations were 9379 ng/m3 and 5466.911#/L, and the concentrations dropped to 960 ng/m3 and 1,494.99#/L at 1,000 m, respectively. The mean diameter of aerosol particles varied around 0.21–0.22 μm in layers Ⅰ and Ⅱ. The aerosol concentration in layer Ⅲ decreased with height while BC concentration fluctuated at a low level. The thermal inversion at 800–1,000 m blocked the vertical transport of pollutants from layer Ⅱ.
On both the 14th and 16th, values of əθ/əz in all layers were higher than zero, which were all defined as stable layers. Hence, within these layers, thermal conditions were not favorable for the vertical transportation of pollution. Aerosol particles were enlarged through moisture absorption, which was confirmed by the increasing relative humidity. As a result, the aerosol concentration increased. On the 16th, the heights of thermal inversion layers were lower compared to the 14th. This led to pollution accumulation below the inversion layers and the peak concentrations were closer to the ground. Compared to the 14th, the BC concentration increased more significantly than the aerosol concentration on the 16th. At 55 m, the BC and aerosol concentrations were 9861 ng/m3 and 6662.823#/L on the 16th, but 6519 ng/m3 and 5797.351#/L on the 14th.
Regional transport has an important effect on the distribution of pollutants (Shen et al., 2022). To investigate the effect of regional transport on the vertical distribution of pollution, we chose the altitude with peak concentration values of and aerosols for backward trajectory simulation, which was 275m and 950 m on the 14th, and 625 m on the 16th, namely. The 48-h backward trajectories (UTC Time) were presented in Figure 8.
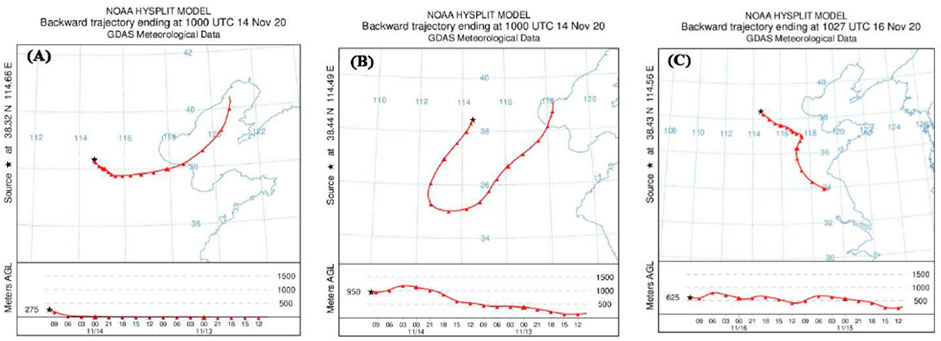
FIGURE 8. Backward trajectory of air mass during aircraft sounding period at 275 m (A) and 950 m (B) on 14 Nov 2020, and 625 m (C) on Nov16th, 2020.
On the 14th, the air masses at 275 m and 950 m both originated from the Bohai Sea but moved in different trajectories (Figures 8A,B). Before the 14th 14:00, the 275 m air mass was first moving towards the southwest and then northwest, close to the ground. Afterward, the air mass elevated till arriving at 275 m above the observation location. The concentration of PM2.5 in Hengshui and Cangzhou exceeded 110 μg/m3. This indicated that air at 275 m was mostly polluted from the underlying surfaces. The air mass at 950 m first moved further to the southwest and then to the northeast. After the 13th 20:00, the air mass rose from the ground till reaching 950 m. The high level of the polluted level at 950 m was a result of both thermal inversion blocking and distant transport of pollution. This trajectory detour was considered highly linked to atmospheric circulation. On the 16th (Figure 8C), the air mass originated from the Shanghai region and kept moving northwards to the observation location. After the 15th 08:00, the air mass reached the height of 500 m and stayed at this height. This indicated a relatively stable atmosphere, not favorable for pollution dispersal. To conclude, ground pollution was mostly from local sources but pollution in the higher air also came from distant regional sources. Besides, the southerly air was responsible for the distant transport of pollution.
The particle size distribution is one of the determining factors for aerosols’ transportation, lifetime, and optical properties in the atmosphere. Particles from different sources will show different features of spectral distribution. Besides, the atmospheric condition will largely affect the microphysical processes of moisture absorption and particle coagulation, and as a result of particle size spectrum will be changed (Sheng et al., 2003).
The aerosol spectral density distribution in the vertical observation phase was stratified with the same height according to the potential temperature. As shown in Figure 9A, aerosols were mostly dispersed in layers Ⅰ and Ⅱ on the 14th. From ground to 250 m, aerosol particles were distributed within the range of 0.12–0.45 μm. Around 250–400 m, high values were found at 0.125–0.15 μm and 0.2 μm. The corresponding height was consistent with the height of maximum concentration (Figure 6B). A diameter of 0.14 μm was recorded with the highest concentration of 749.26#/L. Since aerosols in layer Ⅰ were mostly from the underlying surface (Figure 8A), small particles took the majority in the transportation.
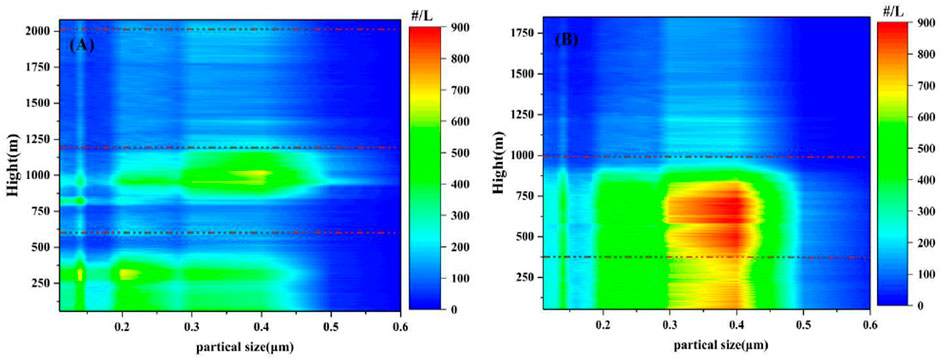
FIGURE 9. The particle size distribution of aerosols from PCASP probe during vertical soundings on November 14th (A) and 16th (B), 2020. The black dotted lines divide the vertical altitudes into four layers based on əθ/əz.
Compared to layer Ⅰ, aerosols in layer Ⅱ were larger with higher number concentrations. The diameter range was between 0.2 and 0.5 μm. Below the thermal inversion layer, the relative humidity was relatively high and aerosols can grow through moisture absorption (Figure 6E). The aerosol concentration peaked at 950 m and around this height particle within 0.35–0.45 μm also had the highest number concentration. The thermal inversion layer can block the vertical transport of pollutants, and thus, aerosol number concentrations were rather low in both layers Ⅲ and Ⅳ.
On the 16th, the aerosols were also mainly spread in layers Ⅰ and Ⅱ but the particle diameter enlarged into 0.35–0.4 μm (Figure 9B). Among, particles of 0.4 μm was found with a maximum concentration of 943.58#/L. The lapse rate of temperature in layers Ⅰ and Ⅱ was relatively small, indicating a stable atmosphere. Aerosols with concentrations higher than 600#/L were less in layer Ⅰ than in layer Ⅱ. Aerosols around 0.3–0.4 μm, the number concentration of particles were also less in layer Ⅰ than in layer Ⅱ. Again, the thermal inversion prevented the vertical transportation of pollutants to layer Ⅲ.
The relative humidity was higher on the 16th than the 14th, which was more favorable for particles growing through moisture absorption. On the 16th, both wind shear and thermal inversion exacerbated the pollution accumulation. Therefore, the diameters of aerosol particles were larger with higher number concentrations. The height of the thermal inversion layer was lower on the 16th. This also explained the higher aerosol concentration on the 16th below 800 m.
In this article, we analyzed a heavily polluted event that occurred in Shijiazhuang on November 14th∼17th, 2020. Ground and airborne meteorological and pollutant monitoring data were combined for the analysis of this heavily polluted event, specifically the meteorological causes and the vertical distribution of pollutants.
This heavy pollution event was dominated by PM2.5 with a highest concentration of 209 μg/m3. During the whole polluted period, the Shijiazhuang region was under the control of a high-pressure ridge. Winds were mostly westerly winds in the upper air but northerly near the ground. Ground winds were lower than 1 m/s and convergences were found in the ground wind field. The atmosphere maintained a stable status and the vertical motion was weak.
Pollutants were accumulated below the thermal inversion layer and the highest concentration was found on both the 14th and 16th just below the inversion layer. On the 14th, both BC and aerosol concentrations showed unimodal distribution, and the highest concentrations of BC and aerosols were 12683 ng/m3 and 6965.125#/L at 250 m within layer Ⅰ. In layer Ⅱ, the concentrations of BC and aerosols were distinctly low due to the transport inhibition of the thermal layer. On the 16th, the thermal layer near ground was rather weak that pollutants in layer Ⅰ can be transported into layer Ⅱ.
Distant transport of pollutants also contributed to this continuous haze event. On the16th, before reaching the Shijiazhuang region, air mass in layer Ⅰ was moving close to the ground. Apart from the vertical transport of the underlying surfaces, the continuous high-level pollution in layer Ⅱ was also sourced from regional transport.
Aerosols were mostly dispersed in layers Ⅰ and Ⅱ on both 14th and 16th. On the 14th, small particles within 0.125–0.15 μm were the most particles near the ground where below the inversion layer 1,150–1230 m large aerosols around 0.4 μm had the highest concentration. On the 16th, the thermal and vapor conditions were more favorable for aerosol accumulation.
The raw data supporting the conclusions of this article will be made available by the authors, without undue reservation.
XUZ was the main contributor. XS contributed to analysis and translation. YY was for peer-review. XIZ contributed to weather analysis. YH and ZH contributed to data analysis. YC contributed to the graphics.
This work was supported by the National Key Research and Development Program of China (Grant 2019YFC1510301), the Hebei province Key Research and Development project (Grants 20375402D and 19275420D), Key Laboratory for Cloud Physics of China Meteorological Administration supported by (KDW 1904), Hebei Meteorological Service Scientific Research and Development Project (20ky28 and 21ky12).
The authors declare that the research was conducted in the absence of any commercial or financial relationships that could be construed as a potential conflict of interest.
All claims expressed in this article are solely those of the authors and do not necessarily represent those of their affiliated organizations, or those of the publisher, the editors and the reviewers. Any product that may be evaluated in this article, or claim that may be made by its manufacturer, is not guaranteed or endorsed by the publisher.
Anderson, T. L., Charlson, R. J., Schwartz, S. E., Knutti, R., Boucher, O., Rodhe, H., et al. (2003). Climate forcing by aerosols-a hazy picture. Science 300 (20), 1103–1104. doi:10.1126/science.1084777
Bond, T. C., Doherty, S. J., Fahey, D. W., Forster, P. M., Berntsen, T., DeAngelo, B. J., et al. (2013). Bounding the role of black carbon in the climate system: A scientific assessment. J. Geophys. Res. Atmos. 118 (11), 5380–5552. doi:10.1002/jgrd.50171
Ding, A., Wang, T., Xue, L., Gao, J., Stohl, A., Lei, H., et al. (2009). Transport of north China air pollution by midlatitude cyclones: Case study of aircraft measurements in summer 2007. J. Geophys. Res. 114 (D8), D08304. doi:10.1029/2008JD011023
Fan, Y., Guo, X. L., Fu, D. H., and Li, H. Y. (2007). Observational studies on aerosol distribution during August to September in 2004 over Beijing and its surrounding areas. Clim. Environ. Res. 12 (1), 49–62. doi:10.3969/j.issn.1006-9585.2007.01.006
Gobbi, G. P., Barnaba, F., and Ammannato, L. (2004). The vertical distribution of aerosols, Saharan dust and cirrus clouds in Rome (Italy) in the year 2001. Atmos. Chem. Phys. 4 (2), 351–359. doi:10.5194/acp-4-351-2004
Han, S., Zhang, Y., Wu, J., Zhang, X., Tian, Y., Wang, Y., et al. (2015). Evaluation of regional background particulate matter concentration based on vertical distribution characteristics. Atmos. Chem. Phys. 15 (19), 11165–11177. doi:10.5194/acp-15-11165-2015
Haywood, J., and Boucher, O. (2000). Estimates of the direct and indirect radiative forcing due to tropospheric aerosols: A review. Rev. Geophys. 38 (4), 513–543. doi:10.1029/1999RG000078
Jacobson, M. Z. (2001). Strong radiative heating due to the mixing state of black carbon in atmospheric aerosols. Nature 409 (6821), 695–697. doi:10.1038/35055518
Janssen, N. A., Gerlofs-Nijland, M. E., Lanki, T., Salonen, R. O., Cassee, F., Hoek, G., et al. (2012). Health effects of black carbon. Copenhagen, Denmark: World Health Organization.
Johnson, D. W., Osborne, S., Wood, R., Suhre, K., Quinn, P. K., Bates, T., et al. (2000). Observations of the evolution of the aerosol, cloud and boundary-layer characteristics during the 1st ACE-2 Lagrangian experiment. Tellus B Chem. Phys. Meteorology 52 (2), 348–374. doi:10.3402/tellusb.v52i2.16118
Landman, W. (2010). Climate change 2007: The physical science basis. South Afr. Geogr. J. 92 (1), 86–87. doi:10.1080/03736245.2010.480842
Lei, X., Xiu, G., Li, B., Zhang, K., and Zhao, M. (2016). Individual exposure of graduate students to PM2.5 and black carbon in Shanghai, China. Environ. Sci. Pollut. Res. 23 (12), 12120–12127. doi:10.1007/s11356-016-6422-x
Li, J., Fu, Q., Huo, J., Wang, D., Yang, W., Bian, Q., et al. (2015). Tethered balloon-based black carbon profiles within the lower troposphere of Shanghai in the 2013 East China smog. Atmos. Environ. 123 (B), 327–338. doi:10.1016/j.atmosenv.2015.08.096
Li, J. X., Yin, Y., Li, P. R., Li, R. J., Jin, L. J., and Li, J. (2014). Aircraft measurements of aerosol spatial distribution properties in Shanxi Province in summer. China Environ. Sci. 34 (8), 1950–1959.
Li, P. R., Xiao, T. G., and Wang, M. Y. (2019). Study on typical continuous heavily polluted weather in Chengdu area based on wind profiler radar. Acta Sci. Circumstantiae 39 (12), 4174–4186. doi:10.13671/j.hjkxxb.2019.0332
Li, Y. J., Lee, B. P., Su, L., Fung, J. C. H., and Chan, C. K. (2015). Seasonal characteristics of fine particulate matter (PM) based on high resolution time-of-flight aerosol mass spectrometric (HR-ToF-AMS) measurements at the HKUST Supersite in Hong Kong. Atmos. Chem. Phys. 15, 37–53. doi:10.5194/acp-15-37-2015
Liu, B., Guo, J., Gong, W., Shi, L., and Ma, Y. (2020). Characteristics and performance of vertical winds as observed by the radar wind profiler network of China. Atmos. Meas. Tech. 13, 4589–4600. doi:10.5194/amt-2020-75
Lu, Y., Zhu, B., Huang, Y., Shi, S. S., Wang, H. L., An, J., et al. (2019). Vertical distributions of black carbon aerosols over rural areas of the Yangtze River Delta in winter. Sci. Total Environ. 661 (APR.15), 1–9. doi:10.1016/j.scitotenv.2019.01.170
Ramanathan, V., and Carmichael, G. (2008). Global and regional climate changes due to black carbon. Nat. Geosci. 1 (4), 221–227. doi:10.1038/ngeo156
Ran, L., Deng, Z., Xu, X., Yan, P., Lin, W., Wang, Y., et al. (2016). Vertical profiles of black carbon measured by a micro-aethalometer in summer in the North China Plain. Atmos. Chem. Phys. 16 (16), 10441–10454. doi:10.5194/acp-16-10441-2016
Rao, S., Pachauri, S., Dentener, F., Kinney, P., Klimont, Z., Riahi, K., et al. (2013). Better air for better health: Forging synergies in policies for energy access, climate change and air pollution. Glob. Environ. Change 23 (5), 1122–1130. doi:10.1016/j.gloenvcha.2013.05.003
Rosenberg, P. D., Dean, A. R., Williams, P. I., Dorsey, J. R., Minikin, A., Pickering, M. A., et al. (2012). Particle sizing calibration with refractive index correction for light scattering optical particle counters and impacts upon pcasp and cdp data collected during the fennec campaign. Atmos. Meas. Tech. 5, 1147–1163. doi:10.5194/amt-5-1147-2012
Shen, L., Zhao, T., Liu, J., Wang, H., Bai, Y., Kong, A., et al. (2022). Regional transport patterns for heavy PM2.5 pollution driven by strong cold airflows in Twain-Hu Basin, Central China. Atmos. Environ. 269 (15), 118847. doi:10.1016/j.atmosenv.2021.118847
Sheng, P. X., Mao, J. T., Li, J. G., Zhang, A. C., Sang, J. G., and Pan, N. X. (2003). Atmospheric physics.
Shi, G. Y., Wang, B., Zhang, H., Zhao, J. Q., Tan, S. C., and Wen, T. X. (2008). The radiative and climatic effects of atmospheric aerosols. Chin. J. Atmos. Sci. 32 (4), 826–840. doi:10.3878/j.issn.1006-9895.2008.04.11
Stein, A. F., Draxler, R. R., Rolph, G. D., Stunder, J. B., Cohen, M. D., and Ngan, F. (2015). NOAA’s HYSPLIT atmospheric transport and dispersion modeling system. Bull. Am. Meteorol. Soc. 96 (12), 2059–2077. doi:10.1175/BAMS-D-14-00110.1
Strawbridge, K. B., and Snyder, B. J. (2004). Daytime and nighttime aircraft lidar measurements showing evidence of particulate matter transport into the Northeastern valleys of the Lower Fraser Valley, BC. Atmos. Environ. 38 (34), 5873–5886. doi:10.1016/j.atmosenv.2003.10.036
Sun, Y. W., Sun, X., Yin, Y., Han, Y., Dong, X. B., Jiang, Y., et al. (2012). Aerosol distribution in North China Plain under different weather conditions. China Environ. Sci. 32 (10), 1736–1743.
Sun, Y. W., Sun, X., Yin, Y., and Han, Y. (2013). Observation study of aerosol over mid-western north China plain in autumn (October). Plateau Meteorol. 32 (5), 1308–1320. doi:10.7522/j.issn.1000-0534.2012.00123
Tan, Y., Wang, H., Zhu, B., Zhao, T., Shi, S., Liu, A., et al. (2022). The interaction between black carbon and planetary boundary layer in the Yangtze River Delta from 2015 to 2020: Why O3 didn't decline so significantly as PM2. 5. Environ. Res. 214, 114095. doi:10.1016/j.envres.2022.114095
Wang, C., Chen, M., and Chen, Y. D. (2022). Impact of combined assimilation of wind profiler and Doppler radar data on a convective-scale cycling forecasting system. Mon. Weather Rev. 150 (2), 431–450. doi:10.1175/MWR-D-20-0383.1
Yang, Y. M., Zhou, Y. Q., and Cai, Z. X. (2020). A case study of aircraft observation of aerosol vertical distribution and activation characteristics. Meteorol. Mon. 46 (9), 1199–1209. doi:10.7519/j.issn.1000-0526.2020.09.007
Yao, Q., Liu, J. L., Han, S. Q., and Fan, W. Y. (2016). Pollution characteristics and number concentration of atmospheric aerosol during spring festival in Tianjin. Meteorol. Mon. 42 (4), 443–449. doi:10.7519/j.issn.1000-0526.2016.04.007
You, J. P., Gao, J. Q., Huang, M. Y., Zhang, X. X., Zhao, B., Lin, J. J., et al. (2015). Analysis of the characteristics of the aircraft-observed atmospheric aerosols in Pearl River Delta. J. Trop. Meteorology 31 (1), 71–77. doi:10.16032/j.issn.1004-4965.2015.01.008
Zhai, Q. F., Jin, L. J., Lin, Z. Y., Wu, Z. H., and Kuang, S. S. (2011). Observational characteristic of aerosol number concentration and size distribution at Shijiazhuang in spring season. China Environ. Sci. 31 (6), 886–891.
Zhang, D. Z., Chen, B., Yamada, M., Niu, H. Y., Wang, B., Iwasaka, Y., et al. (2012). Elevated soot layer in polluted urban atmosphere: A case study in beijing. J. Meteorological Soc. Jpn. 90 (3), 361–375. doi:10.2151/jmsj.2012-302
Zhang, N., Qin, Y., and Xie, S. D. (2013). Spatial distribution of black carbon emissions in China. Chin. Sci. Bull. 58 (19), 3830–3839. doi:10.1007/s11434-013-5820-4
Zhang, Y., Yin, Y., Shi, L. X., Duan, Y., and Wu, Z. H. (2011). An observational study of the aerosol distributions over Hebei area during autumn. J. Meteorological Sci. 31 (6), 755–762. doi:10.3969/j.issn.1009-0827.2011.06.013
Keywords: aerosols, black carbon, vertical distribution, airborne observation, particle size distribution
Citation: Zhou X, Sun X, Yang Y, Zhang X, Huang Z, Cui Y and Huang Y (2023) Aircraft observations on a continuous haze pollution event in Shijiazhuang area. Front. Earth Sci. 10:1066610. doi: 10.3389/feart.2022.1066610
Received: 11 October 2022; Accepted: 03 November 2022;
Published: 17 January 2023.
Edited by:
Honglei Wang, Nanjing University of Information Science and Technology, ChinaReviewed by:
Ruiguang Xu, Hebei University of Engineering, ChinaCopyright © 2023 Zhou, Sun, Yang, Zhang, Huang, Cui and Huang. This is an open-access article distributed under the terms of the Creative Commons Attribution License (CC BY). The use, distribution or reproduction in other forums is permitted, provided the original author(s) and the copyright owner(s) are credited and that the original publication in this journal is cited, in accordance with accepted academic practice. No use, distribution or reproduction is permitted which does not comply with these terms.
*Correspondence: Yang Yang, eWFuZ3lhbmdAaGVid21vLmNu
Disclaimer: All claims expressed in this article are solely those of the authors and do not necessarily represent those of their affiliated organizations, or those of the publisher, the editors and the reviewers. Any product that may be evaluated in this article or claim that may be made by its manufacturer is not guaranteed or endorsed by the publisher.
Research integrity at Frontiers

Learn more about the work of our research integrity team to safeguard the quality of each article we publish.