 Weilai Wang
 Guangyao Cai
 Jianping Wu
 Lihua Fang
- Institute of Geophysics, China Earthquake Administration, Beijing, China
It is essential to investigate the spatial distribution of the lithosphere and asthenosphere in detail, to further obtain the understanding of the effect of plate collision and the process of orogenic movement. From the joint inversion of receiver functions and surface waves, the three-dimensional S-wave velocity structure results down to 200 km depth in the study area were obtained at 1,843 seismic stations. Analysis was performed on the sedimentary thickness, crustal thickness, lower crustal wave velocity, and lithospheric thickness. According to the crustal thickness, we evaluated the distribution of low-velocity zones in the lower crust. The results show that there are low-velocity bodies in the lower crust in the Qinling tectonic belt, but they are not connected, indicating that they may not be able to be used as a channel for material extrusion from the NE Tibetan Plateau at the crustal scale. According to the section results and the depth distribution of the lithosphere-astenosphere boundary, a relatively thick lithosphere exists below the Sichuan Basin and Ordos Basin, and the lithosphere in the east of the study area is relatively thin with a thickness of about 60–80 km, indicating that the lithosphere in the east of the study area has been severely destructed and restructured. The delamination has been observed in the lithosphere under the Songpan-Ganzi Block, showing characteristics of vertical movement of asthenosphere materials. There is a relatively thick low-velocity zone at the top of the mantle lithosphere of the NE plateau; however, it does not exist under the relatively stable Sichuan Basin and the Ordos Block. Compared with the Sichuan Basin and the Ordos Basin at both sides, the Qinling tectonic belt has a low-velocity zone at the depth of 100–160 km, which may be asthenosphere material. In combination with the polarization direction characteristics of the SKS wave, it is clearly observed that asthenospheric material movement exists in an approximate east-west direction beneath the Qinling tectonic belt. Therefore, the asthenosphere beneath the Qinling tectonic belt may serve as an important channel for material extrusion in the NE Tibetan Plateau.
1 Introduction
Since the Indian-Eurasian plate collision, as the Tibetan Plateau continued to develop toward the northeast (England and Houseman 1986; Tapponnier et al., 2001), the surface uplift and orogeny has occurred in the northeastern margin about 1,000 km away from the convergent front since the middle and late Cenozoic era (Molnar and Tapponnier, 1975). The northward subduction from India to Asia has played an important role in the rise and growth of the plateau. At the northernmost tip of the Tibetan Plateau, the Qilian tectonic belt developed on the southern margin of the North China Craton, and has been shortening along NE-SW at a rate of 13 mm/year (Yin and Harrison, 2000). However, it is unknown whether there is a weak lower crustal flow model on the NE Tibetan Plateau. Therefore, it is of great significance to study the characteristics of the crustal structure in detail, evaluate the lower crustal flow model, and understand the main mechanism of deformation in the northeastern margin of the plateau.
The NE Tibetan Plateau is the intersection area of the Tibetan Plateau Block and the North China Craton/the Yangtze Craton (see Figure 1 for the study area). The Qingling-Dabie orogenic belt is the main component of the gigantic central orogenic belt that crosses China from east to west and divides China into northern and southern parts. It is the structural junction zone of North China and the Yangtze continents and a typical collision orogenic belt (Zhang et al., 1995). With the northward subduction of the Indian lithosphere, the Tibetan asthenosphere has been largely compressed (Huang and Zhao, 2006; Li et al., 2008), and the material in the asthenosphere is compressed similar to the lithosphere (Tapponnier et al., 2001; Vinnik et al., 1992; Silver and Holt, 2002). It is speculated that below the Qinling-Dabie tectonic belt there is an escape channel of the asthenosphere material (Yu and Chen, 2016; Chang et al., 2017). In the tectonic activities, what is the relationship between the lithosphere of the plateau and the lithosphere of the adjacent craton, and the degree of erosion and destruction of the craton lithosphere. The geodynamic process of continental evolution not only occurs on the entire lithosphere scale, but also reaches hundreds of kilometers deep inside the upper mantle. The geophysical background zone with high rigidity of mantle in the lithosphere may hinder the migration of mantle-derived materials derived from the deep region, and the discontinuity between different lithospheres may be a good channel for mantle-derived materials. Therefore, it is essential to investigate the spatial distribution of the lithosphere and asthenosphere in detail, to further the understanding of the effect of plate collision and the process of orogenic movement.
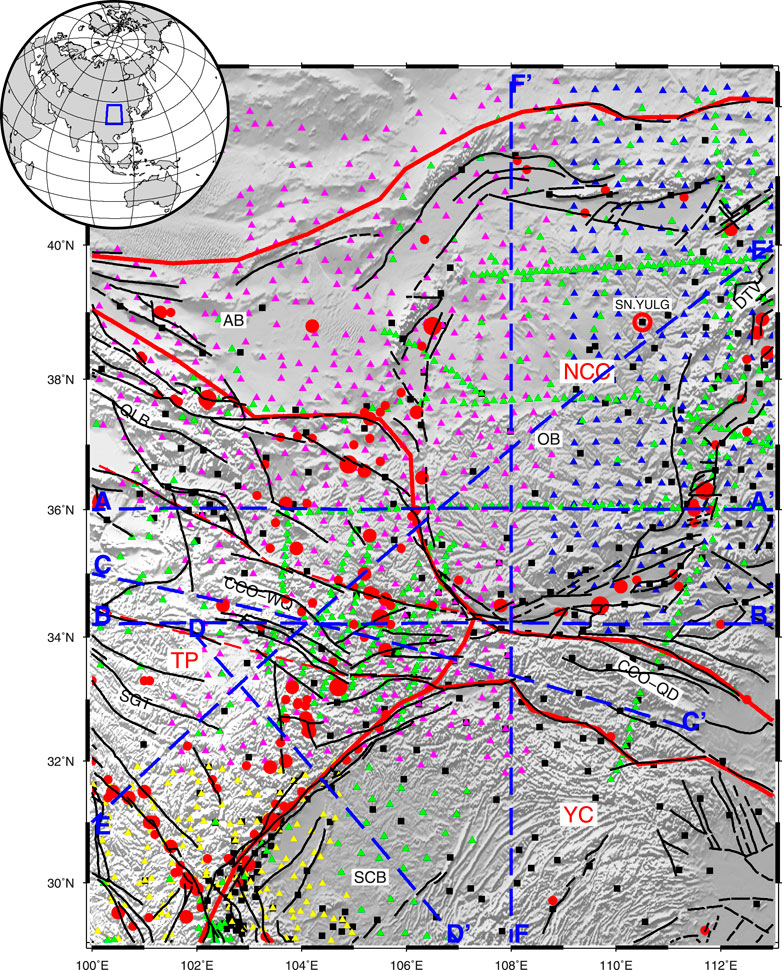
FIGURE 1. Distribution of seismic stations and regional tectonic units (revised from Zhao et al., 2005). Black squares: permanent stations, Yellow triangles: western Sichuan array, Red triangles: ChinArray-Himalaya Phase Ⅱ, Blue triangles: ChinArray-Himalaya Phase Ⅲ, Green triangles: Other temporary stations. Red circles mark M ≥6 earthquakes, Blue dashed lines represent sections. and Black lines and red dashed lines represent faults and tectonic boundaries, respectively. TP: Tibetan plateau; YC: Yangtze Craton; CAOB: Central Asia Orogenic Belt; NCC: North China Craton; SGT: Songpan-Garze Terrane; QLB: Qilian tectonic belt; OB: Ordos Block; AB: Alxa Block; CCO: Central China Orogen (or Qinling tectonic belt); WQ: Western Qinling; QD: Qinling Dabie.
The transformation or destruction of the lithosphere and the distribution of the asthenosphere are related to the hot material activity. According to the transmission characteristics of the body waves, the S-wave velocity structure is closely related to the shear modulus of the earth’s internal medium. Compared with the P-wave, the S-wave is more sensitive to the asthenosphere and hot materials. However, most of the studies on the three-dimensional velocity structure above the depth of 150 km in the NE Tibetan Plateau and surrounding craton basins are P-wave travel time tomography (Li et al., 2008; Tian et al., 2009; Tian and Zhao, 2011; Guo et al., 2017). At present, the information regarding S-wave velocity structure of the lithosphere-asthenosphere on the NE Tibetan Plateau mostly comes from large-scale surface wave inversion (Huang et al., 2003; Huang et al., 2009; Bao et al., 2013; Bao et al., 2015; Yang et al., 2013; Wei et al., 2015; Shen et al., 2016; Wei et al., 2017), revealing that the high-velocity body beneath the Ordos and Sichuan basins can extend up to 200 km in depth, while the velocity in the lithosphere on the NE Tibetan Plateau is relatively low. However, since surface waves mainly reflect the average effect of S-wave velocity in a certain range of depth and it is difficult to delineate the fine fluctuation characteristics of important interfaces (such as Moho and lithosphere-astenosphere boundary, LAB), only qualitative discussion of the asthenosphere can be obtained. The receiver function has a unique advantage in determining the depth of the interfaces showing discontinuity of the velocity. The joint inversion can utilize their advantages and effectively reduce the non-uniqueness of the single type data inversion results. The joint inversion of receiver functions and surface wave has been applied to multiple studies on the deep structure of the NE Tibetan Plateau (Zheng et al., 2016; Guo et al., 2017; Li et al., 2017; Wang et al., 2017; Ye et al., 2017; Ye et al., 2018), which have revealed high-resolution structural images of the region and certain observation sections, but the results obtained were basically limited within the depth of 100 km, without revealing relatively complete structural characteristics of lithosphere-asthenosphere. Huang et al. (2009) presented the S-wave velocity structure of the crust and upper mantle (0–300 km) through surface wave tomography and inversion of North China. Wang et al. (2017) used the receiver function and surface wave inversion to obtain the three-dimensional velocity structure down to 100 km depth in the northeastern margin of the Tibetan Plateau, and analyzed the thickness of the sedimentary layer and crust as well as Poisson’s ratio in the study area. However, the distribution characteristics of the deep structure of the complete lithosphere and asthenosphere were not given. Detailed images of the deep structure play an important role in understanding the mantle dynamics in NE Tibetan Plateau. Guo and Chen (2017) applied the joint inversion of background noise and the receiver function to obtain a three-dimensional velocity structure within the depth of 100 km in the NE Tibetan Plateau. It is believed that there exists an asthenosphere channel flow from west to east beneath the Qinling-Dabie tectonic belt south of Ordos. Wu et al. (2022) obtained the 3D velocity structure of Ordos and its surrounding areas at a depth down to 200 km from a joint inversion method of receiver function and surface wave. Their results shown the Ordos lithosphere is characterized by thick in the middle and thin in the periphery. However, the 3D structure between the NE Tibetan Plateau and its surrounding cratonic basin is not fully presented.
In this study, we select receiver functions at each station with different filtering parameters and better azimuthal coverage within 2–4 slowness ranges, and stack them to obtain the average receiver functions for different slowness ranges, which can reduce the influence of local lateral inhomogeneity of media near the station and increase the reliability of deep velocity anomalies. By surface wave tomography, the Rayleigh wave phase velocity at periods as long as 150s beneath each station can be obtained. Combing the receiver functions at different slowness ranges with surface dispersion at long periods, the S-wave velocity structure down to 200 km depth can be constrained by the joint inversion. From the observation data of 1,857 broadband seismic stations in the NE Tibetan Plateau and its surrounding areas, the 3D S-wave velocity structure model of the study area within a depth of 200 km is obtained, and the distribution characteristics of the sedimentary layer, crust-mantle boundary, and lithosphere are analyzed. This study explores the characteristics of the NE Tibetan Plateau and its nearby cratonic lithosphere, which has been through transformation and destruction. It will facilitate the in-depth understanding of the deep material migration in this region and geodynamic processes.
2 Data and method
2.1 Data
To obtain the fine structure of the crust and upper mantle and the tectonic characteristics of seismic activity in the NE Tibetan Plateau and the surrounding craton basin, a series of observations from field portable seismic station arrays have been carried out in this region (for example, the western Sichuan array, from October 2006 to July 2009; ChinArray-Himalaya Phase II, from December 2013 to May 2016; ChinArray-Himalaya Phase Ⅲ, from March 2016 to December 2020). Together with the permanent stations in the surrounding area, a densely distributed seismic observation array (1,957 stations) has been formed to cover the whole region (see Figure 1), with an average inter-station distance of approximately 35 km. The receiver function used in the joint inversion in this study is based on the receiver function extraction technique of the maximum entropy deconvolution that obtains high signal-to-noise ratio receiver functions with an epicenter distance between 30°–90° and a magnitude greater than 5.5, recorded at each station in the study area (Wang et al., 2017a).
2.2 Surface wave tomography
Jin and Gaherty (2015) proposed to use dense seismic array to retrieve the phase velocity map of surface wave, and improved it on the basis of Eikonal equation and Helmholtz equation, and developed the automatic surface wave measurement system (ASWMS) to carry out surface wave tomography. In this study, we use the software ASWMS to obtain the phase velocity maps based on Eikonal equation.
The main two steps of the method are as follows (Lin et al., 2009; Jin and Gaherty, 2015; Zhong et al., 2017; Cai et al., 2021): 1) Phase delay measurement between the source and stations. The five parameter Gaussian wavelet function (Gee and Jordan, 1992) can fit the cross-correlation function after the Gaussian narrowband filtering well, in which the Gauss wavelet function is equal to the product of Gaussian envelope function and cosine function, which is usually expressed as:
2) Phase velocity estimation via Eikonal equation. The relationship between phase delay time and slowness vector between two adjacent stations can be expressed by vector field integral
The first term of the right-hand side is the mismatch between the observed and the predicted phase delay; the second term is the constraint of slowness smoothness, λ represents the smoothing factor, which is related with frequency.
The study area is divided into the grids of 0.25° × 0.25°, and the surface wave tomography research based on Eikonal equation is carried out. In order to reduce the measurement error of surface wave dispersion, the phase velocity results on each grid point are used to fit the direction and amplitude of the fast wave with π as period to remove the influence of anisotropy. Figure 2 shows the earthquake distribution, station distribution, and surface wave waveform recorded by array. Figure 3 shows the Rayleigh wave phase velocity, the corresponding uncertainty and ray density distribution maps.
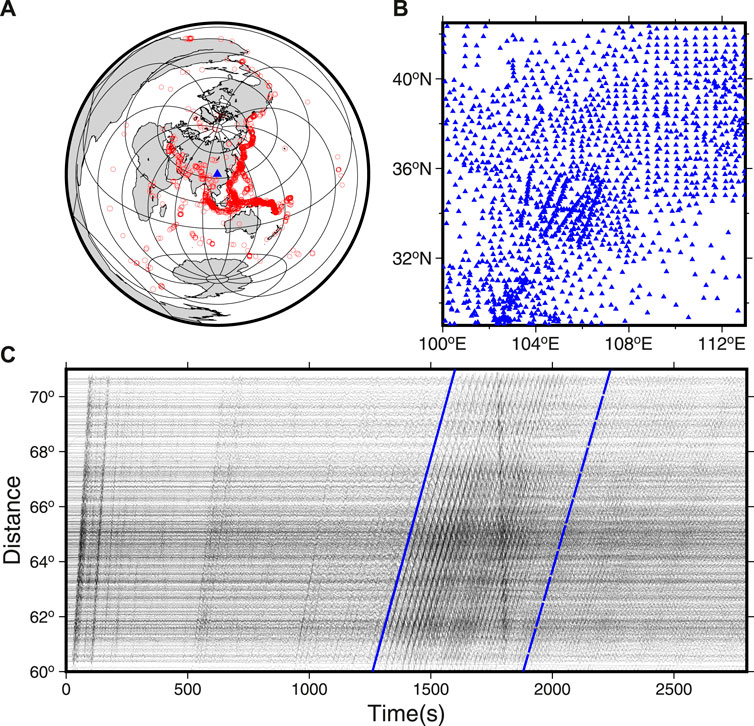
FIGURE 2. (A) Distribution of earthquakes used for surface wave tomography, (B) Distribution of stations used for surface tomography. (C) The waveforms of the earthquake (Info: 20 April, 2014; at 7.165°S, 155.335°E, 20 km and Mw 6.2) recorded by the ChinArray-Himalaya Phase Ⅱ. The two blue lines highlight the time windows of Rayleigh wave signal with high signal-to-noise ratio.
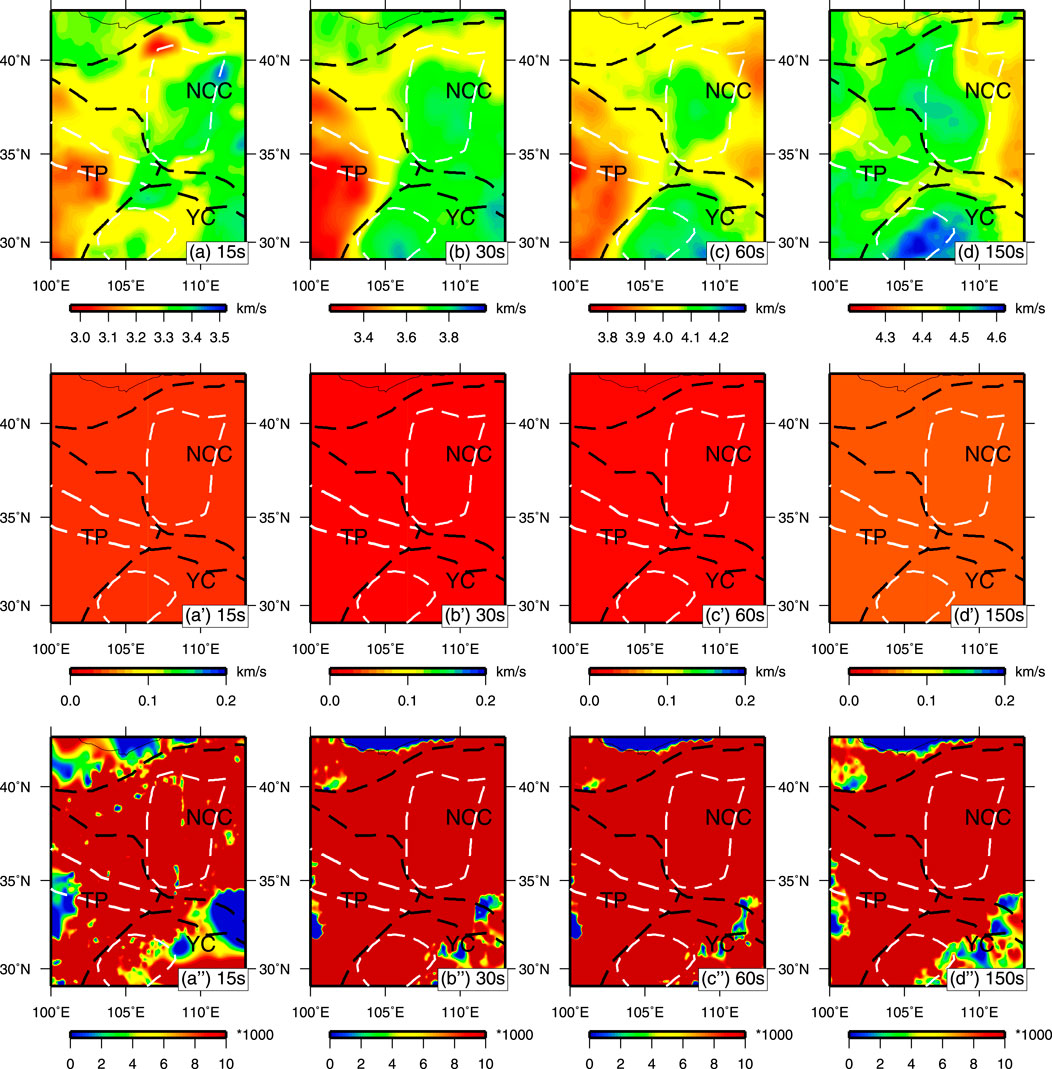
FIGURE 3. The Rayleigh wave phase velocity images (A–D), the corresponding uncertainty images (A’–D’) and the density images of surface waves (A’’–D’’) in NE Tibetan Plateau at different periods based on the surface wave Eikonal tomography method. The dotted lines indicate tectonic unit boundaries, as shown in Figure 1.
2.3 Joint inversion of receiver functions and surface waves
The process of joint inversion of receiver functions and surface waves has been described in detail in Wang W. et al. (2014). Julia et al. (2000) showed that the difference in weight coefficients of receiver functions and surface wave dispersions significantly impacted the inversion results. The inversion problem can be expressed
where m is an M-dimensional vector that describes the model, which is a combination of Vs and the depth of each layer; m0 is the known initial model close to the “real” model; D is the partial differential matrix, r is the residual vector; λ is the tradeoff parameter between waveform fitting and model smoothness; and the matrix
Because the dispersion curve and the receiver function have their own physical units and numbers of data points, Julia et al. (2000) defined a joint prediction error as follows:
where p is the influence factor for each dataset, which ranges from 0 to 1; y and Y are the residual receiver function and its partial derivative matrix, respectively; z and Z are the residual dispersion curve and its partial derivative matrix, respectively; Ny and Nz are the numbers of data points for each dataset; and
where
Considering that there are more receiver function curves than the dispersion curve, the weight coefficient p of fit error for the receiver function varies in the range of 0.1–0.5 (Refer to the Supplementary Materials for the scope selection of p), and the weight coefficient of the dispersion curve is 1-p. First, we take a random value from 0.1 to 0.5 and assign it to p. If the model fails to converge, we regenerate the random model and the value of p; If the cumulative 5 random models cannot converge under the same serial number, we use p = 0.1, so that the inversion results tend to converge more easily.
A total of 72 layers are set for the model, including 40 layers of 2 km and 32 layers of 5 km. In this study, the initial S-wave velocities (Vs) of the upper crust, the lower crust, the Moho, and the top of the upper mantle are given as 3.0, 3.5, 4.0, and 4.5 km/s, respectively, and random disturbances of ±1.0, ±0.5, ±1.0 km/s, and ±0.5 km/s are added correspondingly to obtain 20 initial models (as shown in Figure 4D). The smoothing coefficient λ that we used is 0.1. Fifty inversion iterations are performed on the obtained initial models. The value of the wave velocity ratio κ (Vp/Vs) in the crust is based on the result of the receiver function h-κ stacking (Wang et al., 2017a; Wang et al., 2017b). According to the global average velocity model AK135 and PREM, the value of the wave velocity ratio κ (Vp/Vs) in the mantle is set at 1.80. The empirical equation ρ=0.32Vp + 0.77 (Birch, 1961) has been applied in this study to determine the density of the medium. The receiver functions obtained by each seismic station are derived from the waveform calculation of two different band-pass filters (0.02–1 Hz and 0.03–0.3 Hz), and the receiver functions in the four slowness ranges (0.04–0.05, 0.05–0.06, 0.06–0.07, and 0.07–0.08) are superimposed separately to determine the average receiver functions in these slowness ranges, which can effectively reduce the influence of the local lateral inequality of the medium near the stations. Figure 4 illustrates the results of the joint inversion under station SN. YULG. According to Figure 4A–C, the receiver function and the surface wave dispersion curve are well fitted. Figure 4E shows the S-wave velocity structure, in which the models with fitting residual less than 1.2 times the minimum fitting error are selected to calculate their average value and standard deviation.
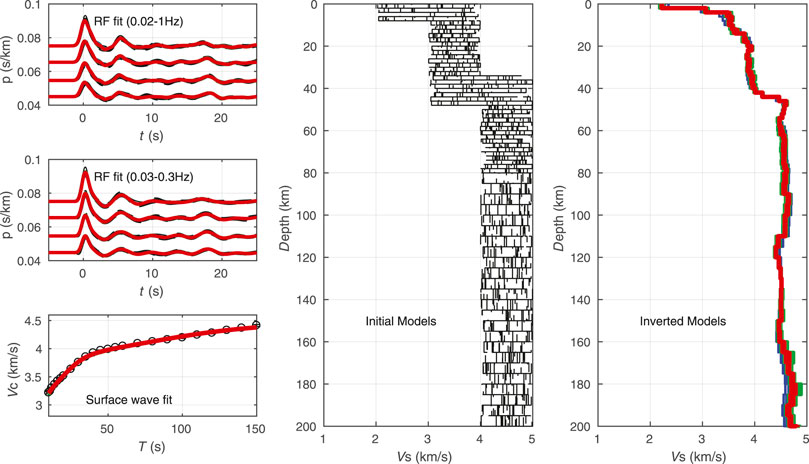
FIGURE 4. The joint inversion results at station SN. YULG located in Ordos block (shown in Figure 1). The 20 random models (black dashed lines) used as initial S-wave velocity models during joint inversion. The S-wave velocity model derived from inversion, where the green lines are models with a small fitted residual (less than 1.2 times the minimum residual), the blue lines are models with a large fitted residual, and the solid red line represents the average value and its standard deviation of the green lines). The stacked receiver functions (black lines) and the fitted curves (red, green and blue lines) for 0.03–0.3 and 0.02–1 Hz, where t refers to time and p refers to horizontal slowness. The Rayleigh wave phase dispersion curve beneath the station (black circles) and the fitted curve (red, green and blue lines), where T refers to period and Vc implies Rayleigh wave phase velocity.
3 Results
3.1 3D Vs model
There are 1,857 stations distributed in the study area. Joint inversions were performed on 1,843 stations, each of which has at least 10 receiver functions and the h-κ stacking quality marked by “very good” or “good” in the papers of Wang et al. (2017a); Wang et al. (2017b), achieving relatively good overall fitting performance. Among them, the inversion fitting residuals of 1,619 stations are less than 5%, 194 stations are between 5–10%, and 30 stations are more than 10%. The inversion results of stations with fitting residuals less than 10% were used to calculate the average of the model within 0.5° grid points. The S-wave velocity distribution was obtained within 200 km of the NE Tibetan Plateau and surrounding basins, of which the results at 9 depths are shown in Figure 5.
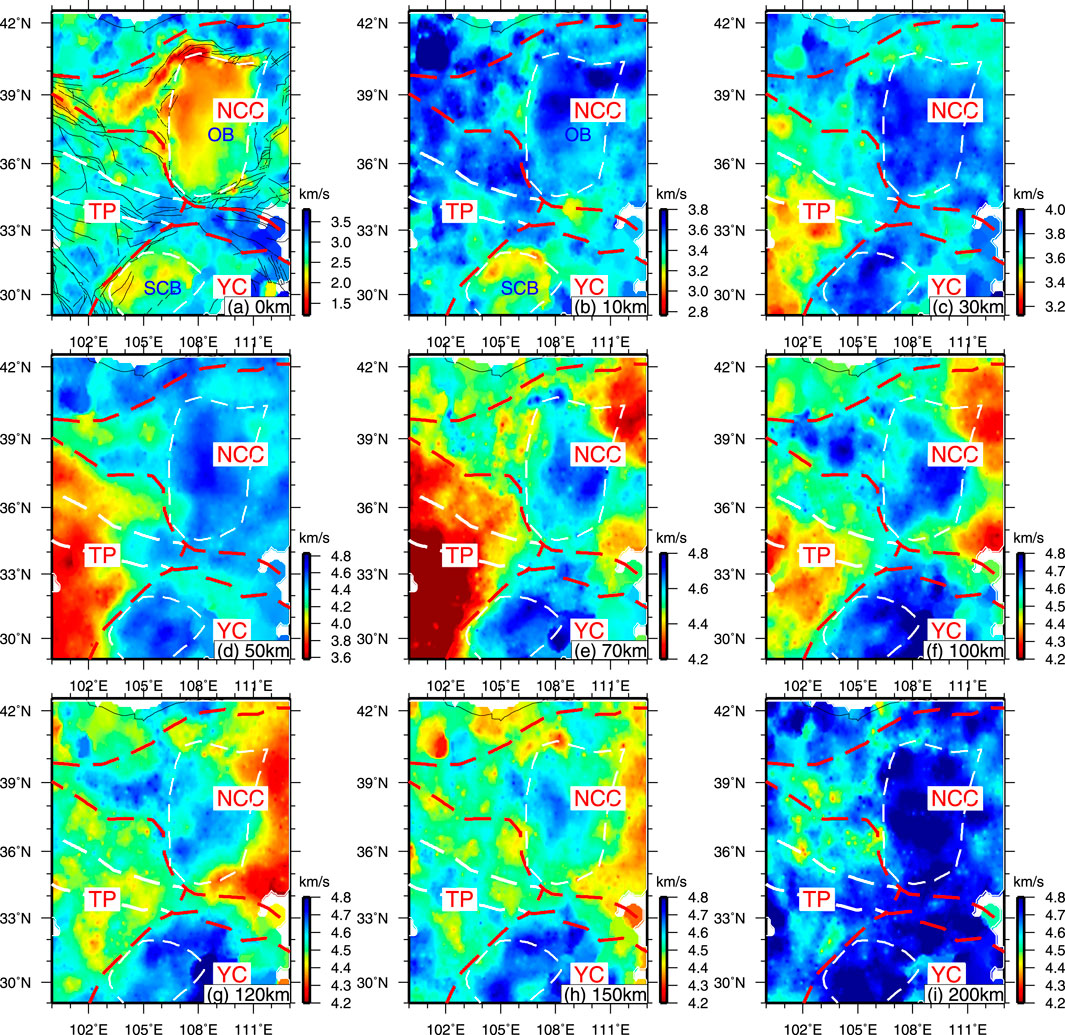
FIGURE 5. S-wave velocity distribution (A–I) at different depths from joint inversion of surface waves and receiver functions. The dashed lines indicate tectonic unit boundaries, as shown in Figure 1. Panels (A–I) correspond to depths of 0, 10, 30, 50, 70, 100, 120, 150, and 200 km, respectively.
Based on the results of the shallow part (Figures 5A,B), the Sichuan Basin, the central Alxa Block, the Ordos Block, and its surrounding extensional basin in the study area all exhibit low wave velocity, revealing a typical feature of sedimentary layers, which agrees with the results by Wang et al. (2017a); Wang et al. (2017b) that there are thick Quaternary loose sediments in this area. Searching the maximum value of velocity gradients among 2.5–3.2 km/s in the shallow part of the crust to extract the thickness of the sediment layer (Figure 6A), it shows that there is a huge sedimentary layer in the Sichuan Basin, with the greatest depth more than 6 km in its southwestern part. The Alxa Block, the NW Ordos Block, the Hetao Basin, and Yinchuan Basin also have sedimentary layers with a thickness of 4–8 km. The average S-wave velocity of the shallow sedimentary layer (Figure 6B) is lower in the Alxa Block, and Ordos and its peripheral extensional basins than the Sichuan Basin. This corresponds well to the delay time of the first peak of the P-wave receiver function (Wang et al., 2017a), which may be related to the loose Quaternary sediments. There are almost no low-velocity sedimentary layers in the plateau block, the Qinling tectonic belt, the Central Asia tectonic belt and the Yangtze Craton excluding the Sichuan Basin.
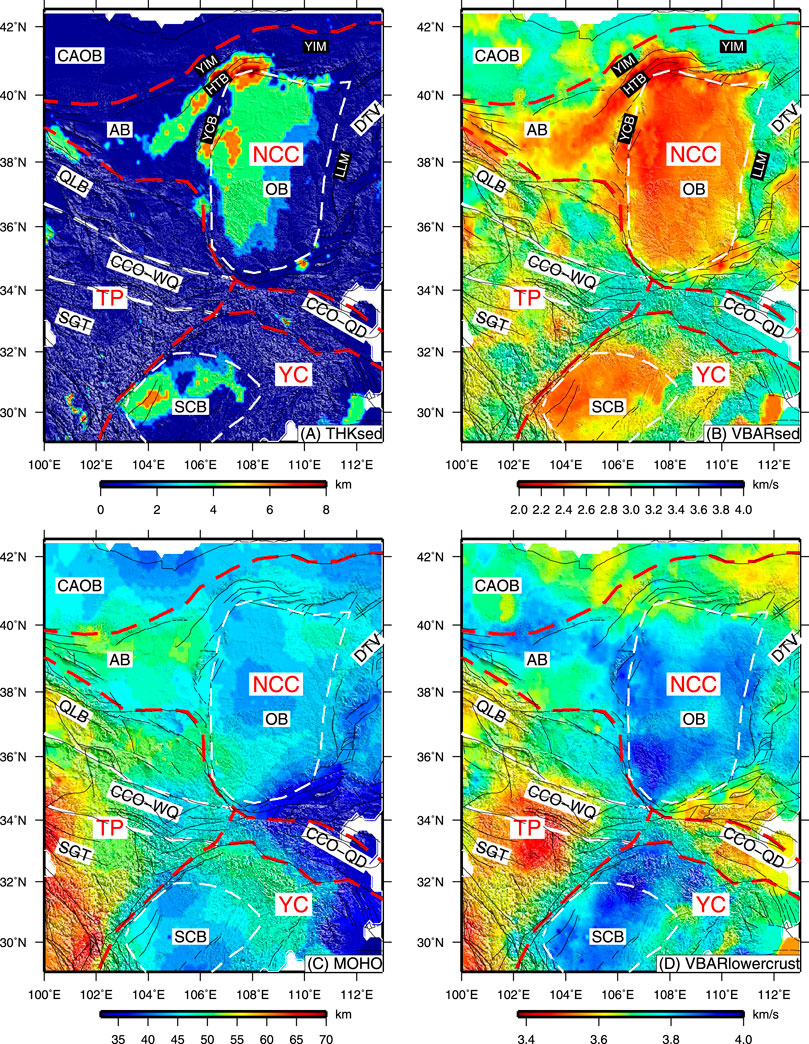
FIGURE 6. Joint inversion results of receiver functions and surface waves: (A) Sedimentary thickness; (B) Average S-wave velocity in the sediment; (C) Crustal thickness; (D) Average S-wave velocity in the lower crust. TP, Tibetan plateau; YC, Yangtze Craton; CAOB, Central Asia Orogenic Belt; NCC, North China Craton; SGT, Songpan-Garze Terrane; QLB, Qilian tectonic belt; OB, Ordos Block; AB, Alxa Block; CCO, Central China Orogen (or Qinling tectonic belt); WQ, Western Qinling; QD, Qinling Dabie; DTV, Datong Volcano; YIM, Yin mountain; LLM, Lvliang mountain; SCB, Sichuan basin; YCB, Yinchuan basin; HTB, Hetao basion.
Figure 5C shows the distribution of the middle and lower crust in the study area, illustrating that the Sichuan Basin and the Ordos Block have relatively high wave velocities, and the plateau block and the peripheral area of Ordos are low-velocity zones. Figure 5D roughly reflects the variation of the crustal thickness. We obtain the crustal thickness variations by searching the maximum value of velocity gradients among 4.0–4.3 km/s (Figure 6C). The crustal thickness decreases from about 65 km at the plateau block eastward to about 40 km at the Sichuan Basin and the Ordos Block, and continues to reduce to 30 km at the SE Ordos block, where the thickness of the crust distributed along the Qinling tectonic belt is thinner than that of the Qilian orogenic belt and Songpan-Ganzi Block at both sides of Qinling tectonic belt. According to the crustal thickness, the average S-wave velocity in the depth range of 0.5–0.9 crustal thickness (lower crust) was extracted (Figure 6D). It shows that there are obvious low-velocity characteristics in the lower crust in the NE Tibetan Plateau. The characteristically low Poisson’s ratio of the region (Wang et al., 2017a; Wang et al., 2017b) indicates the absence of any partial melting in the lower crust. The wave velocity of the lower crust in the Sichuan Basin and Ordos is relatively high, with a high Poisson’s ratio in the north part of Ordos (Wang et al., 2017a), indicating that there may be more mafic components in the crust.
In the 70–200 km slices of the upper mantle (Figures 5E–I), the Sichuan Basin and the Ordos Block show basically high-velocity characteristics from 100 km to 200 km, suggesting that both have a relatively hard and thick lithosphere structure. In some areas, the thickness exceeds 200 km, which agrees with the thickness of the lithosphere obtained by the regional surface wave imaging study (An and Shi, 2006; Huang et al., 2009). The Songpan-Ganzi Block has a low-velocity at 70 km–100 km and a relatively high velocity at 120–200 km, suggesting a partial melting near the top of the mantle in this area. With the continuing increase in the depth, high velocity is again observed, which may be due to the delamination of the lithosphere of the plateau block. The Alxa Block and the eastern section of the Qilian Block change from a medium to high velocity feature at 100–120 km to a low-velocity feature at 150–200 km. This area has a lithosphere of medium thickness. In the north and south of the eastern part of the study area, a low-velocity body appears in the upper mantle from 70 km, and there is a high-velocity body in the middle part. A low-velocity body appears from 120 km and continues to 180 km, indicating that the lithosphere in the east of the study area is the thinnest.
To visually display the lateral structural characteristics across the various tectonic units, the S-wave velocity structure below eight sections are presented (see Figure 7, and the location of the sections is shown in Figure 1). The E-W AA′ section (Figure 7A) traverse the Qilian Block and the southern Ordos Block. The figure display that the middle and lower crust of the Qilian blocks exhibits low-velocity characteristics, while the middle and lower crust of the Ordos Block has a relatively high velocity up to 4 km/s. In the mantle, the Qilian block has a velocity gradient zone immediately below the Moho, which is 30 km thick in the west and decreases to 10 km in the east. The velocity slowly increases in this gradient zone and becomes higher than 4.5 km/s in the depth of 60–80 km. It then gradually declines and exhibits low-velocity features (<4.5 km/s) at the depth of about 150 km. However, the gradient zone in southern Ordos is very thin, and the velocity values of both zones rapidly increase to 4.8 km/s at a depth of 70 km, and maintain at above 4.5 km/s in the depth range of 200 km. This lithospheric feature is also revealed in Li et al. (2018), which used noise and seismic surface wave inversion to obtain the lithospheric structure. However, Huang et al. (2009); Huang (2011) applied surface wave inversion to obtain a much lower wave velocity of Ordos lithospheric, which is quite different from the results of this study and Li et al. (2018).
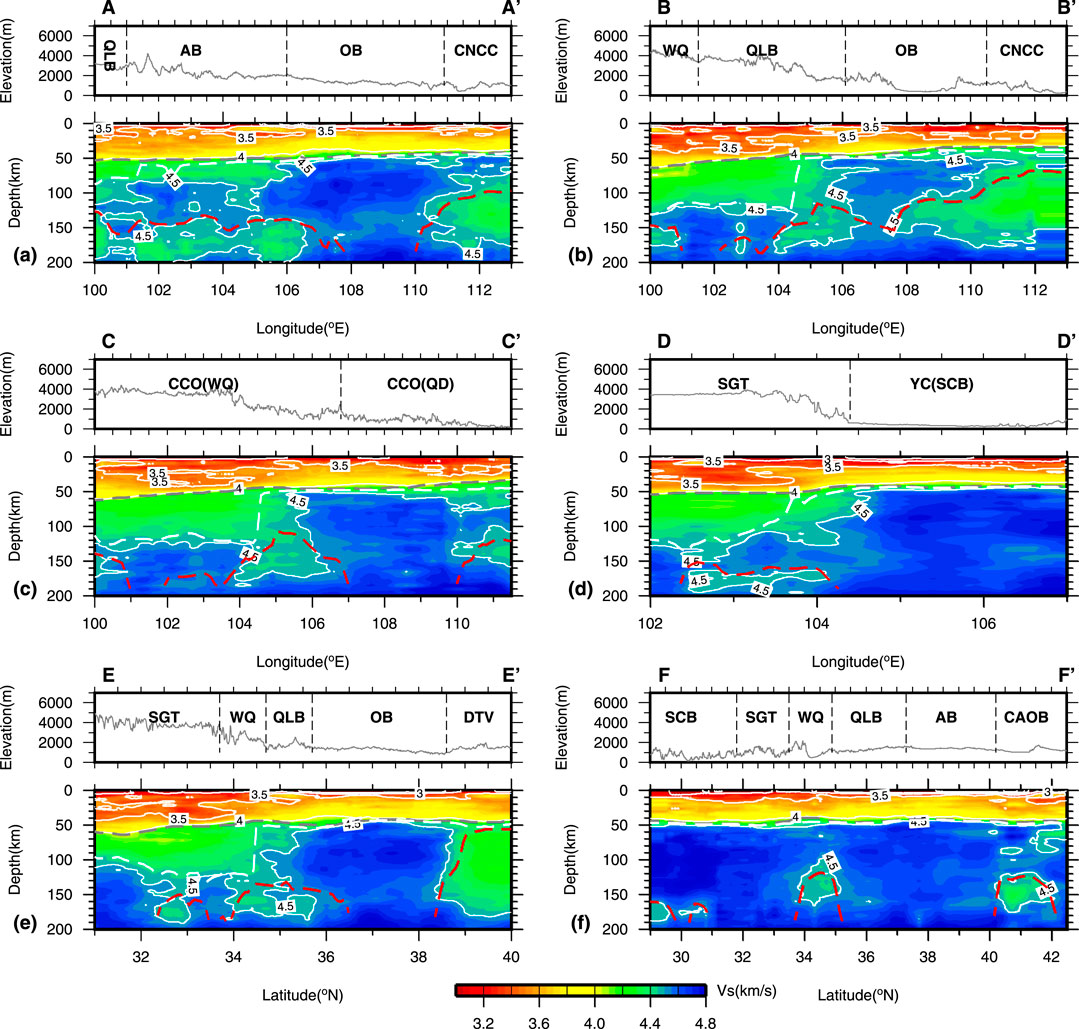
FIGURE 7. S-wave velocity structure beneath 6 sections in the study region. (A) AA’ section; (B) BB’ section; (C) CC’ section; (D) DD’ section; (E) EE’ section; (F) FF’ section. The locations of the six sections are shown in Figure 1. The gray, red and white dashed lines represent the depth of Moho, LAB and the lower boundary of VGZ.
The BB′ section (Figure 7B) and CC′ section (Figure 7C) spans along the western Qinling tectonic belt and the southeast to Ordos Block, as well as the western Qinling tectonic belt and the Qinling-Dabie tectonic belt. The western Qinling tectonic belt is bounded by 106°E line, where a significant low-velocity layer exists in the lower crust on the west side but not on the east side, consistent with the surface wave tomography results of Huang et al. (2013) and the body wave tomography of Guo et al., 2017. The electrical structure in the deep of the structure obtained by Zhan et al. (2014) shows that a low-resistance layer appears on the west side, and a high-resistance layer appears on the east side of the 106° E boundary. In the mantle, there is a thick velocity gradient zone at the top of the upper mantle beneath the West Qinling Mountains, right below the Moho. A high-velocity body with a velocity above 4.5 km/s only emerges once the depth reaches about 120 km. The Qinling-Dabie tectonic belt is different in that the layer is quite thin from the Moho to the 4.5 km/s contour, and has a high-velocity zone in the lithosphere to 130 km depth. There is a low-velocity zone appears from 130 km depth beneath the BB’ section, which is presumed to be an asthenosphere.
The DD′ section (Figure 7D) spans the Songpan-Ganzi Block and the Sichuan Basin. There are low-velocity bodies in the middle and lower crust beneath the west side of the Songpan-Ganzi Block and a relatively thick velocity gradient zone below the Moho with a thickness of about 60 km. High-velocity features appear in the range of 110–180 km in the mantle, and sub-low-velocity layer features show up near 180 km. However, there is no low-velocity layer in the middle and lower crust on the side of the Sichuan Basin, and the S-wave velocity right next to the Moho rapidly increases to 4.8 km/s, and then decreases at a very slow rate at some depths. However, it does not drop to 4.5 km/s within the depth range of 200 km, which also indicates that the basin has a stable lithosphere structure. (Pan et al., 2017) obtained the phase velocity distribution charts of the surface wave showing that Songpan-Ganzi Block has a significant low-velocity layer in the middle and lower crust. Huang et al. (2013) applied surface wave tomography to determine the S-wave velocity structure beneath the Songpan-Ganzi Block, exhibiting that there are low-velocity layers in the crust in the depth range of about 25–45 km. Li et al. (2019) utilized multi-scale tomography to discover that the Songpan-Ganzi Block and the Yangtze Block in the NE Tibetan Plateau display a clear boundary zone in the upper mantle, with a low-velocity anomaly on the west side and a high-velocity anomaly on the east side. This feature is also shown in Figure 7D.
The EE′ section (Figure 7E) spans the Songpan-Ganzi Block, the western Qinling techtonic belt, the Qilian tectonic belt, and the Ordos Block. With the Xianshui River as the boundary (32°N), the high-velocity body below the Moho in the southern Songpan-Ganzi Block mainly appears in the range of 100–200 km; while in the northern Songpan-Ganzi Block (32–34°N), along the section, the gradient zone immediately underneath the Moho gradually becomes thicker and the high-velocity body gradually becomes thinner. While, the lithosphere of the Qilian tectonic belt and the Ordos Block on the north side presents high velocity feature. A weak high-velocity body distributes under the Qinling and Qilian tectonic belts, and the wave velocity under the Datong volcanic area in northeastern Ordos is even lower. In the depth range of 130–180 km, the high-velocity body in the mantle of the Songpan-Ganzi Block and the high-velocity body in the lower part of Ordos are separated by the weak high-velocity body in the Qinling and the Qilian tectonic belts. The S wave receiver function study by Zhang et al. (2013) showed that the lithosphere below the western Qinling tectonic belt was relatively thin, at a thickness of about 125–135 km.
The FF′ section (Figure 7F) spans the eastern margin of the Sichuan Basin, the Qinling tectonic zone, and the Ordos Block and its north side. The sections show that there is no velocity <4.5 km/s in the lower part of the lithosphere in Sichuan Basin and Ordos Basin, and there is a negative gradient interface of 4.5 km/s in the depth of 100 km below the central tectonic belt, while there are several negative gradient interfaces in the depth range of 60–120 km below the northern Hetao Basin of Ordos. Zheng et al. (2018) used the joint inversion of surface wave dispersion and receiver function to determine that the Hetao Basin showed a low-velocity anomaly below 80 km. Chen et al. (2009) also concluded that the thickness of the lithosphere under the Hetao Basin was about 80 km using the S-wave receiver function.
Priestley and McKenzie (2006) gave out an empirical relationship between upper mantle S-wave velocity, pressure and temperature:
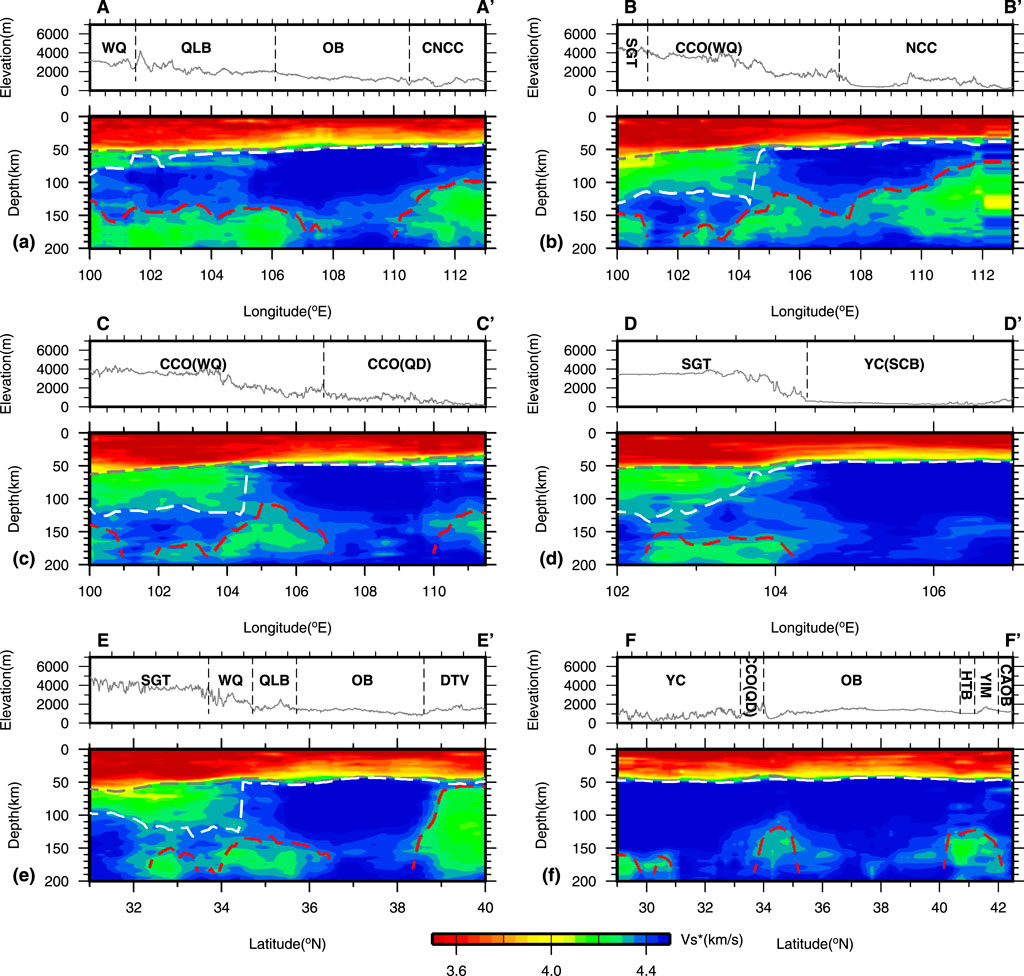
FIGURE 8. Pressure-corrected S-wave2 velocity structure beneath 6 sections in the study region. (A) AA’ section; (B) BB’ section; (C) CC’ section; (D) DD’ section; (E) EE’ section; (F) FF’ section. The locations of the six sections are shown in Figure 1. The gray, red and white dashed lines represent the depth of Moho, LAB, and the lower boundary of VGZ.
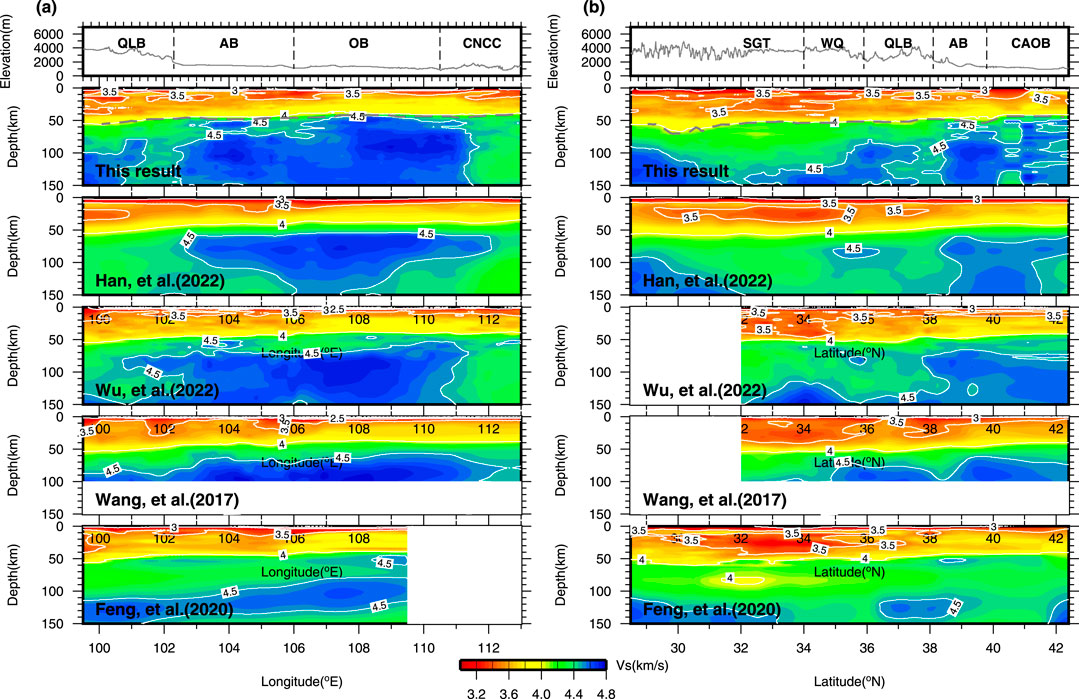
FIGURE 10. The S-wave velocity structure beneath sections along (A) latitude line of 38°N (A) and (B) longitude line of 102°E from this study and previous studies (Wang, et al., 2017; Feng, et al., 2020; Han, et al., 2022; Wu, et al., 2022).
Considering the thickness of the low velocity zone at the top of the upper mantle and the depth of Moho, the thickness of the velocity gradient zone (VGZ) of the upper lithospheric mantle (Figure 9C) and its average wave velocity (Figure 9D) were further obtained. The “velocity gradient zone” is a low velocity layer (<4.5 km/s) beneath Moho, which means that the velocity gradient is very small after entering the mantle (Vs>4.2 km/s), and Vs does not rise to 4.5 km/s quickly, rather than the traditional low-velocity zone between the upper and lower normal velocity layers. For the Songpan-Ganzi Block, the VGZ is about 40 km thick in most parts, and reaches 100 km in some locations. Except for the Tibetan Plateau, the thickness of the velocity gradient zone beneath the surrounding cratonic basins and the Qinling orogenic belt is very thin. According to the results of gravity anomalies on the lithosphere scale (Bi et al., 2016), the authors found that the blocks around the northeastern Tibetan Plateau, such as the Sichuan Basin, Ordos Basin, Alxa block and Qilian tectonic belt, all show prominent positive anomalies, which are still the characteristics of the rigid block. However, the eastern edge of the Songpan-Ganzi Block shows obvious negative anomalies, presumably because the rock is crushed by compressive stress or there is molten crustal and lithospheric material.
3.2 Comparison with previous results
By using double-difference tomography, Han, et al. (2022) obtained high-resolution longitudinal and shear wave velocity models in China. For similar researches in NE Tibetan Plateau and the surrounding areas, some studies used part of the data set and the same method as the current study (e.g., Wang et al., 2017; Wu et al., 2022), and some studies used completely different data set and different methods (e.g., Feng et al., 2017, 2020). We compare our results with four previous studies (Wang et al., 2017; Feng et al., 2020; Han et al., 2022; Wu et al., 2022) beneath two profiles along the latitude line of 38°N and longitude line of 102°E, as shown in Figure 10.
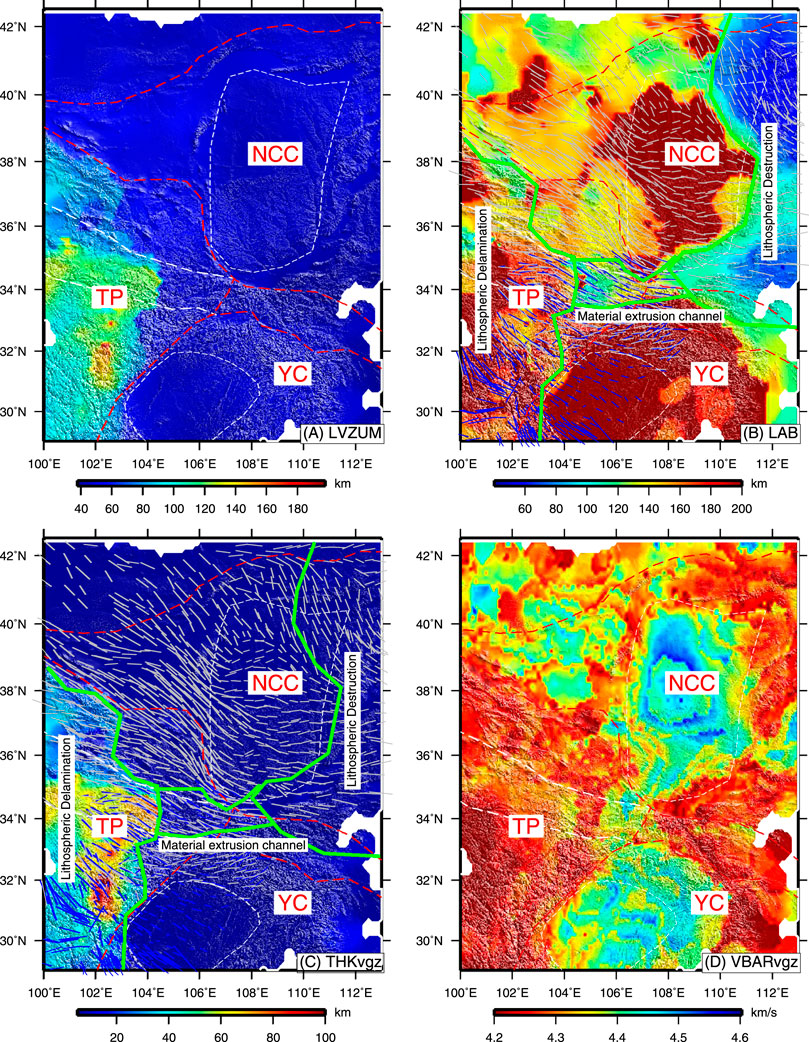
FIGURE 9. (A) The bottom of LVZ in the uppermost mantle: Search for Vs*=4.35 km/s from Moho; (B) Lithosphere-asthenosphere boundary: Search for Vs*=4.35 km/s from the Moho downwards and extrema in negative velocity gradient zones, and note that the dark red (200 km) in the figure indicates that the corresponding boundary is not found; (C) Thickness of the velocity gradient zone (VGZ) at the uppermost of the mantle lithosphere; (D) the average velocity of the VGZ. Blue lines and gray lines represent the SKS wave splitting results from Liu et al. (2020), Liu et al. (2021); Chang et al., 2017; Chang et al., 2021). The green lines indicate the regional scopes of lithospheric delamination, hot material extrusion channel and lithospheric destruction.
According to Figure 10, there are similar crustal features between this study and the four previous studies: in the lower crust, low velocity zones are found beneath the Songpan-Ganzi block, West Qinling, Qilian tectonic belt and Alxa block, whereas high velocity zone is found beneath the Ordos block. The features are also found in other previous studies (e.g., Zheng et al., 2016; Yang and Zhang, 2018; Zheng et al., 2018; Fu and Xiao, 2020). However, in the upper mantle, large differences are found among different results (Figure 10), and our results are relatively consistent with Wu et al. (2022) and Han et al. (2022). At 38°N (Figure 10A), all studies show that high velocity zones exist beneath the Alxa block and the Ordos block. However, the thickness of velocity gradient zone from Moho to the lithospheric high velocity zone (>4.5 km/s) is different. Beneath Ordos block, in our results, the velocity increases rapidly from Moho downward, which is consistent with the lithospheric P-wave high velocity structure beneath the Wendeng-Alxa Left Banner deep seismic sounding profile (Wang et al., 2014), whereas all the four previous studies mentioned above show relatively thick velocity gradient zones. The reason why our results are different from Wang et al. (2017); Wu et al. (2022) may be that, on the one hand, we used longer period surface wave dispersion data and receiver functions from more stations, and on the other hand, there are some differences in joint inversion processing. Wang et al. (2017) only used a single receiver function for joint inversion; Wu et al. (2022) only used receiver functions with different slowness for joint inversion. In this study, receiver functions with different filters and different slowness are used. In addition, Wu et al. (2022) also inversed the seismic wave velocity ratio of each layer from the joint inversion, however, they did not analyze its reliability which may influence the values of Vs.
4 Discussions
Two models have been finally proposed to explain the formation and deformation of the Tibetan Plateau: 1) rigid plate model (Peltzer and Tapponnier, 1988; Tapponnier et al., 2001) and 2) viscous plate model or lower crustal flow model (England and Houseman, 1988; Royden et al., 1997; Clark and Royden, 2000). The difference between the two models mainly focuses on the composition or state of the crust and mantle material, i.e. the spatial distribution of the partially molten material. The average wave velocity of the lower crust in this paper (Figure 8D) show that there are significant low-velocity layers in the lower crust of the NE plateau block (including the NE Songpan-Ganzi, the western Qinling tectonic belt, and the Qilian tectonic belt). However, these regions have low Poisson’s ratio (<0.26) (Wang et al., 2017a), indicating that there is no partial melting in the NE Tibetan Plateau, and there is no ground for lower crustal flow. Li et al. (2014) suggested that the crustal thickening and the local LVZ beneath the northwestern Qilian Orogen reflect an intracrustal response associated with the shortening between the North China Craton and the Tibetan Plateau. This study also shows the craton basins, Qilian tectonic belt and the central part of the central tectonic belt are basically characterized by high velocity, and the low velocity bodies of the lower crust under the central tectonic belt is not connected, which indicates that there is no widespread local melting to support the model of lower crust flow. Previous studies (Agius and Lebedev, 2014; Yang et al., 2019) show that the NE Tibetan Plateau displays negative or weak radial anisotropy, which cannot be adequately explained by the lower crustal flow model. Therefore, the structural deformation of the NE Tibetan Plateau on the crustal scale may be explained more properly by the rigid plate model for the surface lift and orogeny, and the Qinling tectonic belt may not be the channel for material extrusion in the NE Tibetan Plateau on the crustal scale.
At the upper mantle, the material is grouped into a relatively hard solid material (undamaged or not severely damaged lithosphere), and a relatively soft elastoplastic material (asthenosphere and lithosphere material went through severe damage and delamination). The asthenosphere material is in a molten or plastic state, and small stress can cause the flow or convection of the material, which in turn drives the hard lithosphere to move as an integrated body (Qiu et al., 2006). There are two major types of migration for asthenosphere material: 1) horizontal flow migration of asthenosphere material. When the middle and lower parts of the lithosphere of the Indian plate and the Eurasian plate collided in the Tibetan Plateau, the asthenosphere of the Tibetan Plateau went through rheological migration with the main body migrating to the east and southeast of Asia. This process caused the thinning of the asthenosphere in the Tibetan Plateau and the thickening of the asthenosphere in the adjacent region. 2) Vertical flow migration of the asthenosphere material. During the collision process, part of the asthenosphere material migrated vertically upward (Zhong et al., 2017) and mixed with material in the lithosphere. After the collision, these asthenosphere residual materials were mingled and enclosed to the lithosphere.
According to this study, the structure of the lithosphere beneath the Songpan-Ganzi Block is complex. It can be split into an upper lithosphere with low velocity feature and a deeper lithosphere layer that went through delamination. There may be partially molten material under the upper lithosphere, exhibiting an overall lithosphere with weak strength and extensive hot material activities. Ye et al. (2017) observed a low-velocity zone in the upper mantle beneath Songpan-Ganzi using the joint inversion of receiver function and surface wave, and concluded that the hot asthenospheric flows and its effect of thermal erosion caused the delamination of the lithosphere. The low-velocity zone existing at the top of the upper mantle of the Songpan-Ganzi Block adjacent to the Qinling tectonic zone balanced the surface uplift in the boundary zone (Ye et al., 2018). The Sichuan Basin and central Ordos have the thickest lithosphere (>200 km) in the study area. The lithosphere in the Alxa Block, the Qinling tectonic belt and the surrounding areas of Ordos is relatively thick (∼150 km). The lithospheric material in these areas exhibits high-velocity characteristics, with an overall high-strength lithospheric structure, suggesting the inability of upward movement of the asthenospheric material. Compared with the stable blocks with high mechanical strength in Ordos and the Sichuan Basin, the Alxa Block is characterized by the coexistence of weak high-velocity anomalies and local weak low-velocity anomalies in the depth range of lithosphere (Guo et al., 2017; Zheng et al., 2018), indicating that the lithosphere in this area may be undergoing deformation and destruction under the compression of material from the NE Tibetan Plateau.
According to the characteristics of surface movement observed by current GPS (Liang et al., 2013), relative to the stable Eurasian plate, the surface material in the northeastern Tibetan Plateau is still thrusting toward the northeast at a rapid rate. The SKS wave splitting study (Figure 9; Chang et al., 2017; Liu et al., 2020; Chang et al., 2021; Liu et al., 2021) reveals that most areas in the west of the study region and the Datong volcano display strong fast-wave polarization in the NW-SE direction, and the Qinling tectonic belt shows a strong fast wave polarization in the E-W direction, while the anisotropy intensity of the Ordos block and Sichuan basin in the middle of the study area are obviously weakened. From Figure 9B, the NE Ordos block and Datong volcanic area have roughly the same lithospheric thickness and SKS fast wave direction, indicating that the lithospheric thinning in the NE Ordos block is related to the volcanic activity. Compared with the central part of Ordos, the SW Ordos block has significantly greater anisotropic strength and a thinner lithosphere, which suggests that the lithosphere in the southwest of Ordos has been reformed and thinned. Compared with the Sichuan Basin and the Ordos Basin at both sides, the Qinling tectonic belt has a low-velocity zone at the depth of 100–160 km, which may be asthenosphere material. The trend of the asthenosphere low velocity zone is roughly the same as the regional SKS wave polarization direction, indicating that there is an obvious nearly east-west asthenosphere material flow under the Qinling tectonic belt, so the Qinling tectonic belt may be an important channel for material extrusion on the NE Tibetan Plateau (Chang et al., 2011; Yu and Chen, 2016; Guo and Chen, 2017).
5 Conclusion
In this study, the S-wave velocity structure results down to 200 km depth in the study area were obtained using the joint inversion of the receiver function and surface wave dispersion. The distribution characteristics of the crust and lithosphere structures in the study area were analyzed in detail, and the deformation mechanism and the characteristics of deep material migration of the NE Tibetan Plateau were further discussed. The results illustrate that a relatively thick sedimentary layer is distributed in the basins of the study area, which is fairly consistent with the geological tectonic background. The crustal thickness shows a drastic lateral change, gradually thinning from west to east. The crustal thickness of the eastern plateau is up to 65 km, followed by the thickness of the Sichuan Basin and Ordos Basin at about 40 km, and the thinnest part occurs in the southeastern region at about 30 km. According to the LAB burial depth distribution obtained in this study, there is a relatively thick lithosphere (>200 km) below the Sichuan and the Ordos Basins, and the thinnest part of the lithosphere in the east is about 60–80 km, suggesting extensive destruction and reformation processes.
The crustal thickness of the Tibetan Plateau shows an overall tendency to gradually decrease outwards, which corresponds to the outward expansion of the plateau. The NE Songpan-Ganzi, the western Qinling, and the Qilian tectonic belts have low-velocity layers in the middle and lower crust. Based on related research, we believe that there is no local melting in this area. Combined with the low Poisson’s ratio and radial anisotropy in the region, we conclude that there is no extensive partial melting in the region to support the lower crustal flow model. There are low velocity zones in the lower crust in the Qinling tectonic belt, but they are not connected, indicating that they may not be able to be used as a channel for material extrusion from the NE Tibetan Plateau at the crustal scale.
In the range of mantle, the Songpan-Ganzi Block has a relatively thick low-velocity zone below the Moho, which may be related to the surface uplift and orogeny of the plateau. The lithosphere structure under the Songpan-Ganzi Block is quite complex, displaying signs of delamination and characteristics of vertical migration in the asthenosphere underneath. The Sichuan Basin and the Ordos Block show significant high-velocity anomalies, and have a quite thick lithosphere (>200 km), while the Qinling tectonic belt has a thin lithosphere (100–130 km). Combining with the characteristics of the regional SKS wave polarization direction, there is an explicit asthenosphere material flow on an approximately east-west direction below the Qinling tectonic belt. Therefore, the outward expansion of the material in the NE Tibetan Plateau encountered strong obstruction of the rigid Ordos block and the rigid Sichuan Basin, and formed an important channel for the extrusion of material from west to east beneath the Qinling tectonic belt at the upper mantle scale.
Data availability statement
Publicly available datasets were analyzed in this study. This data can be found here: The Earthquake Science Data Center, Institute of Geophysics, China Earthquake Administration (http://www.esdc.ac.cn/, networks: X3, X2, T1, T0, S0, R4, SC, GS, SN, SX, NM, NX) and the Incorporated Research Institutions for Seismology (IRIS).
Author contributions
WW collected the waveform data, plotted the figures used in this study and wrote the manuscript. GC provided literature research and wrote part of the manuscript. JW guided this work. LF provided useful suggestions. All authors contributed to the article and approved the submitted version.
Funding
This research was supported by National Natural Science Foundation of China (Grant No. 41974058), and the Special Fund of the Institute of Geophysics, China Earthquake Administration (Grant No. DQJB19A35).
Conflict of interest
The authors declare that the research was conducted in the absence of any commercial or financial relationships that could be construed as a potential conflict of interest.
Publisher’s note
All claims expressed in this article are solely those of the authors and do not necessarily represent those of their affiliated organizations, or those of the publisher, the editors and the reviewers. Any product that may be evaluated in this article, or claim that may be made by its manufacturer, is not guaranteed or endorsed by the publisher.
Supplementary material
The Supplementary Material for this article can be found online at: https://www.frontiersin.org/articles/10.3389/feart.2022.1066265/full#supplementary-material
References
Agius, M. R., and Lebedev, S. (2014). Shear-velocity structure, radial anisotropy and dynamics of the Tibetan crust. Geophys. J. Int. 199 (3), 1395–1415. doi:10.1093/gji/ggu326
An, M., and Shi, Y. (2006). Lithospheric thickness of the Chinese continent. Phys. Earth Planet. Interiors 159 (3), 257–266. doi:10.1016/j.pepi.2006.08.002
Bao, X., Song, X., and Li, J. (2015). High-resolution lithospheric structure beneath Mainland China from ambient noise and earthquake surface-wave tomography. Earth Planet. Sci. Lett. 417, 132–141. doi:10.1016/j.epsl.2015.02.024
Bao, X., Song, X., Xu, M., Wang, L., Sun, X., Mi, N., et al. (2013). Crust and upper mantle structure of the north China craton and the NE Tibetan plateau and its tectonic implications. Earth Planet. Sci. Lett. 369, 129–137. doi:10.1016/j.epsl.2013.03.015
Bi, B., Hu, X., Li, L., Zhang, H., Liu, S., and Cai, J. (2016). Multi-scale analysis to the gravity field of the northeastern Tibetan plateau and its geodynamic implications. Chin. J. Geophys. (in Chinese) 59 (2), 543–555. doi:10.6038/cjg20160213
Birch, F. (1961). The velocity of compressional waves in rocks to 10 kilobars: 2. J. Geophys. Res. 66 (7), 2199–2224. doi:10.1029/JZ066i007p02199
Cai, G., Wang, W., Wu, J., and Fang, L. (2021). Surface wave tomography based on Eikonal tomography in Ordos and adjacent areas. Chinese Journal of Geophysics 64 (4), 1215–1226. doi:10.6038/cjg2021O0070
Chang, L., Ding, Z., Wang, C., and Flesch, L. M. (2017). Vertical coherence of deformation in lithosphere in the NE margin of the Tibetan plateau using GPS and shear-wave splitting data. Tectonophysics 699, 93–101. doi:10.1016/j.tecto.2017.01.025
Chang, L., Ding, Z., and Wang, C. (2021). Upper mantle anisotropy and implications beneath the central and Western North China and the NE margin of Tibetan Plateau. Chinese Journal of Geophysics (in Chinese) 64 (1), 114–130. doi:10.6038/cjg2021O0315
Chang, L., Wang, C., and Ding, Z. (2011). Upper mantle anisotropy in the Ordos Block and its margins. Sci. China Earth Sci. 54, 888–900. doi:10.1007/s11430-010-4137-2
Chen, L., Cheng, C., and Wei, Z. (2009). Seismic evidence for significant lateral variations in lithospheric thickness beneath the central and Western North China Craton. Earth Planet. Sci. Lett. 286 (1-2), 171–183. doi:10.1016/j.epsl.2009.06.022
Chen, L., Jiang, M. M., Yang, J. H., Wei, Z. G., Liu, C. Z., and Ling, Y. (2014). Presence of an intralithospheric discontinuity in the central and Western North China craton: Implications for destruction of the craton. Geology 42, 223–226. doi:10.1130/G35010.1
Clark, M. K., and Royden, L. H. (2000). Topographic ooze: Building the eastern margin of tibet by lower crustal flow. Geology 28, 703–706. doi:10.1130/0091-7613(2000)028<0703:tobtem>2.3.co;2
England, P., and Houseman, G. (1986). Finite strain calculations of continental deformation, 2: Comparison with the India–Asia collision zone. J. Geophys. Res. 91 (B3), 3664–3676. doi:10.1029/jb091ib03p03664
England, P., and Houseman, G. (1988). The mechanics of the Tibetan Plateau. Philos. Trans. R. Soc. Lond. Ser. A326, 301–320.
Feng, M., An, M., and Dong, S. (2017). Tectonic history of the ordos block and qinling orogen inferred from crustal thickness. Geophysical Journal International 210 (1), 303–320. doi:10.1093/gji/ggx163
Feng, M., An, M., Mechie, J., Zhao, W., Xue, G., and Su, H. (2020). Lithospheric structures of and tectonic implications for the central–east Tibetan plateau inferred from joint tomography of receiver functions and surface waves. Geophysical Journal International 223 (3), 1688–1707. doi:10.1093/gji/ggaa403
Fu, Y., and Xiao, Z. (2020). Ambient noise tomography of Rayleigh and Love wave in Northeast Tibetan plateau and adjacent regions. Chinese Journal of Geophysics (in Chinese) 63 (3), 860–870. doi:10.6038/cjg2020N0239
Gee, L., and Jordan, T. (1992). Generalized seismological data functionals. Geophys. J. Int. 111 (2), 363–390. doi:10.1111/j.1365-246X.1992.tb00584.x
Guo, H., Ding, Z., and Xu, X. (2017). Upper mantle structure beneath the northern South-Nouth Seismic Zone from teleseismic traveltime data. Chinese Journal of Geophysics (in Chinese) 60 (1), 86–97. doi:10.6038/cjg20170108
Guo, X., Gao, R., Li, S., Xu, X., Huang, X., Wang, H., et al. (2016). Lithospheric architecture and deformation of NE Tibet: New insights on the interplay of regional tectonic processes. Earth and Planetary Science Letters 449, 89–95. doi:10.1016/j.epsl.2016.05.045
Guo, Z., and Chen, Y. J. (2017). Mountain building at northeastern boundary of Tibetan plateau and craton reworking at ordos block from joint inversion of ambient noise tomography and receiver functions. Earth and Planetary Science Letters 463 (34), 232–242. doi:10.1016/j.epsl.2017.01.026
Han, S., Zhang, H., Xin, H., Shen, W., and Yao, H. (2022). USTClitho2.0: Updated unified seismic tomography models for continental China lithosphere from joint inversion of body-wave arrival times and surface-wave dispersion data. Seismological Research Letters 93 (1), 201–215. doi:10.1785/0220210122
Huang, J., and Zhao, D. (2006). High-resolution mantle tomography of China and surrounding regions. J. Geophys. Res. 111 (B9), B09305. doi:10.1029/2005jb004066
Huang, Z., Li, H., and Xu, Y. (2013). Lithospheric S-wave velocity structure of the North-South Seismic Belt of China from surface wave tomography[J]. Chinese Journal of Geophysics (in Chinese), 56(4): 1121–1131. doi:10.6038/cjg20130408
Huang, Z., Li, H., Zheng, Y., and Peng, Y. (2009). The lithosphere of North China Craton from surface wave tomography. Earth and Planetary Science Letters 288 (1-2), 164–173. doi:10.1016/j.epsl.2009.09.019
Huang, Z., Su, W., Peng, Y., Zheng, Y., and Li, H. (2003). Rayleigh wave tomography of China and adjacent regions. J. Geophys. Res. 108 (B2). doi:10.1029/2001jb001696
Huang, Z., Tilmann, F., Xu, M., Wang, L., Ding, Z., Mi, N., et al. (2017). Insight into NE Tibetan Plateau expansion from crustal and upper mantle anisotropy revealed by shear-wave splitting. Earth and Planetary Science Letters 478, 66–75. doi:10.1016/j.epsl.2017.08.030
Huang, Z. (2011). Velocity anisotropy in the crust and upper mantle of North China. Chinese J. Geophys. 54 (3), 169–180. doi:10.1002/cjg2.1598
Jin, G., and Gaherty, J. B. (2015). Surface wave phase-velocity tomography based on multichannel cross-correlation. Geophysical Journal International 201 (3), 1383–1398. doi:10.1093/gji/ggv079
Julia, J., Ammon, C. J., Herrmann, R. B., and Correig, A. M. (2000). Joint inversion of receiver function and surface wave dispersion observations. Geophysical Journal International 143 (1), 99–112. doi:10.1046/j.1365-246x.2000.00217.x
Li, C., van der Hilst, R. D., Meltzer, A. S., and Engdahl, E. R. (2008). Subduction of the Indian lithosphere beneath the Tibetan Plateau and Burma. Earth Planet. Sci. Lett. 274, 157–168. doi:10.1016/j.epsl.2008.07.016
Li, H., Shen, Y., Huang, Z., Li, X., Gong, M., Shi, D., et al. (2014). The distribution of the mid-to-lower crustal low-velocity zone beneath the northeastern Tibetan plateau revealed from ambient noise tomography. J. Geophys. Res. Solid Earth 119 (3), 1954–1970. doi:10.1002/2013jb010374
Li, S., Guo, Z., Chen, Y. J., Yang, Y., and Huang, Q. (2018). Lithospheric structure of the Northern Ordos from ambient noise and teleseismic surface wave tomography. J. Geophys. Res. Solid Earth 123 (8), 6940–6957. doi:10.1029/2017jb015256
Li, Y., Wang, X., Zhang, R., Wu, Q., and Ding, Z. (2017). Crustal structure across the NE Tibetan Plateau and Ordos Block from the joint inversion of receiver functions and Rayleigh-wave dispersions. Tectonophysics 705, 33–41. doi:10.1016/j.tecto.2017.03.020
Li, Z., Guo, B., Liu, Q., Chen, J., Li, S., and Qi, S. (2019). P-wave structure of upper mantle beneath the Northeastern Tibetan Plateau from multi-scale seismic tomography. Chinese Journal of Geophysics (in Chinese) 62 (4), 1244–1255. doi:10.6038/cjg2019J0392
Liang, S., Gan, W., Shen, C., Zhou, D., Liu, J., Chen, W., et al. (2013). Three-dimensional velocity field of present-day crustal motion of the Tibetan Plateau derived from GPS measurements. J. Geophys. Res. Solid Earth 118 (10), 5722–5732. doi:10.1002/2013jb010503
Lin, F. C., Ritzwoller, M. H., and Snieder, R. (2009). Eikonal tomography: Surface wave tomography by phase front tracking across a regional broad-band seismic array. Geophysical Journal International 177 (3), 1091–1110. doi:10.1111/j.1365-246x.2009.04105.x
Liu, J., Wu, J., Wang, W., Cai, Y., and Fang, L. (2021). Seismic anisotropy and implications for lithospheric deformation beneath the Ordos Block and surrounding regions. Geophysical Journal International 226 (3), 1885–1896. doi:10.1093/gji/ggab154
Liu, J., Wu, J., Wang, W., Fang, L., and Chang, K. (2020). Seismic anisotropy beneath the eastern margin of the Tibetan Plateau from SKS splitting observations. Tectonophysics 785, 228430. doi:10.1016/j.tecto.2020.228430
Molnar, P., and Tapponnier, P. (1975). Cenozoic Tectonics of Asia: Effects of a Continental Collision: Features of recent continental tectonics in Asia can be interpreted as results of the India-Eurasia collision. Science 189 (4201), 419–426. doi:10.1126/science.189.4201.419
Pan, J., Li, Y., Wu, Q., Ding, Z., and Yu, D. (2017). Phase velocity maps of Rayleigh wave based on a dense coverage and portable seismic array in NE Tibetan plateau and its adjacent regions. Chin. J. Geophys. 60 (6), 2291–2303. doi:10.6038/cjg20170621
Peltzer, G., and Tapponnier, P. (1998). Formation and evolution of strike-slip faults, rifts, and basins during the India-Asia collision: An experimental approach. J. Geophys. Res. Solid Earth 93 (B12), 15085–15117.
Priestley, K., and McKenzie, K. (2006). The thermal structure of the lithosphere from shear wave velocities. Earth Planet. Sci. Lett. 244 (1-2), 285–301.
Qiu, R., Li, T., Zhou, S., Deng, J., Xiao, Q., and Geng, S. (2006). The composition and evolution of the lithosphere in China continent (in Chinese). Beijing: Geological Publishing House.
Royden, L. H., Burchfiel, B. C., King, R. W., Chen, Z., Shen, F., Liu, Y., et al. (1997). Surface de-formation and lower crustal flow in eastern Tibet. Science 276, 788–790. doi:10.1126/science.276.5313.788
Shen, W., Ritzwoller, M. H., Kang, D., Kim, Y., Lin, F. C., Ning, J., et al. (2016). A seismic reference model for the crust and uppermost mantle beneath China from surface wave dispersion. Geophys. J. Int. 206 (2), 954–979. doi:10.1093/gji/ggw175
Silver, P., and Holt, W. (2002). The mantle flow field beneath western North America. Science 295 (5557), 1054–1057.
Tapponnier, P., Zhiqin, X., Roger, F., Meyer, B., Arnaud, N., Wittlinger, G., et al. (2001). Oblique stepwise rise and growth of the tibet plateau. Science 294, 1671–1677. doi:10.1126/science.105978
Tian, Y., and Zhao, D. (2011). Destruction mechanism of the North China craton: insight from P and S wave mantle tomography. Journal of Asian Earth Sciences 42 (6), 1132–1145. doi:10.1016/j.jseaes.2011.06.010
Tian, Y., Zhao, D., Sun, R., and Teng, J. (2009). Seismic imaging of the crust and upper mantle beneath the North China Craton. Physics of the Earth and Planetary Interiors 172 (3-4), 169–182. doi:10.1016/j.pepi.2008.09.002
Vinnik, L., Makeyeva, L., Milev, A., and Usenko, A. (1992). Global patterns of azimuthal anisotropy and deformations in the continental mantle. Geophys. J. Int. 111 (3), 433–447. doi:10.1111/j.1365-246X.1992.tb02102.x
Wang, S., Wang, F., Zhang, J., Jia, S., Zhang, C., Zhao, J., et al. (2014). The P-wave velocity structure of the lithosphere of the North China craton—results from the wendeng-alxa Left banner deep seismic sounding profile. Sci. China Earth Sci. 57 (9), 2053–2063. doi:10.1007/s11430-014-4903-7
Wang, W., Wu, J., Fang, L., Lai, G., and Cai, Y. (2017b). Crustal thickness and Poisson's ratio in southwest China based on data from dense seismic arrays. J. Geophys. Res. Solid Earth 122, 7219–7235. doi:10.1002/2017JB013978
Wang, W., Wu, J., Fang, L., Lai, G., and Cai, Y. (2017a). Sedimentary and crustal thicknesses and Poisson's ratios for the NE Tibetan Plateau and its adjacent regions based on dense seismic arrays. Earth and Planetary Science Letters 462, 76–85. doi:10.1016/j.epsl.2016.12.040
Wang, W., Wu, J., Fang, L., Lai, G., Yang, T., and Cai, Y. (2014a). S wave velocity structure in southwest China from surface wave tomography and receiver functions. J. Geophys. Res. Solid Earth 119 (2), 1061–1078. doi:10.1002/2013jb010317
Wang, X., Li, Y., Ding, Z., Zhu, L., Wang, C., Bao, X., et al. (2017). Three-dimensional lithospheric S wave velocity model of the NE Tibetan Plateau and Western North China Craton. J. Geophys. Res. Solid Earth 122 (8), 6703–6720. doi:10.1002/2017jb014203
Wei, X., Jiang, M., Liang, X., Chen, L., and Ai, Y. (2017). Limited southward underthrusting of the Asian lithosphere and material extrusion beneath the northeastern margin of Tibet, inferred from teleseismic Rayleigh wave tomography. J. Geophys. Res. Solid Earth 122 (9), 7172–7189. doi:10.1002/2016jb013832
Wei, Z., Chen, L., Jiang, M., and Ling, Y. (2015). Lithospheric structure beneath the central and Western north China craton and the adjacent qilian orogenic belt from Rayleigh wave dispersion analysis. Tectonophysics 646, 130–140. doi:10.1016/j.tecto.2015.02.008
Wu, J., Liu, Y., Zhong, S., Wang, W., Cai, Y., Wang, W., et al. (2022). Lithospheric structure beneath Ordos Block and surrounding areas from joint inversion of receiver function and surface wave dispersion. Sci. China Earth Sci. 65, 1399–1413. doi:10.1007/s11430-021-9895-0
Yang, Y., Zheng, Y., Chen, J., Zhou, S., Celyan, S., Sandvol, E., et al. (2013). Rayleigh wave phase velocity maps of Tibet and the surrounding regions from ambient seismic noise tomography. Geochem. Geophys. Geosyst. 11 (8), 10–1029. doi:10.1029/2010gc003119
Yang, Z., Chen, Y., Zhang, X., and Song, X. (2019). S-wave velocity structure and radial anisotropy in eastern and north-eastern margins of Tibetan plateau. Chinese Journal of Geophysics (in Chinese) 62 (12), 4554–4570. doi:10.6038/cjg2019N0149
Yang, Z., and Zhang, X. (2018). Ambient noise Rayleigh wave tomography in the northeastern Tibetan Plateau. Acta Seismologica Sinica 40 (1), 1–12.
Ye, Z., Gao, R., Li, Q., Xu, X., Huang, X., Xiong, X., et al. (2018). Eastward extrusion and northward expansion of the Tibetan Plateau&mdash;Discussions for the deep processes of the plateau uplift. Chin. Sci. Bull. 63 (31), 3217–3228. doi:10.1360/n972018-00478
Ye, Z., Li, J., Gao, R., Song, X., Li, Q., Li, Y., et al. (2017). Crustal and uppermost mantle structure across the tibet-qinling transition zone in NE tibet: Implications for material extrusion beneath the Tibetan plateau. Geophys. Res. Lett. 44 (20), 316–323. doi:10.1002/2017gl075141
Yin, A., and Harrison, T. (2000). Geologic evolution of the Himalayan-Tibetan orogen. Annu. Rev. Earth Planet. Sci. 28 (1), 211–280.
Yu, Y., and Chen, Y. J. (2016). Seismic anisotropy beneath the southern Ordos block and the Qinling-Dabie orogen, China: Eastward Tibetan asthenospheric flow around the southern Ordos. Earth and Planetary Science Letters 455, 1–6. doi:10.1016/j.epsl.2016.08.026
Zhan, Y., Zhao, G., Wang, L., Wang, J., Chen, X., Zhao, L., et al. (2014). Deep electric structure beneath the intersection area of West Qinling orogenic zone with North-South Seismic tectonic zone in China. Chinese Journal of Geophysics (in Chinese) 57 (8), 2594–2607. doi:10.6038/cjg20140819
Zhang, G., Zhang, Z., and Dong, Y. (1995). Nature of main tectono-lithostratigraphic units of the qinling orogen: Implications for the tectonic evolution. Acta Petrologica Sinica 11 (2), 101–114.
Zhang, H., Teng, J., Tian, X., Zhang, Z., and Gao, R. (2013). Lithospheric thickness and upper mantle anisotropy beneath the northeastern Tibetan Plateau. Chinese Journal of Geophysics (in Chinese) 56 (2), 459–471. doi:10.6038/cjg20130210
Zhang, H., Teng, J., Tian, X., Zhang, Z., Gao, R., and Liu, J. (2012). Lithospheric thickness and upper-mantle deformation beneath the NE Tibetan Plateau inferred from S receiver functions and SKS splitting measurements. Geophysical Journal International 191 (3), 1285–1294. doi:10.1111/j.1365-246x.2012.05667.x
Zhao, G., Sun, M., Wilde, S. A., and Sanzhong, L. (2005). Late Archean to Paleoproterozoic evolution of the North China Craton: Key issues revisited. Precambrian Res. 136 (3), 177–202.
Zheng, C., Ding, Z., and Song, X. (2018). Joint inversion of surface wave dispersion and receiver functions for crustal and uppermost mantle structure beneath the northern north-south seismic zone. Chinese Journal of Geophysics (in Chinese) 61 (4), 1211–1224. doi:10.6038/cjg2018L0443
Zheng, D., Li, H., Shen, Y., Tan, J., Ouyang, L., and Li, X. (2016). Crustal and upper mantle structure beneath the northeastern Tibetan Plateau from joint analysis of receiver functions and Rayleigh wave dispersions. Geophys. J. Int. 204 (1), 583–590. doi:10.1093/gji/ggv469
Keywords: receiver function, surface wave, joint inversion, S-wave velocity structure, NE Tibetan Plateau
Citation: Wang W, Cai G, Wu J and Fang L (2023) The lithospheric S-wave velocity structure beneath the NE Tibetan Plateau and its surrounding craton basins. Front. Earth Sci. 10:1066265. doi: 10.3389/feart.2022.1066265
Received: 11 October 2022; Accepted: 14 November 2022;
Published: 16 January 2023.
Edited by:
Masayuki Obayashi, Japan Agency for Marine-Earth Science and Technology (JAMSTEC), JapanReviewed by:
Takeshi Akuhara, The University of Tokyo, JapanMei Feng, Chinese Academy of Geological Science, China
Copyright © 2023 Wang, Cai, Wu and Fang. This is an open-access article distributed under the terms of the Creative Commons Attribution License (CC BY). The use, distribution or reproduction in other forums is permitted, provided the original author(s) and the copyright owner(s) are credited and that the original publication in this journal is cited, in accordance with accepted academic practice. No use, distribution or reproduction is permitted which does not comply with these terms.
*Correspondence: Weilai Wang, d2FuZ3dsQGNlYS1pZ3AuYWMuY24=