 Lijun Huang
 Xiaopeng Cui1,2,3,4*
 Yuting Yang
95% of researchers rate our articles as excellent or good
Learn more about the work of our research integrity team to safeguard the quality of each article we publish.
Find out more
ORIGINAL RESEARCH article
Front. Earth Sci. , 03 January 2023
Sec. Atmospheric Science
Volume 10 - 2022 | https://doi.org/10.3389/feart.2022.1066070
This article is part of the Research Topic Observation Characteristics and Formation Mechanisms of Severe Weather Events View all 13 articles
This study conducts objective circulation classifications of rainstorm days associated with Northeast China Cold Vortexes (NECVs) in the northeast of China (NEC) during the warm seasons (May–September). To determine the optimal method and number of types, the performances of ten objective circulation classification methods are first evaluated by several evaluation indexes. Self-Organizing Maps method is then used as the optimal method to classify rainstorms into five types. The results show that the different synoptic circulation patterns are accompanied by distinctive large-scale circulation backgrounds, precipitation characteristics, thermodynamic and moisture conditions. In type 1, the strong western Pacific subtropical high extends north to connect with the mid-latitude ridge in the east of the NEC, and a shallow trough lies in the west of the NEC. This configuration brings the most daily and hourly mean precipitation of all types. A low-pressure anomaly with an obvious trough controls the NEC in type 2, which has a higher frequency. In type 3, the low-pressure anomaly shrinks to the south of the NEC, and the NEC is controlled by the cut-off low vortex. Type 4 has the strongest hourly precipitation and features a meridional high-low-high pressure anomaly, and the narrow zonal low-pressure anomaly is in the NEC. Two low-pressure anomalies and a westerly trough can be found in type 5 and are distributed in a southwest-northeast orientation. These synoptic circulation patterns and the corresponding spatial distribution of rainstorm-day precipitation indicate that the objective circulation classification is effective in helping understand the large-scale circulation and precipitation characteristics associated with NECVs.
The Northeast China Cold Vortex (NECV) is one of the major high-impact weather systems in the northeast of China (NEC) (Tao, 1980). NECVs are usually persistent and quasi-stationary and often cause severe convective weather, such as rainstorms and floods in the NEC (Zheng et al., 1992; Sun et al., 1994; Zhao and Sun, 2006). Given the significant impact of NECVs, numerous relevant studies have been carried out, including the identification and tracking of NECVs (Sun et al., 1994; Hu et al., 2010; Wang et al., 2012), climatical characteristics of NECVs (Zhang et al., 2008; Hu et al., 2010), mechanisms of occurrence and development of NECVs (Zhong, 2011; Fu and Sun, 2012), and the mesoscale features of NECVs (Chen et al., 2005; Zhong et al., 2013).
The rainstorm is caused by the interaction of multiple-scale atmospheric circulation systems (Tao, 1980). NECVs can provide favorable large-scale circulation conditions for the occurrence and development of rainstorms in the NEC. Thus, it is essential to classify the circulation of the rainstorms associated with NECVs, which can help understand the large-scale circulation background and the formation mechanism of the rainstorm, improving rainstorm forecasting. Huth et al. (2008) characterized circulation classification methods into three basic types: subjective (also called manual), mixed (hybrid), and objective (computer-assisted, automated). With the assistance of computers and objective classification technology, the objective method has been developed based on statistical theory, providing classification for large samples using consistent standards. It compensates for some limitations of the subjective and mixed classification methods, such as subjectivity, non-repeatability, and extremely high time consumption. As a result, objective classification methods have been widely applied in synoptic and climatological studies (Schmutz and Wanner, 1998; Liu et al., 2015; Cahynova and Huth, 2016; Zhang et al., 2018; Zhao et al., 2019; Wang et al., 2021).
Some studies have been conducted to classify NECV systems. Based on the generation locations of NECVs, Sun et al. (1994) grouped NECVs into “south vortex, middle vortex, and north vortex.” Xie and Bueh (2015) used a rotating EOF analysis method by ridges (or blocks) to classify the NECVs into four types. Fang et al. (2021) divided NECV activity paths into four types by applying machine learning methods. The aforementioned classification studies focused on NECVs but seldom considered the relationship between NECVs and rainstorms. More attention should be focused on the NECVs that cause rainstorms. It is of great significance to classify rainstorms associated with NECVs by objective classification methods. In addition, previous studies have pointed out that there is no universal classification method available for all regions and climate variables. Classification performance significantly varies due to many factors, such as regions, periods, and variables (Beck and Philipp, 2010; Casado and Pastor, 2016). To further study the relationship between synoptic circulation and rainstorms associated with NECVs, it is necessary to assess the ability of different classification methods.
Based on previous research, we focus on the classification of large-scale circulation during the rainstorms associated with NECVs in the warm seasons (May–September) from 2000 to 2019. First, multiple objective classification methods and the number of types are evaluated. The method and the number of types with the best performance are selected and employed in the following research. In addition, the anomaly has been reported as a better indicator for rainstorms compared with observation (Qian et al., 2012). Therefore, the 500 hPa geopotential height anomaly is selected as the objective classification variable in this study. Section 2 briefly introduces the data, objective circulation methods, and evaluation measures. The results of the objective circulation method, the precipitation characteristics, and the water vapor conditions of rainstorms associated with NECVs are presented in Section 3. Conclusion and relevant discussions are given in Section 4.
The NECV dataset during 2000–2019 is from Huang and Cui (2022).
The precipitation data are derived from the hourly precipitation dataset of national surface automatic weather stations (AWSs) in the warm seasons (May–September) from 2000 to 2019 provided by the China Meteorological Administration (CMA). Strict quality controls, including climatological extremes, internal consistency, and temporal consistency, have been performed for the dataset (Ren et al., 2015). To avoid the impact of missing values, the AWS will be excluded if the rate of missing values exceeds 5%. Figure 1 shows the spatial distribution of 220 trusted national AWSs (black dots) in the NEC after the quality control of time continuity. Considering that there are only four trusted national AWSs in the HulunBuir region and all of them are distributed in the lower altitude region in the east of HulunBuir, they cannot represent the characteristics of precipitation of the whole region. Thus, all AWSs in HulunBuir are removed, and 216 AWSs in the NEC are finally selected for the following analysis.
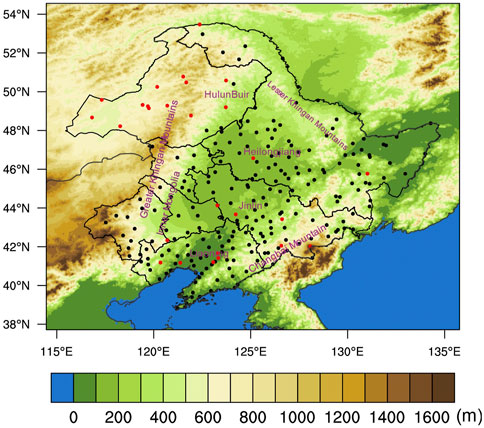
FIGURE 1. Spatial distribution of AWSs in the NEC, superimposed with topographic height (units: m). The black dots denote the AWSs that pass quality control, and the red dots denote the AWSs that fail quality control.
A rainstorm day is defined as a day in which the accumulated precipitation is greater than or equal to 50 mm from 0800 local standard time (LST, LST = UTC + 8 h) to 0800 LST of the next day for an AWS. A rainstorm day associated with NECVs is defined as a rainstorm day occurring during the influence period of NECVs. A total of 306 rainstorm days associated with NECVs are identified during the warm seasons of 2000–2019 for the study of objective circulation classification.
NCEP/NCAR reanalysis data (Kalnay et al., 1996) with a horizontal resolution of 2.5° × 2.5° from 1991 to 2020 are used for the objective classifications and subsequent synthetic analysis. The variables include geopotential height, wind, relative humidity, and specific humidity.
Cost733class (Philipp et al., 2014) is a widely used classification software. There are five groups of objective classification methods in the Cost733class, including classifications based on principal component analysis (PCA), classifications using the leader algorithm (LDR), hierarchical cluster analysis (HCL), optimization algorithms (OPT), and random classifications (RAN). In this study, ten objective circulation classification methods are utilized and evaluated (Table 1).

TABLE 1. Classification methods compared in this study.
PCA (or empirical orthogonal functions) aims to select principal components (PCs) by decomposition and then assign each case to a PC according to some rule. Both PCT (Huth, 1993) and PTT (Philipp, 2009) are in T-mode, but PCT uses oblique rotation while PTT uses orthogonal rotation.
Methods based on LDR can also be called “correlation-based” methods. The main idea is to find leader patterns by considering the number of elements that are similar to the potential leader pattern exceeding a certain threshold. In LND (Lund, 1963), at first, set Pearson correlation coefficient (r
HCL (Murtagh, 1985) is also a widespread classification method that first splits up all cases into two types according to some criterion. On a second hierarchy level, it splits up one of these types again into two types, and so on.
OPT works non-hierarchically and can be considered a standardized method. The aim of OPT is to minimize within-type variability and achieve optimal partitioning. CKM (Enke and Spekat, 1997) modifies the minimum distance to produce the seeds for k-means clustering. KMD (Kaufman and Rousseeuw, 1990) is similar to k-means, but it employs given data points as centers of the clusters. SOM (Michaelides et al., 2007) arranges types defined by their features (grid point values) in a structure where similar types are adjacent to each other (a map).
RAN (Philipp et al., 2014) randomly selects any arbitrary number as type number for each case and chooses the best result according to the explained cluster variance after 1,000 iterations. RAC (Philipp et al., 2014) is similar to RAN, except for any arbitrary case used as a centroid for each type. All the other cases are then assigned to these centroids by the minimum Euclidean distance.
In this study, the 500 hPa geopotential height anomaly at 08 LST is used to classify the circulation background of rainstorm days associated with NECVs in the warm seasons from 2000 to 2019. The region is set as 90–150°E, 20–70°N. The geopotential height anomaly is calculated by the 500 hPa geopotential height minus the monthly mean of 30 years (1991–2020).
Generally, a better objective classification method should achieve smaller within-type differences and bigger between-type differences. The following evaluation indicators are used in this study to obtain the optimal objective classification method and the corresponding number of types.
The first selected evaluation index is the explained variation (EV), which can be used to quantify the proportion of variance of the dependent variable as well as to represent within-type differences (Buishand and Brandsma, 1997; Beck and Philipp, 2010; Casado et al., 2010). EV can be calculated as follows:
WSS and TSS represent the within-type sum of squares and the total sum of squares, thereby taking into account the number of all elements (n) and types (k), respectively.
The second evaluation index is the pseudo-F statistic (PF) (Calinski and Harabasz, 1974; Broderick and Fealy, 2015), which is the ratio of the between-type sum of squares (BSS) to WSS, and its formula is:
The larger PF implies bigger between-type differences and better quality of the classification.
Figure 2 shows the evaluation results of different objective classification methods using EV and PF, respectively. Except for KIR and RAN, other classification methods exhibit better ability for classification. Among all the classification methods, SOM performs best in both EV and PF. However, when the number of types is increasing, EV of all the classification methods shows a tendency to increase. It indicates that the within-type differences decrease, and the proficiency of classification improves at the same time. The result of PF shows opposition compared with EV. Based on the evaluation results of EV and PF, SOM can be decided as the optimal classification method.

FIGURE 2. Evaluation results of different objective classification methods by line charts. (A) EV; (B) PF.
For the optimal classification number of types based on SOM, a new evaluation index (EVPF) is created by considering both EV and PF. First, to eliminate the dimensional influence between EV and PF, min-max normalization is performed on these two indices:
In which
The new evaluation index can be expressed as:
EVPF ranges from 0 to 1. A larger EVPF value indicates better classification quality.
With min-max normalization, EVPF equals 0 when the number of types is 2 or 15. Therefore, Figure 3 presents the evaluation results of EVPF for the optimal classification method (SOM), with the number of types between 3 and 14. It can be found that SOM shows a better classification performance when the number of types is between three and six. The highest value of EVPF is 0.467 when the number of types is five. If the number of types is larger than five, the quality of classification grows worse.
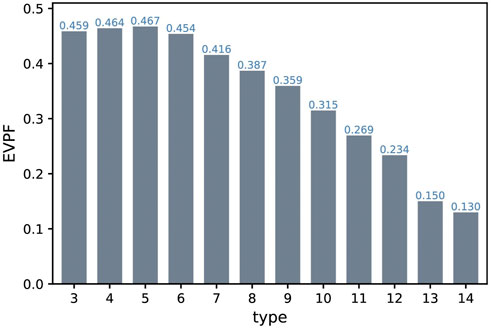
FIGURE 3. Evaluation of SOM method using EVPF.
Based on the above results, SOM is finally determined as the optimal objective circulation classification method to classify the rainstorm days associated with NECVs in the warm seasons from 2000 to 2019, and the optimal classification number is five.
Figure 4 shows the five types of rainstorm days associated with NECVs in the NEC over the warm seasons from 2000 to 2019 based on the 500 hPa geopotential height anomaly at 08 LST by SOM.
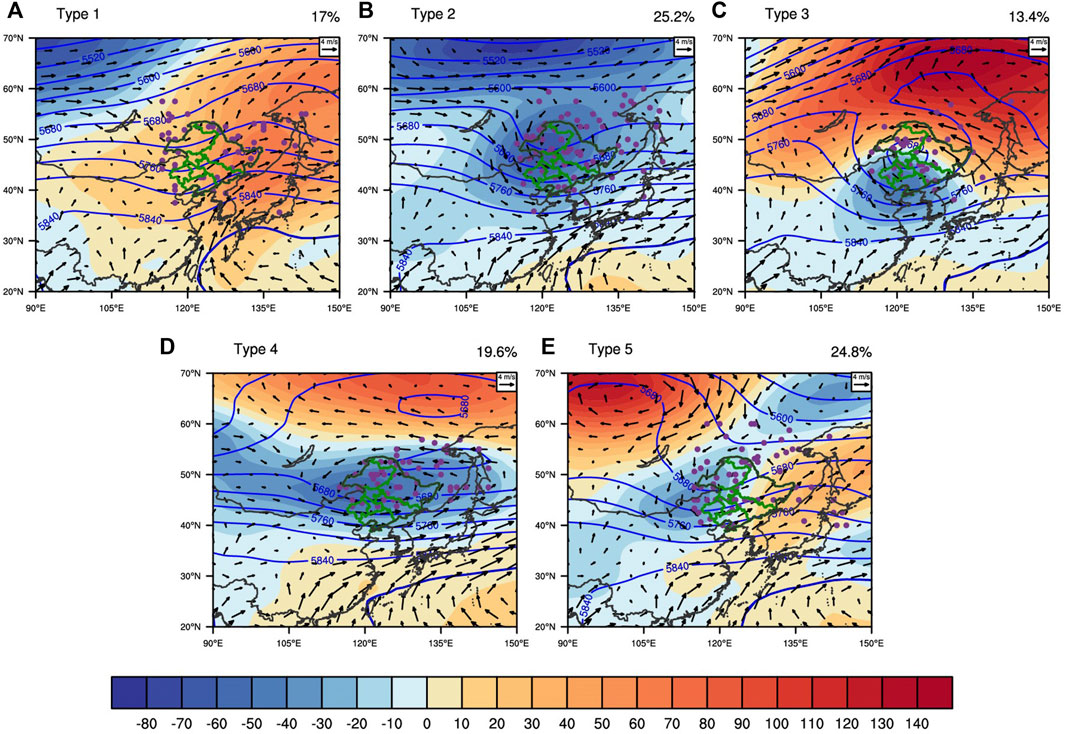
FIGURE 4. Geopotential height (solid blue lines, units: gpm), geopotential height anomaly (shaded, units: gpm) at 500 hPa, and wind at 850 hPa (arrow, units: m/s) under five types of synoptic circulation patterns (A-E) obtained by SOM. The percentages for each circulation type are shown on the top right. Composite fields for the rainstrom days associated with NECVs of each type are shown in FIGUREs (similarly to Figures 8, 9). The purple dots represent the daily mean locations of the NECVs, and the green map denotes the NEC.
Type 1 accounts for about 17% (Figure 4A). In this type, the western Pacific subtropical high (WPSH) extends west to the east coast of Taiwan Island and north to the southwest coast of Japan, which is connected to the mid-latitude ridge in the east of the NEC. In addition, the centers of the high-pressure anomalies are located in the eastern part of the NEC and East Siberia. In the northwest of Lake Baikal, there is a low-pressure anomaly, and a mid-latitude westerly trough is in the west of the NEC. The mean intensity of NECVs is the weakest (5,638 gpm) and the mean size is also the smallest (766 km) of all types.
Type 2 accounts for about 25.2%, which is the majority (Figure 4B). Except for the region where the WPSH is occupied, the other region of this type is controlled by the low-pressure anomaly, and the two centers of the low-pressure anomalies at 500 hPa are located in the NEC and its north. There is an obvious trough in the NEC. Compared with type 1 (Figure 4A), the WPSH retreats southeasterly. NECVs of this type have the strongest mean intensity (5,575 gpm) and their mean size (856 km) is larger than that of type 1.
The proportion of type 3 is the least of all five types, at roughly 13.4% (Figure 4C). In this type, the region north of 45°N is controlled by a strong high-pressure anomaly. The low-pressure anomaly shrinks to the south of the NEC, and the NEC is controlled by the cut-off low vortex. Compared with the above two types, the WPSH retreats further to the southeast. The mean intensity of NECVs (5,635 gpm) is similar to that of type 1, while the mean size (1,014 km) is the largest.
Type 4 accounts for nearly 19.6% of the total (Figure 4D). The high-pressure and low-pressure anomalies are distributed alternately from north to south. The center of the low-pressure anomaly is located in the west of the NEC. The WPSH at 500 hPa is the most westward of these five types, reaching the Taiwan Strait. The mean intensity of NECVs (5,587 gpm) is a little weaker than that of type 2, with the mean size (889 km) larger than both type 1 and 2.
Type 5 accounts for about 24.8% (Figure 4E). The two low-pressure anomalies are distributed southwest to northeast, with their centers located in the west of the NEC and East Siberia, respectively. A northeast-southwest trough line can be found in the westerly trough, and the WPSH at 500 hPa is similar to that of type 2. The mean intensity of NECVs ranks third (5,601 gpm) and the mean size (892 km) is similar to that of type 4.
The wind at 850 hPa of each type corresponding to NECV systems presents cyclonic vortexes except for type 1, where there is a deep low trough. However, the morphology, size, and location of the cyclonic vortexes of each type at 850 hPa are slightly different (Figure 4).
It is observed in Figure 4 that the large-scale circulation backgrounds of rainstorm days associated with NECVs under different types present distinct discrepancies. Different large-scale circulation backgrounds can lead to differences in water vapor transport and convergence, as well as different precipitation characteristics of rainstorms associated with NECVs.
Rainstorm days associated with NECVs frequently occur from June to August, especially in July (132 times), accounting for about 43% of the total (not shown). Figure 5 further presents the semi-monthly variation of the frequency of rainstorm days associated with NECVs under different synoptic circulation patterns in the warm seasons during 2000–2019. Rainstorm days associated with NECVs in type 1 mainly occur in the second half of July and the second half of June. The frequency of rainstorm days associated with NECVs in type 2 peaks in the first half of July at 28, followed by the second half of July (14 times), while the frequencies in other periods of the warm seasons are all less than 10. Type 3 is mostly in the second half of July to the first half of September, while type 4 predominantly appears from June to August, especially in the first half of July and August. Rainstorm days associated with NECVs in type 5 are more frequent in the second half of July, which ranks second only to type 2 in the first half of July.
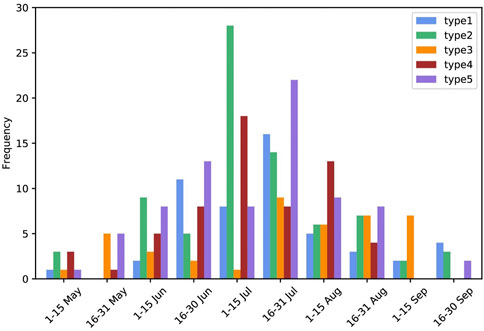
FIGURE 5. Semi-monthly variation of the frequency of rainstorm days associated with NECVs under five types of synoptic circulation patterns.
In different synoptic circulation patterns, the daily precipitation characteristics of rainstorms associated with the NECVs in the warm seasons differ dramatically (Figure 6). Under the control of NECVs, rainstorms occur in the NEC with strong local characteristics (Bai andJin, 1993), which can also be found in Figure 6C. For type 1 and 5, the mean number of AWSs reaching the rainstorm level is about five in a rainstorm day, which is more than that of other types. The mean daily precipitation of rainstorm days associated with NECVs in type 1 is the largest among all five types, reaching 76 mm. The extreme value exceeds 280 mm/24 h and hits the level of an extremely heavy rainstorm, while the extremes of daily precipitation of other types are all less than 200 mm. Meanwhile, the mean hourly maximum of this type is more than 25 mm/h, which is stronger than the others. However, the hourly extreme of rainfall on rainstorm days associated with NECVs appears in type 4, reaching about 130 mm/h. Note that in type 1, the high-pressure anomaly hinders the upstream NECV from moving to the east (Figure 4A). This configuration is favorable for water vapor transport to the NEC and results in more daily precipitation and large-scale rainstorms (Figures 6A,C). A similar configuration of the high-pressure anomaly block can also be found in type 5 (Figures 4E, 6C). Moreover, type 4 frequently occurs in the first half of July and the first half of August (Figure 5), when the WPSH is active and extends most westward among all types. The NEC of this type is in the narrow zonal low-pressure anomaly with a little stronger NECVs (Figure 4D). It is favorable to the eastward movement of the low-value systems in the upstream area of the NEC, further leading to extreme hourly precipitation (Figure 6D). In addition, the maximum hourly precipitation in type 2 can reach 100 mm/h (Figure 6B). The low-value system is also active in mid and high latitudes, and the mean intensity of NECVs is the strongest. Similar to type 4, the NEC is also mainly controlled by a low-pressure anomaly (Figure 4B), which is also conducive to the occurrence of stronger hourly precipitation (Figure 6B).
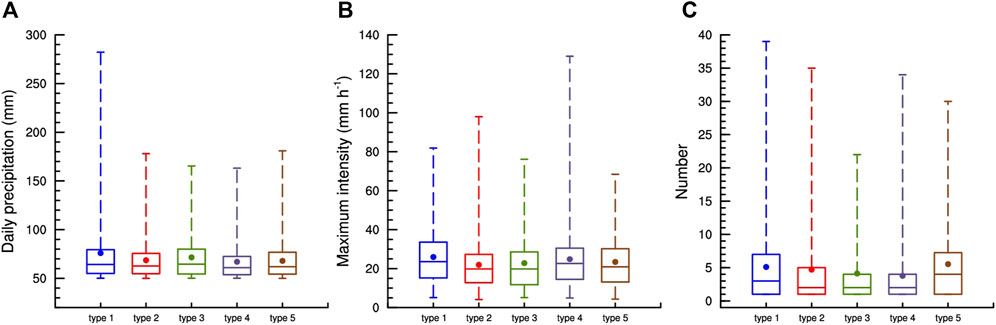
FIGURE 6. Box-and-whisker plots of daily accumulated precipitation (A), units: mm, maximum hourly precipitation (B), units: mm/h, and the number of AWSs reaching rainstorm level (C) in a rainstorm day associated with the NECV under five types of synoptic circulation patterns. The highest line denotes the maximum and the lowest line denotes the minimum. The uppermost border of boxes denotes the 75% percentile and the lowermost border denotes the 25% percentile; medians and mean values are denoted by the black solid line and the solid dot in boxes, respectively.
The spatial distribution of accumulated precipitation on rainstorm days associated with NECVs in the warm seasons during 2000–2019 demonstrates remarkable non-uniformity and differences under different synoptic circulation patterns (Figure 7). In addition, the spatial distribution of the frequency of rainstorms shows consistencies with accumulated precipitation (not shown). The rainstorms mostly concentrate near Changbai Mountain and the narrow northeast plain regions in the middle of Liaoning Province, which reflects the effect of topography on the rainstorms. Rainstorms of type 1 mainly occur in the central plain of Liaoning province and central Jilin Province (Figure 7A). The extreme precipitation center of type 2 is mostly located near Changbai Mountain, especially in the southern part of Changbai Mountain in Liaoning Province (Figure 7B). The accumulated precipitation of rainstorms in type 3 and 4 is weaker than that of other types, and the precipitation center in type 3 is in the southwest of Changbai Mountain (Figure 7C). Unlike in other types, the precipitation centers in type 4 are scattered around the topography (Figure 7D). The extreme precipitation centers of type 5 are found near Changbai Mountain and the coastal areas in the southeast of Liaoning Province. The sub-extreme center is distributed in the northwest of Heilongjiang Province where Greater and Lesser Khingan Mountains intersect (Figure 7E).
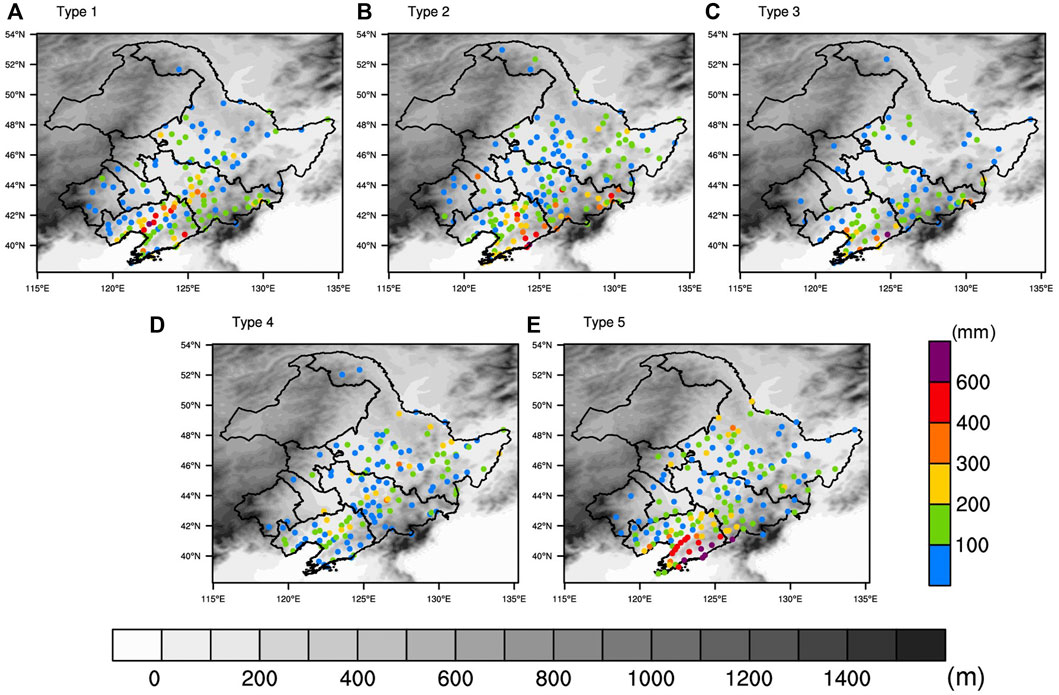
FIGURE 7. Spatial distribution of accumulated precipitation (units: m) of rainstorm days associated with NECVs under five types of synoptic circulation patterns (A-E) in the warm seasons from 2000 to 2019, superimposed with topographic height (units: m).
Previous research has revealed that the local topography of the NEC has a great impact on the circulation and rainfall of NECVs (Wang and Xie, 1994; Zhong, 2011). Moreover, our study also shows that the interaction of local topography and different large-scale circulations can lead to different water vapor transport and convergence ascending processes, which can partially explain the unique precipitation characteristics of different circulation types.
In type 1 (Figure 8A), a low-pressure vortex center at 925 hPa is located in the northwest NEC, and there is a positive equivalent potential temperature (

FIGURE 8. Wind (wind barb, units: m/s), equivalent potential temperature anomaly (red solid lines, units: K) at 925 hPa under five types of synoptic circulation patterns (A-E). The green map denotes the NEC.
Water vapor transport and convergence are indispensable for the occurrence of heavy precipitation. Figure 9 shows water vapor transport and convergence in the whole atmosphere layer under different circulation patterns. In the NEC, southwesterly wind transport and convergence are apparent in type 1 and 5, whereas westerly wind transport and convergence are dominant in type 2 and 4, and the wind convergence of type 3 is stronger than that of other types, resulting in different heavy precipitation characteristics (Figures 6, 7). Differences can also be found in the ratio of rainstorm-day accumulated precipitation under different circulation types. The AWSs of type 1, accounting for more than 50%, are concentrated in the central and southern parts of the NEC (Figure 9A). The AWSs of type 2 are mostly located in the northeast and southwest parts of the NEC (Figure 9B). Only four AWSs in type 3 account for more than 50%, which is the least among all five types (Figure 9C). The AWSs accounting for more than 50% of type 4 are also mainly in the west-southwest to the east-northeast direction (Figure 9D), while those of type 5 (Figure 9E) are widely distributed in the southwest-northeast orientation. The distribution of ASWs with a high proportion of precipitation shows consistency with water vapor convergence areas of different circulation patterns. Furthermore, the precipitable water in the NEC can reach more than 40 mm (not shown). However, for a rainstorm, water vapor of this magnitude is obviously insufficient. Therefore, the transport and convergence of water vapor under the influence of different circulations are of vital importance.
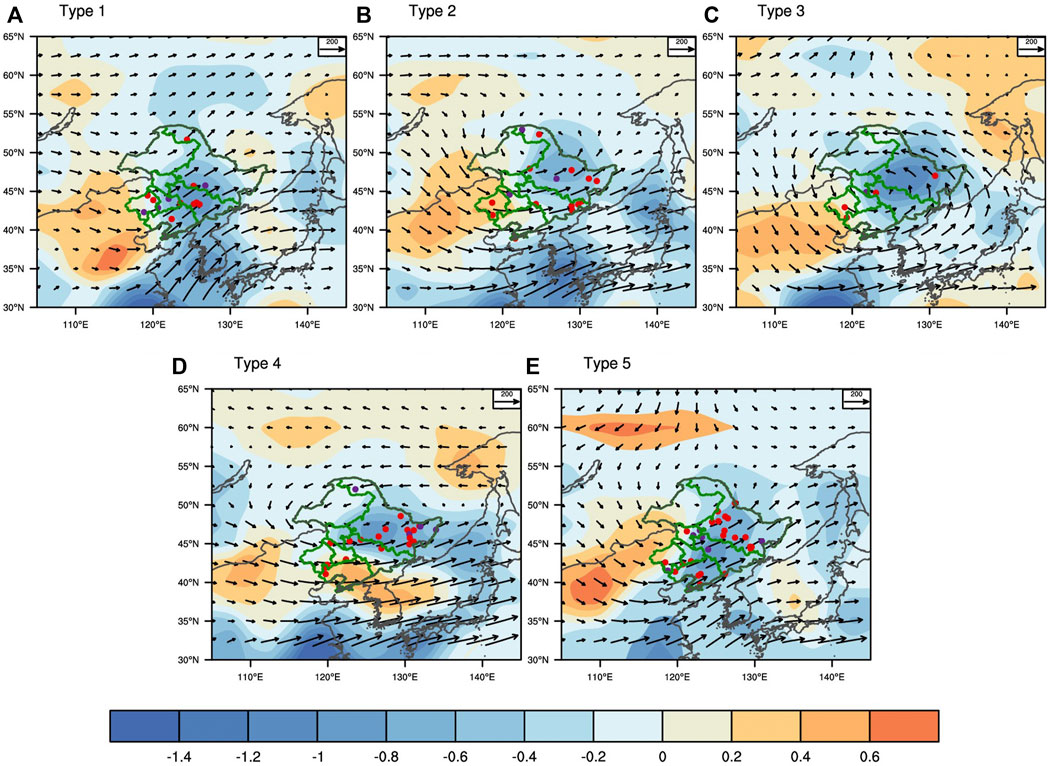
FIGURE 9. Water vapor fluxes of the whole atmosphere layer (vector, units: kg m−1 s−1) and its divergence (shaded, units: 10−4 kg m−1 s−1) under five types of synoptic circulation patterns (A-E). The red dots represent the accumulated precipitation of rainstorm days associated with NECVs in this type accounts for 50%–80% of all accumulated precipitation of rainstorm days associated with NECVs and the purple dots represent equal to or greater than 80%. The green map denotes the NEC.
In this study, to reveal the large-scale synoptic circulation patterns on the rainstorm days associated with NECVs in the warm seasons (May–September), ten objective circulation classification methods are selected to conduct objective circulation classifications on the 500 hPa geopotential height anomaly. The optimal objective classification method and the corresponding type number are determined after evaluation. Large-scale circulation backgrounds, precipitation characteristics, thermodynamic and moisture conditions under different synoptic circulation patterns are further discussed. The main conclusion are summarized as follows:
(1) After evaluating the performance of ten objective circulation classification methods by EV, PF, and EVPF, SOM is decided as the optimal objective classification method, and the optimal number of classification types is five.
(2) The large-scale circulation backgrounds of different classification types at 500 hPa are investigated. In type 1, the strong WPSH extends north and connects with the mid-latitude ridge in the east of the NEC. There is a shallow trough in the west of the NEC. NECVs of this type have the weakest mean intensity and the smallest mean radius. Type 2 has a higher frequency (25.2%). In this type, except for the region occupied by the WPSH, the other region is controlled by the low-pressure anomaly. There is an obvious trough in the NEC. Compared with type 1, the WPSH retreats to the southeast. NECVs of this type have the strongest mean intensity. Type 3 accounts for the least (13.4%). The low-pressure anomaly shrinks to the south of the NEC, and the NEC is controlled by the cut-off low vortex. The mean size of NECVs of this type is the largest. Type 4 presents a meridional high-low-high pressure anomaly, and the center of the low-pressure anomaly is in the west of the NEC. The WPSH extends the most westward of these five types. The two low-pressure anomalies in type 5 are distributed from southwest to northeast, with their centers located in the west of the NEC and East Siberia, respectively, and the westerly trough is also distributed in a northeast-southwest orientation. In addition, the wind at 850 hPa of each type corresponding to NECV systems shows cyclonic vortexes except for type 1, where there is a deep low trough.
(3) There are distinct differences in the characteristics of daily precipitation under different synoptic circulation patterns. The mean number of AWSs reaching the rainstorm level on a rainstorm day of type 1 and 5 is greater than other types. Type 1 has the largest mean and maximal daily accumulated precipitation, as well as the mean hourly precipitation. However, type 4 has the strongest hourly precipitation.
(4) The spatial distribution of accumulated precipitation on rainstorm days associated with NECVs in the warm seasons of 2000–2019 presents remarkable non-uniformity and differences. The rainstorms are mostly located near Changbai Mountain and the narrow northeast plain region in the middle of Liaoning Province. The precipitation centers of type 1 mainly occur in the central plain of Liaoning province and central Jilin Province. Rainstorms of type 2 are mostly located near the southern part of Changbai Mountain in Liaoning Province. Precipitation centers in type 5 are observed near Changbai Mountain and the coastal areas in the southeast of Liaoning Province, whose scope is larger than that in type 2. The accumulated precipitation of rainstorms in type 3 and 4 are weaker than that of other types.
Based on the objective circulation classification, it is beneficial to better understand the characteristics of rainstorm days under the background of NECVs. In the future, quantifying the water vapor sources and transport paths of rainstorms in the NEC is necessary to in-depth investigate rainstorms associated with NECVs. Moreover, rainstorms are the result of the interaction of multi-scale weather systems. Therefore, high-resolution numerical simulation and other technological means are also needed to further analyze the occurrence mechanism of the rainstorms associated with NECVs.
The data analyzed in this study is subject to the following licenses/restrictions: The data that support the findings of this study are available from the corresponding author upon reasonable request. Requests to access these datasets should be directed to xpcui@mail.iap.ac.cn.
LH and XC carried out data analysis and wrote the manuscripts. LC was involved in the discussion. QZ and YY participated in the manuscript revision. All authors contributed to the article and approved the submitted version.
This work was supported by the Institute of Atmospheric Environment of China Meteorological Administration (2020SYIAEZD4).
We thank the China Meteorological Administration for providing the hourly precipitation dataset.
The authors declare that the research was conducted in the absence of any commercial or financial relationships that could be construed as a potential conflict of interest.
All claims expressed in this article are solely those of the authors and do not necessarily represent those of their affiliated organizations, or those of the publisher, the editors and the reviewers. Any product that may be evaluated in this article, or claim that may be made by its manufacturer, is not guaranteed or endorsed by the publisher.
Bai, R., and Jin, Y. (1993). The research on heavy rain in Heilongjiang province. Beijing: China Meteorological Press.
Beck, C., and Philipp, A. (2010). Evaluation and comparison of circulation type classifications for the European domain. Phys. Chem. Earth Parts A/B/C 35 (9–12), 374–387. doi:10.1016/j.pce.2010.01.001
Broderick, C., and Fealy, R. (2015). An analysis of the synoptic and climatological applicability of circulation type classifications for Ireland. Int. J. Climatol. 35 (4), 481–505. doi:10.1002/joc.3996
Buishand, T., and Brandsma, T. (1997). Comparison of circulation classification schemes for predicting temperature and precipitation in The Netherlands. Int. J. Climatol. 26, 461–483. doi:10.1002/(SICI)1097-0088(19970630)17:8<875
Cahynová, M., and Huth, R. (2016). Atmospheric circulation influence on climatic trends in europe: An analysis of circulation type classifications from the COST733 catalogue. Int. J. Climatol. 36 (7), 2743–2760. doi:10.1002/joc.4003
Caliński, T., and Harabsz, J. (1974). A dendrite method for cluster analysis. Comm. Stats. - Simul. Comp. 3 (1), 1–27. doi:10.1080/03610917408548446
Casado, M., and Pastor, M. (2016). Circulation types and winter precipitation in Spain. Int. J. Climatol. 36 (7), 2727–2742. doi:10.1002/joc.3860
Casado, M., Pastor, M., and Doblas-Reyes, F. (2010). Links between circulation types and precipitation over Spain. Phys. Chem. Earth Parts A/B/C 35 (9), 437–447. doi:10.1016/j.pce.2009.12.007
Chen, L., Chen, S., Zhou, X., and Pan, X. (2005). A numerical study of the MCS in a cold vortex over northeastern China. Acta Meteorol. Sin. (02), 173–183. doi:10.11676/qxxb2005.017
Enke, W., and Spekat, A. (1997). Downscaling climate model outputs into local and regional weather elements by classification and regression. Clim. Res. 8, 195–207. doi:10.3354/cr008195
Fang, Y., Chen, H., Lin, Y., Zhao, C., Lin, Y., and Zhou, F. (2021). Classification of Northeast China Cold Vortex activity paths in early summer based on k-means clustering and their climate impact. Adv. Atmos. Sci. 38 (3), 400–412. doi:10.1007/s00376-020-0118-3
Fu, S., and Sun, J. (2012). Circulation and eddy kinetic energy budget analyses on the evolution of a northeastnortheast China cold vortex (NCCV) in may 2010. J. Meteorological Soc. Jpn. 90 (4), 553–573. doi:10.2151/jmsj.2012-408
Hu, K., Lu, R., and Wang, D. (2010). Seasonal climatology of cut-off lows and associated precipitation patterns over Northeast China. Meteorol. Atmos. Phys. 106 (1–2), 37–48. doi:10.1007/s00703-009-0049-0
Huang, L., and Cui, X. (2022). Statistical characteristics of the Northeast China Cold Vortex and its impact on precipitation distribution from 2000 to 2019. Chinese Journal of Atmospheric Sciences. In press (In Chinese with English abstract). doi:10.3878/j.issn.1006-9895.2203.21227
Huth, R., Beck, C., Philipp, A., Demuzere, M., Ustrnul, Z., Cahynova, M., et al. (2008). Classifications of atmospheric circulation patterns. Ann. N. Y. Acad. Sci. 1146 (1), 105–152. doi:10.1196/annals.1446.019
Huth, R. (1993). Ein Beispiel für die Anwendung der Hauptkomponentenanalyse zur Auffindung von Zirkulationstypen über Europa. metz. 2, 285–293. doi:10.1127/metz/2/1993/285
Kalnay, E., Kanamitsu, M., Kistler, R., Collins, W., Deaven, D., Gandin, L., et al. (1996). The NCEP/NCAR 40–year reanalysis project. Bull. Am. Meteorol. Soc. 77 (3), 437–471. doi:10.1175/1520-0477(1996)077<0437:tnyrp>2.0.co;2
Kaufman, L., and Rousseeuw, P. (1990). “Finding groups in data an introduction to cluster Analysis,” in Wiley series in probability and mathematical statistics: Applied probability and statistics (New York, NY: John Wiley), 342.
Kirchhofer, W. (1974). Classification of European 500 mb patterns, 43. Zurich, Switzerland: Arbeitsbericht der Schweizerischen Meteorologischen Zentralanstalt, 1.
Liu, W., Wang, L., Chen, D., Tu, K., Ruan, C., and Hu, Z. (2015). Large-scale circulation classification and its links to observed precipitation in the eastern and central Tibetan Plateau. Clim. Dyn. 46, 3481–3497. doi:10.1007/s00382-015-2782-z
Lund, I. (1963). Map-pattern classification by statistical methods. J. Appl. Meteor. 2, 56–65. doi:10.1175/1520-0450(1963)002<0056:mpcbsm>2.0.co;2
Michaelides, S., Liassidou, F., and Schizas, C. (2007). Synoptic classification and establishment of analogues with artificial neural networks. Pure Appl. Geophys. 164, 1347–1364. doi:10.1007/s00024-007-0222-7
Murtagh, F. (1985). “Multidimensional clustering algorithms,” in COMPSTAT lectures (Wurzburg: Physica-Verlag), Vol. 4.
Philipp, A., Beck, C., Huth, R., and Jacobeit, J. (2014). Development and comparison of circulation type classifications using the COST 733 dataset and software. Int. J. Climatol. 36 (7), 2673–2691. doi:10.1002/joc.3920
Philipp, A. (2009). Comparison of principal component and cluster analysis for classifying circulation pattern sequences for the European domain. Theor. Appl. Climatol. 96, 31–41. doi:10.1007/s00704-008-0037-1
Qian, W., Shan, X., and Zhu, Y. (2012). Capability of regional-scale transient wind anomalies to indicate region heavy rains. Chin. J. Geophys. 55 (5), 1513–1522. doi:10.6038/j.issn.0001-5733.2012.05.008
Ren, Z., Zhang, Z., Sun, C., Liu, Y., Li, J., Ju, X., et al. (2015). Development of three-step quality control system of real-time observation data from AWS in China. Meteorological Monthly. 41 (10), 1268–1277. doi:10.7519/j.issn.1000-0526.2015.10.010
Schmutz, C., and Wanner, H. (1998). Low frequency variability of athmospheric circulation over Europe between 1785 and 1994. erd. 52, 81–94. doi:10.3112/erdkunde.1998.02.01
Sun, L., Zheng, X., and Wang, Q. (1994). The climatological characteristics of Northeast Cold vortex in China. Q. J. Appl. Meteorology 5 (3), 297.
Wang, C., Xu, H., and Ren, L. (2012). The objective identification method of northeast cold vortex. J. Meteorology Environ. 28 (02), 1. doi:10.3969/j.issn.1673-503X.2012.02.001
Wang, C., Zhao, K., Huang, A., Chen, X., and Rao, X. (2021). The crucial role of synoptic pattern in determining the spatial distribution and diurnal cycle of heavy rainfall over the south China coast. J. Clim. 34 (7), 2441–2458. doi:10.1175/JCLI-D-20-0274.1
Wang, X., and Xie, J. (1994). The analysis of the effects of topography in northeast China on strong convection weather. Sci. Geogr. Sin. 14 (4), 347.
Xie, Z., and Buhe, C. (2015). Different types of cold vortex circulations over northeast China and their weather impacts. Mon. Wea. Rev. 143 (3), 845–863. doi:10.1175/MWR-D-14-00192.1
Zhang, C., Zhang, Q., Wang, Y., and Liang, X. (2008). Climatology of warm season cold vortices in east asia: 1979–2005. Meteorol. Atmos. Phys. 100 (1–4), 291–301. doi:10.1007/s00703-008-0310-y
Zhang, X., Chen, D., and Yao, T. (2018). Evaluation of circulation-type classifications with respect to temperature and precipitation variations in the central and eastern Tibetan Plateau. Int. J. Climatol. 38, 4938–4949. doi:10.1002/joc.5708
Zhao, S., and Sun, J. (2006). Study on cut-off low-pressure systems with floods over northeast asia. Meteorol. Atmos. Phys. 96 (1–2), 159–180. doi:10.1007/s00703-006-0226-3
Zhao, Y., Xu, X., Li, J., Zhang, R., Kang, Y., Huang, W., et al. (2019). The large-scale circulation patterns responsible for extreme precipitation over the northnorth China plain in midsummer. JGR. Atmos. 124 (23), 12794–12809. doi:10.1029/2019JD030583
Zheng, X., Zhang, T., and Bai, R. (1992). Rainstorm in northeast China. Beijing: China Meteorological Press.
Zhong, S. (2011). Structural features of cold vortex and its formation mechanism of heavy rainfall over northeast China. Dissertation/doctor’s thesis. Beijing: Chinese Academy of Sciences & Chinese Academy of Meteorological Sciences.
Keywords: objective circulation classification, rainstorm day, northeast cold vortexes, Northeastern China, self-organizing maps method
Citation: Huang L, Cui X, Chen L, Zou Q and Yang Y (2023) Objective circulation classification of rainstorm days associated with Northeast China cold vortexes in the warm seasons of 2000–19. Front. Earth Sci. 10:1066070. doi: 10.3389/feart.2022.1066070
Received: 10 October 2022; Accepted: 18 November 2022;
Published: 03 January 2023.
Edited by:
Ping Huang, Institute of Atmospheric Physics (CAS), ChinaReviewed by:
Shenming Fu, Institute of Atmospheric Physics (CAS), ChinaCopyright © 2023 Huang, Cui, Chen, Zou and Yang. This is an open-access article distributed under the terms of the Creative Commons Attribution License (CC BY). The use, distribution or reproduction in other forums is permitted, provided the original author(s) and the copyright owner(s) are credited and that the original publication in this journal is cited, in accordance with accepted academic practice. No use, distribution or reproduction is permitted which does not comply with these terms.
*Correspondence: Xiaopeng Cui, eHBjdWlAbWFpbC5pYXAuYWMuY24=
Disclaimer: All claims expressed in this article are solely those of the authors and do not necessarily represent those of their affiliated organizations, or those of the publisher, the editors and the reviewers. Any product that may be evaluated in this article or claim that may be made by its manufacturer is not guaranteed or endorsed by the publisher.
Research integrity at Frontiers
Learn more about the work of our research integrity team to safeguard the quality of each article we publish.