 Jing Ba
 Xuming Pan
 José M. Carcione
 Rupeng Ma
- 1School of Earth Sciences and Engineering, Hohai University, Nanjing, China
- 2National Institute of Oceanography and Applied Geophysics (OGS), Trieste, Italy
Tight reservoirs are distributed in several basins in China, with great exploration prospects and high production potential. These reservoirs have low porosity and permeability and a significant spatial heterogeneity, and this complexity requires new developments on the experimental and theoretical researches of wave propagation. To this purpose, we have conducted ultrasonic experiments on seven tight sandstones collected from the shale-oil strata as a function of the confining pressure. We obtained the P-wave velocity and attenuation by using the spectral-ratio method. The results show that attenuation decreases with pressure, and increases with porosity and permeability and that oil saturation causes more losses compared to water and gas saturations. Moreover, we observe a relaxation peak at 40% water saturation in the gas-water case. Then, we develop a tight-rock model combining three theories [Voigt-Reuss-Hill (VRH), Differential Effective Medium (DEM) and double double-porosity (DDP)], where inclusions are assumed to represent cracks or grain contacts, with different porosity and compressibility as the host. The model reasonably predicts P-wave velocity dispersion and attenuation, which increase with water saturation, and the related relaxation frequency moves to low frequencies.
1 Introduction
The development of tight reservoirs is of significance to increase crude-oil production and optimize energy supply. These reservoirs have low porosity and permeability and a high heterogeneity (Zou et al., 2013), which make it difficult for exploration and production activities. Previous studies showed that the clay particle arrangement, layering, cracks, and low-aspect-ratio pores cause the heterogeneity of these reservoirs, which together with the stress conditions, highly affect the seismic waves (Zhubayev et al., 2016). In this context, wave-induced local fluid flow associated with the pore fluid is an important cause of dissipation (Ba et al., 2015).
Many experimental studies have analyzed the effects of confining and pressures, fluid properties and saturation on attenuation (Biot, 1962; Born, 1941; Dvorkin et al., 1994, 1995; Toksöz, et al., 1979; Johnston et al., 1979, 1986; Mavko and Mukerji, 1998; Li et al., 2018; Ma et al., 2019; Ma and Ba, 2020; White et al., 1975; Johnston et al., 1979; Winkler, 1985; Sams et al., 1997; Pimienta et al., 2015; Pimienta et al., 2016; Chapman et al., 2016, 2017). In particular, the P-wave velocity of tight sandstones is more affected than that of normal sandstones (Tutuncu et al., 1994). Waves induce wave-induced local fluid flow (WIFF) through a heterogeneity rock, generating a fluid pressure gradient between regions with different compressibilities and consistent P-wave energy dissipation (Pride et al., 2004; Ba et al., 2016). Permeability, porosity, fluid viscosity, saturation and frame heterogeneity play an important role in this process (Zhao et al., 2017). For instance, the shear modulus of a rock saturated with brine is less than that of a dry rock (Sharma et al., 2013), and attenuation of water-saturated rocks is stronger than that of dry rocks at the ultrasonic frequency band (Johnston and Toksoz, 1980). Wei et al. (2021) showed that in high clay-content rocks, water replacing gas enhances the P-wave dissipation.
White et al. (1975) considered fine layers with different fluids to analyze the mesoscopic WIFF process (Carcione, 2022). Dvorkin and Nur. (1993) presented a macro/microscopic Biot/squirt (BISQ) model for wave velocity and attenuation at sonic/ultrasonic frequencies. Ba et al. (2011) combined Biot poroelasticity and the Rayleigh theory for the expansion-contraction oscillation of a spherical fluid pocket to develop a double-porosity WIFF-type model. Zhang et al. (2017) extended this model to triple porosity. Cheng et al. (2020) extended the cracks and pores effective medium (CPEM) model to all frequencies, based on the Zener mechanical model, analyzing the effect of pressure on the P wave. Ren et al. (2020) combined the theories of microscopic squirt flow and mesoscopic patchy-saturation. Ba et al. (2017) presented a double double-porosity (DDP) model, which considers two types of heterogeneities and patchy saturation. This model was applied to tight rocks containing sub-pore heterogeneities and saturated with immiscible fluids, and used by Guo et al. (2018) for tight sandstones. The model predictions for fully- and partially-saturated rocks are in good agreement with the experiments.
In this work, we show P-wave ultrasonic measurements on the tight rock samples at different pressures and fluid saturations and analyze their effect on velocity attenuation. Then, we combined the VRH, DEM and DDP theories to establish a predictive theoretical model that takes into account the effects of pressure, frame properties (porosity and permeability) and fluid properties and distribution on the P-wave behavior. In this work we consider the two types of heterogeneities of fabric structure and patchy saturation, and the prediction results of P-wave responses as a function of porosity, saturation and confining pressure are obtained with respect to the properties of microcrack and gas pocket.
2 Experiments
2.1 Tight-rock samples
Tight reservoirs of Member 7 of the Yanchang formations in the Ordos Basin are dominated by lacustrine deposits. The topography it is high in the east basin and low in the west, with complex tectonic histories and a wide distribution of high-quality source rocks. There are ten members in the Yanchang formations, of which member 7 reached its peak in the depositional period of the lake basin and developed a great amount of high-quality source rocks. Member 7 of Yanchang formations is buried at a depth of about 1,200–2,350 m. The reservoir lithology is mainly tight sandstone intercalated with mudstone/shale, and shale intercalated with thin silt/fine sandstone. Micro-nanoscale pore throats are developed, and the pore structure is conducive to the accumulation of hydrocarbons.
Seven tight-sandstone samples are collected from the target formation at the depth range of 1,800–2,150 m for X-ray diffraction tests. The mineral compositions are mainly quartz, feldspar, carbonate minerals, clay minerals and a small amount of siderite. The quartz content is relatively high, ranging between 48.59% and 56.81%, and the feldspars are mainly potassium feldspar and plagioclase, with the plagioclase content generally higher than that of potassium feldspar. The carbonate minerals are calcite and dolomite, with a small amount of ankerite, and the clay minerals are zeolite and chlorite. The automated permeameter of Core Measurement System is used to measure porosity and permeability. The porosity is measured by the gas-expansion method, and the dry-rock density is obtained from the ratio of rock mass to total volume. The properties of seven samples are given in Table 1.
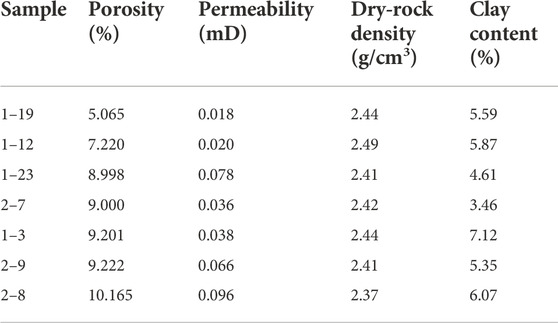
TABLE 1. Properties of the seven samples of the Yanchang formations.
2.2 Experimental set-up
We cut the rock samples into cylinders with a diameter of 25.08–25.14 mm and a length of 48.89–50.09 mm, and an aluminum standard is prepared with the same shape of each sample for reference. The same experimental setup as in Guo et al. (2009) is used for the ultrasonic measurements. The frequency of the generated pulse is about 0.55 MHz, and the gas (nitrogen)-saturated, water-saturated, oil (kerosene)-saturated and partially-saturated samples are measured under the different confining pressures.
2.2.1 Gas-saturation tests
The samples are first dried, then sealed with rubber sleeves and placed in the device. At the confining pressures of 5 and 10 MPa, the pore pressure is increased by 5 MPa by injecting nitrogen. On the other hand, the confining pressure is set to 20, 30, 40, 50, and 60 MPa, and the pore pressure kept to 15 MPa. The temperature in all the tests is 30°C. Then, we record the P-wave waveforms for each case.
2.2.2 Water- and oil-saturation tests
The samples are saturated by the vacuuming and pressurization method, and the procedure is the same as that of the previous test.
2.2.3 Partially-saturation test with gas and water
The samples are heated in an oven to change the water saturation, which is controlled by weighing. The sample is then sealed, and placed in a container. Nitrogen gas is injected to control the pore pressure.
2.3 P-wave attenuation estimation
The spectral ratio method (Guo et al., 2009; Ba et al., 2018; Gao et al., 2019) is applied to estimate the P-wave attenuation (inverse quality factor 1/Q). If the sub-indices 1 and 2 denote the rock and aluminum, the plane wave amplitudes can be expressed as
where ƒ is the frequency, A1(ƒ) and A2(ƒ) are the P-wave spectra, x is the propagation distance,
Then, the P-wave attenuation is computed with
Since the quality factor of aluminum is much higher than rocks, we assume
and Q1 can be obtained.
Due to the error caused by the choice of pulse window and frequency band (Zhubayev et al., 2016), we compute it by using the slope change of spectrum ratio at the fitting band,
where
3 Experimental results
Figure 1 shows the P-wave velocity with confining pressure for the seven samples at full gas, water and oil saturations, and Figure 2 shows the results at water saturations of 20%, 40%, 60%, and 80% (gas-water case). The velocity increases with confining pressure when the soft pores/cracks gradually tend to close, resulting in the increase of the dry-rock bulk shear moduli.
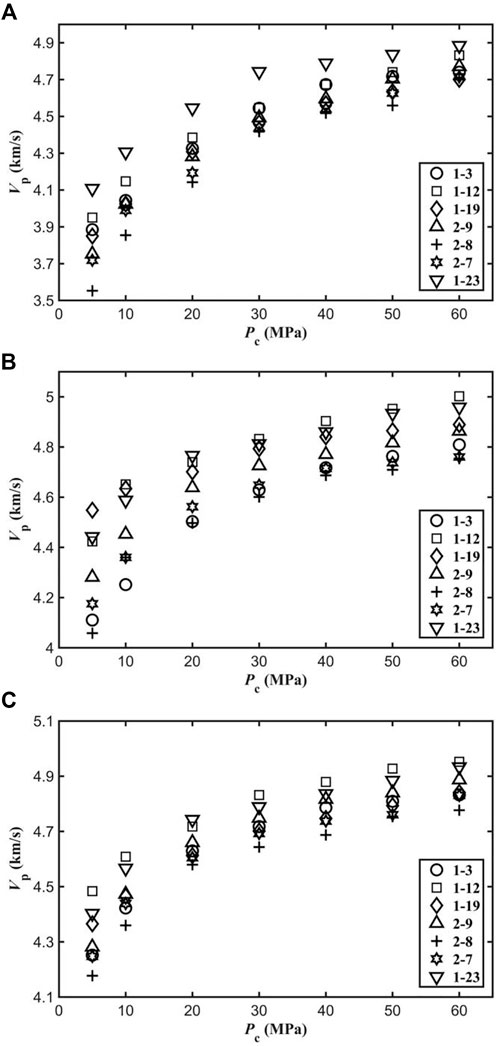
FIGURE 1. P-wave velocity as a function of confining pressure for the seven samples at gas- (A), water- (B) and oil- (C) saturation conditions.

FIGURE 2. P-wave velocity as a function of confining pressure for the seven samples at water saturations of 20 (A), 40 (B), 60 (C) and 80% (D) (gas-water case).
On the other hand, Figure 3 shows the P-wave dissipation factor as a function of confining pressure at different fluid saturations. In general, attenuation decreases with confining pressure, because as this increases, cracks tend to close, precluding local fluid flow between these cracks and intergranular pores (squirt flow). At the same pressure, the attenuation at water- and oil-saturation conditions is higher than that at gas saturation. This can be due to the viscous motion of the fluid and the variation of the contact surface energy between solid and liquid caused by the wave (Wang et al., 2006).
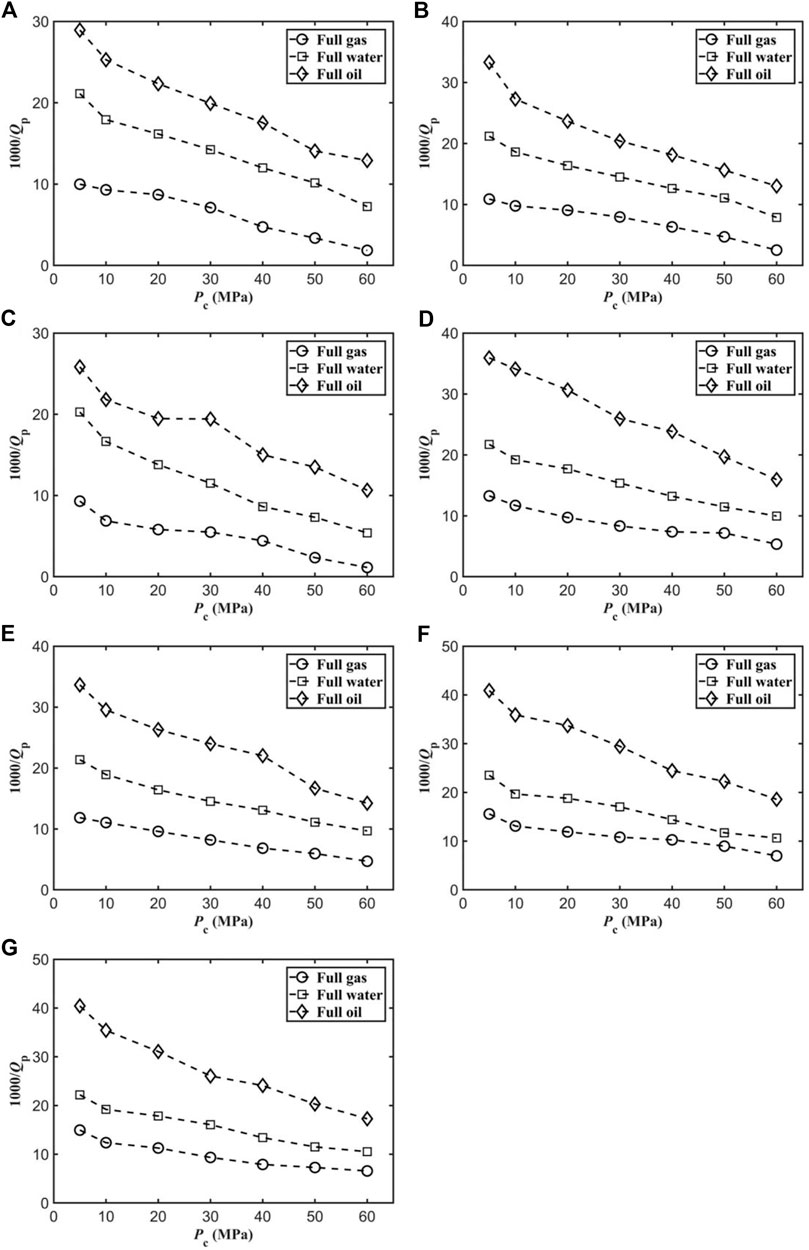
FIGURE 3. P-wave attenuation of samples 1–3 (A), 1–12 (B), 1–19 (C), 1–23 (D), 2–7 (E), 2–8 (F) and 2–9 (G) as a function of confining pressure.
Figure 4 shows the P-wave dissipation factor as a function of water saturation (gas-water case) and different confining pressures. Generally, there is a maximum at 40% saturation, possibly related to the fluid distribution in the pores.
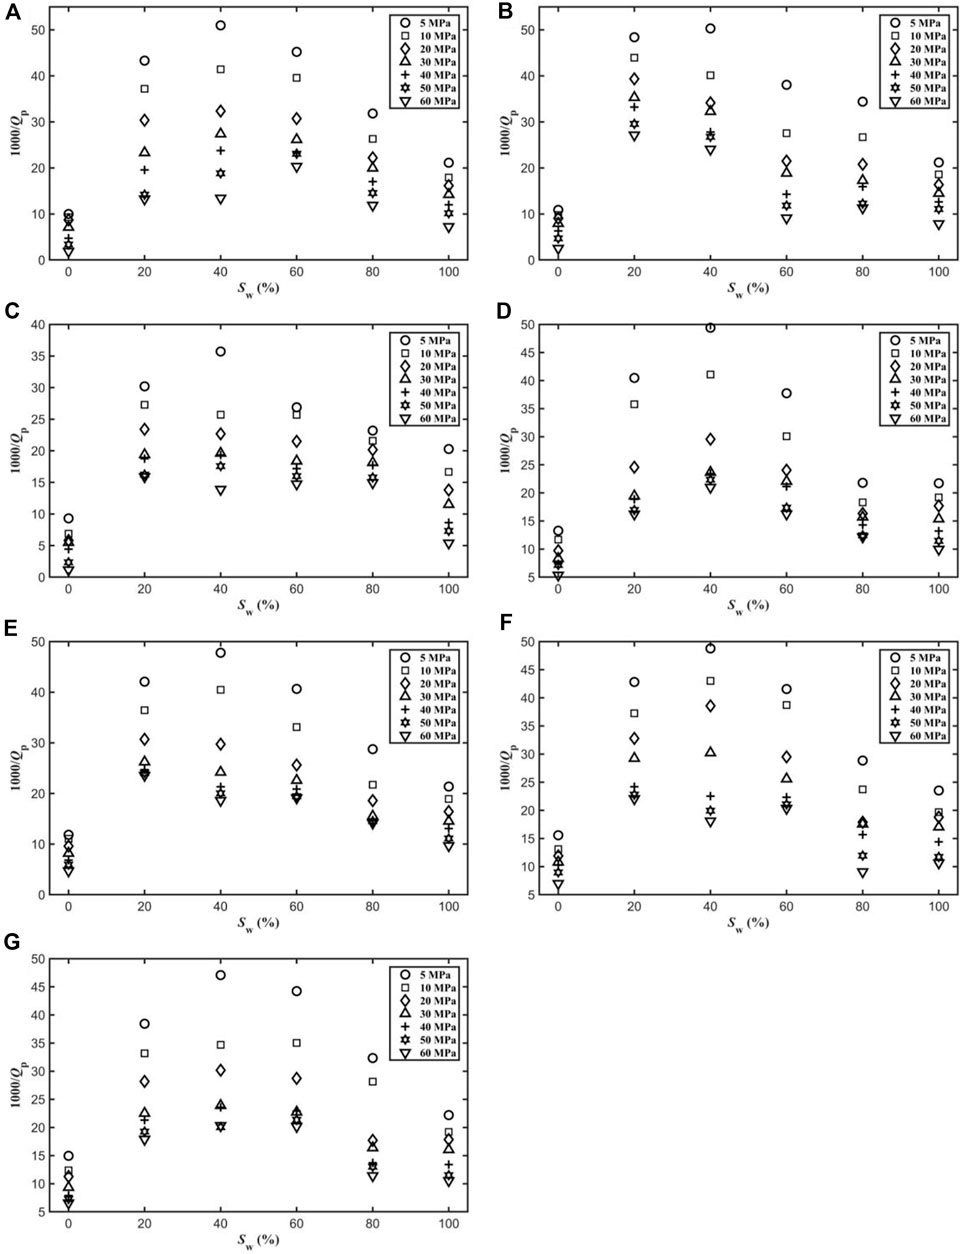
FIGURE 4. P-wave attenuation as a function of water saturation for samples of 1–3 (A), 1–12 (B), 1–19 (C), 1–23 (D), 2–7(E), 2–8 (F) and 2–9 (G), and different confining pressures.
Figure 5 shows the P-wave velocity as a function of porosity (a) and the dissipation factor as a function of porosity (b) and permeability (c) for a confining pressure of 30 MPa. As expected, the velocities decrease with porosity, and attenuation increases. Indeed, with increasing porosity, the frame moduli decrease and the presence of more cracks results in higher local fluid flow and dissipation.
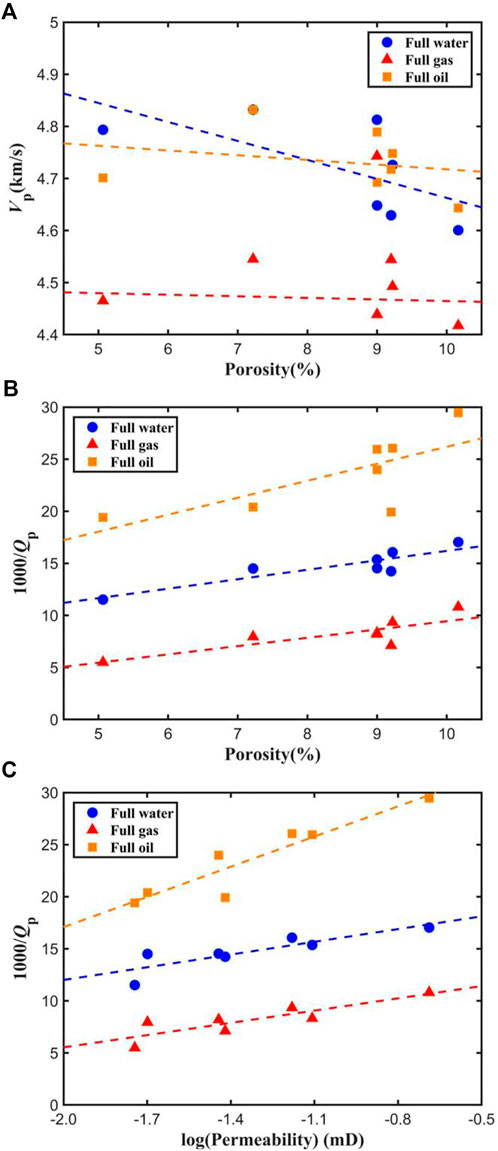
FIGURE 5. P-wave velocity versus porosity (A) and P-wave dissipation factor as a function of porosity (B) and permeability (C) at a confining pressure of 30 MPa and different full saturations.
4 Theory
4.1 Basic theory and modeling
The heterogeneity of the frame and the patchy saturation of the immiscible fluid mixture lead to the WIFF and P-wave dispersion and dissipation. The modeling workflow is shown in Figure 6. The mineral composition and crack porosity are obtained from the ultrasonic data and an inversion process (Zhang et al., 2019) and the fluid substitution is then performed with the DDP theory.
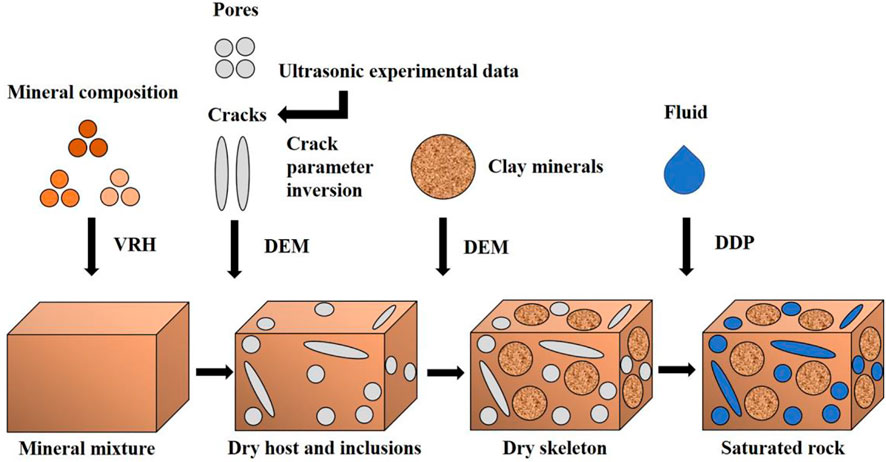
FIGURE 6. Modeling workflow to obtain wave velocity and attenuation.
The mineral composition and pore structure of the samples are analyzed with X-ray diffraction and scanning electron microscopy tests. The mineral components are mainly quartz, feldspar, carbonate minerals and clay. Clay minerals are present within the host matrix, together with pores and cracks, constituting the skeleton of tight reservoirs (Deng et al., 2018). The mineral components except for clay minerals are considered as the mineral mixture, and the elastic moduli are computed with the VRH equation (Hill, 1952; Reuss, 1929). The crack properties are obtained from the ultrasonic measurements at different confining pressures and the frame moduli are computed with the DEM theory, by which clay minerals, pores (with an aspect ratio of 0.5) and cracks are added into the mineral mixture.
The DDP theory by Ba et al. (2015) considers two types of heterogeneities, i.e., the two porous components for the solid skeleton with different compressibilities (Figure 7A), and patchy-saturation of two immiscible fluids within the pores (Figure 7B), leading to WIFF and anelasticity. Figure 7C shows the combination of the two heterogeneities, where it is assumed that porous spherical inclusions are uniformly embedded in a porous host, and patch saturation occurs in both regions, the host and the inclusion skeletons.
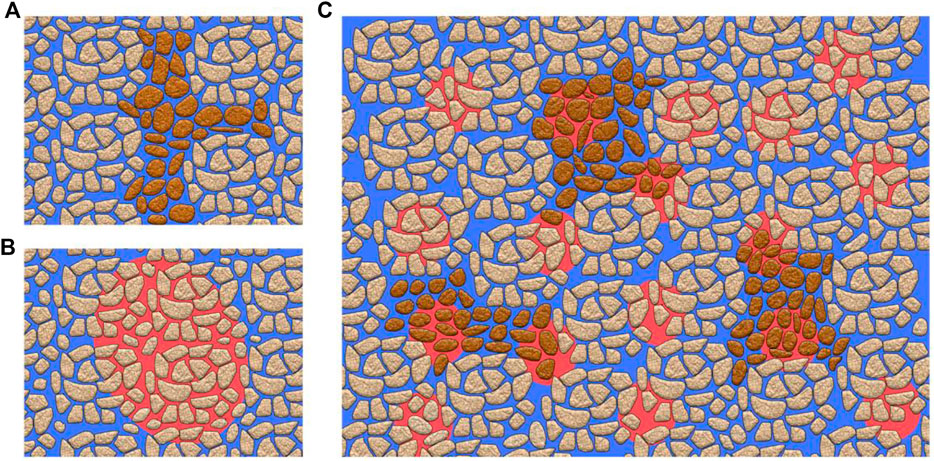
FIGURE 7. Double-porosity solid structure saturated with a single fluid (A), patchy saturation with two immiscible fluid phases within a single-porosity solid (B) and combination of the two types of heterogeneity (C). The blue and red zones represent the two immiscible fluids.
It has been considered that the P-wave responses can be affected by the capillary pressure variations in rocks saturated with multi-phase fluids. At the high-frequency range, the P-wave velocity is shown to increase as capillary pressure increases, while the P-wave attenuation decreases (Shukla et al., 2019). In this work, two types of heterogeneities are incorporated in modeling, and due to the complexity of wave governing equations, the influence of capillary pressure is not considered yet, which can be analyzed in a future study. In the partial-saturation case, due to the hydrophilicity of the mineral surface and capillary tension, the flat contact between grains or within cracks is considered to be fully saturated with water, while the gas pockets are mainly distributed within the intergranular pores (Li et al., 2001).
Ba et al. (2017) DDP differential equations are
where
4.2 Results
We consider sample 1–19. The properties of gas, water and oil are obtained from the equations of Batzle and Wang (1992). The rock properties are given in Table 1, and the modeling parameters are given in Tables 2, 3.
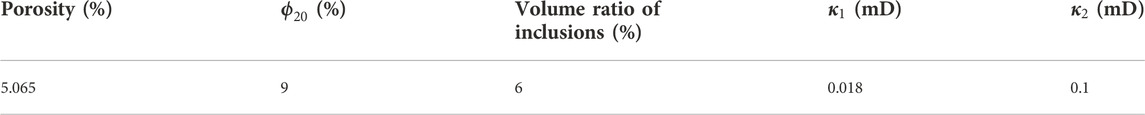
TABLE 2. Modeling parameters of sample 1–19.
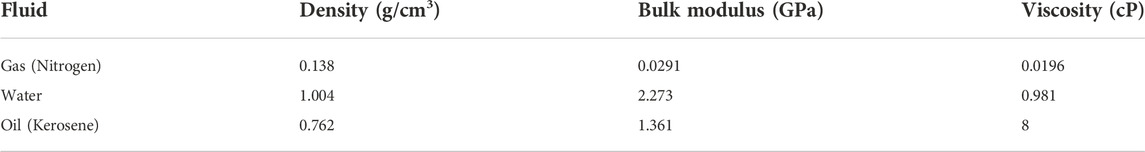
TABLE 3. Fluid properties.
Figure 8 shows the bulk (a) and shear (b) moduli of the dry rocks as a function of the confining pressure, showing the expected behavior.
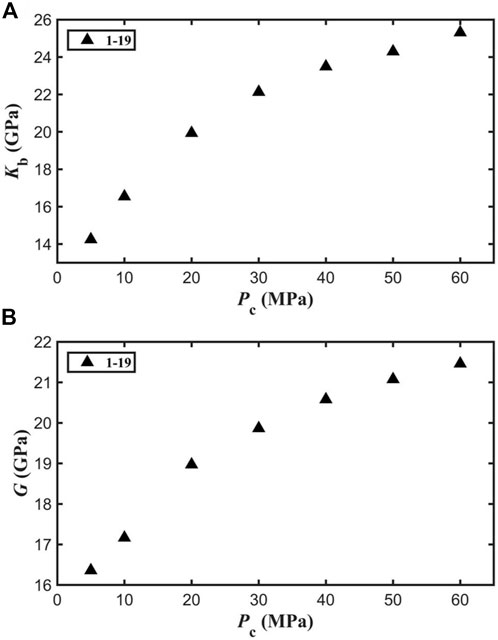
FIGURE 8. Estimated bulk (A) and shear (B) moduli of the dry rocks for sample 1–19.
Figure 9 compare the experimental and theoretical P-wave velocity dispersion and attenuation frequency dependence at different confining pressures, respectively, where we can see that the agreement is good. In the case of air, the anelasticity is very weak. In all cases, the anelasticity gradually decreases with confining pressure. For the saturated rocks, the P-wave attenuation is mainly caused by the heterogeneity of the frame and inclusions. With increasing pressure, cracks gradually tend to close. With the decrease of the inclusion (crack) radius and increase of bulk modulus, the WIFF effect is hindered, resulting in less dissipation.
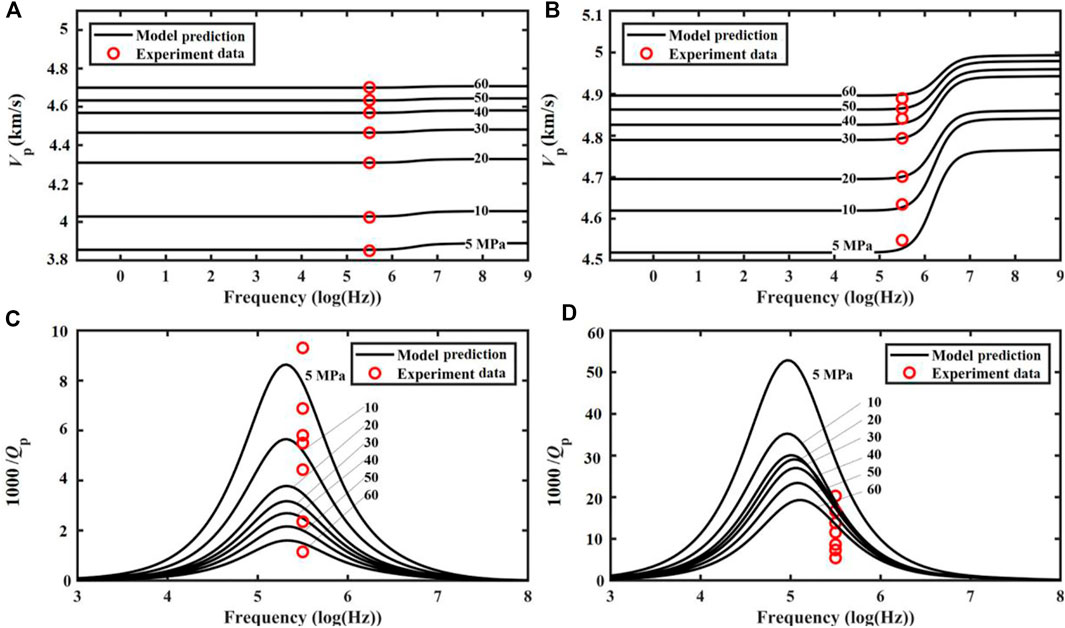
FIGURE 9. P-wave velocity frequency dependency for the gas- (A) and water- (B) saturated sample 1–19 at different confining pressures. The P-wave dissipation factors are shown in panels (C,D), respectively, for gas and water. The experimental data are shown as red circles.
Figures 10, 11 compare data and theory for sample 1–19 at different water saturations, for velocity and attenuation, respectively. The model results are consistent with the experimental data, and the anelasticity mainly occurs within the range of 103–107 Hz. The peaks move to low frequency with increasing water saturation. The lowest attenuation occurs in the full-gas saturation case. As mentioned above, when the rock is partially saturated, the P-wave dispersion and attenuation are caused by the two kinds of inhomogeneities, namely, fabric heterogeneity and patchy saturation. The anelasticity caused by the latter appears at lower frequencies, and is significantly stronger than that caused by the former inhomogeneity.
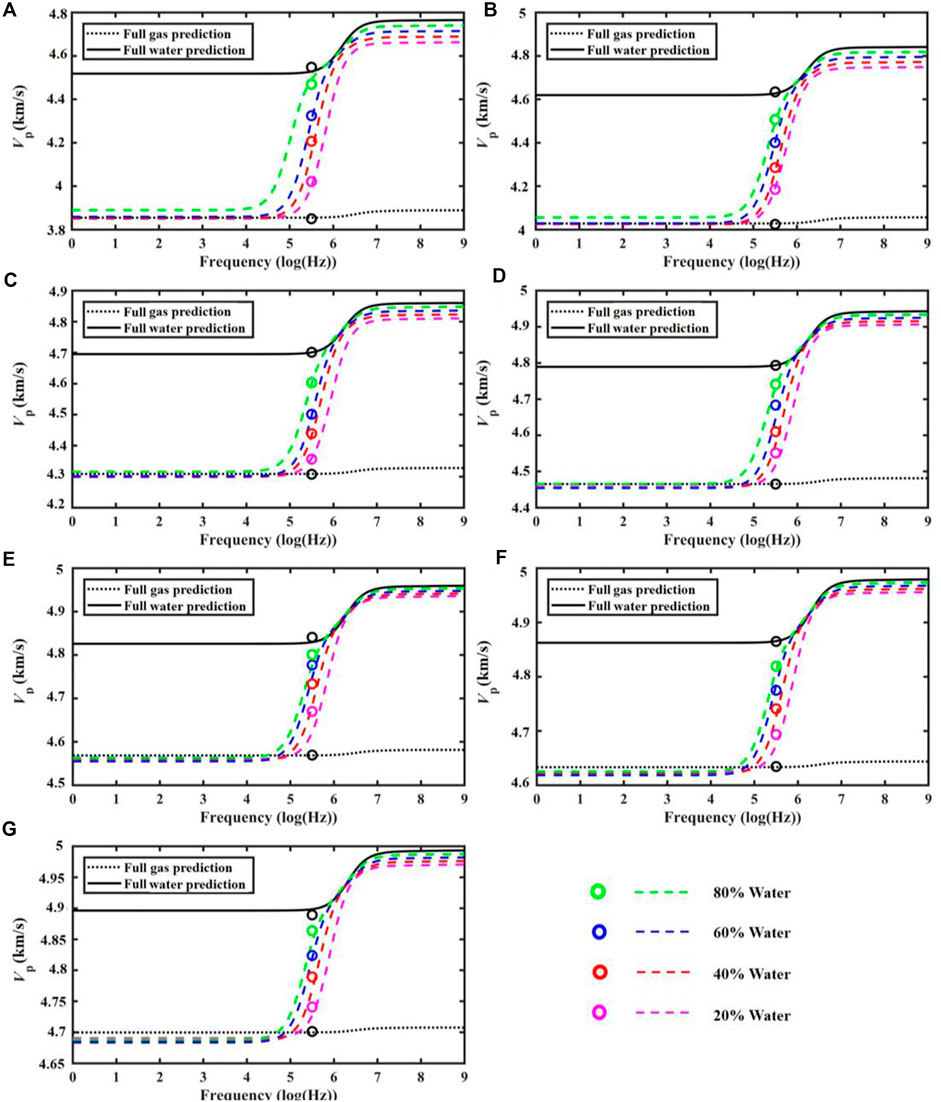
FIGURE 10. P-wave velocity frequency dependence for sample 1–19 at 5 MPa (A), 10 MPa (B), 20 MPa (C), 30 MPa (D), 40 MPa (E), 50 MPa (F) and 60 MPa (G). The experimental data are shown as circles.
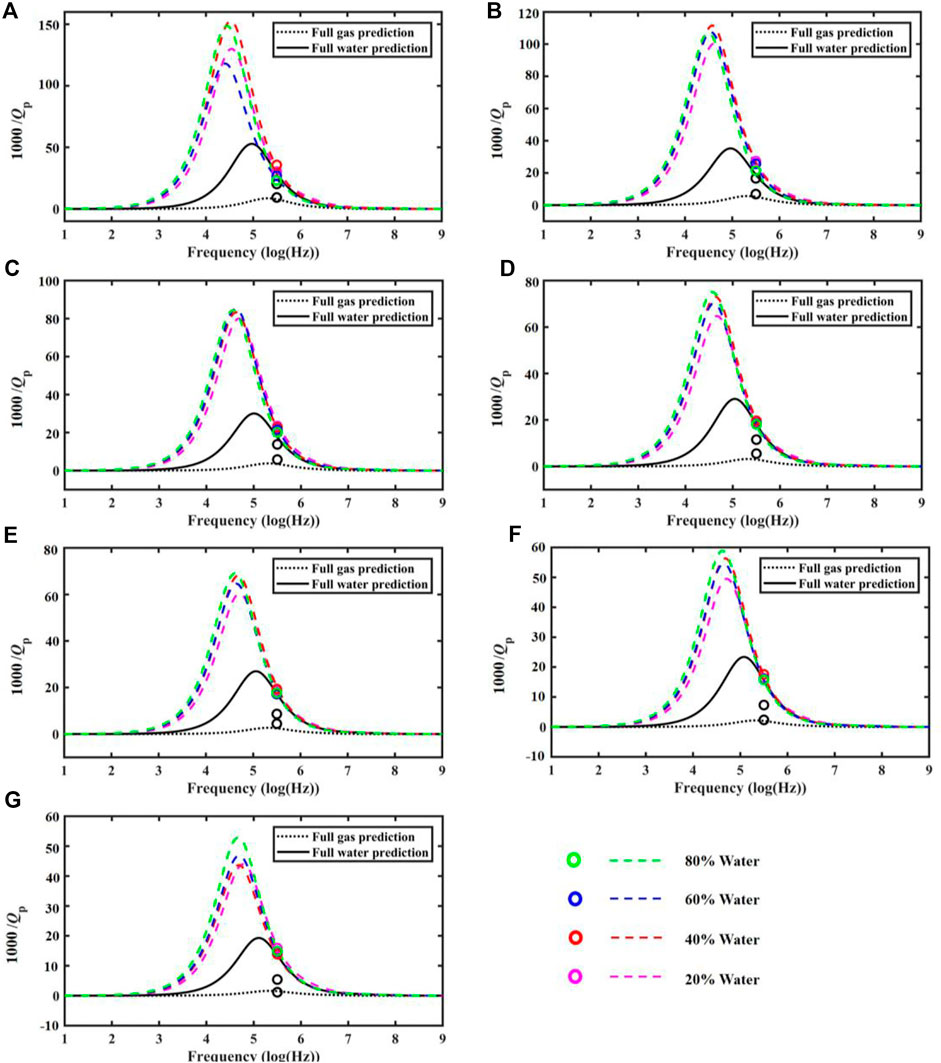
FIGURE 11. P-wave dissipation factor frequency dependence for sample 1–19 at 5 MPa (A), 10 MPa (B), 20 MPa (C), 30 MPa (D), 40 MPa (E), 50 MPa (F) and 60 MPa (G). The experimental data are shown as circles.
Results for partial saturation corresponding to sample 1–19, compared with the data, are shown in Figures 12, 13, where we can see that agreement is acceptable. Attenuation shows a maximum at medium saturations.
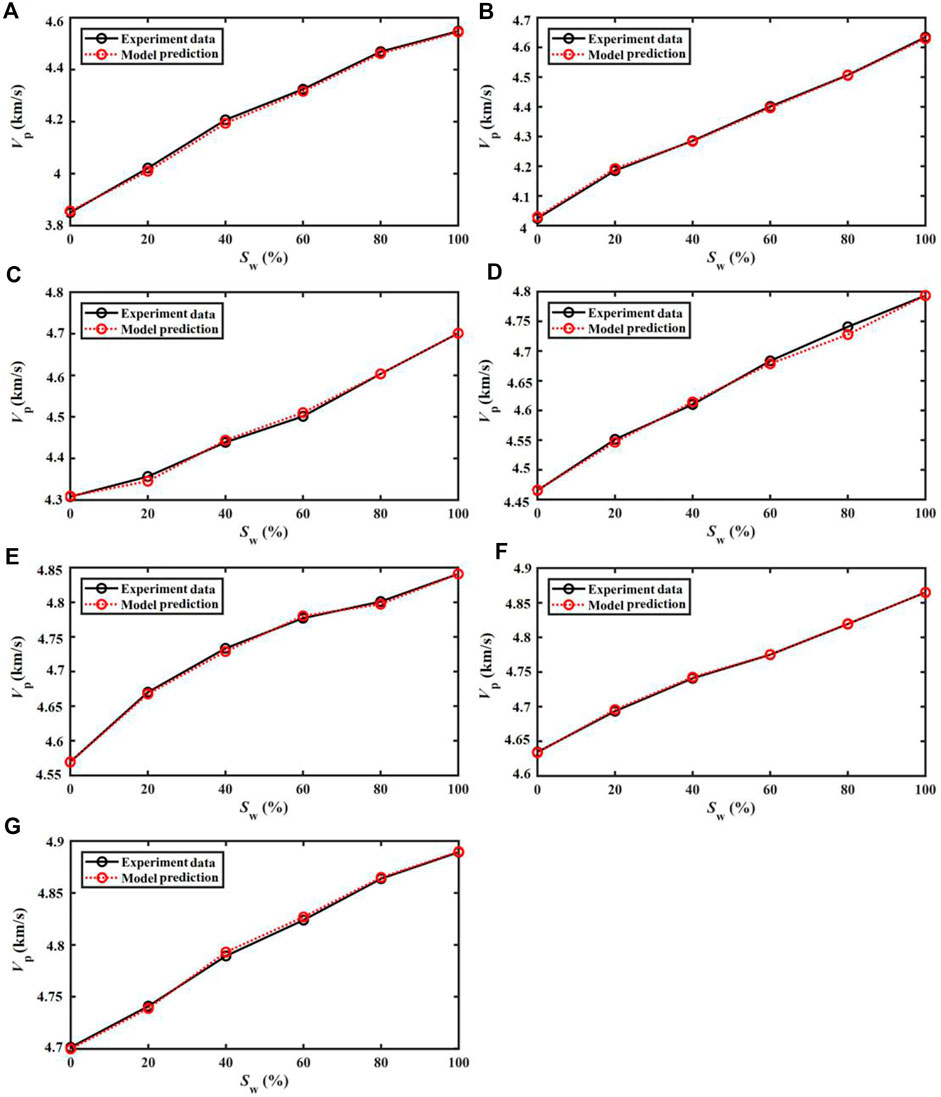
FIGURE 12. P-wave velocity as a function of water saturation compared to the experimental data for sample 1–19 at 5 MPa (A), 10 MPa (B), 20 MPa (C), 30 MPa (D), 40 MPa (E), 50 MPa (F) and 60 MPa (G).
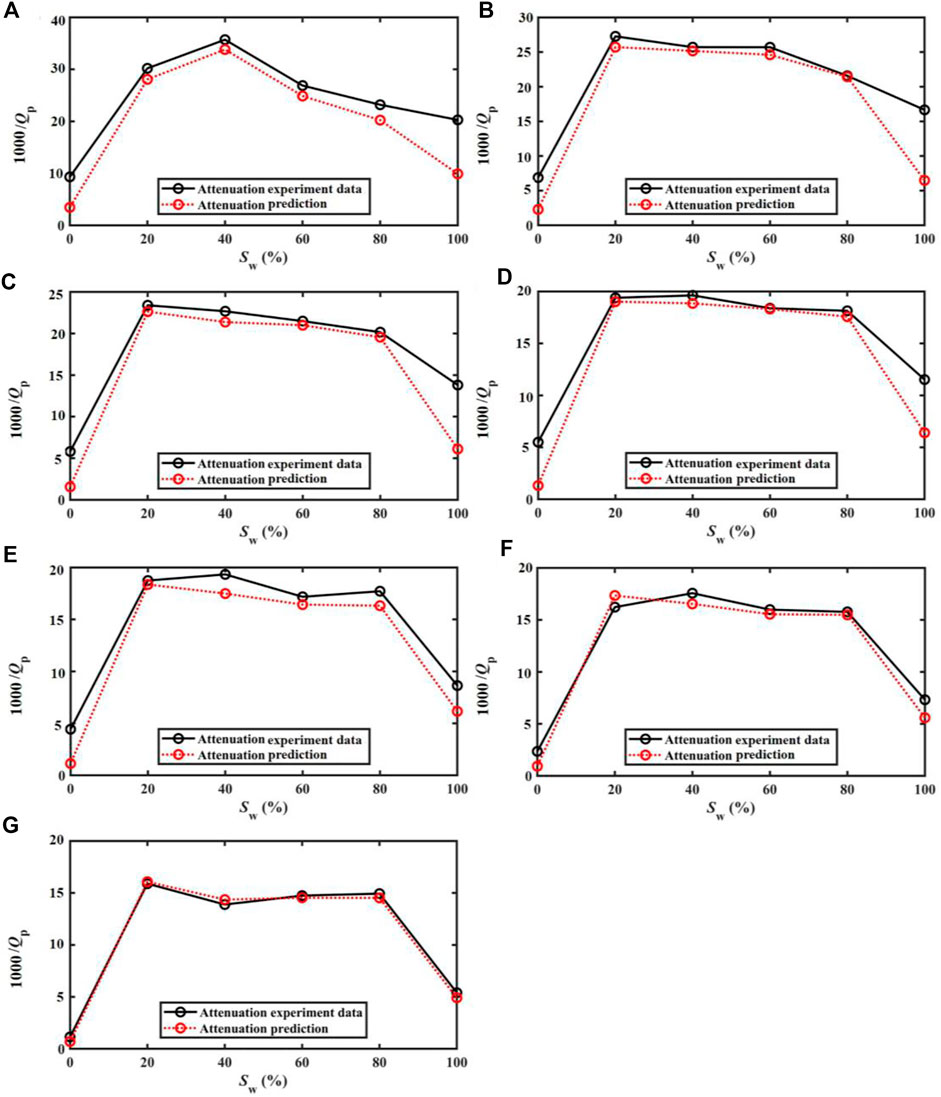
FIGURE 13. P-wave dissipation factor as a function of water saturation compared to the experimental data for sample 1–19 at 5 MPa (A), 10 MPa (B), 20 MPa (C), 30 MPa (D), 40 MPa (E), 50 MPa (F) and 60 MPa (G).
4.3 Inclusion properties
In this work, the inclusion is assumed to represent a crack or grain contact, with different porosity and compressibility as the host. The crack porosity
Figure 14 shows the crack properties as a function of the confining pressure, obtained by inversion based on the experimental data. As expected, the crack porosity
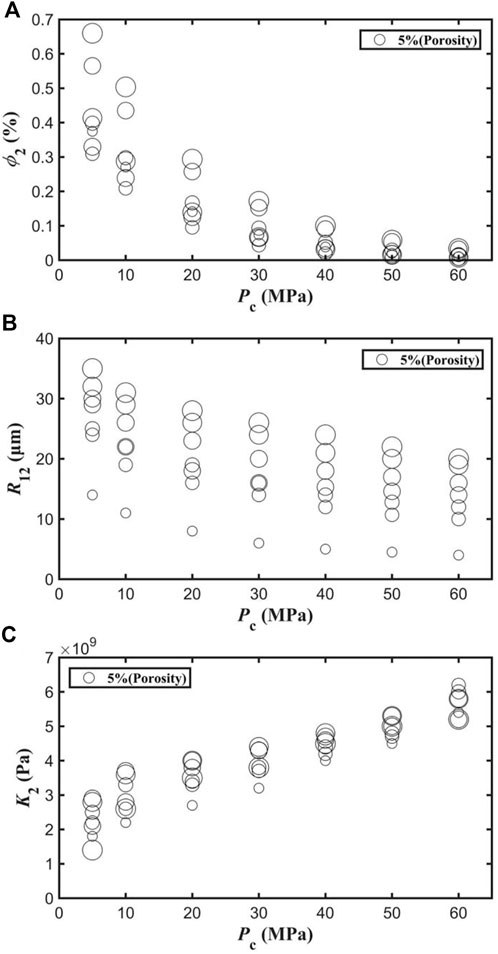
FIGURE 14. Crack porosity
On the other hand, Figure 15 represents the radius of the gas pockets in the host
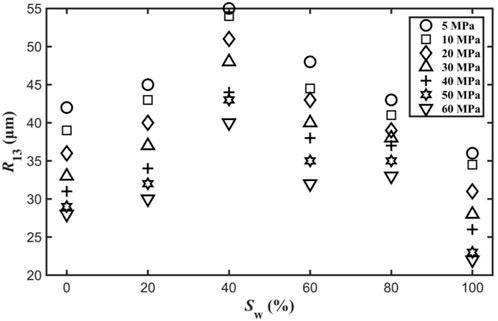
FIGURE 15. Radius of the gas pockets in the host skeleton
The crack porosity
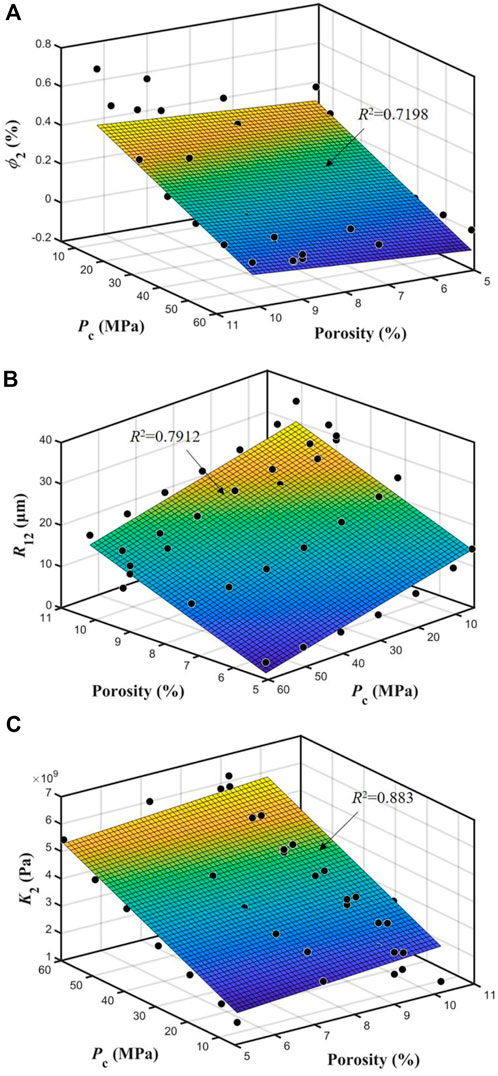
FIGURE 16. Crack porosity
Finally, Figure 17 shows the radius of the gas pockets
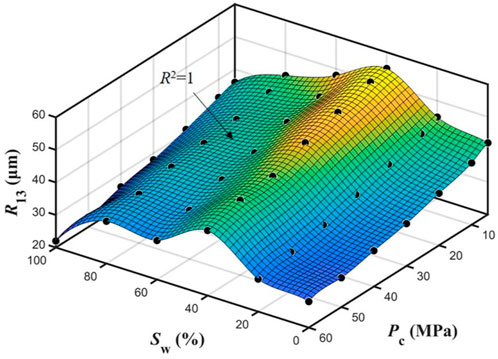
FIGURE 17. Radius of the gas pockets
5 Conclusion
We have recorded ultrasonic waveforms and conducted X-ray diffraction tests on tight sandstones extracted from shale-oil strata. The properties of rock samples are measured. We have used the spectral-ratio method to obtain the P-wave attenuation at full and partial saturation conditions. The data has been interpreted with a double double-porosity theory that takes into account mesoscopic heterogeneities of the rock frame (inclusions) and gas pockets. A predictive theoretical model is proposed. P-wave velocity dispersion and attenuation are analyzed. The theoretical results show an acceptable agreement with the experimental data. The size, porosity and elastic modulus of the inclusions and size of the pockets are obtained as a function of porosity, saturation and confining pressure.
The experiments show that at full-saturation conditions, the P-wave velocity increases with confining pressure and attenuation decreases, and that the latter increases with increasing porosity and permeability. In the gas-water case, the P-wave velocity increases and attenuation shows a maximum at intermediate saturations. The theoretical results of P-wave anelasticity significantly decrease with the increase of confining pressure. The inclusion and gas-pocket properties are obtained by inversion with the theory, and it is shown that the crack (inclusion) porosity and radius decreases with confining pressure, while the inclusion bulk modulus increases, and the effect of rock porosity on them is weak. Moreover, the radius of the pockets shows a maximum at intermediate saturations, and as pressure increases, the radius gradually decreases.
Data availability statement
The original contributions presented in the study are included in the article/Supplementary Material, further inquiries can be directed to the corresponding author.
Author contributions
JB and XP: Modeling and writing; RM: Modeling; JC: Interpretation and writing verification. All authors contributed to the article and approved the submitted version.
Funding
This work is supported by the National Natural Science Foundation of China (grant no. 41974123 and 42174161), and the Jiangsu Innovation and Entrepreneurship Plan.
Conflict of interest
The authors declare that the research was conducted in the absence of any commercial or financial relationships that could be construed as a potential conflict of interest.
Publisher’s note
All claims expressed in this article are solely those of the authors and do not necessarily represent those of their affiliated organizations, or those of the publisher, the editors and the reviewers. Any product that may be evaluated in this article, or claim that may be made by its manufacturer, is not guaranteed or endorsed by the publisher.
Supplementary material
The Supplementary Material for this article can be found online at: https://www.frontiersin.org/articles/10.3389/feart.2022.1065630/full#supplementary-material
References
Ba, J., Carcione, J. M., and Nie, J. X. (2011). Biot-Rayleigh theory of wave propagation in double-porosity media. J. Geophys. Res. 116, B06202. doi:10.1029/2010jb008185
Ba, J., Carcione, J. M., and Sun, W. T. (2015). Seismic attenuation due to heterogeneities of rock fabric and fluid distribution. Geophys. J. Int. 202 (3), 1843–1847. doi:10.1093/gji/ggv255
Ba, J., Xu, W., Fu, L., Carcione, J. M., and Zhang, L. (2017). Rock anelasticity due to patchy saturation and fabric heterogeneity: A double double-porosity model of wave propagation. J. Geophys. Res. Solid Earth 122, 1949–1976. doi:10.1002/2016jb013882
Ba, J., Zhang, L., Wang, D., Yuan, Z., Cheng, W., Ma, R., et al. (2018). Experimental analysis on P-wave attenuation in carbonate rocks and reservoir identification. J. Seismic Explor. 27 (3), 371.
Ba, J., Zhao, J., Carcione, J. M., and Huang, X. (2016). Compressional wave dispersion due to rock matrix stiffening by clay squirt flow. Geophys. Res. Lett. 43, 6186–6195. doi:10.1002/2016gl069312
Batzle, M. L., and Wang, Z. (1992). Seismic properties of pore fluids. Geophysics 57, 1396–1408. doi:10.1190/1.1443207
Biot, M. A. (1962). Mechanics of deformation and acoustic propagation in porous media. J. Appl. Phys. 33 (4), 1482–1498. doi:10.1063/1.1728759
Born, W. T. (1941). The attenuation constant of Earth materials. Geophysics 6 (2), 132–148. doi:10.1190/1.1443714
Carcione, J. M. (2022). Wave fields in real media.” in Wave propagation in anisotropic, anelastic, porous and electromagnetic media. 4th ed. Amsterdam, Netherlands: Elsevier. doi:10.1016/C2021-0-00938-X
Chapman, S., Quintal, B., Tisato, N., and Holliger, K. (2017). Frequency scaling of seismic attenuation in rocks saturated with two fluid phases. Geophys. J. Int. 208, 221–225. doi:10.1093/gji/ggw387
Chapman, S., Tisato, N., Quintal, B., and Holliger, K. (2016). Seismic attenuation in partially saturated Berea sandstone submitted to a range of confining pressures. J. Geophys. Res. Solid Earth 121 (3), 1664–1676. doi:10.1002/2015jb012575
Cheng, W., Ba, J., Ma, R. P., and Zhang, L. (2020). A study on the effects of pressure and fluid on rock pore structure and anelasticity: Theoretical model and experimental measurement. Chin. J. Geophys. 63 (12), 4517. doi:10.6038/cjg2020N0457
Deng, J., Tang, Z., Li, Y., Xie, J., Liu, H., and Guo, W. (2018). The influence of the diagenetic process on seismic rock physical properties of Wufeng and Longmaxi Formation shale. Chin. J. Geophys. 61 (2), 659. doi:10.6038/cjg2018L0062
Dvorkin, J., Mavko, G., and Nur, A. (1995). Squirt flow in fully saturated rocks. Geophysics 60 (1), 97–107. doi:10.1190/1.1443767
Dvorkin, J., Nolen-Hoeksema, R., and Nur, A. (1994). The Squirt-flow mechanism: Macroscopic description. Geophysics 59 (3), 428–438. doi:10.1190/1.1443605
Dvorkin, J., and Nur, A. (1993). Dynamic poroelasticity: A unified model with the squirt and the Biot mechanisms. Geophysics 58 (4), 524–533. doi:10.1190/1.1443435
Gao, F., Wei, J. X., and Di, B. R. (2019). Ultrasonic attenuation estimation based on time-frequency analysis. Appl. Geophys. 16, 414–426. doi:10.1007/s11770-019-0782-1
Guo, M. Q., Ba, J., Ma, R. P., et al. (2018). P-wave velocity dispersion and attenuation in fluid-saturated tight sandstones: Characteristics analysis based on a double double-porosity structure model description. Chin. J. Geophys. 61 (3), 1053. doi:10.6038/cjg2018L0678
Guo, M. Q., Fu, L. Y., and Ba, J. (2009). Comparison of stress-associated coda attenuation and intrinsic attenuation from ultrasonic measurements. Geophys. J. Int. 178 (1), 447–456. doi:10.1111/j.1365-246x.2009.04159.x
Hill, R. (1952). The elastic behaviour of a crystalline aggregate. Proc. Phys. Soc. A 65 (5), 349–354. doi:10.1088/0370-1298/65/5/307
Johnson, D. L. (1986). “Recent developments in the acoustic properties of porous media,” in Frontiers in physical acoustics XCIII. Editor D. Sette (New York: Elsevier), 255
Johnston, D. H., Toksöz, M. N., and Timur, A. (1979). Attenuation of seismic waves in dry and saturated rocks: II. Mechanisms. Geophysics 44, 691–711. doi:10.1190/1.1440970
Johnston, D. H., and Toksöz, M. N. (1980). Ultrasonic P and S wave attenuation in dry and saturated rocks under pressure. J. Geophys. Res. 85, 925–936. doi:10.1029/jb085ib02p00925
Li, D. Q., Wei, J. X., Di, B. R., Ding, P. B., Huang, S. Q., and Shuai, D. (2018). Experimental study and theoretical interpretation of saturation effect on ultrasonic velocity in tight sandstones under different pressure conditions. Geophys. J. Int. 212 (3), 2226–2237. doi:10.1093/gji/ggx536
Li, X., Zhong, L. R., and Pyrak-Nolte, L. J. (2001). Physics of partially saturated porous media: Residual saturation and seismic-wavepropagation. Annu. Rev. Earth Planet. Sci. 29 (1), 419–460. doi:10.1146/annurev.earth.29.1.419
Ma, R. P., Ba, J., Carcione, J. M., Zhou, X., and Li, F. (2019). Dispersion and attenuation of compressional waves in tight oil reservoirs: Experiments and simulations. Appl. Geophys. 16, 33–45. doi:10.1007/s11770-019-0748-3
Ma, R. P., and Ba, J. (2020). Coda and intrinsic attenuations from ultrasonic measurements in tight siltstones. J. Geophys. Res. Solid Earth 125, e2019JB018825. doi:10.1029/2019jb018825
Mavko, G., and Mukerji, T. (1998). Bounds on low- frequency seismic velocities in partially saturated rocks. Geophysics 63 (3), 918–924. doi:10.1190/1.1444402
Pimienta, L., Fortin, J., and Guéguen, Y. (2016). Effect of fluids and frequencies on Poisson’s ratio of sandstone samples. Geophysics 81 (2), D35–D47. doi:10.1190/geo-2015-0310.1
Pimienta, L., Fortin, J., and Guéguen, Y. (2015). Experimental study of Young’s modulus dispersion and attenuation in fully saturated sandstones. Geophysics 80 (5), L57–L72. doi:10.1190/geo2014-0532.1
Pride, S. R., Berryman, J. G., and Harris, J. M. (2004). Seismic attenuation due to wave induced flow. J. Geophys. Res. 109 (B1), B01201. doi:10.1029/2003jb002639
Ren, S. B., Han, T. C., and Fu, L. Y. (2020). Theoretical and experimental study of P-wave attenuation in partially saturated sandstones under different pressures. Chin. J. Geophys. 63 (07), 2722. doi:10.6038/cjg2020O0021
Reuss, A. (1929). Berechnung der fliessgrenze von mischkristallen auf grund der Plastizitatsbedingungen Fur einkristalle. Z. Angew. Math. Mech. 9, 49–58. doi:10.1002/zamm.19290090104
Sams, M. S., Neep, J. P., Worthington, M. H., and King, M. S. (1997). The measurement of velocity dispersion and frequency-dependent intrinsic attenuation in sedimentary rocks. Geophysics 62, 1456–1464. doi:10.1190/1.1444249
Sharma, R., Prasad, M., Batzle, M., and Vega, S. (2013). Sensitivity of flow and elastic properties to fabric heterogeneity in carbonates. Geophys. Prospect. 61, 270–286. doi:10.1111/1365-2478.12030
Shukla, K., Carcione, J. M., Jaiswal, P., Santos, J., and Ba, J. (2019). Effect of capillary pressure on seismic velocities and attenuation. J. Porous Media 22 (4), 447–466. doi:10.1615/jpormedia.2018021864
Toksöz, M. N., Johnston, D. H., and Timur, A. (1979). Attenuation of seismic waves in dry and saturated rocks: i. Laboratory measurements. Geophysics 44, 681–690. doi:10.1190/1.1440969
Tutuncu, A. N., Podio, A. L., and Sharma, M. (1994). An experimental investigation of factors influencing compressional- and shear-wave velocities and attenuations in tight gas sandstones. Geophysics 59 (1), 77–86. doi:10.1190/1.1443536
Wang, D. X., Xin, K. F., Li, M. Y., Gao, J. H., and Wu, X. Y. (2006). An experimental study of influence of water saturation on velocity and attenuation in sandstone under stratum conditions. Chin. J. Geophys. 49 (03), 908
Wei, Q., Wang, Y., Han, D., Sun, M., and Huang, Q. (2021). Combined effects of permeability and fluid saturation on seismic wave dispersion and attenuation in partially-saturated sandstone. Adv. Geo-Energy Res. 5 (2), 181–190. doi:10.46690/ager.2021.02.07
Wei, Y. J., Ba, J., Ma, R. P., Zhang, L., Carcione, J. M., and Guo, M. Q. (2020). Effect of effective pressure change on pore structure and elastic wave responses in tight sandstones. Chin. J. Geophys. 63 (07), 2810. doi:10.6038/cjg2019N0004
White, J. E., Mikhaylova, N. G., and Lyakhovitskiy, F. M. (1975). Low-frequency seismic waves in fluid saturated layered rocks. J. Acoust. Soc. Am. 57 (S30), S30–S659. doi:10.1121/1.1995164
Winkler, K. (1985). Dispersion analysis of velocity and attenuation in Berea sandstone. J. Geophys. Res. 90, 6793–6800. doi:10.1029/jb090ib08p06793
Yin, H., Zhao, J., Tang, G., Zhao, L., Ma, X., and Wang, S. (2017). Pressure and fluid effect on frequency-dependent elastic moduli in fully saturated tight sandstone. J. Geophys. Res. Solid Earth 122, 8925–8942. doi:10.1002/2017jb014244
Zhang, C. J., and Ulrych, T. J. (2002). Estimation of quality factors from CMP records. Geophysics 67, 1542–1547. doi:10.1190/1.1512799
Zhang, L., Ba, J., Fu, L., Carcione, J. M., and Cao, C. (2019). Estimation of pore microstructure by using the static and dynamic moduli. Int. J. Rock Mech. Min. Sci. 113, 24–30. doi:10.1016/j.ijrmms.2018.11.005
Zhang, L., Ba, J., Yin, W., Sun, W., and Tang, J. (2017). Seismic wave propagation equations of conglomerate reservoirs: A triple-porosity structure model. Chin. J. Geophys. 60 (3), 1073. doi:10.6038/cjg20170320
Zhao, L., Yuan, H., Yang, J., Han, D.-h., Geng, J., Zhou, R., et al. (2017). Mobility effect on poroelastic seismic signatures in partially saturated rocks with applications in time-lapse monitoring of a heavy oil reservoir. J. Geophys. Res. Solid Earth 122, 8872–8891. doi:10.1002/2017jb014303
Zhubayev, A., Houben, M. E., Smeulders, D. M. J., and Barnhoorn, A. (2016). Ultrasonic velocity and attenuation anisotropy of shales, Whitby, United Kingdom. Geophysics 81 (1), D45–D56. doi:10.1190/geo2015-0211.1
Keywords: tight sandstones, P-wave velocity and attenuation, confining pressure, fluid saturation, double double-porosity model
Citation: Ba J, Pan X, Carcione JM and Ma R (2023) Effects of pressure and fluid properties on P-wave velocity and attenuation of tight sandstones. Front. Earth Sci. 10:1065630. doi: 10.3389/feart.2022.1065630
Received: 10 October 2022; Accepted: 08 November 2022;
Published: 12 January 2023.
Edited by:
Qiaomu Qi, Chengdu University of Technology, ChinaReviewed by:
Jiajia Gao, Southwest Petroleum University, ChinaSheng-Qing Li, China University of Petroleum, China
Copyright © 2023 Ba, Pan, Carcione and Ma. This is an open-access article distributed under the terms of the Creative Commons Attribution License (CC BY). The use, distribution or reproduction in other forums is permitted, provided the original author(s) and the copyright owner(s) are credited and that the original publication in this journal is cited, in accordance with accepted academic practice. No use, distribution or reproduction is permitted which does not comply with these terms.
*Correspondence: Jing Ba, amluZ2JhQDE4OC5jb20=