 Ling Huang
 Lanqiang Bai
95% of researchers rate our articles as excellent or good
Learn more about the work of our research integrity team to safeguard the quality of each article we publish.
Find out more
ORIGINAL RESEARCH article
Front. Earth Sci. , 10 January 2023
Sec. Atmospheric Science
Volume 10 - 2022 | https://doi.org/10.3389/feart.2022.1065074
This article is part of the Research Topic Observation Characteristics and Formation Mechanisms of Severe Weather Events View all 13 articles
Urbanization of large cities exerts significant changes in surface air temperature, which subsequently lead to inadvertent local weather and climate changes. The exchanges of momentum, moisture and heat within the planetary boundary layer (PBL) impact the urban atmosphere representation. The applicability of PBL schemes in regional modeling varies with different climate regimes and underlying surface. As the first step to gaining a better forecast of urban climates, the performances of multiple PBL schemes (YSU, MRF, ACM2, BL, MYNN, UW and GBM) on reproducing the low-level urban atmosphere are evaluated over the Greater Bay Area, South China, during April–June 2018. With the aid of observations from in situ weather stations and radiosondes, the urban environmental characteristics, including surface air temperature and humidity, temperature profile, urban heat island (UHI), and PBL height, are assessed. The results show a cool/moist bias near the surface during nighttime and a warm/dry bias during daytime for all PBL schemes. The daytime bias is significant on weak-UHI days while the nocturnal bias appears to be significant on strong-UHI days. The so-called best scheme depends on the exact meteorological variables, diurnal cycles, and thermodynamic conditions that are of interest. Specifically, the MYNN and MRF schemes perform the best for the daytime and nighttime air temperature, respectively. The MRF scheme also presents the best performance in simulating the observed UHI, with a good agreement with the observed diurnal variation. The numerical exercises in this study may serve as a reference for an efficient operational way that is readily accessible to forecast air temperature in the urban agglomeration over South China.
• The predictability of urban heat islands over the Great Bay Metropolis is discussed based on ensemble simulations and observations.
• The long-term modeled surface temperature presents a warm bias in the day and a cool bias at night.
• The MRF scheme shows a better performance than other PBL schemes in reproducing the diurnal variation in urban heat island intensity.
The rise in the proportion of global human populations in urban regions has resulted in widespread concern regarding the emergence of natural disasters. Under a changing climate, the highly populated metropolises are particularly vulnerable to the increasing extreme severe weather (Hallegatte et al., 2013; Zhang 2020; Sun X. et al., 2021). It will become increasingly likely that weather hazards will affect the interests of humankind due to the “expanding bull’s eye effect” (Ashley et al., 2014). Investigating the modeled characteristics of urban environment is thus a first step to forecasting and issuing warnings for extreme weather, especially over urban agglomerations on coasts which are often highly populated.
The local severe weather over the urban surface is closely linked to the thermal perturbations associated with the urban heat island (UHI) (e.g., Huff and Vogel 1978; Li et al., 2011; Zhang et al., 2015; Wu et al., 2019; Doan et al., 2021), which is typically characterized by an evident lower-troposphere temperature contrast between the urban and surrounding rural regions (Oke 1995). The UHI effect tends to destabilize the planetary boundary layer (PBL), triggering low-level updrafts, gravity waves, and horizontal convergence (Niyogi et al., 2011). Based on observations, a recent study documented a possible link between enhanced rainfall and rapid urbanization in the Greater Bay region in South China. It was found that more and stronger extreme rainfall occurs in the strong-UHI scenario (Wu et al., 2019). Thus, an accurate representation of the UHI is important for improving regional severe weather forecasts because a forecast failure may result from the nonnegligible error of a necessary condition (Johns and Doswell 1992).
The exchanges of momentum, moisture and heat within PBL through turbulent processes, which affect the representation of low-level thermodynamic structures, are a substantial source of forecast inaccuracy in numerical models (Jankov et al., 2005; Stensrud 2007; Hacker 2010; Hu et al., 2010; Nielsen-Gammon et al., 2010; Cohen et al., 2015). Several PBL parameterization schemes have been developed in some widely used numerical models, such as the WRF model (Skamarock et al., 2008), to depict the lower-level environment by various possible physical processes. These PBL schemes are roughly categorized into local schemes and nonlocal schemes, depending on the depth over which the variables are allowed to affect a given level. Thus, the extents of the vertical gradient of the perturbation quantities at each vertical level are different between the two groups (e.g., Ching et al., 2014; Dzebre and Adaramola 2020). In the case of local schemes, such as MYNN, BL, and GBM (Table 1), only the variables at the given point can impact the points directly vertically adjacent to it. On the other hand, variables at a given level in nonlocal schemes are determined by multiple vertical levels (e.g., YSU; Table 1). Nonlocal schemes usually produce stronger turbulent mixing than local schemes.
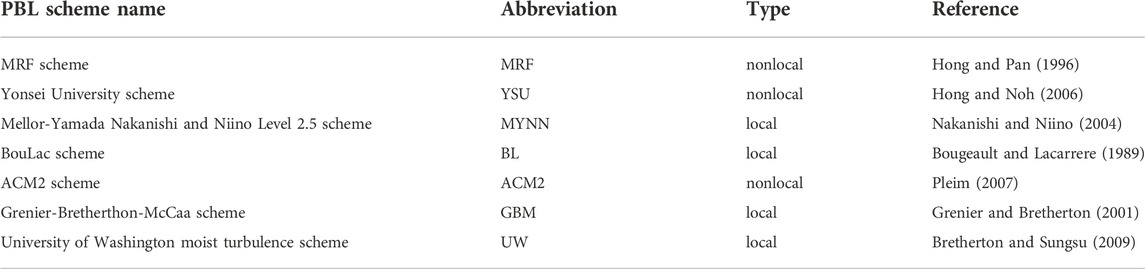
TABLE 1. Summary of the PBL schemes examined in the study.
PBL schemes may use different turbulence-closure hypotheses, vertical mixing processes, and PBL height calculations, leading to different levels of accuracy when describing lower-tropospheric turbulence. The diversity of PBL physics among these parameterization schemes will have different impacts on the thermodynamics in the lower troposphere. The impact of the abovementioned PBL schemes on meteorological variables has been emphasized in recent decades over different climate regimes worldwide (Hu et al., 2010; Xie et al., 2012). The results revealed that there is no optimal PBL scheme for all cases; their performances vary depending on the underlying surface, specific weather season, geographical location that affects moisture conditions (e.g., arid/humid regions) and atmospheric radiation, and time of day. For example, while some studies have suggested a cold bias of modeled near-surface temperature (T2) over Europe and the USA during daytime (e.g., Hu et al., 2010; Garcia-Diez et al., 2011; Banks and Baldasano, 2016; Avolio et al., 2017; Huang et al., 2019), several other studies reported a daytime warm bias over the United Arab Emirates and India (Chaouch et al., 2017; Gunwani and Mohan, 2017). For a single parametrization scheme, it may perform better than other schemes according to the cases and the variables being evaluated (e.g., Borge et al., 2008; Hariprasad et al., 2014; Banks and Baldasano, 2016; Barlage et al., 2016; Li et al., 2016; Chaouch et al., 2017; Gunwani and Mohan, 2017; Ferrero et al., 2018; Wang and Ying, 2020; Martilli et al., 2021; Wang et al., 2021; Huang, 2020). It is thus necessary to investigate the applicability of PBL schemes over a specific climate regime, which would be helpful to determine the optimized parameterizations for regional mesoscale modeling, especially over the highly populated urban agglomerations.
The Guangdong-Hong Kong-Macao Greater Bay Area (GBA) has expanded rapidly during the past 3 decades. By 2021, it covers an area of approximately 56,000 km2, with a population of over 86 million. Adjacent to the northern part of the South China Sea (SCS, Figure 1), the GBA is located in a relatively flat region surrounded by mountains (Figure 1C). The surrounding rural areas are covered by a variety of vegetation types, such as wetlands, grassland and dense trees (Figure 1B). Over the GBA, where an intense UHI is centered, Wu et al., 2019 demonstrated an increasing occurrence of severe weather during the early summer rainy season (April–June) in South China (Ding 1994). Recent studies have suggested the importance of UHI effects on nocturnal convection initiation over the GBA (Yin et al., 2020), the regulation of extreme rainfall (Li et al., 2021), and the distribution of extreme hourly rainfall (Sun Y. et al., 2021). Although the urban-canopy model in WRF has been developed and evaluated (e.g., Barlage et al., 2016; Huang et al., 2019; Sun X. et al., 2021), the expensive cost of computational resources prevents it from being the routine operational system for daily forecasts. Therefore, investigating the characteristics among the PBL schemes for the early summer rainy season over the GBA is an important step to identifying potential weaknesses, which may lead to substantial model inaccuracy. This is relevant for operational meteorology systems in representing the urban environment, with the primary focus of the present work being on model performance in urban‒rural environments.
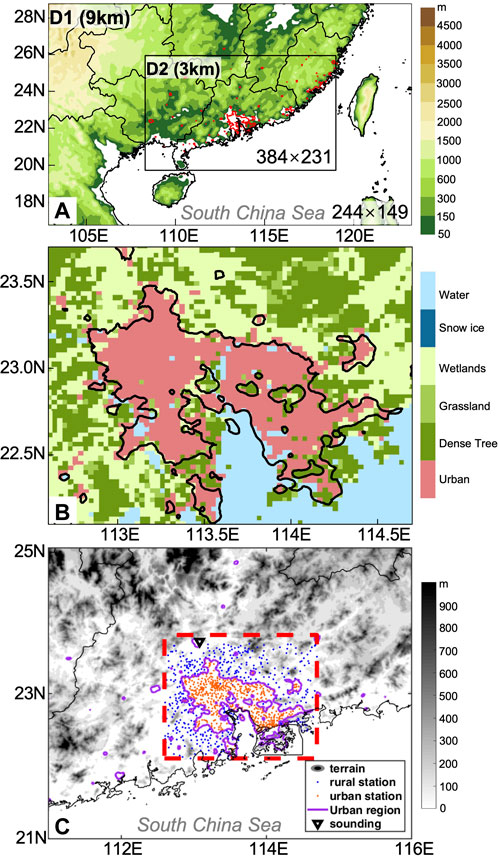
FIGURE 1. (A) The two nested domains of WRF with terrain heights (shadings). The urban areas (red isopleths) are identified by the DMSP nighttime light data in 2013. The grid point in each domain is indicated on the bottom right. (B) Enlarged Greater Bay Area. The shadings denote the type of underlying surface. The black contours are the urban areas shown in (A). (C) Distribution of observations within the key region. The colored dots are the AWS over the key region (red-dashed box; the region in (B)), with orange (blue) dots indicating stations over the urban (rural) region. The black inverted triangle denotes the location of the sounding at Qingyuan. The shadings indicate the terrain heights. The magenta contours are the urban areas in (A).
This study attempts to evaluate the performances of seven commonly used PBL schemes in simulating the thermodynamic conditions over the GBA region during the early summer rainy season, when afternoon thunderstorms frequently occur. Multisource observations were collected to provide a comprehensive validation dataset for model evaluation. Section 2 describes the experimental design and data. Section 3 presents the evaluation of PBL schemes, including near-surface and vertical condition analysis. The final section provides a brief discussion and summary.
A set of WRF (Skamarock et al., 2008; version 4.0) simulations were conducted over the period from 2 April to 29 June 2018. They were initialized every day at 0800 local solar time [LST; LST = UTC (Universal Time Coordinated) + 8 h] and integrated for 36 h. The first 12 model hours were regarded as the spin-up periods (Huang et al., 2022) and the following 24 model hours were used to obtain continuous numerical outputs from April to June. Initial and lateral boundary conditions are provided by the National Centers for Environmental Prediction (NCEP) Global Data Assimilation System (GDAS) Model analysis data, with a horizontal resolution of 0.25° and a time interval of 6 h (available at 0000, 0600, 1200 and 1800 UTC). The two-way nested domains covered part of South China, with horizontal grid spacings of 9 km and 3 km, respectively (Figure 1A). The innermost domain with fine resolutions is characterized by the complex terrain, GBA, and land/sea contrast. A total of 40 terrain-following hydrostatic-pressure vertical levels are used with finer grid spacing in the boundary layer. Seven PBL parameterization schemes, which are available in WRF, are examined in this study (Table 1), including four local schemes (i.e., MYNN, BL, UW and GBM) and three nonlocal schemes (i.e., YSU, ACM2 and MRF). For more details on the dataset and model setup, please refer to Huang et al. (2022).
The observations from the automated weather stations (AWS) of the China Meteorological Administration (CMA) were used to evaluate these simulations. The near-surface air temperature (T2) was hourly available from 1088 AWS over the region of interest (red dashed line in Figure 1C) which covers the GBA and its nearby rural areas (Figures 1B,C). The urban and rural stations are distinguished by the DMSP nighttime light data in 2013 (magenta solid line contours in Figure 1C; Wu et al., 2019). The high light values fit well with the urban outline in the numerical model (Figures 1B,C). Data from 597 urban stations and 491 rural stations were processed with strict quality-control procedures, including the climatological limit value test, internal consistency test and space/time continuity test. Observations collected by an L-band radiosonde located in the rural region were also used to examine the model behaviors on vertical levels. The sounding data were collected at a time interval of 1 s with a high vertical resolution of several meters near the surface (Liu and Chen 2014), providing observations at 1100 and 2300 UTC, including temperature, pressure, humidity, heights, and horizontal winds.
To thoroughly investigate the model performance in reproducing UHIs, the early summer rainy season in 2018 (excluding the days on which a tropical cyclone made landfall, i.e., 5th to 12th June) was categorized into strong, moderate and weak UHI days, according to the daily maximum of the hourly UHI:
where
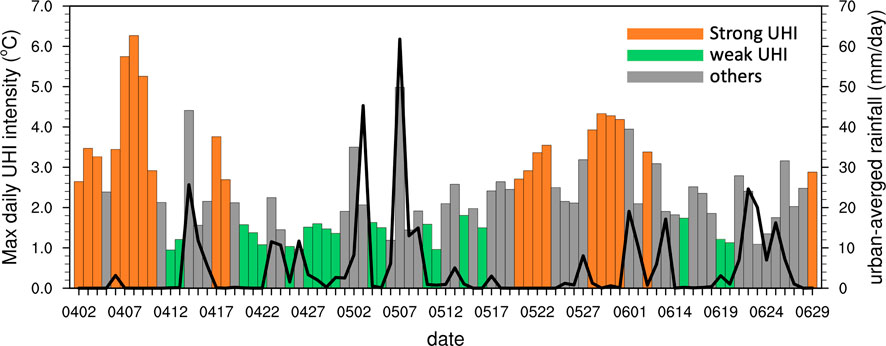
FIGURE 2. The evolution of the observed daily maximum urban heat island intensity (urban minus rural; colored bars on left axis) and the daily average rainfall over the urban region (black line on right axis) from 2nd April to 29th June, excluding the days when tropical cyclones made landfalls (5th to 12th June). The orange (green) bars indicate strong (weak) UHI days without daily rainfall accumulation exceeding 5 mm/day. The gray bars indicate the remaining days.
The simulated results are compared with lower-troposphere observations to evaluate the model performances in reproducing the thermodynamic conditions in urban areas by different PBL schemes. The near-surface and vertical structures of the thermodynamic parameters are examined, and the possible mechanisms are discussed to evaluate the superiority and deficiency of the abovementioned schemes.
There are several distinguishing features in the observed T2 between the strong- and weak-UHI days. The strong-UHI days exhibit the highest T2, especially over the northern part of the urban area, where the daily average temperature reaches a maximum of 28°C (Figure 3). During the weak-UHI condition in this region, the average temperature is approximately 1°C lower (Figures 3B,C; Table 2). The T2 difference between the strong- and weak-UHI days is primarily contributed by the temperature in daytime (Table 2; Figures 4A,B). This phenomenon also leads to a larger amplitude in diurnal variation on strong-UHI days over the urban region (3.67°C vs. 1.92°C; Table 2). On the other hand, the strong-UHI days present a higher warming rate from 0600 to 0800 LST, with the unobstructed rural surface warming more rapidly as it receives direct solar radiation shortly after sunrise (Figure 4C), which is related to the thermal properties and the shading of some walls and portions of the canyon floor (Oke et al., 2017). Cooling rates for both the urban and rural regions on the strong-UHI days maximize at 1800 LST because of an evident decrease in solar radiation. The urban cooling is weaker relative to the rural region, leading to a gradual re-intensification of the UHI after sunset (Figures 4C,E). In contrast, the temperature variations in the urban and rural regions on weak-UHI days are comparable (Figure 4D). Overall, the diurnal amplitude of the UHI intensity on strong-UHI days is 0.73°C greater than that on weak-UHI days (Table 2; Figures 4E,F). Therefore, the strong-UHI days featured higher near-surface temperatures in the daytime and higher UHI intensities at nighttime, with larger diurnal amplitudes (Figure 4) relative to those of the weak-UHI days. Such features are closely related to the higher surface pressure and weaker prevailing southwesterlies (Figure 5) so that weaker vertical upward motion and horizontal advection that favor the urban heat can be preserved.
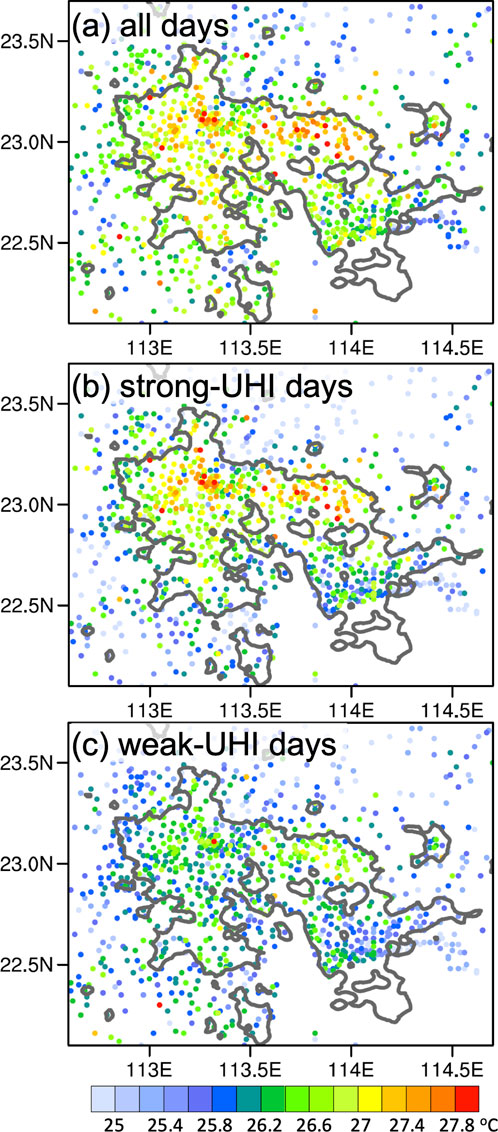
FIGURE 3. The observed daily average surface temperature (mm day−1) for (A) all days from April to June 2018, (B) strong-UHI days, and (C) weak-UHI days. The gray isopleths denote the urban areas defined the DMSP nighttime light data in 2013.
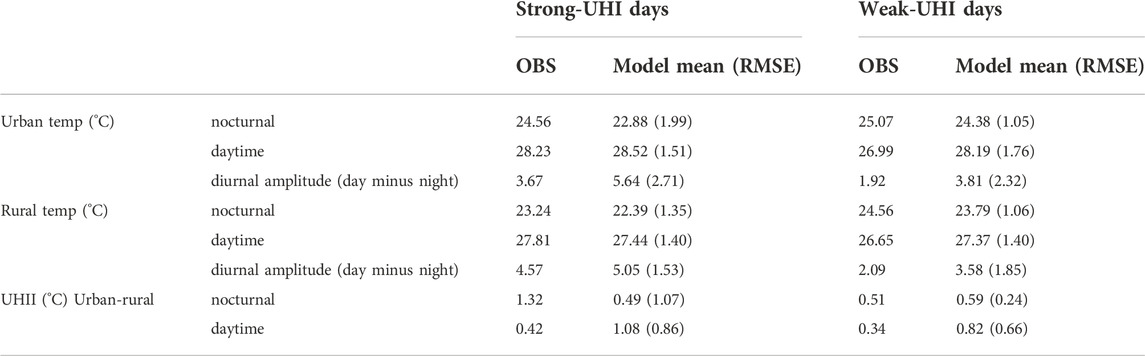
TABLE 2. Statistics of observed (OBS) and modeled surface air temperature (T2) over urban and rural regions on strong and weak-UHI days. The “Nocturnal” values are calculated by the hourly T2 mean from 2000 LST to 0700 LST, while the “daytime” values are obtained from the T2 mean from 0800 LST to 1900 LST. The model means are the arithmetic means of the outputs from the seven PBL schemes.
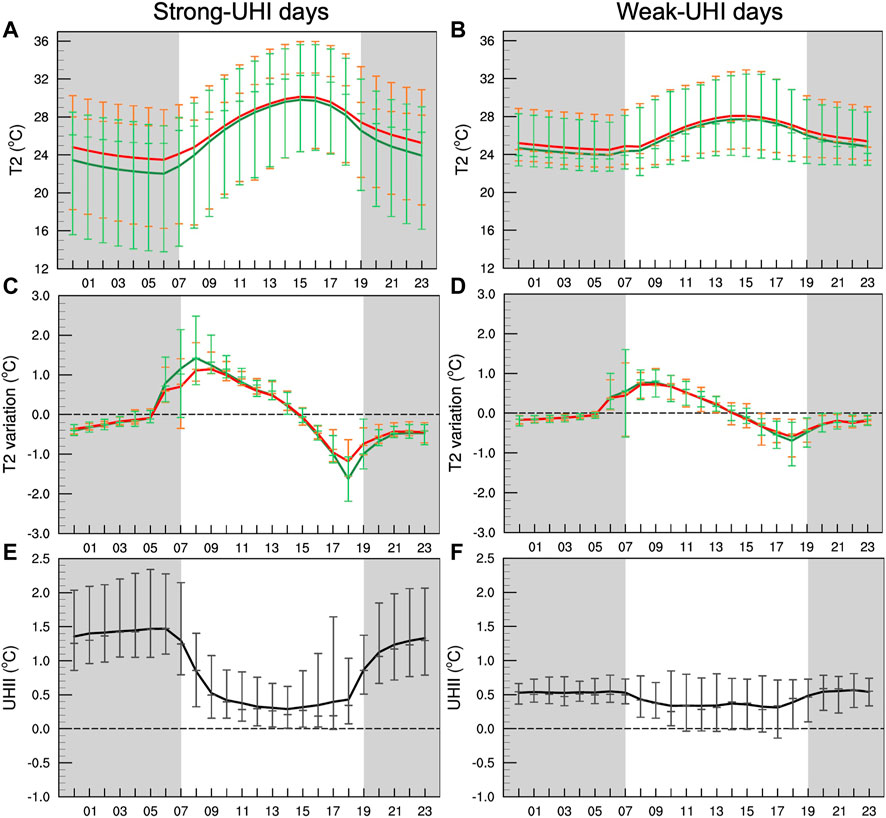
FIGURE 4. (A) The diurnal variations in the observed domain-averaged surface air temperature over the urban (red) and rural (green) regions averaged on the strong-UHI days. The error bars show the outliers (i.e., 10th and 90th percentiles are whiskers). (C) is similar to (A) but for the warming/cooling rates. (E) The diurnal variations in UHI intensity, with error bars representing the outliers (i.e., 10th and 90th percentiles are whiskers). (B), (D), and (F) are similar to (A), (C), and (E) but on the weak-UHI days. The gray zones denote the nocturnal time window from 1900 LST to 0700 LST.
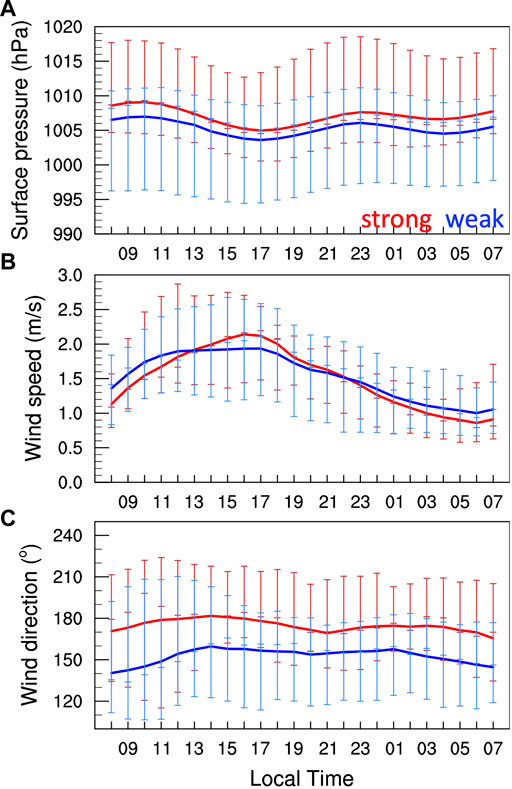
FIGURE 5. Diurnal variation of the domain-averaged (A) surface pressure (units: hPa), (B) wind speed (units: m/s), and (C) wind direction (units: degree) for strong-UHI days (red) and weak-UHI days (blue). The error bars denote the 25th, 50th and 75th percentile of the data at each local time.
Figure 6 presents the spatial distributions of the daily averaged T2 during the early summer rainy season for multiple PBL schemes. Compared to the observations (Figure 3A), the seven sets of seasonal simulations generally reproduced the prominent urban warm zone over the western part of 113.5°E well, while the simulated T2 in the northeastern portion of the urban area is underestimated (Figures 6A–C, Figures 6E,F), except for the MRF (Figure 6G) and BL (Figure 6D) groups. Because T2 results from the model diagnosis based on the surface and lowest model layer values, errors in the vertical transition between the surface and upper levels in different PBL schemes will lead to different T2 biases (Hu et al., 2010). The nonlocal closure MRF scheme shows the most severe overestimation of T2, followed by the local BL scheme, which is more comparable with the observation relative to other schemes (c.f., Figure 6 and Figure 3A). The higher T2 determined by the BL scheme is also indicated in a study that focused on the Phoenix and Tucson metropolitan areas (Palou and Mahalov 2019), yet the comparison of the MRF and other well-developed schemes has not been thoroughly investigated. The explicit entrainment at the top of the PBL represented in the YSU scheme tends to simulate the deeper vertical extent of mixing more accurately within the PBL, which alleviates the well-known problems in the MRF PBL (Hong and Noh 2006). Consequently, some systematic biases of the large-scale features, such as an afternoon cold bias at 850 hPa and warm bias near the surface in the MRF PBL, are resolved by the YSU (Hong and Noh 2006). Moreover, the local BL scheme shows a higher near-surface temperature due to the weaker mixing that constrains the high
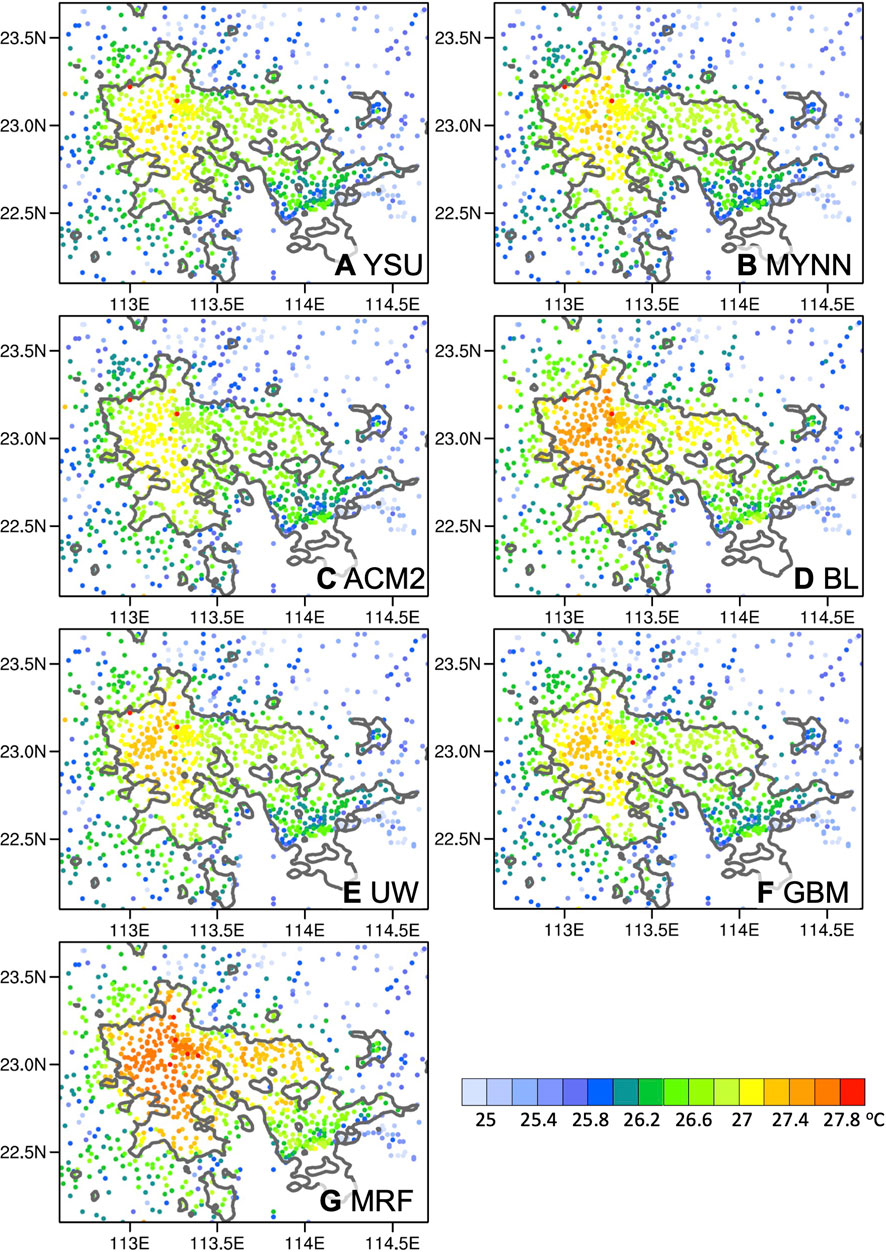
FIGURE 6. Simulated daily average of surface air temperature (mm day−1) averaged from 2nd April to 30 June 2018 for (A) YSU, (B) MYNN, (C) ACM2, (D) BL, (E) UW, (F) GBM, and (G) MRF. The gray isopleths denote the urban areas defined by the DMSP nighttime light data in 2013.
To further diagnose the model errors on subdaily time scale, the diurnal cycle of the urban-averaged T2 is analyzed (Figure 7). In the GBA region, the model tends to overestimate the daytime T2 and underestimate the nocturnal T2 on both strong- and weak-UHI days (Figures 7C–F), except that the MRF produces a warmer nighttime T2 than the observations on weak UHI days (Figure 7E). The model can capture the observed difference in daytime T2 between weak- (26.99°C; Table 2) and strong-UHI (28.23°C; Table 2) days, which might be related to the model’s capability to differentially reproduce cloud cover, soil moisture, radiation, etc., between these two scenarios (e.g., Hu et al., 2010). Notably, the simulated nocturnal T2 on the weak-UHI days is relatively higher than that on the strong-UHI days, with a smaller RMSE, which is speculated to be associated with more cloud cover on weak-UHI days that preserved the heat loss during nighttime (Kassomenos and Katsoulis, 2006; Figures 7C–F). Collectively, the models reproduce the larger diurnal amplitude for the strong-UHI days (5.64°C; Table 2) and smaller diurnal amplitude for the weak-UHI days (3.81°C; Table 2) over the urban region, as the observation indicated. These results suggest that to some extent, the models can distinguish among days with strong UHIs and days with weak UHIs.
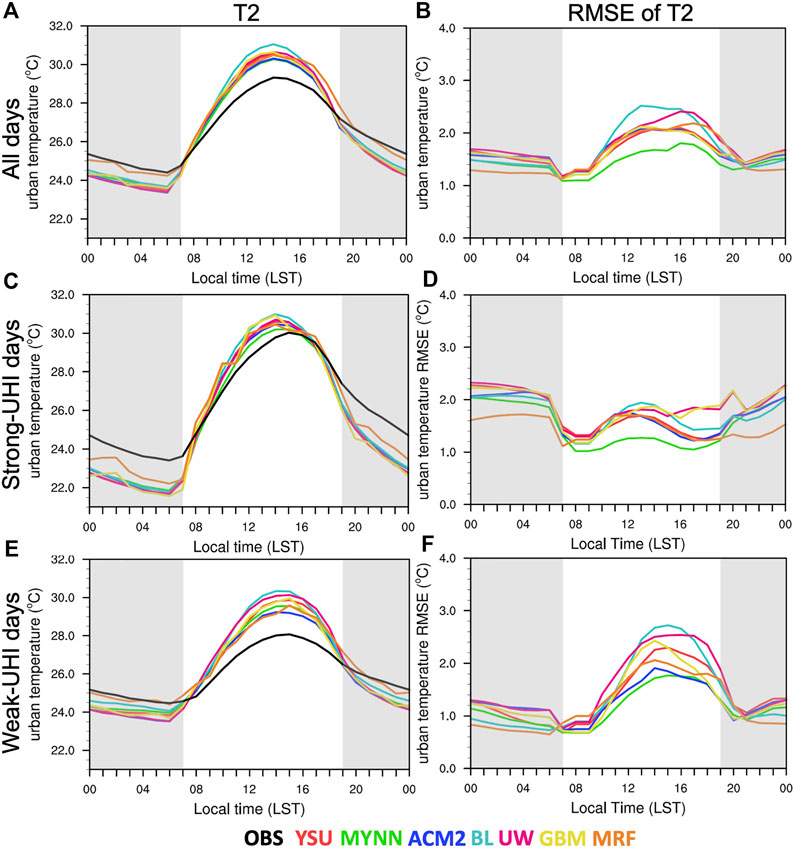
FIGURE 7. (A) Comparisons of the observed and simulated diurnal variations in the domain-averaged near-surface temperature for the entire early summer rainy season (excluding the days when TCs made landfall) and (B) the corresponding root mean square error of the model. (C,D) and (E,F) are similar to (A,B) but for the strong- and weak-UHI days. The gray zones denote the nocturnal time window from 1900 LST to 0700 LST.
The performances of each PBL parameterization scheme and the associated error sources on T2 are further discussed. Generally, T2 is more sensitive to PBL schemes on weak-UHII days (Figures 7E,F) when the daytime T2 is relatively low, and thus, stable conditions are more frequent (Garcia-Diez et al., 2011). In such a scenario, BL and UW show the greatest error during the daytime (Figure 7F), with an overestimation of 2.7°C at 1400 LST (Figure 7E). Therefore, with diurnal amplitudes comparable to other schemes on the strong-UHI days, the BL seasonal daily averaged T2 (Figure 6D) is mostly contributed by the daytime overestimation on the weak-UHI days (Figures 7A,B,E,F). In contrast, the severe overestimation of the seasonal daily average T2 of the MRF (Figure 6G) is mostly contributed by the overestimation of daytime T2 and comparable nocturnal T2 on both weak- and strong-UHI days. Notably, the nocturnal T2 of the MRF is closest to the observation in all scenarios among all PBL schemes (Figure 7). The MYNN scheme shows the least daytime bias on both weak- and strong-UHI days, followed by ACM2, suggesting a reasonable performance by MYNN in reproducing daytime T2 among all PBL schemes for the urban region.
The performances of the model in reproducing the urban‒rural thermal contrast, a. k.a., the urban heat island, are discussed in Figure 8. Most of the PBL parameterization schemes present similar diurnal cycles on strong- and weak-UHI days with comparable diurnal amplitudes but are antiphase relative to the observations (Figure 8). Specifically, the maximum/minimum of the observed UHI intensity occurs at midnight/afternoon, while that of the simulation occurs at afternoon/midnight. The simulated errors of the UHI intensity are probably due to the stronger simulated radiated urban heating in daytime and the stronger simulated urban cooling at night relative to the rural region. The model deficiency in representing the relative difference in the diurnal variation in near-surface variables is speculated to be due to 1) the errors in the mechanism of radiated heating on natural and artificial underlying surfaces and 2) the failure to accurately represent the urban cooling rate due to the lack of an urban-canopy model, since the utilization of the urban-canopy model modulates the nighttime cooling of urban areas, thus helping to reproduce the diurnal maximum of the UHI intensity during nighttime (Palou and Mahalov 2019). Among all the evaluated PBL schemes, only the MRF can reproduce a distinguishable, significant UHI effect at midnight that occurs in phase with the observation, especially on the weak-UHI days, with overestimation relative to the observation (Figures 8C,D).
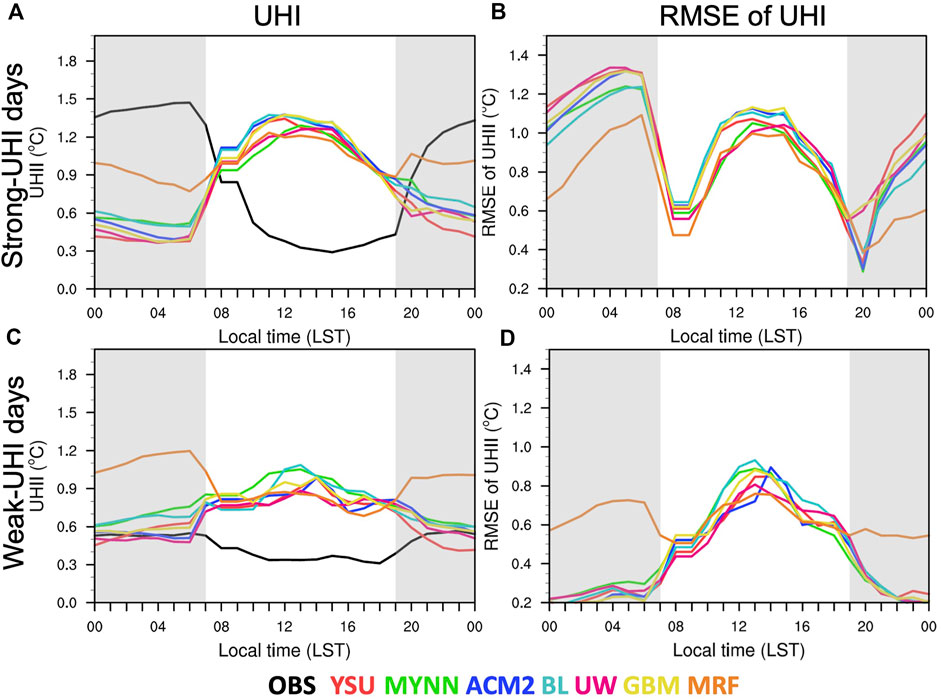
FIGURE 8. (A) Comparisons of the observed and simulated diurnal variations in the domain-averaged UHI on strong-UHI days and (B) the corresponding root mean square error of the model. (C,D) and are similar to (A,B) but on weak-UHI days. The gray zones denote the nocturnal time window from 1900 LST to 0700 LST.
One possible cause of the T2 differences among the evaluated PBL schemes is the difference in the surface energy. The surface energy balance on strong- and weak-UHI days are examined, as shown in Figure 9, for comparison with Figure 7. The surface energy balance equation is given as follows (Miao et al., 2012):
where
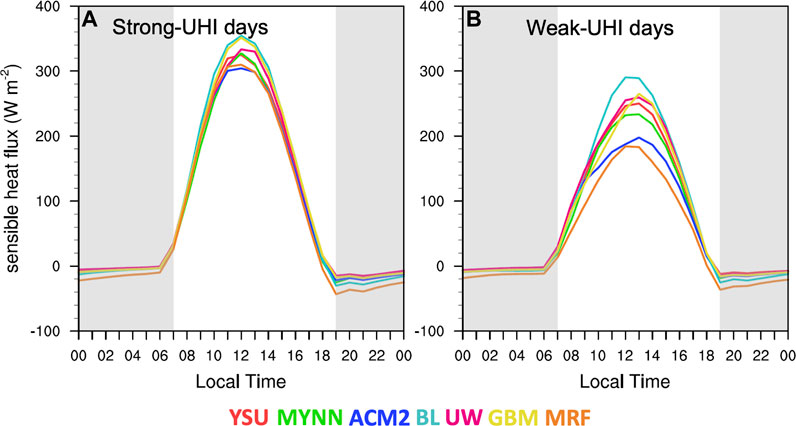
FIGURE 9. (A) Comparisons of the PBL schemes on the composite domain-averaged sensible heat flux over the urban region on strong-UHI days, (B) is similar to (A) but on weak-UHI days. The gray zones denote the nocturnal time window from 1900 LST to 0700 LST.
The above heat fluxes affect the heat, moisture and momentum exchanges through thermal and dynamic actions in the boundary layer. As the urban region of the GBA primarily consists of concrete, the net radiation flux variations are mainly contributed by the sensible heat flux. Therefore, the diurnal variations in the seasonal sensible heat flux on strong- and weak-UHI days are examined to further investigate their relationship to the urban temperatures (Figure 9). Generally, the daytime sensible heat flux on the strong-UHI days is larger than that on the weak-UHI days (Figure 9), corresponding to the cooler daytime T2 on weak-UHI days (Figures 7C,E), suggesting that the T2 variations are attributed to the sensible heat flux. The maximum sensible heat flux over the urban region among the seven PBL schemes appears at noon (∼1300 LST; Figure 9), an hour before T2 reaches its diurnal peak. The relatively higher daytimeT2 of BL, YSU and UW are closely associated with the higher sensible heat flux, especially on the weak-UHI days (Figure 7E, 9B). At nighttime, the different performance of nocturnal T2 is more related to the model’s preservation mechanism of the urban/rural heat. Collectively, the comparisons of the sensible heat fluxes suggest that the differences in performance among different parameterization schemes on daytime temperature likely arise directly within differences in the energy budget, while the difference in the nocturnal temperature can be partially explained by external feedback mechanisms, such as changes in cloud cover (Hu et al., 2010).
Composite profiles of the simulations are produced for the early summer rainy season in 2018 based on the sounding station over the rural region north of the GBA (Figure 1C). Figure 10 shows the observed and simulated mean profiles of temperature at 0700 and 1900 LST on weak- and strong-UHI days. Simulations predict lower temperatures than observations in the lower troposphere in the morning, implying some source of error common to all model runs, such as incorrect urban land surface characteristics (Figures 10B,D). Owing to the overestimation during daytime and underestimation during nighttime, the underestimation of vertical profiles of temperature is even worse in the early morning than in early evening (Figure 10), when solar heating is absent. The vertical profiles of temperature for each PBL scheme are comparable on strong-UHI days, which is consistent with the results of T2 (Figures 10A–D). It is worth to note that the all PBL schemes fail to reproduce the near-surface temperature inversion only on strong-UHI days. On these days, low-level meteorological conditions are relatively stable featured by higher surface pressure (Figure 5A). Such a failure could be attributed to the model’s deficiency to represent of the extent of radiative cooling in the clear sky that mostly occur during the higher surface pressure condition. On weak-UHI days, the temperature profiles are distinguishable, especially after intense solar heating at 1900 LST (Figures 10C,D). The nonlocal schemes (i.e., YSU and AMC2) with stronger vertical mixing do not always lead to a warmer PBL, as suggested in Hu et al. (2010). Instead, the ACM2 shows the coolest PBL at 1900 LST and the warmest PBL at 0700 LST. This result is closely related to the different responses of PBL schemes to heat transport to entrain warmer air into the PBL under unstable conditions due to solar heating and stable nocturnal conditions. The local scheme of UW shows a warmer PBL at 1900 LST. Nevertheless, the simulated temperatures are lower than the observations.
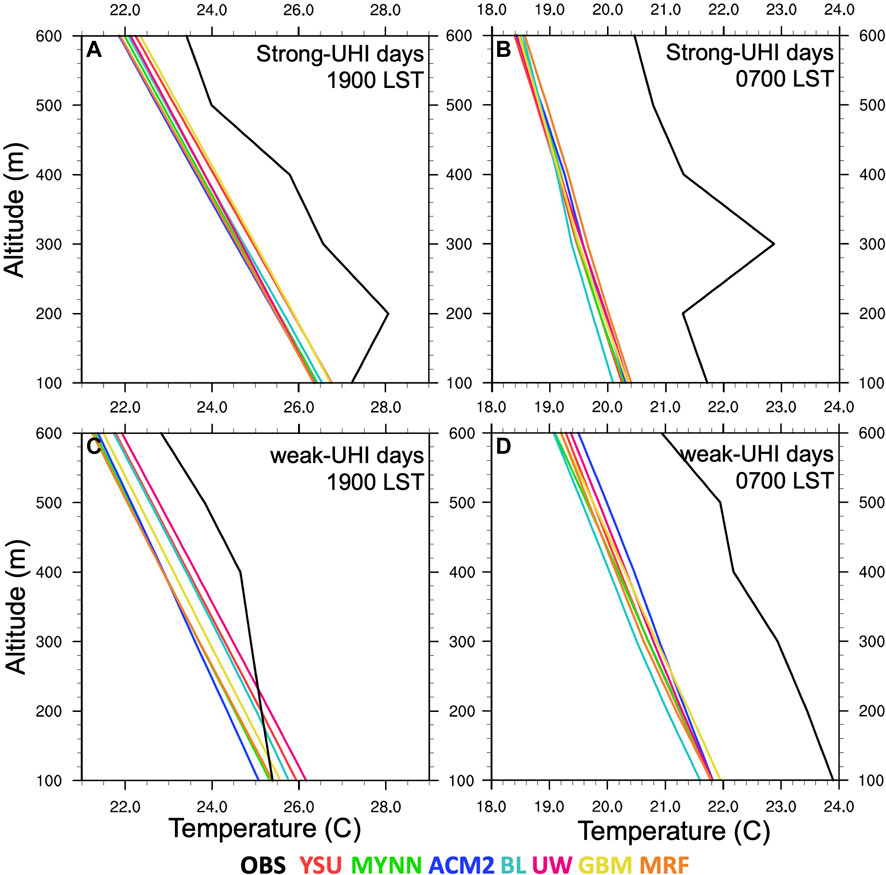
FIGURE 10. (A) Comparisons of the lower-level vertical profiles for the observed and simulated surface air temperatures at the Qingyuan station (Figure 1C) on strong-UHI days at 1900 LST. (B) is similar to (A) but at 0700 LST. (C,D) are similar to (A,B) but on weak-UHI days.
The other error source of the thermodynamic forecast within the boundary layer is the entrainment process near the top of PBL. The air entrained near the PBL top has a higher potential temperature but less moisture than that in lower PBL, leading to a tendency of stabilization. Consequently, the vertical structure of the temperature would be regulated by errors in entrainment, which is closely related to the PBL height (PBLH; Hu et al., 2010). Local and nonlocal schemes compute PBLH differently. The PBLHs of the local schemes are primarily based on total kinetic energy (TKE) predictions, while those of the nonlocal schemes are computed by empirical formulas considering wind speed, vertical gradients of vertical potential temperature, and the critical Richardson number (Stensrud, 2007). Given the different approaches to obtain PBLH in local and nonlocal schemes, this study used a consistent method to determine PBLH for the different PBL parameterization schemes and radiosondes (Coniglio, 2012). Specifically, the PBLH is defined as the first level above which the virtual temperature was 0.6 K greater than the peak virtual potential temperature in the lowest three levels. The same method is also used by the developers of Rapid Update Cycle (Benjamin et al., 2004).
The observed and simulated PBLHs obtained by the abovementioned definition are compared (Figure 11). The higher daytime PBLHs on the strong-UHI days than on the weak-UHI days may be 1) due to the higher sensible heat flux (Figure 9, 11), which is demonstrated by Dang et al. (2016), who found a strong positive correlation between surface sensible heat fluxes and PBLH, and 2) higher surface temperature that is found to be positively correlated with PBLH (Xi et al., 2022; Figure 5A). The models underestimate the early morning PBLH and overestimate the early evening PBLH on both strong/weak UHI days, with those on strong UHI days showing larger biases (Figure 11). The underestimation/overestimation of the PBLH may be partly due to the inappropriate vertical heat flux representation, which might be associated with different calculations of the sensible heat flux. Specifically, the local BL scheme shows the highest daytime sensible heat flux among the schemes, corresponding to the highest daytime PBLH and the highest daytime T2. The lower PBLHs and near-surface temperatures of ACM2 and MYNN in the afternoon correspond to their lowest sensible heat flux among all schemes (Figure 7E, 9, 11B). Such results imply that the sensible heat flux plays a key role in the performance of the model at the local scale.
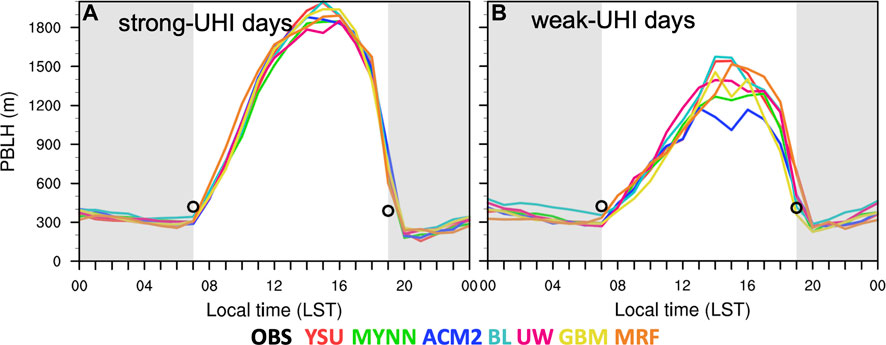
FIGURE 11. Comparisons of the observed (black circle) and simulated (colored lines) PBL heights at Qingyuan station (Figure 1C) on (A) strong-UHI days and (B) weak-UHI days.
Moisture condition is another important perspective that characterizes the difference between the urban and rural environments. Figure 12 shows the diurnal variations in the relative humidity (RH) over the urban region and the urban‒rural contrast (urban minus rural). Similar to T2, the observed diurnal amplitude of RH over the urban region is larger on strong-UHI days than on weak-UHI days, which is also well captured by the model (Figures 7C,E, 12A,B), suggesting that the model is also able to distinguish among the observed moisture condition differences on strong-/weak-UHI days. Different from the UHI, the observed RH difference between urban and rural areas shows less diurnal variation under both scenarios. However, the model still presents a large diurnal amplitude (Figures 12C,D), implying that the model has difficulties in reproducing the urban‒rural contrast of moisture conditions, which may be due to the simplicity of the model in representing the urban and rural underlying surface that leads to the bias in latent heating and sensible heating processes. The abovementioned features are shown in most of the PBL schemes except for the MRF, which presents better nocturnal RH over the urban region and better urban‒rural contrast, especially on weak-UHI days.
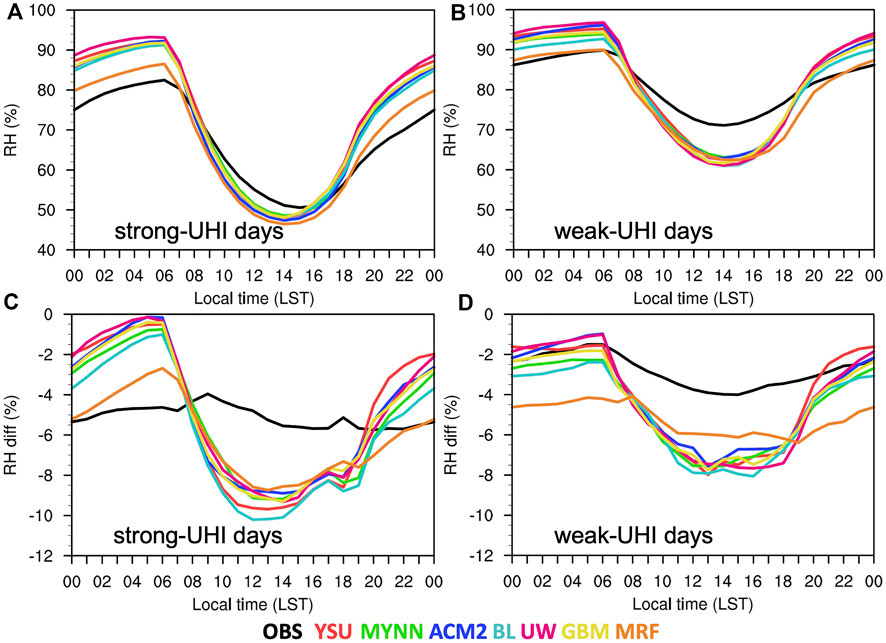
FIGURE 12. (A) Comparisons of the PBL schemes on the composite domain-averaged near-surface relative humidity over the urban region on strong-UHI days and (C) the corresponding relative humidity difference between urban and rural areas (urban minus rural). (B,D) are similar to (A,C) but on weak-UHI days.
A comparison of recent studies that evaluated multiple PBL schemes has been conducted to discuss the applicability of these schemes to different climate zones. A survey of 12 published papers that focus on the impacts of PBL schemes on surface air temperature in North America, Europe and Asia were conducted. The overestimation or underestimation of surface air temperature is mostly dependent on the seasonal weather and regional climate in the region of interest. Specifically, the models usually show a cool bias on all days during warm seasons over North America and Europe (e.g., Kleczek et al., 2014; Banks and Baldasano, 2016; Avolio et al., 2017) but a warm bias during cold seasons (Shin and Hong 2011; Gunwani and Mohan, 2017). For Asia, which is influenced by monsoonal flows, the model shows that the diurnal variation in bias is dependent on the geographical situation. A cold bias during nighttime and a warm bias during daytime are noticed over humid coastal regions (Xie et al., 2012; Hariprasad et al., 2014), which is also suggested by the current study. On the other hand, there is a cold bias during the daytime and a warm bias during the nighttime for inland arid regions (Xu et al., 2019; Wang et al., 2021). The performance of the PBL schemes is less variational. Nine out of twelve published papers suggested that the nonlocal schemes (i.e., YSU and ACM2) were the closest schemes to the observations in most climate zones. BL was the best scheme for the regions over the junction of humid and arid regions (Xu et al., 2019). For the current study, the performance of the PBL schemes in simulating the near-surface temperature mostly resembles that of Xie et al. (2012), with BL overestimated the most and a reasonable performance by the ACM2. These results indicate that the selection of the PBL scheme for any study can be based on the diurnal cycle of the meteorological parameter or climatic zone where the area under consideration resides. Further understanding the adaptability of PBL schemes is a necessary step before improving them in the future.
Urbanization of large cities exerts significant changes in surface air temperature that can lead to inadvertent local weather and regional climate changes. As the first step to improve the forecasting for the urban environment, this study evaluates the performances of multiple PBL schemes in reproducing the lower-troposphere thermodynamic environments over the Greater Bay Area in South China. Seven PBL schemes, including three nonlocal (YSU, ACM2 and MRF) and four local (MYNN, GBM, UW and BL) schemes, are evaluated. Biases of meteorological variables vary with PBL schemes when different metrics are assessed while there are also several common characteristics, such as higher daytime and lower nighttime surface air temperature in urban regions compared to the observations. The results in this study can be used as a basis for PBL scheme selection for simulations in similar regions or under similar climate conditions.
To evaluate the performances of PBL schemes in different thermodynamic scenarios, the period from April to June in 2018 is first categorized into strong UHI days and weak UHI days. The performance of near-surface temperature and vertical temperature profiles, UHI intensity, PBL structure, and humidity are then evaluated from seasonal and diurnal perspectives. Our conclusions are described as follows.
1) The seasonal simulations show a systematic bias in reproducing the low-level thermodynamic features and PBL structure over the urban and surrounding rural regions. Cool and moist biases during nighttime and warm and dry biases in the day are identified. Except for the MRF, other PBL schemes exhibit antiphase structures for the diurnal variation in the UHI intensity relative to those in the observation. Such antiphase structure could be modified by utilizing the land-surface model that accompanied by the urban canopy model, which describes the canopy trapping by the cities so the residual heat can be preserved (Oke et al., 2017). The nocturnal surface temperature over the city is therefore higher than the simulation without urban canopy model. The modeled PBL heights show an underestimation in the early morning and overestimation in the early evening. This underestimation/overestimation is closely associated with the sensible heat flux diagnosed by different PBL schemes. The higher the sensible heat flux is, the higher the near-surface temperature and PBL height are.
2) The model errors associated with PBL schemes are dependent on the diurnal cycles and thermodynamic conditions, as well as the geographical location that affects the moisture condition and the energy budget. Specifically, the MYNN performs best for the daytime near-surface temperature, while the MRF shows the lowest RMSE of T2 during nighttime, especially on the strong-UHI days. MRF also shows the best performance in simulating the observed urban heat island, with a similar pattern of diurnal variation, while the rest of the schemes are antiphase with respect to the observation. The nonlocal schemes with strong vertical mixing do not always lead to a warmer PBL, as suggested in previous studies, as indicated by the local UW showing higher vertical temperatures from a seasonal perspective. These issues must be considered in model configuration selection, parametrization scheme improvement, and bias correction for modeling studies.
Although there may not be a one-size-fits-all approach to the selection of a “best” PBL scheme, the current study aims to improve our understanding of the relative representation of multiple PBL schemes in severe weather modeling over the urban agglomeration in the Greater Bay Area. Further research is ongoing to expand and generalize the results by a wide array of cases.
Publicly available datasets were analyzed in this study. This data can be found here: https://rda.ucar.edu/datasets/ds083.3/, http://data.cma.cn/data/online.html?t51.
LH: drafts the work, formal analysis, visualization LB: supervision, review and editing.
This study was supported by the National Natural Science Foundation of China (41805035, 41905043 and 42030610) and Guangdong Basic and Applied Basic Research Foundation (2021A1515011647 and 2022A1515011288).
The authors declare that the research was conducted in the absence of any commercial or financial relationships that could be construed as a potential conflict of interest.
All claims expressed in this article are solely those of the authors and do not necessarily represent those of their affiliated organizations, or those of the publisher, the editors and the reviewers. Any product that may be evaluated in this article, or claim that may be made by its manufacturer, is not guaranteed or endorsed by the publisher.
Ashley, W., Strader, S., Rosencrants, T., and Krmenec, A. (2014). Spatiotemporal changes in tornado hazard exposure: The case of the expanding bull’s-eye effect in chicago, Illinois. Weather, Clim. Soc. 6, 175–193. doi:10.1175/wcas-d-13-00047.1
Avolio, E., Federico, S., Miglietta, M., Lo Feudo, T., Calidonna, C., and Sempreviva, A. (2017). Sensitivity analysis of WRF model PBL schemes in simulating boundary layer variables in southern Italy: An experimental campaign. Atmos. Res. 192, 58–71. doi:10.1016/j.atmosres.2017.04.003
Banks, R., and Baldasano, J. M. (2016). Impact of WRF model PBL schemes on air quality simulations over Catalonia, Spain. Sci. Total Environ. 572, 98–113. doi:10.1016/j.scitotenv.2016.07.167
Barlage, M., Miao, S., and Chen, F. (2016). Impact of physics parameterizations on high-resolution weather prediction over two Chinese megacities. J. Geophys. Res. Atmos. 121, 4487–4498. doi:10.1002/2015jd024450
Benjamin, S., Devenyi, D., Weygandt, S., Brundage, K. J., Brown, J. M., Grell, G. A., et al. (2004). An hourly assimilation– forecast cycle: The RUC. Mon. Weather Rev. 132, 495–518. doi:10.1175/1520-0493(2004)132<0495:ahactr>2.0.co;2
Borge, R., Alexandrov, V., Vas, J., Lumbreras, J., and Rodriguez, E. (2008). A comprehensive sensitivity analysis of the WRF model for air quality applications over the Iberian Peninsula. Atmos. Environ. 42, 8560–8574. doi:10.1016/j.atmosenv.2008.08.032
Bougeault, P., and Lacarrere, P. (1989). Parameterization of orography-induced turbulence in a mesobeta-scale model. Mon. Weather Rev. 117, 1872–1890. doi:10.1175/1520-0493(1989)117<1872:pooiti>2.0.co;2
Bretherton, C., and Sungsu, P. (2009). A new moist turbulence parameterization in the community atmosphere model. J. Clim. 22, 3422–3448. doi:10.1175/2008jcli2556.1
Chaouch, N., Temimi, M., Weston, M., and Ghedira, H. (2017). Sensitivity of the meteorological model WRF-ARW to planetary boundary layer schemes during fog conditions in a coastal arid region. Atmos. Res. 187, 106–127. doi:10.1016/j.atmosres.2016.12.009
Ching, J., Rotunno, R., LeMone, M., Martilli, A., Kosovic, B., Jimenez, P. A., et al. (2014). Convectively induced secondary circulations in fine-grid mesoscale numerical weather prediction models. Mon. Weather Rev. 142, 3284–3302. doi:10.1175/mwr-d-13-00318.1
Cohen, A., Cavallo, S., Coniglio, C., and Brooks, H. (2015). A review of planetary boundary layer parameterization schemes and their sensitivity in simulating southeastern U.S. cold season severe weather environments. Weather Forecast. 30, 591–612. doi:10.1175/waf-d-14-00105.1
Coniglio, M. (2012). Verification of RUC 0–1-h forecasts and SPC mesoscale analyses using VORTEX2 soundings. Weather Forecast. 27, 667–683. doi:10.1175/waf-d-11-00096.1
Dang, R., Li, H., Liu, Z., and Yang, Y. (2016). Statistical analysis of relationship between daytime lidar-derived planetary boundary layer height and relevant atmospheric variables in the semiarid region in Northwest China. Adv. Meteorology 2016, 1–13. doi:10.1155/2016/5375918
Doan, Q., Dipankar, A., Simόn-Moral, A., Sanchez, C., Prasanna, V., Roth, M., et al. (2021). Urban-induced modifications to the diurnal cycle of rainfall over a tropical city. Q. J. R. Meteorol. Soc. 147, 1189–1201. doi:10.1002/qj.3966
Dzebre, D., and Adaramola, M. (2020). A preliminary sensitivity study of Planetary Boundary Layer parameterisation schemes in the weather research and forecasting model to surface winds in coastal Ghana. Renew. Energy 146, 66–86. doi:10.1016/j.renene.2019.06.133
Ferrero, E., Alessandrini, S., and Vandenberghe, F. (2018). Assessment of planetary-boundary-layer schemes in the weather research and forecasting model within and above an urban canopy layer. Bound. Layer. Meteorol. 168, 289–319. doi:10.1007/s10546-018-0349-3
Garcia-Diez, M., Fernandex, J., Fita, L., and Yague, C. (2011). Seasonal dependence of WRF model biases and sensitivity to PBL schemes over Europe. Q. J. R. Meteorological Soc. 00, 2–21. doi:10.1002/qj.1976
Grenier, H., and Bretherton, C. (2001). A moist PBL parameterization for large-scale models and its application to subtropical cloud-topped marine boundary layers. Mon. Weather Rev. 129, 357–377. doi:10.1175/1520-0493(2001)129<0357:amppfl>2.0.co;2
Gunwani, P., and Mohan, M. (2017). Sensitivity of WRF model estimates to various PBL parameterizations in different climatic zones over India. Atmos. Res. 194, 43–65. doi:10.1016/j.atmosres.2017.04.026
Hacker, J. (2010). Spatial and temporal scales of boundary layer wind predictability in response to small-amplitude land surface uncertainty. J. Atmos. Sci. 67, 217–233. doi:10.1175/2009jas3162.1
Hallegatte, S., Green, C., Nicholls, R., and Corfee-Morlot, J. (2013). Future flood losses in major coastal cities. Nat. Clim. Chang. 3, 802–806. doi:10.1038/nclimate1979
Hariprasad, K., Srinivas, C., Singh, A., Vijaya Bhaskara Rao, S., Baskaran, R., and Venkatraman, B. (2014). Numerical simulation and intercomparison of boundary layer structure with different PBL schemes in WRF using experimental observations at a tropical site. Atmos. Res. 145, 27–44. doi:10.1016/j.atmosres.2014.03.023
Hong, S., Noh, Y., and Dudhia, J. (2006). A new vertical diffusion package with an explicit treatment of entrainment processes. Mon. Weather Rev. 134, 2318–2341. doi:10.1175/mwr3199.1
Hong, S., and Pan, H. (1996). Nonlocal boundary layer vertical diffusion in a medium-range forecast model. Mon. Weather Rev. 124, 2322–2339. doi:10.1175/1520-0493(1996)124<2322:nblvdi>2.0.co;2
Hu, X., Nielsen-Gammon, J., and Zhang, F. (2010). Evaluation of three planetary boundary layer schemes in the WRF Model. J. Appl. Meteorology Climatol. 49, 1831–1844. doi:10.1175/2010jamc2432.1
Huang, L., Luo, Y., and Bai, L. (2022). An evaluation of convection-permitting ensemble simulations of coastal nocturnal rainfall over SouthSouth China during the early-summer rainy season. JGR. Atmos. 127, e2021JD035656. doi:10.1029/2021jd035656
Huang, L. (2020). Sensitivity analysis of ensemble simulations on a torrential rainfall case over SouthSouth China using multiple PBL and SL parameterizations. J. Trop. Meteorology 26, 208–222. doi:10.16555/j.1006-8775.2020.019
Huang, M., Gao, Z., Miao, S., and Chen, F. (2019). Sensitivity of urban boundary layer simulation to urban canopy models and PBL schemes in Beijing. Meteorol. Atmos. Phys. 131, 1235–1248. doi:10.1007/s00703-018-0634-1
Huff, F., and Vogel, J. (1978). Urban, topographic, and diurnal effects on rainfall in the St. Louis region. J. Appl. Meteor. 17, 565–577. doi:10.1175/1520-0450(1978)017<0565:utadeo>2.0.co;2
Jankov, I., Gallus, W., Segal, M., Shaw, B., and Koch, S. E. (2005). The impact of different WRF Model physical parameterizations and their interactions on warm season MCS rainfall. Weather Forecast. 20, 1048–1060. doi:10.1175/waf888.1
Johns, R., and Doswell, C. (1992). Severe local storms forecasting. Weather Forecast. 7, 588–612. doi:10.1175/1520-0434(1992)007<0588:slsf>2.0.co;2
Kassomenos, P., and Katsoulis, B. (2006). Mesoscale and macroscale aspects of the morning urban heat island around Athens, Greece. Meteorol. Atmos. Phys. 94, 209–218. doi:10.1007/s00703-006-0191-x
Kleczek, M., Steeneveld, G., and Holtslag, A. (2014). Evaluation of the weather research and forecasting mesoscale model for GABLS3: impact of boundary-layer schemes, boundary conditions and spin-up. Bound. Layer. Meteorol. 152, 213–243. doi:10.1007/s10546-014-9925-3
Li, M., Luo, Y., Zhang, D., Chen, M., Wu, C., Yin, J., et al. (2021). Analysis of a record-breaking rainfall event associated with a monsoon coastal megacity of South China using multisource data. IEEE Trans. Geosci. Remote Sens. 59, 6404–6414. doi:10.1109/tgrs.2020.3029831
Li, T., Wang, H., Zhao, T., Xue, M., Wang, Y., Che, H., et al. (2016). The impacts of different PBL schemes on the simulation of PM2.5 during severe haze episodes in the jing-jin-ji region and its surroundings in China. Adv. Meteorology 2016, 1–15. doi:10.1155/2016/6295878
Li, W., Chen, S., Chen, G., Sha, W., Luo, C., Feng, Y., et al. (2011). Urbanization signatures in strong versus weak precipitation over the Pearl River Delta metropolitan regions of China. Environ. Res. Lett. 6, 049503. doi:10.1088/1748-9326/6/4/049503
Liu, M., and Chen, M. (2014). Evaluation of BJ-RUC system for the forecast quality of planetary boundary layer in Beijing Area (in Chinese). J. Appl. Meteorological Sci. 25, 212–221.
Martilli, A., Sanchez, B., Rasilla, D., Pappaccogli, G., Allende, F., Martin, F., et al. (2021). Simulating the meteorology during persistent Wintertime Thermal Inversions over urban areas. The case of Madrid. Atmos. Res. 263, 105789. doi:10.1016/j.atmosres.2021.105789
Miao, S., Dou, J., Chen, F., Li, J., and Li, A. (2012). Analysis of observations on the urban surface energy balance in Beijing. Sci. China Earth Sci. 55, 1881–1890. doi:10.1007/s11430-012-4411-6
Nakanishi, M., and Niino, H. (2004). An improved mellor–yamada level-3 model with condensation physics: Its design and verification. Bound. Layer. Meteorol. 112, 1–31. doi:10.1023/b:boun.0000020164.04146.98
Nielsen-Gammon, J., Hu, X., Zhang, F., and Pleim, J. (2010). Evaluation of planetary boundary layer scheme sensitivities for the purpose of parameter estimation. Mon. Weather Rev. 138, 3400–3417. doi:10.1175/2010mwr3292.1
Niyogi, D., Pyle, P., Lei, M., Arya, S. P., Kishtawal, C. M., Shepherd, M., et al. (2011). Urban modification of thunderstorms—an observational storm climatology and model case study for the indianapolis urban region. J. Appl. Meteorology Climatol. 50, 1129–1144. doi:10.1175/2010jamc1836.1
Oke, T., Mills, G., Christen, A., and Voogt, J. (2017). Urban climates. Cambridge, United Kingdom: Cambridge University Press, 546pp.
Oke, T. (1995). The heat island of the urban boundary layer: Characteristics, causes, and effects in: Wind climate in cities. New York, NY Norwell, MA London, UK: Kluwer Academic, 81–102.
Palou, F., and Mahalov, A. (2019). Summer- and wintertime variations of the surface and near-surface urban heat island in a semiarid environment. Weather Forecast. 34, 1849–1865. doi:10.1175/waf-d-19-0054.1
Pleim, J. (2007). A combined local and nonlocal closure model for the atmospheric boundary layer. Part I: Model description and testing. J. Appl. Meteorology Climatol. 46, 1383–1395. doi:10.1175/jam2539.1
Shin, H., and Hong, S. (2011). Intercomparison of planetary boundary-layer parameterizations in the WRF model for a single day from CASES-99. Bound. Layer. Meteorol. 139, 261–281. doi:10.1007/s10546-010-9583-z
Skamarock, W., Klemp, J., and Dudhia, J., (2008). A description of the Advanced Research WRF version 3. NCAR Tech., 113. Note TN-4751STR.
Stensrud, D. (2007). Parameterization schemes: Keys to understanding numerical weather prediction models. Cambridge, United Kingdom: Cambridge University Press, 459.
Sun, X., Luo, Y., Gao, X., Wu, M., Li, M., Huang, L., et al. (2021a). On the localized extreme rainfall over the Great Bay area in SouthSouth China with complex topography and strong UHI effects. Mon. Weather Rev. 149, 2777–2801. doi:10.1175/mwr-d-21-0004.1
Sun, Y., Zhang, N., Miao, S., and Kong, F. (2021b). Urban morphological parameters of the main cities in China and their application in the WRF model. J. Adv. Model. Earth Syst. 13, e2020MS002382. doi:10.1029/2020ms002382
Wang, C., and Ying, M. (2020). The uncertainty of tropical cyclone intensity and structure based on different parameterization schemes of planetary boundary layer. J. Trop. Meteorology 26, 377–389. doi:10.46267/j.1006-8775.2020.033
Wang, Y., Sayit, H., Mamtimin, A., Zhu, J., Zhou, C., Huo, W., et al. (2021). Evaluation of five planetary boundary layer schemes in WRF over China’s largest semi-fixed desert. Atmos. Res. 256, 105567. doi:10.1016/j.atmosres.2021.105567
Wu, M., Luo, Y., Chen, F., and Wong, W. (2019). Observed link of extreme hourly precipitation changes to urbanization over coastal South China. J. Appl. Meteorology Climatol. 58, 1799–1819. doi:10.1175/jamc-d-18-0284.1
Xi, X., Zhang, Y., Gao, Z., Yang, Y., Zhou, S., Duan, Z., et al. (2022). Diurnal climatology of correlations between the planetary boundary layer height and surface meteorological factors over the contiguous United States. Int. J. Climatol. 42, 5092–5110. doi:10.1002/joc.7521
Xie, B., Fung, J., Chan, A., and Lau, A. (2012). Evaluation of nonlocal and local planetary boundary layer schemes in the WRF model. J. Geophys. Res. 117, D12103. doi:10.1029/2011jd017080
Xu, L., Hui, H., Du, Q., and Xu, X. (2019). The assessment of the planetaryboundary layer schemes in WRF over the central Tibetan Plateau. Atmos. Res. 230, 104644. doi:10.1016/j.atmosres.2019.104644
Yin, J., Zhang, D., Luo, Y., and Ma, R. (2020). On the extreme rainfall event of 7 May 2017 over the coastal city of Guangzhou. Part I: Impacts of urbanization and orography. Mon. Weather Rev. 148, 955–979. doi:10.1175/mwr-d-19-0212.1
Zhang, D. (2020). Rapid urbanization and more extreme rainfall events. Sci. Bull. 65, 516–518. doi:10.1016/j.scib.2020.02.002
Keywords: urban heat island, urban agglomeration, PBL parameterization, surface thermal parameters, PBL structures
Citation: Huang L and Bai L (2023) Evaluation of planetary boundary layer schemes on the urban heat islands in the urban agglomeration over the greater bay area in South China. Front. Earth Sci. 10:1065074. doi: 10.3389/feart.2022.1065074
Received: 09 October 2022; Accepted: 14 November 2022;
Published: 10 January 2023.
Edited by:
Shenming Fu, Institute of Atmospheric Physics (CAS), ChinaReviewed by:
Xiaolan Li, CMA, ChinaCopyright © 2023 Huang and Bai. This is an open-access article distributed under the terms of the Creative Commons Attribution License (CC BY). The use, distribution or reproduction in other forums is permitted, provided the original author(s) and the copyright owner(s) are credited and that the original publication in this journal is cited, in accordance with accepted academic practice. No use, distribution or reproduction is permitted which does not comply with these terms.
*Correspondence: Lanqiang Bai, YmFpbGFucWlhbmdAZm94bWFpbC5jb20=
†ORCID: Ling Huang, orcid.org/0000-0001-8787-9414; Lanqiang Bai, orcid.org/0000-0002-0304-5656
Disclaimer: All claims expressed in this article are solely those of the authors and do not necessarily represent those of their affiliated organizations, or those of the publisher, the editors and the reviewers. Any product that may be evaluated in this article or claim that may be made by its manufacturer is not guaranteed or endorsed by the publisher.
Research integrity at Frontiers
Learn more about the work of our research integrity team to safeguard the quality of each article we publish.