 Perveiz Khalid
 Muhammd Irfan Ehsan1
 Irfan Ullah
 Qazi Adnan Ahmad
94% of researchers rate our articles as excellent or good
Learn more about the work of our research integrity team to safeguard the quality of each article we publish.
Find out more
ORIGINAL RESEARCH article
Front. Earth Sci. , 19 December 2022
Sec. Solid Earth Geophysics
Volume 10 - 2022 | https://doi.org/10.3389/feart.2022.1063877
This article is part of the Research Topic Unconventional Hydrocarbon Resources Evaluation Through Geological, Geophysical and AI View all 9 articles
The early Eocene carbonate reservoir, Sui Main Limestone (SML), is the largest gas reservoir in Pakistan. In the Qadirpur area, more than 30 wells have been drilled, some of which have been declared dry or abandoned due to poor reservoir characteristics or facies variation. The aim of this work is to re-evaluate the reservoir characteristics and facies identification of Sui Main Limestone by using petrophysical analysis and rock physics modeling in the Qadirpur field in the Middle Indus Basin of Pakistan. The reservoir characterization of carbonate rocks is difficult because of their complex pore networking. The well data on five exploratory wells drilled in this gas field are used. The log-derived porosity varies in a very large range of 2%–36%, with an average of 14%–34%. The average porosity of the clean carbonate intervals is 10%–14% and thus has the capacity to accumulate hydrocarbon. The high porosity value indicates the presence of micro-fractures in Sui Main Limestone. These micro-fractures and secondary pores are well interconnected and allow the pore fluids to communicate. The secondary porosity is mainly due to the presence of vuggs and fractures in Sui Main Limestone. The volume of shale varies from 11%–38% in the wells. The net pay zones have hydrocarbon saturation in the range of 40%–70%, which is mainly gas. Using wireline log response, the formation is divided into three facies: limestone, shale, and shaly limestone. This comprehensive work may help improve the prediction of the reservoir quality in heterogeneous carbonate reservoirs and optimize field development.
Of the sedimentary rocks, carbonate (limestone and dolomite) holds more than 50%–60% of the conventional oil and gas reservoirs in the sedimentary basins of the world (Rohel, 1985; Kargarpour, 2020; Bashir et al., 2021). However, predicting reservoir quality at an inter-well scale (Lai, 2019), identifying high-permeability zones with high porosity (Choquette and pray, 1970; Bohnsak, 2020), and preparing well-defined reservoir characteristics within petrophysical parameters (Nelson 2001; Lucia 2007) are among the major issues associated with carbonate reservoirs (Kelleys and Wallis 1991). Petrophysical analysis of carbonates is a challenging task: different techniques have been used to determine their petrophysical characteristics (Wang et al., 2016; Bashir et al., 2021; Salifou et al., 2021; Aboubacar et al., 2022). Porosity and permeability are the primary petrophysical parameters that define the reservoir characteristics of sedimentary rock. However, carbonates have a very heterogeneous porosity at various scales, ranging from micro-pores to large vuggs; this makes it difficult to construct petrophysical models (Hartmann and Beaumont, 1999; Lucia, 1999). Carbonate reservoirs have a multiple-porosity system (Lai, 2019) that is entirely different from sandstone reservoirs, and this has a heterogeneous impact on the petrophysical parameters of reservoirs (Wang et al., 2016; Muzzullo, 1992). Porosity and permeability are not directly interrelated in this heterogeneous and complex petrophysical environment (Westphal, 2005). The porosity and permeability of carbonate rocks largely depend on depositional structures and their environment (Garcia-Del-Cura, 2012; Khan et al., 2022).
Early Eocene Sui Main Limestone (SML) is a proven gas reservoir in Pakistan and is characterized by complex lithology and complicated pore systems (Khan et al., 2016; Siddiqui, 2016). These characteristics create interpretational problems for petrophysicists (Ahmed, 2017; Gu, 2017; Hussain, 2017; Senosy, 2020), thus making it difficult to develop production and field development strategies for reservoir and production engineers. Although geochemical analyses of reservoir rocks taken from the Indus Basin of Pakistan show that the major discoveries of oil and gas are from Cretaceous reservoirs, Sui Main Limestone, a basal formation of the Ghazij Group of the early Eocene, is the country's most prolific gas reservoir. The largest gas field in Pakistan, with more than 5 trillion cubic feet (TCF) of reserves, was discovered in 625-m-thick SML in Baluchistan in 1952 (Eaton, 1975); more than 20 TCF of recoverable reserves have been identified in 14 discoveries in the country (Khan et al., 2016; Siddique, 2016). Sui Main Limestone is widely distributed across various sedimentary basins in Pakistan, especially in the Indus and Baluchistan basins, which are gas-producing rock units along with Sui Upper Limestone. However, this important reservoir has no outcrop exposure in Pakistan. The second largest gas-producing carbonate rock in the country is Habib Rahi Limestone. SML in the study area, the Qadirpur gas field, (27°55′– 28°09′ N, 69°11′– 69°31′ E),falls in the Middle Indus Basin (Figure 1) and belong to a low-permeability carbonate reservoir with high microscopic heterogeneity. This is attributed to its depositional environments and the subsequent diagenetic modifications such as compaction, cementation, and dissolution, as well as various degrees of dolomitization (Siddique, 2016).
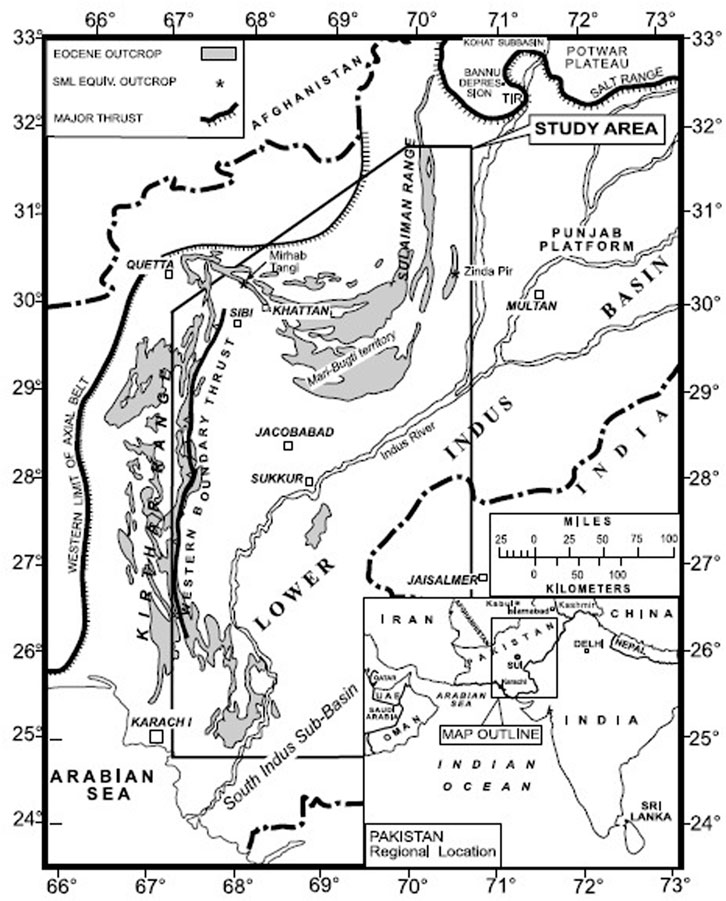
FIGURE 1. Location map of the study area in regional context along with major tectonic distribution of Pakistan (Siddiqui 2004).
The exploration and production history of the Middle Indus Basin started after the independence of Pakistan in 1947. The Qadirpur gas field has been extensively developed by different exploration and production companies (Shah, 2009). More than 30 wells have been drilled in this field, although the majority were drilled dry and declared abandoned due to low permeability and low inter-connected porosity. On the basis of wire-line log data from two wells, Ali et al. (2005) studied the reservoir potential of the sedimentary strata present in this area. In 2013, Jadoon et al. (2013) identified the hydrocarbon potential of Habib Rahi Limestone, which acts as a reservoir rock in the Mari gas field. Recently, Khan et al. (2016) performed a petrophysical study of the Eocene reservoir rock units in the Qadirpur area using wireline logs data. These studies marked different net pay zones in Habib Rahi Limestone and Sui Main Limestone. However, they did not identify different types of heterogeneity in the Eocene stratigraphic unit, so its reservoir characteristic is not well understood. No one has hence paid attention to the lithofacies classification of the largest carbonate reservoir in Pakistan; this study will cover this research gap. The results of this work will be helpful for understanding the heterogeneous behavior of SML in the Central Indus Basin. One of the objectives of this study is to identify and mark different lithofacies in this carbonate reservoir, which will be helpful in reducing the risk of drilling dry or abandoned wells. The seismic characteristic of SML on seismic reflection data is well established. As is clear from Figure 2 on the seismic section, the top of SML is the best markable horizon, with positive high amplitudes in the study area and in the Middle Indus Basin.
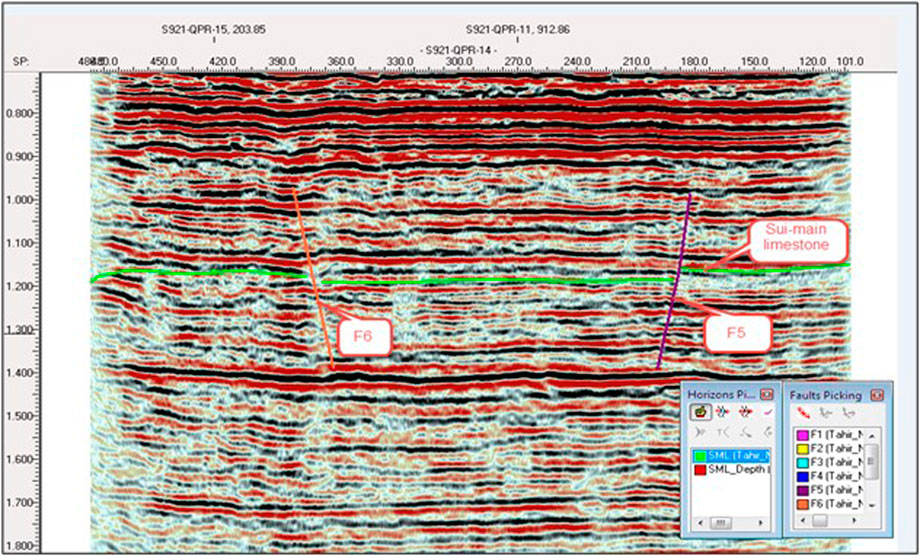
FIGURE 2. Interpreted 2D seismic time section. Sui Main Limestone is marked a reflector along with major faults.
The present study aims to recognize and describe the lithological heterogeneities and investigates the well-log response in the Eocene carbonate stratigraphic unit encountered in five sparsely drilled wells. Facies analysis is a powerful tool for predicting the depositional environment and settings of a formation; this aids in understanding its reservoir character and its petrophysical parameters. The facies is the observable attribute of a sedimentary rock that reflects the depositional environments (Deaton, 1983; Xuanjun, 2015; Baioumy, 2016; Khalid et al., 2020). The reservoir quality variation within the lithology was evaluated using facies modeling, including lateral and vertical facies variation in SML. This comprehensive work may help improve the prediction of the reservoir quality in heterogeneous carbonate reservoirs using well logs.
The geological and tectonic settings of Pakistan are very complex as the country is situated at the collision zone of the Indian and Eurasian plates. The greater Himalayan fold and thrust belt and the Suleiman fold and thrust belt originated after the subduction of the Indian plate beneath the Eurasian plate, beginning 65 m.y.a (Powell, 1973; Malik, 2003). According to Jadoon et al. (2013), the northwest Himalayan fold and thrust belt is formed by the Himalayan orogeny whereas the Suleiman fold and thrust belt is the result of a transpressional regime. The Salt Range and Trans-Indus Ranges occupy the extreme south of the Himalayan fold and thrust belt (Jume, 1973; Farid, 2018). As a result of this ongoing collision, a significant number of basins and valleys have been developed in Pakistan in association with foreland folds and thrust structures (Kazmi, 1997) clearly visible in the Salt Range, Potwar Plateau, and the Suleiman fold and thrust belt—depicted in Figure 1. Different geological blocks are sandwiched between these folds and thrusts, indicating major subdivisions in the collision zone (Tahirkheli, 1979; Yeats, 1984).
The Indus Basin of Pakistan is one of the largest basins developed under the action of the Himalayan orogeny. Based on its structural style, depositional settings, and rock types, this basin is divided into three parts: the Upper Indus Basin, Middle Indus Basin, and Lower Indus Basin (Figure 1). The whole basin is filled with a variety of sediments from Precambrian to recent ages deposited in various depositional cycles as depicted in Figure 3. The study area is situated at the southern margin of the Middle Indus Basin, where the Jacobabad and Mari-Khandkot Highs separate it from the Lower Indus Basin. These highs are the outcome of the Gondwana rifting that started in the Mesozoic era (Besse, 1988; Wandrey, 2004; Wasimuddin, 2005). The Indian Shield rocks formed the eastern boundary, whereas the axial belt formed the western boundary of the Middle Indus Basin. The geological structures and sedimentary strata above the basement rocks thin toward Khairpur-Jacobabad High. Middle Eocene Habib Rahi Limestone is well exposed in the eastern margin of the Khairpur-Jacobabad High, whereas the western flank of this anticlinal structure is covered by the alluvium of the Indus Plain (Raza, 1984). The study area comprises the northeastern flank of Khairpur-Jacobabad High and the east of Mari-Kandhkot High. Eastward-tilted normal-fault blocks, stratigraphic pinch-outs, and over-thrusted structures are the dominant geological features of the study area (Kazmi, 1979).
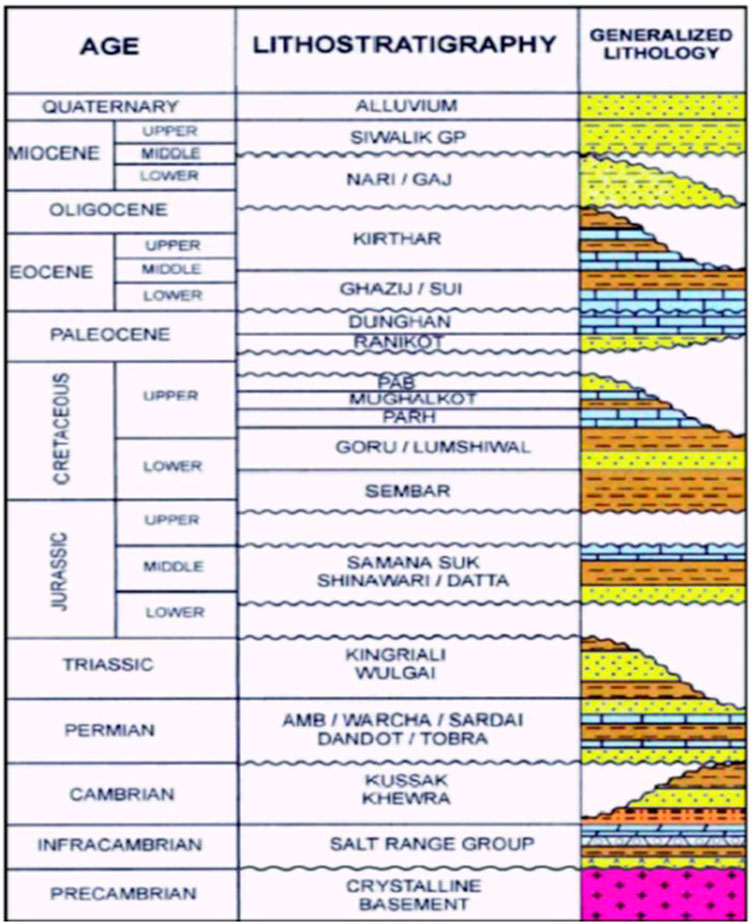
FIGURE 3. Generalized stratigraphic column of the Middle Indus Basin (after Kadri, 1995; Khalid et al., 2014).
In the Middle Indus Basin, sedimentary strata from the Cretaceous up to the Oligocene are present (Kadri, 1955). The rock units encountered in different wells and observed from seismic sections along with depositional gaps are presented in Figure 2. The oldest rocks are Precambrian, which are exposed in the southeastern side of Tharparkar. Previous data revealed that the thickness of the sediments increases in the westward of the Indus Plain whereas it thins out to the east. In foredeep area the sedimentary succession is of maximum thickness. Rocks belonging to the Tertiary Period are well developed and form the Kirthar and Laki Ranges, whereas the rest of Sindh Province is covered by alluvium of variable thickness, except in the Ganjo Takkar, Kot Diji, and Rohri areas, where Eocene limestone is well exposed. However, Ordovician, Silurian, Devonian, and Carboniferous rock is not present in the Middle Indus Basin, whereas Permian sediments composed of sandstone interbedded with shale and dolomite are encountered in some wells drilled in the area. The thickness of these sediments varies from 300–450 m. An angular unconformity separates the Permian from Triassic. However, Cretaceous to recent rocks are encountered in these wells. The SML is sandwiched in shales of Ghazij (upper lying) and Ranikot formations (lower lying). SML is normally uniform, brown-gray to creamy white, and features massive limestones, originating as a reef-bank type deposit. The source rocks in the Middle Indus basin are Mughalkot, Sembar, Ranikot, Ghazij, and Sirki shales. In some parts of the Indus Basin, Ghazij formation shales act as a cap rock for SML and Sui Upper Limestone, whereas Habib Rahi Limestone is capped by the Sirki shales (Kadri, 1955; Kazmi, 1997). The study area lies on the southern margin of the Middle Indus Basin which exhibits a transtensional regime; its structural geometry is strongly influenced by the Suleiman fold and thrust belt.
The use of wireline logs is common in petrophysical analysis and reservoir characterization (Khalid et al., 2015; Chatterjee, 2016; Ghazi et al., 2016; Das, 2017; Singha, 2017; Khalid et al., 2018). For petrophysical analysis and facies modeling, a complete suite of wireline logs, including self-potential, neutron porosity, bulk density, gamma ray, and deep and shallow resistivity, were run in five wells. Q-01, Q-03, Q-05, Q-12, and Q-15 were selected based on data quality, the spatial distribution of wells, and the log response. Preliminary processing of the data and calibration with geological information were performed before the interpretation of the wireline logs. Gamma-ray (GR) and spontaneous potential (SP) logs were used for the differentiation of various lithologies and shale content. Bulk density from the density log and photo-electric effects from the photo-electric log (PEF) were used to estimate lithology and facies in SML in all wells. Porosity is an important parameter in petrophysical analysis; in carbonate reservoirs, pore type is generally classified on the basis of time of deposition and porosity evolution (Das, 2017). The primary porosity in carbonates is substantially reduced by cementation and compaction during post-depositional diagenesis (Kazmi, 1997), so, in most carbonates, the existing porosity is the secondary porosity (Khalid, 2018). This is computed with the help of neutron, density, and sonic logs using the following equations (Wylin, 1956; Asquith, 1982; Carin, 1986; Rider, 1996).
where
The natural radioactive material in the formation is measured from the GR log, which is taken as a lithological log (Khalid et al., 2021). The volume of shale
The water and hydrocarbon saturation were computed from electrical resistivity logs with the help of the well-known Archie’s equation (Archie, 1942). This works well for shale and sandstones; however, using Archie’s equation for carbonate reservoirs is very tricky because of the presence of multiple porosity systems (Muzzulo, 1992). For limestone, the results of Archie’s equation depend largely on the value of its exponent m: the ratio of vuggy and moldic porosity to inter-particle pores (Ahr, 2008). In vuggy or moldic porosity reservoirs, the value of m is taken as 3 or 4, whereas in fractured reservoirs, its value is about 1.
The facies represent both horizontal and vertical variation in a particular lithology and are very helpful in sequence stratigraphic interpretations (Lau, 1990; Ngui, 2018). In the next step, facies modeling is performed using the log suits from well data, GR, density log (RHOB), and resistivity log (LLD). A plot of LLD vs. RHOB and GR log is used as the reference log, and maximum and minimum cut-off values are given against each log suit. The deep lateral resistivity log has possible non-lithologic effects such as variable saturation and change in water resistivity (Rw) because the resistivity log has a logarithmic response to formation and pore fluids. To overcome this problem, all resistivity readings are converted to log base-10 to produce a normal probability distribution of resistivity values for each facies.
The aforementioned methodology was applied to the wire-line logs that were run in the SML intervals encountered in the Q-01, Q-03, Q-05, Q-12, and Q-15 wells drilled in the study area. The results are divided into the following two parts.
The specific wireline log suits containing electrical LLD, SP, neutron porosity log (NPHI), RHOB, sonic log (DT), and GR log were used to quantify the presence of hydrocarbons in the Sui Main Limestone and assess the volume of shale and water saturation. The petrophysical parameters were plotted as eight tracks against depth in meters. GR, SP, and caliper logs were plotted in Track 2; porosity logs (density, sonic, and neutron) and PEF logs were plotted in Track 3 against depth, whereas all resistivity logs (LLS, LLD, and MSFL) were demonstrated in Track 4 and the resistivity of formation water (RW) was plotted in Track 5. The computed water saturation, porosity, and hydrocarbon saturation were plotted in Tracks 6 and 7, respectively. The lithology distribution of each depth level was plotted in the final track. Different input log parameters and the output petrophysical parameters of the Sui Main Limestone encountered in all wells studied are plotted in Figure 4 as a function of formation depth. A reservoir zone was considered a proven potential hydrocarbon zone if it has high LLD values, low GR and SP values, and high NPHI values in wells Q-01, Q-03, Q-05, Q-12, and Q-15. Based on high LLD values, overall low GR, SP, and DT values, and high NPHI values, the hydrocarbon-bearing zone is marked in each well. Hydrocarbon gas and brine were identified as pore fluids in the Sui Main Limestone reservoir interval. Based on the petrophysical parameter values, a 55-m thick (1330–1385 m) hydrocarbon-saturated limestone interval was identified in Q-01 (Figure 4A) with an average porosity of 0.22, shale volume of 15%, and hydrocarbon saturation of about 42%. The gamma-ray log shows low values with much less deflection; LLD has high values with positive deflection. Thus, the volume of shale is very low in this interval; therefore, this interval may be declared a clean carbonate interval saturated with hydrocarbon. A prolific gas-bearing zone starts about 1362–1410 m in Q-03 (Figure 4B) with an average porosity of 0.21, shale volume of 14%, and hydrocarbon saturation of about 46%. In Q-05, two hydrocarbon-bearing zones are marked at a depth above 1360 m and below 1385 m (Figure 4C) with a slightly higher volume of shale (∼36%), high porosity (∼0.33), and low hydrocarbon saturation (∼36%). The slightly higher GR values and higher volume of shale indicate that this is not a clean limestone. However, in well Q-12, hydrocarbon saturation is very low due to interbedded shale and clay Figure 4D. Here, the volume of shale is up to 26%, porosity is about 0.18, and hydrocarbon saturation is less than 35%. In Q-15, a thick hydrocarbon-bearing zone starts at a depth of 1730 m (Figure 4E) with a low volume of shale (∼23%), 20% porosity, and 40% hydrocarbon saturation. Since sonic log only measures matrix porosity and not vuggy, moldic, or fracture porosity, the vuggy porosity was computed by subtracting sonic porosity from total porosity, which is estimated from density or neutron log (Asquith, 1982). The overall porosity distribution of the Sui Main Limestone in the study area is shown in Figure 5A, which varies from 0.14 to 0.34. It is noted that porosity is high in the limestone encountered in all wells, which is fractured porosity produced by a brittle failure under the action of differential stresses. These stresses were produced under the action of local and regional tectonics. From the porosity map, it is clear that the porosity of the Sui Main Limestone is increased in the south and southwest, with a maximum value of 0.34 (34%) in the Q-05 well. This variation in porosity is due to the variation in magnitude and direction of the applied differential stresses which are towards the south and southwest. On its northern side, porosity values are lower due to fewer differential stresses. On this side, the fractured or vugg porosity seems to be lower or absent. The clay-mineral distribution map shows that the volume of shale in limestone varies from 0.11 to 0.38 (11%–38%) in the study area. The volume of shale is also higher in the south of the study area than in the north, as demonstrated in Figure 5B. This shows that, in the northern part of the study area, the limestone is cleaner than in the south, where the concentration of clay minerals is low. The shales are more porous than the limestones, so the high concentration of clay minerals can increase the effective porosity of the limestone. However, this contamination of shale content may decrease the permeability of the limestone and storage capacity of the net pay zone of the reservoir. The contours of shale volume are almost parallel to semi-parallel and follow an east–west trend. The average values of all petrophysical parameters of the Sui Main Limestone are presented in Table 1, which shows that it has good potential as a carbonate reservoir.
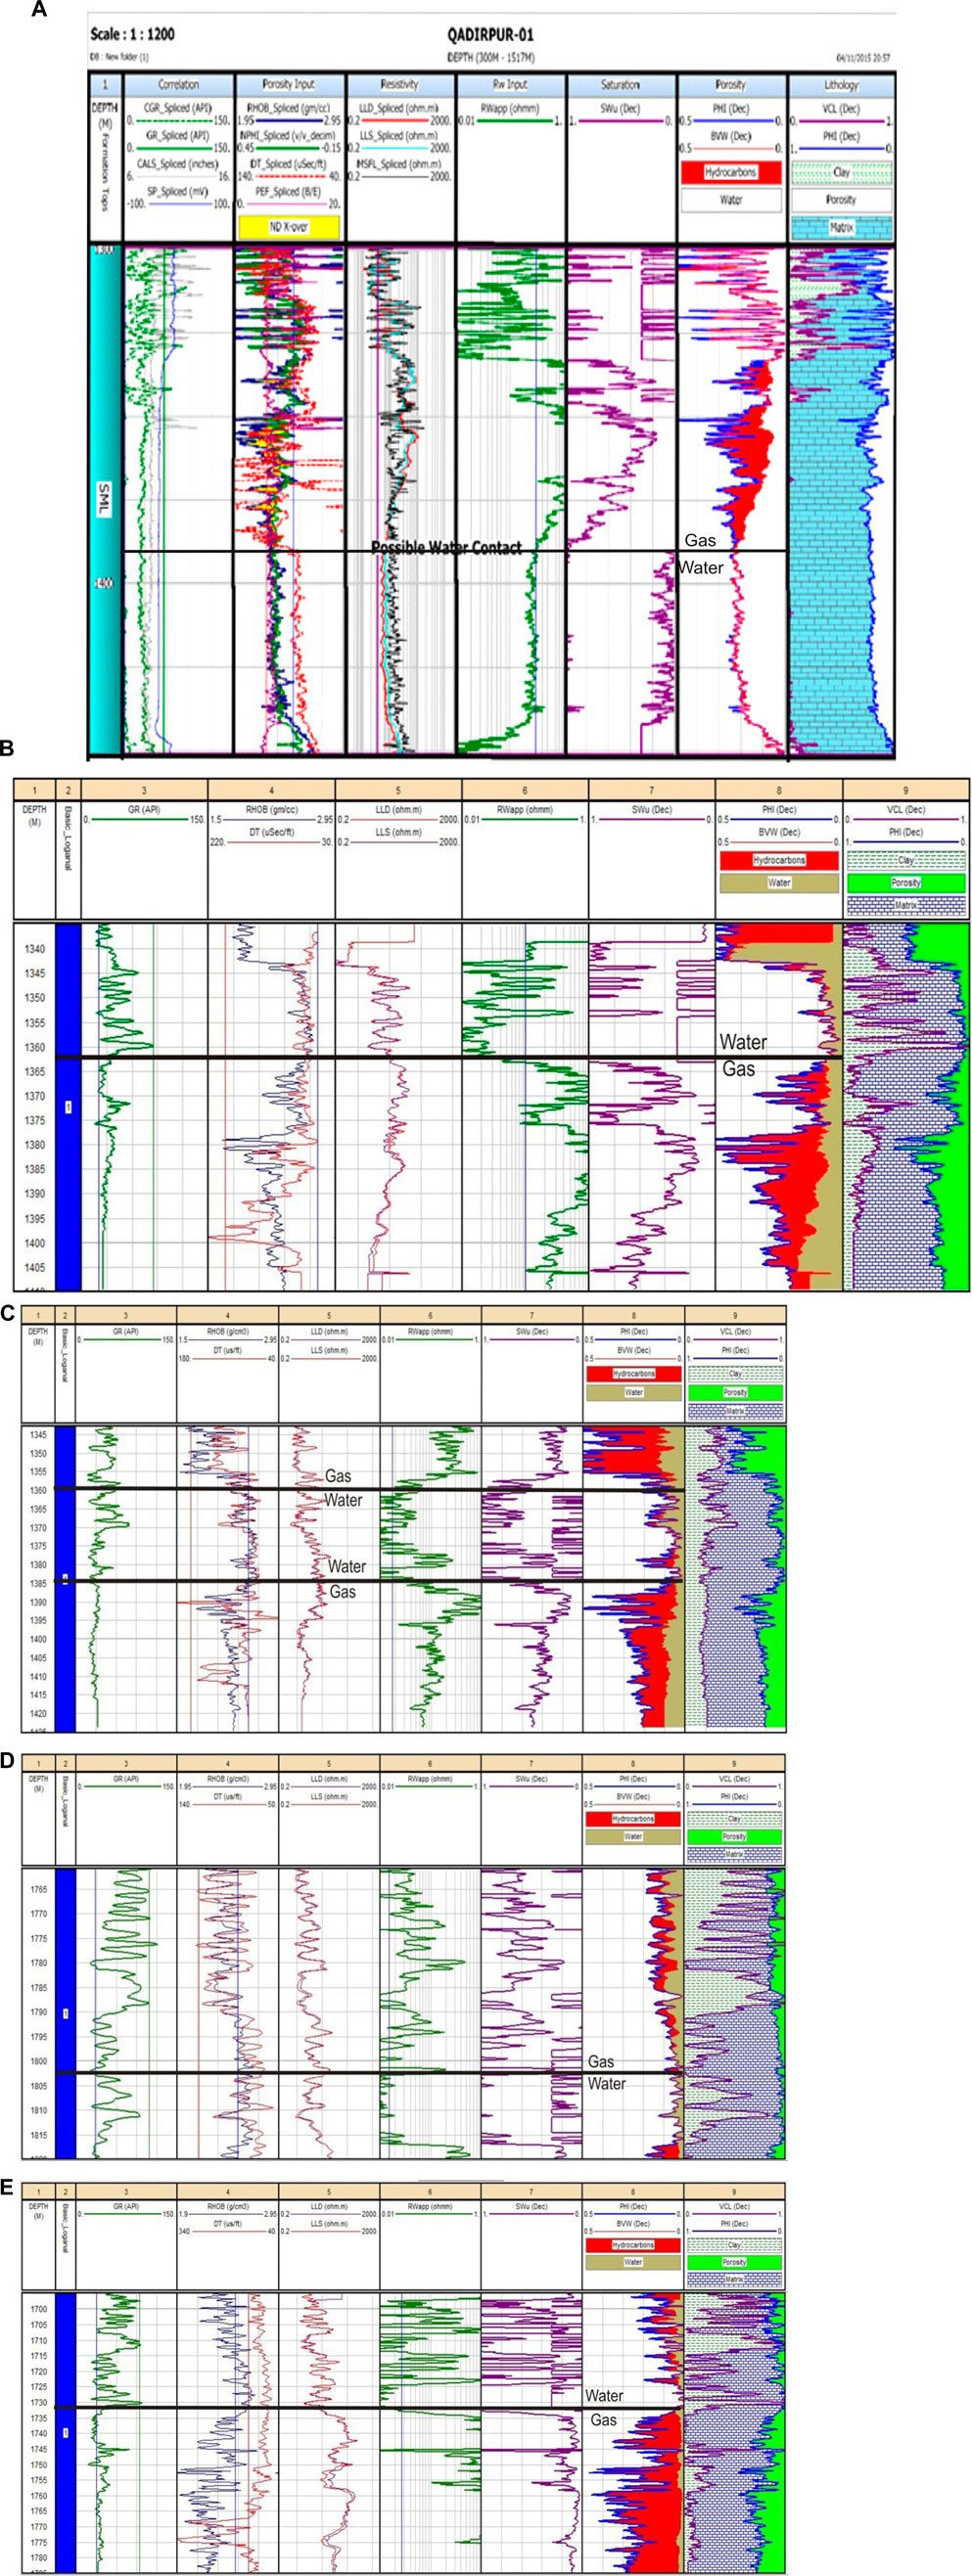
FIGURE 4. (A) Petrophysical analysis of the Sui Main Limestone encountered in well Q-01, (B) Petrophysical analysis of the Sui Main Limestone encountered in well Q-03, (C) Petrophysical analysis of the Sui Main Limestone encountered in well Q-05, (D) Petrophysical analysis of the Sui Main Limestone encountered in well-Q-12, (E) Petrophysical analysis of the Sui Main Limestone encountered in well -Q-15.
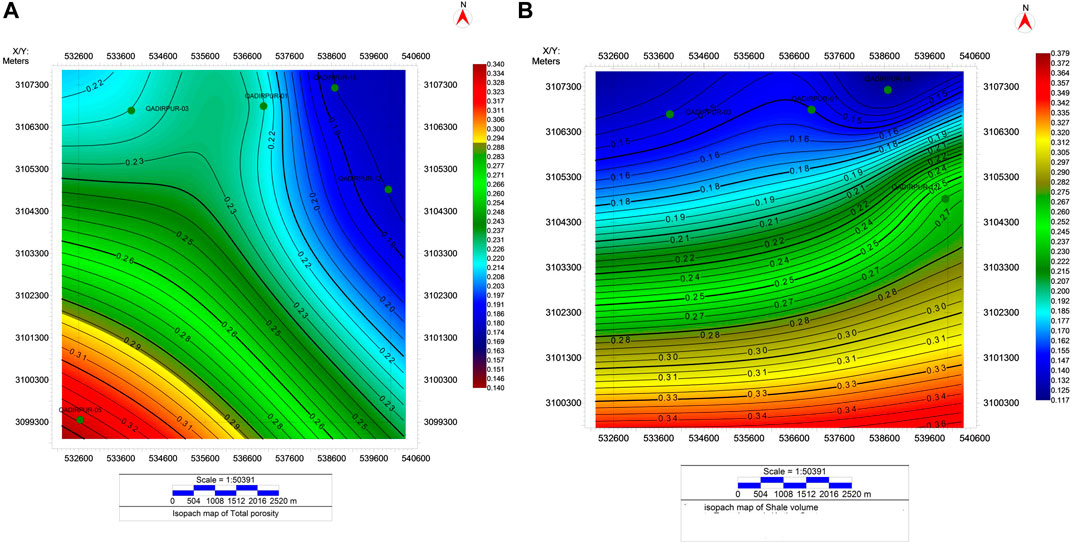
FIGURE 5. (A) Isopach map showing the total porosity distribution. (B) Volume of shale of Sui Main Limestone in the study area.
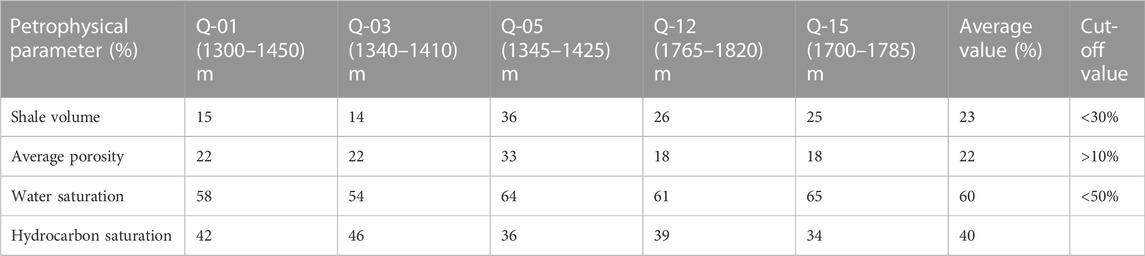
TABLE 1. Quantitative petrophysical interpretation of the Sui Main Limestone reservoir in the Q-01, Q-03, Q-05, Q-12 and Q-15 wells drilled in the study area.
It is important for reservoir characterization to identify different lithofacies present in the Sui Main Limestone. To identify lithological variations in this limestone reservoir, lithological cross-plots were prepared based on the bulk density and PEF logs run in all wells under investigation. These cross plots are presented in Figure 6 for each study well. Low-density and high-PEF log responses indicate shaly contents. For well Q-01, both log values are concentrated near the limestone trend line (Figure 6A) whereas the values for other wells are scattered from the limestone trend line to the dolomite trend line. SML encountered in Q-01 and Q-05 wells are dominantly limestone with minor argillaceous shaly contents (Figures 6A, C). A detailed mineralogical analysis is required to determine the concentration of clay minerals. As demonstrated in the figure, the calcite concentration is at a maximum in the majority of the depth intervals whereas, at some depth intervals, it is dolomitic in nature (Figures 6B, D, E). In these figures, the PEF log values are scattered versus the density log values. This lithological description is in accordance with Siddique et al. (2016).
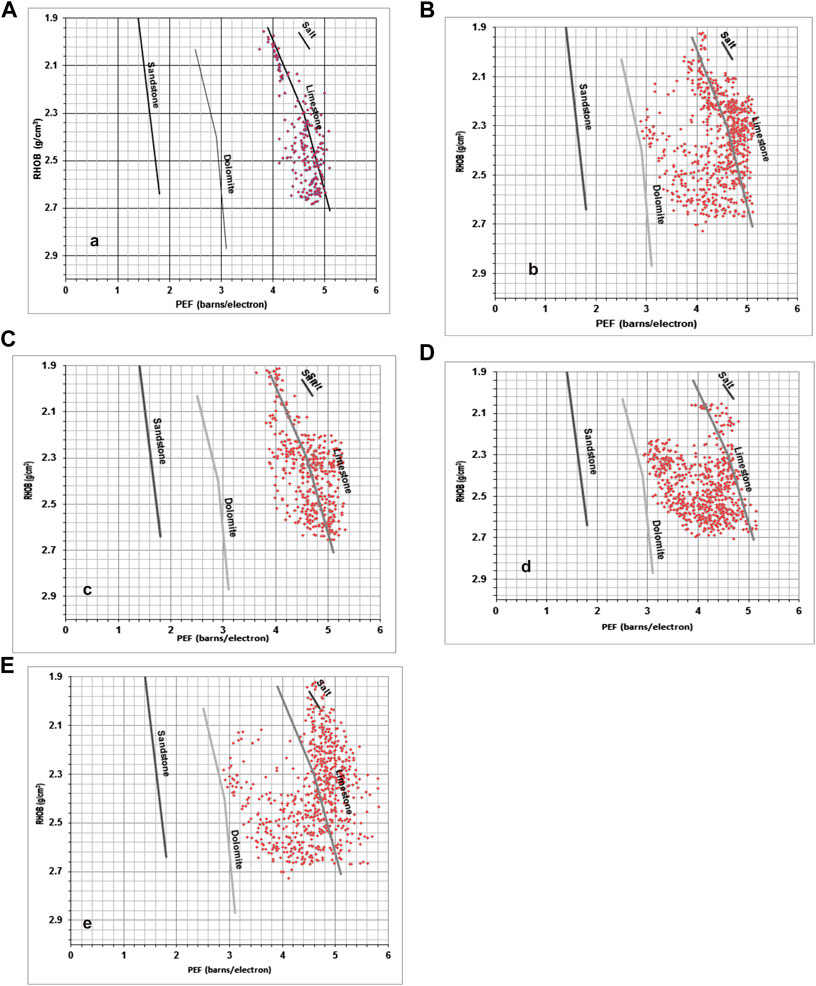
FIGURE 6. Cross plots between photoelectric absorption factor PeF log and bulk density log indicate major lithology in the Sui Main Limestone (A) for well Q-01, (B) well Q-03, (C) well Q-05, (D) well-Q-12, (E) well-Q-15.
GR, LLD, and RHOB logs were used to determine the facies in Sui Main Limestone encountered in all five wells. A high GR response indicates a high volume of shale, whereas a lower GR response represents some non-shaly clean carbonates or shaly carbonates if GR values are relatively high. Similarly, the density log gives high-density values for carbonate intervals but lower values in shale intervals. The high deflection in LLD (deep resistivity) indicates shale concentration, and a low value of LLD (deep resistivity) indicates limestone lithology. Intermediate values of all three logs against any lithology are interpreted as mixed lithology such as shaly limestone. The facies analysis of the Q-01, Q-03, Q-05, Q-12, and Q-15 wells is given in Figure 7, where the density log is cross-plotted against the deep resistivity log. Based on the log response of GR, resistivity, and density logs, the Sui Main Limestone is divided into three facies: clean limestone, shaly limestone, and shales. The low gamma-ray values in all wells show that the dominant lithology is limestone whereas, at some depth intervals, the results show that the values of GR log are assigned to shaly limestone or shale beds. The vertical and horizontal sequence of carbonate is not uniform. The upper 15–20 m interacts with argillaceous limestone with marls with very low porosity, whereas the lower portion is relatively porous with minor shale beds and a fairly uniform horizontal lithology. This lower portion contains fractures filled with calcite and asphaltic material. The shale contents increase toward the base of SML. The lateral and vertical variation in limestone/shale indicates variability in depositional environments and sedimentological conditions. The isopach maps presented in Figure 6 indicate different depo-centers of the sediments related to shallow-water shelf carbonates, which were precipitated on a depositional platform. In the early Eocene, there were rapid submersion and transgression in the northern side of the study area, and thick shales with minor beds of limestone were deposited in the middle to late Eocene. The thickness doubles toward the northeast of Sui. The high concentration of shales in the lower part of the Sui Main Limestone indicates a very restricted shallow lagoonal environment whereas the upper part is deposited in a shallow marine shoal carbonate environment. From Figures 5–7, a strong correlation between different facies encountered in these wells is evident.
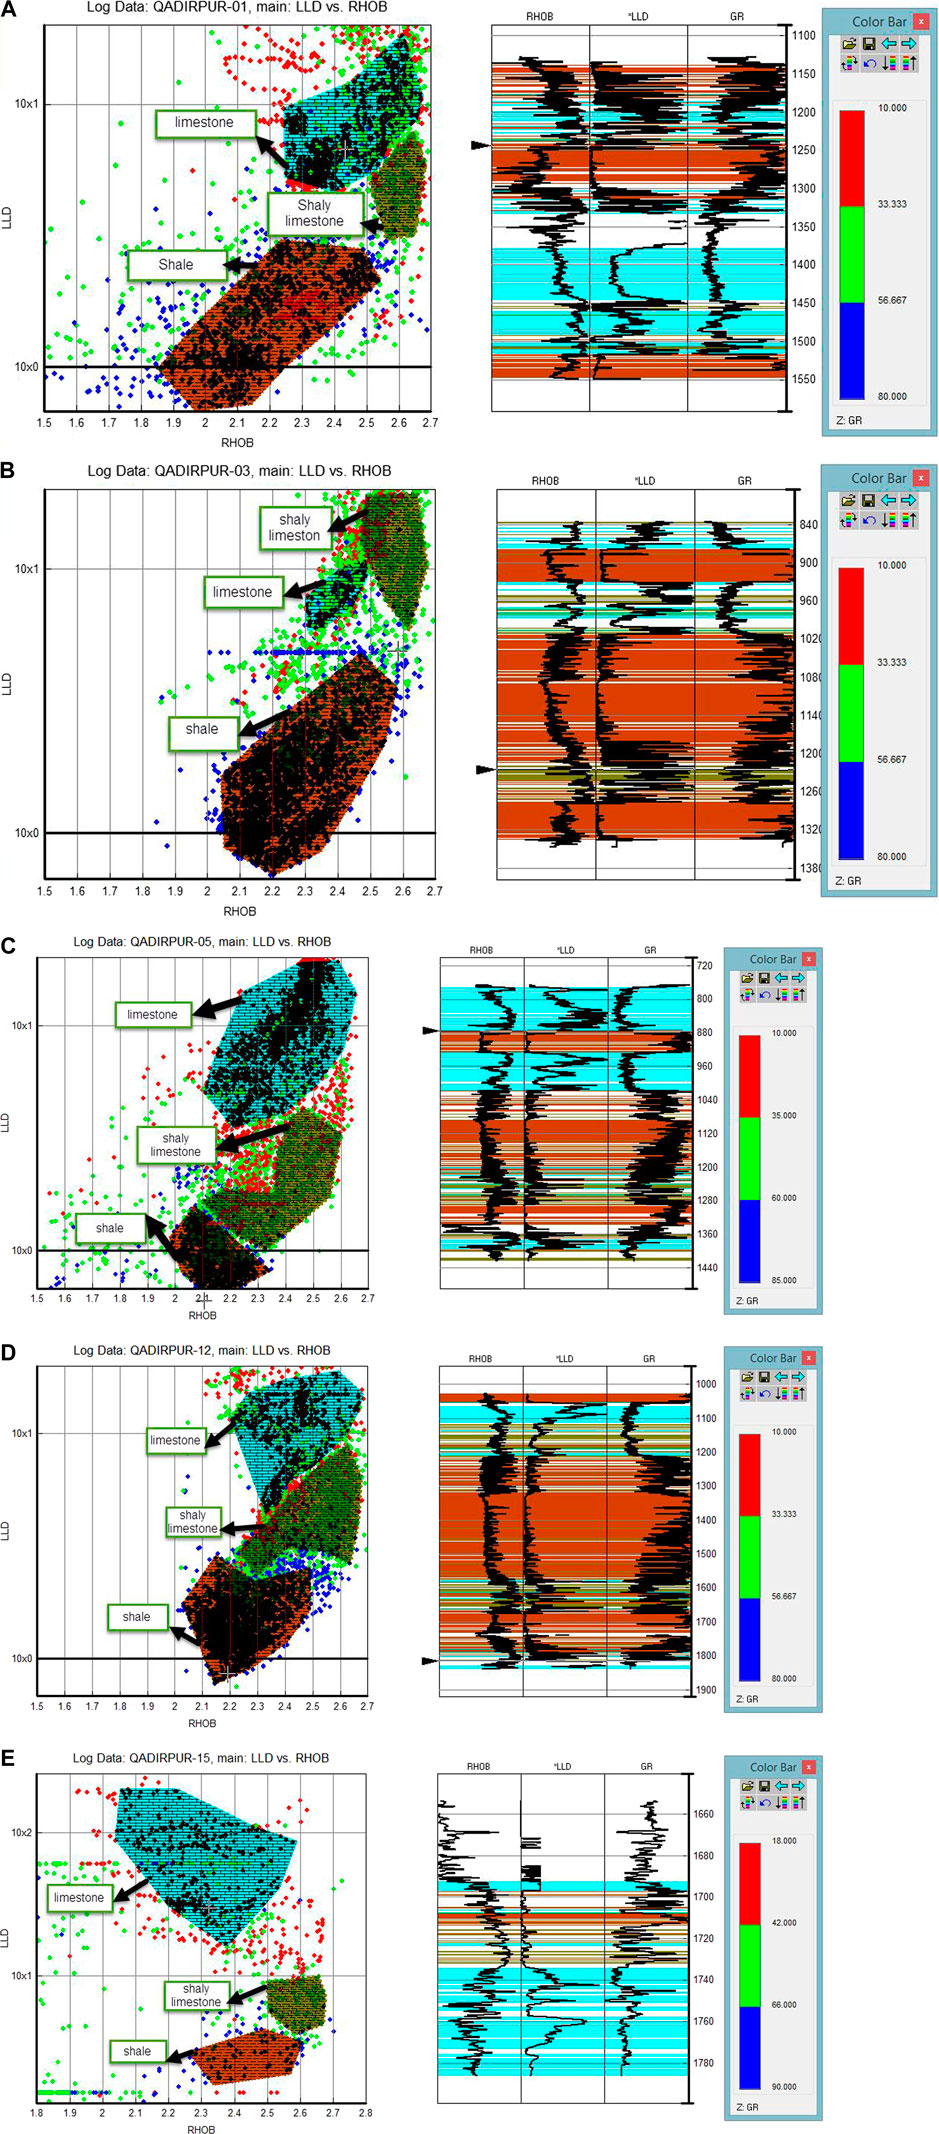
FIGURE 7. (A) Facies classification in Sui Main Limestone encountered in well Q-01, (B) Facies classification in Sui Main Limestone encountered in well Q-03, (C) Facies classification in Sui Main Limestone encountered in well Q-05, (D) Facies classification in Sui Main Limestone encountered in well-Q-12, (E) Facies classification in Sui Main Limestone encountered in well-Q-15 respectively. Based on GR, density and resistivity logs three facies: limestone, shaly limestone and shale were identified in the formation.
Pakistan’s largest gas-producing carbonate reservoir, Sui Main Limestone, was deposited in the early Eocene. Its reservoir potential is evaluated in the Qadirpur area in the Central Indus Basin of Pakistan. Petrophysical and facies analyses revealed that this rock was deposited in a shallow marine environment. Clean limestone, shaly limestone, and shales are the main facies of SML identified on the basis of wireline log response. There is a strong correlation between different facies encountered in these wells. Porosity ranges from 2% to 36% with an average of 14%–34%, with a coarsening upward trend, showing that this rock was deposited in more than one depositional cycle. The high porosity values are due to the presence of micro-fractures and vuggs. These micro-fractures are well interconnected with hydrocarbon saturation of up to 70% in the net pay zones, which were marked in clean limestone facies. The shaly facies has a shale volume of up to 38%. In the southern part of the study area, the limestone is more porous and permeable than in the north. This increase in porosity is due to differential stresses which have fractured the limestone. A Petrographical analysis of the core cutting is recommended to validate the fracture porosity. This comprehensive work may help improve the prediction of reservoir quality in heterogeneous carbonate reservoirs and optimal field development.
The original contributions presented in the study are included in the article/supplementary material; further inquiries can be directed to the corresponding author.
PK supervised this project, reviewed the manuscript, and provided the necessary suggestions. ME helped in formal analysis and helped in processing the data and formatting. SK wrote the manuscript. QA undertook the responsibility of arranging the data for this project and software. All authors contributed to the article and approved the submitted version.
The study was supported by the University of the Punjab, Lahore, Pakistan. This work was partially funded by the university of the Punjab research project “RP 2021 - 2022”.
The authors are grateful to the University of the Punjab, Lahore, Pakistan for facilitating this work.
The authors declare that the research was conducted in the absence of any commercial or financial relationships that could be construed as a potential conflict of interest.
All claims expressed in this article are solely those of the authors and do not necessarily represent those of their affiliated organizations, or those of the publisher, the editors, and the reviewers. Any product that may be evaluated in this article, or claim that may be made by its manufacturer, is not guaranteed or endorsed by the publisher.
Aboubacar, M. S. I., Heng, Z., Li, J., Ousmane, B. I., and Cai, Z. (2022). Prediction of petrophysical classes and reservoir beds through microfacies and pore types characterization, Tahe Ordovician naturally fractured vuggy carbonates. Interpretation 10 (4), T837–T854. doi:10.1190/int-2022-0008.1
Ahmed, N., Khalid, P., Shafi, H. M. B., and Connolly, P. (2017). DHI evaluation by combining rock physics simulation and statistical techniques for fluid identification of Cambrian-to-Cretaceous clastic reservoirs in Pakistan. Acta Geophys. 65 (4), 991–1007. doi:10.1007/s11600-017-0070-5
Ahr, W. M. (2008). Geology of carbonate reservoirs, the identification, description, and characterization of hydrocarbon reservoirs in carbonate rocks. John Wiley & Sons, 296. doi:10.1002/9780470370650.ch8Hoboken, New Jersey, United States
Ali, A., Ahmad, Z., and Akhter, G. (2005). Structural interpretation of the seismic profiles integrated with reservoir characteristics of Qadirpur area, Pakistan. J. Hydrocarb. Res. 15, 25–34.
Archie, G. E. (1942). The electrical resistivity log as an aid in determining some reservoir characteristics. Petroleum Trans. AIME 46, 54–62. doi:10.2118/942054-g
Asquith, G., and Gibson, C. (1982). Basic well logs for geologist. Tusla: American Association of Petroleum Geologists, 216. doi:10.1306/Mth3425
Bachrach, R., Banik, N., Sengupta, M., Noelth, S., Dai, J., Bunge, G., et al. (2006). Effective-stress-based reservoir characterization in an offshore basin. Society of Exploration Geophysicists/New Orleans Annual Meeting,26 1620–1624. doi:10.1190/1.2369831
Baioumy, H., and Ulfa, Y. (2016). Facies analysis of the semanggol formation, south kedah, Malaysia: A possible permian–triassic boundary section.Arab. J. Geosci., 9: 530–538. doi:10.1007/s12517-016-2573-9
Bashir, Y., Faisal, M. A., Biswas, A., Ali, S. H., Imran, Q. S., Siddiqui, N. A., et al. (2021). Seismic expression of miocene carbonate platform and reservoir characterization through geophysical approach: Application in central luconia, offshore Malaysia. J. Pet. Explor. Prod. Technol. 11 (4), 1533–1544. doi:10.1007/s13202-021-01132-2
Besse, J., and Courtillot, V. (1988). Paleogeographic maps of the continents bordering the Indian oceans since the early Jurassic. France, No: Geodynamique-Institute de physique du Globe de Paris, 1–2. doi:10.1029/JB093iB10p11791
Bohnsack, D., Potten, M., Pfrang, D., Wolpert, P., and Zosseder, K. (2020). Porosity–permeability relationship derived from Upper Jurassic carbonate rock cores to assess the regional hydraulic matrix properties of the Malm reservoir in the South German Molasse Basin. Geotherm. Energy 8, 12. doi:10.1186/s40517-020-00166-9
Chatterjee, R., Singha, D., Ojha, M., Sen, M. K., and Sain, K. (2016). Porosity estimation from pre-stack seismic data in gas-hydrate bearing sediments, Krishna-Godavari basin, India. J. Nat. Gas Sci. Eng. 33, 562–572. doi:10.1016/j.jngse.2016.05.066
Choquette, P. W., and Pray, L. C. (1970). Geologic nomenclature and classification of porosity in sedimentary carbonates. Am. Assoc. Pet. Geol. Bull. 54, 207–250. doi:10.1306/5D25C98B-16C1-11D7-8645000102C1865D
Clavier, C., Coates, G., and Dumanoir, J. (1977). “Theoretical and experimental basis for the dual-water model for interpretation of shaly sands,” in 52nd annual technical conference and exhibition (SPESPE). 24 (02): 153–168. doi:10.2118/6859-PA
Das, B., Chatterjee, R., Singha, D. K., and Kumar, R. (2017)., 90. India, 32–40. doi:10.1007/s12594-017-0661-4Post-stack seismic inversion and attribute analysis in shallow offshore of Krishna-Godavari basin, IndiaJ. Geol. Soc. India
Deaton, J. G. (1983). Multi-function compensated spectral natural gamma ray logging system. Rio De Jenaro: KTS Press. doi:10.2118/12050-MS
Eaton, B. (1975). The equation for geopressure prediction from well logs. SPE AIME, SPE 5544, 1–11. doi:10.2118/5544-MS
Farid, M. M., Marzouk, M. M., Hussein, S. R., Elkhateeb, A., and Abdel-Hameed, E. S. (2018). Comparative study of Posidonia oceanica L. LC/ESI/MS analysis, cytotoxic activity and chemosystematic significance. J. Mater. Environ. Sci. 9, 1676–1682. doi:10.26872/jmes.2018.9.6.187
García-del-Cura, M. A., Benavente, D., Martínez-Martínez, J., and Cueto, N. (2012). Sedimentary structures and physical properties of travertine and carbonate tufa building stone. Constr. Build. Mater. 28, 456–467. doi:10.1016/j.conbuildmat.2011.08.042
Ghazi, S., Khalid, P., Aziz, T., Sajid, Z., and Hanif, T. (2016). Petrophysical analysis of a clastic reservoir rock: A case study of the early cambrian khewra sandstone, potwar basin, Pakistan. Geosci. J. 20 (1), 27–40. doi:10.1007/s12303-015-0021-6
Gu, Y., Bao, Z., Lin, Y., Qin, Z., Lu, J., and Wang, H. (2017). The porosity and permeability prediction methods for carbonate reservoirs with extremely limited logging data. Stepwise regression vs. n-way analysis of variance. J. Nat. Gas Sci. Eng. 42, 99–119. doi:10.1016/j.jngse.2017.03.010
Hartmann, D., and Beaumont, E. (1999). “Predicting reservoir system quality and performance,” 9, 9–154.Explor. oil gas traps AAPG doi:10.1306/TrHbk624C9
Hussain, M., Chun, W. Y., Khalid, P., Ahmed, N., and Mahmood, A. (2017). Improving petrophysical analysis and rock physics parameters estimation through statistical analysis of Basal sands, Lower Indus Basin, Pakistan. Arab. J. Sci. Eng. 42, 327–337. doi:10.1007/s13369-016-2128-0
Jadoon, K. Q., Zahid, M., and Gardezi, R. (2013). Petro physical analysis of Habib Rahi limestone of Mari gas field using open-hole wire line logs of well Mari deep-06, central Indus Basin, Pakistan. Calgary, Canada: Geo Convention.
Jaume, S. C., and Lillie, R. J. (1973). Mechanics of the Salt range-potwar plateau, Pakistan: A fold-and-thrust belt underlain by evaporites. Tectonics 710, 57–71. doi:10.1029/TC007i001p00057
Kargarpour, M. A. (2020). Carbonate reservoir characterization: An integrated approach. J. Pet. Explor. Prod. Technol. 10, 2655–2667. doi:10.1007/s13202-020-00946-w
Kazmi, A. H., and Jan, M. Q. (1997). Geology and tectonic of Pakistan. Karachi, Pakistan: Graphic Publishers.
Kazmi, A. H., and Jan, M. Q. (1997). Geology and tectonics of Pakistan. Karachi: Graphic Publisher, 554.
Keeley, M. L., and Wallis, R. J. (1991). The jurassic system in northern Egypt: II. Depositional and tectonic regimes. J. Pet. Geol. 14 (1), 49–64. doi:10.1111/j.1747-5457.1991.tb00298.x
Khalid, P., Akhtar, S., and Khurram, S. (2020). Reservoir characterization and multiscale heterogeneity analysis of cretaceous reservoir in Punjab platform of middle Indus Basin, Pakistan. Arab. J. Sci. Eng. 45, 4871–4890. doi:10.1007/s13369-020-04443-4
Khalid, P., Ehsan, I., Khurram, S., and Metwaly, M. (2021). Mechanical and elastic characterization of shale gas play in upper Indus Basin, Pakistan. Arab. J. Sci. Eng. 46, 5767–5781. doi:10.1007/s13369-020-05275-y
Khalid, P., Ehsan, M. I., Akram, S., Din, Z. U., and Ghazi, S. (2018). Integrated reservoir characterization and petrophysical analysis of cretaceous sands in lower Indus Basin, Pakistan. J. Geol. Soc. India 91 (6), 465–470. doi:10.1007/s12594-018-1042-3
Khalid, P., Qayyum, F., and Yasin, Q. (2014). Data Driven Sequence Stratigraphy of the Cretaceous Depositional System, Punjab Platform, Pakistan. Surveys in Geophysics 35, 1065–1088. doi:10.1007/s10712-014-9289-8
Khalid, P., Yasin, Q., Sohail, G. M. D., and Kashif, J. M. (2015). Integrating core and wireline log data to evaluate porosity of Jurassic formations of Injra-1 and Nuryal-2 wells, Western Potwar, Pakistan. J. Geol. Soc. India 86 (5), 553–562. doi:10.1007/s12594-015-0346-9
Khan, H. K., Ehsan, M., Ali, A., Amer, M. A., Aziz, H., Khan, A., et al. (2022)., 10. Pakistan, 1–15. doi:10.3389/feart.2022.969936Source rock geochemical assessment and estimation of TOC using well logs and geochemical data of Talhar Shale, Southern Indus Basin, PakistanFront. Earth Sci. (Lausanne).
Khan, M., ArifAli, M. N., Yaseen, M., Ahmed, A., and Siyar, S. M. (2016). Petrophysical parameters and modelling of the Eocene reservoirs in the Qadirpur area, Central Indus Basin, Pakistan, implications from well log analysis. Arab. J. Geosci. 9, 425. doi:10.1007/s12517-016-2373-2
Lai, J., Pang, X., Xiao, Q., Shi, Y., Zhang, H., Zhao, T., et al. (2019). Prediction of reservoir quality in carbonates via porosity spectrum from image logs. J. Petroleum Sci. Eng. 173, 197–208. doi:10.1016/j.petrol.2018.10.022
Larionov, V. (1969). Development and field applications of shaly sand petrophysical models, ph.D, dissertation. Moscow: Louisiana State University. Radiomtry of borehole in Russian NEDRA
Lucia, F. J. (2007). Carbonate reservoir characterization: An integrated approach. Springer Science & Business Media. Berlin, Germany.
Malik, J. N., and Nakata, T. (2003). Active faults and related late quaternary deformation along the northwestern himalayan frontal zone, India. Ann. Geophys. 46, 917–936. doi:10.4401/ag-3462
Mazzullo, S. J., and Chilingarian, G. V. (1992). “Diagenesis and origin of porosity,” in Carbonate reservoir characterization, A geologic-engineering analysis, Part I. (Amsterdam: Elsevier Publishing Company), 30, 199–270. doi:10.1016/S0376-7361(09)70127-X
Nelson, R. A. (2001). Geologic analysis of naturally fractured reservoirs. 2nd ed. Houston: Gulf Publishing, 332.
Ngui, J. Q., Hermana, M., Ghosh, D. P., and Yusoff, W. I. W. (2018). Integrated study of lithofacies identification A case study in X field, sabah, Malaysia. Geosci. (Basel). 8, 75. doi:10.3390/geosciences8020075
Powell, C., and Conaghan, P. (1973). Plate tectonics and the himalayas. Earth Planet. Sci. Lett. 20, 1–12. doi:10.1016/0012-821X(73)90134-9
Raza, H. A., and Ahmed, R. (1984). Hydrocarbon potential of Pakistan. J. Canada-Pakistan Coop. Ott. 4 (1), 9–27. doi:10.1007/s12517-018-3978-4
Rider, M. H. (1996). The geological interpretation of well logs. Houston, Texas, United States: gulf publishing company, 288p.
Roehl, P. O., and Choquette, P. W. (1985). Carbonate petroleum reservoirs. Springer-Verlag, 622. doi:10.1007/978-1-4612-5040-1
Salifou, I. A. M., Zhang, Heng, Ousmane Boukari, Issoufou, Harouna, Moussa, and Cai, Zhongxian (1077). New vuggy porosity models-based interpretation methodology for reliable pore system characterization, Ordovician carbonate reservoirs in Tahe Oilfield, North Tarim Basin. J. Petroleum Sci. Eng. 1962021, 107700. ISSN 0920-4105. doi:10.1016/j.petrol.2020.107700
Senosy, A. H., Ewida, H. F., Soliman, H. A., and Ebraheem, M. O. (2020). Petrophysical analysis of well logs data for identification and characterization of the main reservoir of Al Baraka Oil Field, Komombo Basin, Upper Egypt. SN Appl. Sci. 2, 1293. doi:10.1007/s42452-020-3100-x
Siddiqui, N. (2004). Sui Main Limestone: Regional geology and the analysis of original pressures of a closed-system reservoir in central Pakistan. The American Association of Petroleum Geologists 88, 1007–1035.
Siddiqui, N., Rahman, A. H. A., Sum, C. W., Mathew, M., and Menier, D. (2016). Onshore sandstone facies characteristics and reservoir quality of Nyalau formation, Sarawak, East Malaysia. An analogue to subsurface reservoir quality evaluation. Arab. J. Sci. Eng. 41 (1), 267–280. doi:10.1007/s13369-015-1787-6
Singha, D., and Chatterjee, R. (2017). Rock physics modeling in sand reservoir through well log analysis, krishna-godavari basin, India. Geomechanics Eng. 13, 99–117. doi:10.12989/gae.2017.13.1.099
Stieber, S. J. (1970). Pulsed neutron capture log evaluation. Louisiana Gulf Coast. SPE Fall. 04 2961 doi:10.2118/2961-MS
Tahirkheli, R. A. K., Mattauer, F., Prooust, C., Tappointer, P., Farah, A., and A Dejongeds, K. (1979). “The Indian Eurasian suture zone in northern Pakistan,” in Geodynamics of Pakistan (Queeta: GSP).
Wandrey, C. J. (2004). Sember Goru/Ghazij composite total petroleum system, Indus Kirthar Geological provinces, Pakistan and India. USGS Bulletin, 2208C-C,12 2–10. doi:10.3133/b2208C
Wang, F., Li, Y., Tang, X., Chen, J., and Gao, W. (2016). Petrophysical properties analysis of a carbonate reservoir with natural fractures and vugs using X-ray computed tomography. J. Nat. Gas Sci. Eng. 28, 215–225. doi:10.1016/j.jngse.2015.11.046
Wasimuddin, M., and Jadoon, I. A. K. (2005). Lower Indus Basin. PakistanIslamabad, Pakistan: Pakistan Association of Petroleum Geologists/Society of Professional Engineers ATC.Integrated image logs in structural analysis of Zaur field
Westphal, H., Surholt, I., Kiesl, C., Thern, H. F., and Kruspe, T. (2005). NMR measurements in carbonate rocks. Problems and an approach to a solution. Pure Appl. Geophys. 162, 549–570. doi:10.1007/s00024-004-2621-3
Wyline, M. R. J., Gregory, A. R., and Gardener, L. W. (1956). Elastic wave velocities in heterogeneous and porous media. Geophysics 21 (1), 41–70. doi:10.1190/1.1438217
Xuanjun, Y., Senhu, L., Qun, L., Jingli, Y., Lan, W., Guo, H., et al. (2015). Lacustrine fine-grained sedimentary features and organicrich shale distribution pattern: A case study of chang 7 member of triassic yanchang formation in ordos basin, NW China. Petroleum Explor. Dev. 42 (1), 37–47. doi:10.1016/S1876-3804(15)60004-0
Keywords: facies modeling, geophysical and geological exploration, well logging and petrophysics analysis, petroleum geology, Eocene carbonate reservoir
Citation: Khalid P, Ehsan MI, Khurram S, Ullah I and Ahmad QA (2022) Reservoir quality and facies modeling of the early Eocene carbonate stratigraphic unit of the Middle Indus Basin, Pakistan. Front. Earth Sci. 10:1063877. doi: 10.3389/feart.2022.1063877
Received: 07 October 2022; Accepted: 16 November 2022;
Published: 19 December 2022.
Edited by:
Muhsan Ehsan, Bahria University, PakistanReviewed by:
Kutubuddin Ansari, Sejong University, South KoreaCopyright © 2022 Khalid, Ehsan, Khurram, Ullah and Ahmad. This is an open-access article distributed under the terms of the Creative Commons Attribution License (CC BY). The use, distribution or reproduction in other forums is permitted, provided the original author(s) and the copyright owner(s) are credited and that the original publication in this journal is cited, in accordance with accepted academic practice. No use, distribution or reproduction is permitted which does not comply with these terms.
*Correspondence: Perveiz Khalid, cGVydmVpei5nZW9AcHUuZWR1LnBr
Disclaimer: All claims expressed in this article are solely those of the authors and do not necessarily represent those of their affiliated organizations, or those of the publisher, the editors and the reviewers. Any product that may be evaluated in this article or claim that may be made by its manufacturer is not guaranteed or endorsed by the publisher.
Research integrity at Frontiers
Learn more about the work of our research integrity team to safeguard the quality of each article we publish.