 Zibo Wang
 Ruifeng Liu1*
95% of researchers rate our articles as excellent or good
Learn more about the work of our research integrity team to safeguard the quality of each article we publish.
Find out more
ORIGINAL RESEARCH article
Front. Earth Sci. , 10 January 2023
Sec. Solid Earth Geophysics
Volume 10 - 2022 | https://doi.org/10.3389/feart.2022.1061754
This article is part of the Research Topic Source and Effects of Light to Moderate Magnitude Earthquakes - Volume II View all 5 articles
After the occurrence of the 2008 Wenchuan Mw 7.9 earthquake, the Longmen-Shan fault zone exhibits highly active seismicity. In the years between 2008 and 2022, successive moderate magnitude aftershocks followed in the region. In this study, we used high-quality seismic data from the National Earthquake Data Center of China to estimate the source parameters of 184 moderate magnitude events (Mw 3.9–6.2) in the Longmen-Shan Fault zone. The dataset comprised the aftershocks of two sequences that occurred in the area, including the 2008 Wenchuan earthquake sequence and the 2013 Lushan earthquake sequence. They have been classified according to their focal mechanism. First, our results suggested that the values of apparent stress varied from approximately 0.1–11 MPa, which are higher than the global average. The strike-slip earthquakes have the highest average apparent stress among the types of earthquakes. The above results indicate that the moderately high levels of energy release from earthquakes in this region could result in high ground shaking potential. This behavior may be associated with the high stress accumulation and the strong deformation characteristics in the intraplate environment of the Longmen-Shan Fault zone. The values of the stress drop vary from approximately 0.24–39 MPa and appear to show a slightly increasing trend with the seismic moment. The stress drop level of the Lushan earthquake sequence is higher than the mean value of intraplate earthquakes, while the Wenchuan earthquake sequence is typical of intraplate earthquakes. Second, we investigate the radiated energy enhancement factor (REEF) to quantify the source complexities. The results show that the earthquakes have REEF values between 1.2 and 7.1, and most events are consistent with expectations based on the Brune ω-square model. There exist differences in the source complexity of earthquakes within the source area, and the average ω-square source model could result in an unreliable estimate of the radiated seismic energy of some events. The observation of moderate magnitude earthquakes suggests that the availability of different source parameters will help us to assess the seismic hazard and predict the shaking potential in the earthquake area.
Strong earthquakes usually receive much attention due to their vast destruction, but the low frequency of strong earthquakes makes it difficult to use them to study the overall characteristics of the source region. Compared with strong earthquakes, the frequency of moderate magnitude events is much higher, and the characteristics of such events can help us analyze the damage potential of different earthquakes and provide more information about the source area. Many factors influence the level of destruction by earthquakes, including magnitude, depth, site effect, and construction quality. Among these factors, the magnitudes of the earthquakes play important roles in the destructive power of the earthquake. However, we often find that two closely located earthquakes with identical magnitudes may cause significantly different damage (Choy and Boatwright, 2009; Di Giacomo et al., 2009). One of the main reasons is the difference in the efficiency of the seismic waves radiated by the source (Madariaga, 2009). The seismic moment and radiated seismic energy are two parameters describing the earthquake size, and both have clear physical meanings. The seismic moment is a static source parameter for shear faulting and is determined by the low-frequency amplitude spectra of seismic waves, which is a measurement of the cumulative average static tectonic effect of an earthquake (Kanamori, 1977). In comparison, the radiated seismic energy is largely governed by the variable dynamics and kinematics of earthquake ruptures and is more sensitive to high-frequency details of the source (Choy and Boatwright, 1995; Bormann and Di Giacomo, 2011). Therefore, for most earthquakes, the energy release process may differ significantly with the same seismic moment. The determination of the radiated seismic energy plays a key role in improving our understanding of earthquake source physics and could allow more reliable predictions of the shaking potential compared with seismic moments (Cotton et al., 2013).
The Longmen-Shan (LMS) fault zone is a marginal fault between the Sichuan Basin and Qiangtang terranes in the eastern Tibetan Plateau. Under the accumulation of pressure from the Indo-Australian plate to the northeast, the Eurasian plate formed the large uplift of the Tibetan Plateau. The Tibetan Plateau flows eastward and is obstructed by the Sichuan Basin in the western part of the Yangtze craton, accumulating a large amount of tectonic stress and forming the LMS Fault Zone. Historically, the LMS fault zone was inactive, and the seismicity was much lower than that of the nearby Xianshui River fault. After the 2001 Kunlun M 8.1 earthquake, the main extrusion direction of the Qinghai-Tibet Plateau on the main body of the Asian-European plate shifted from the north to the east, and the LMS fault and other faults in the vicinity were affected and became active again, with the occurrence of the 2008 Wenchuan Mw 7.9 earthquake and 2013 Lushan Mw 6.6 earthquake. Although another great earthquake will take place again in the LMS Fault Zone with low probability, it is still active with several hundreds of moderate magnitude events from 2008 to 2022 (Xu et al., 2009; Pei et al., 2019). Furthermore, the Sichuan Basin, adjacent to the LMS Fault Zone, has several cities with populations of more than one million; therefore, it is particularly important to evaluate the seismic characteristics in the region.
The earthquake catalogs currently include the seismic moments of some moderate magnitude events as daily output (USGS, gCMT), but there is a less unified seismic catalog that produces results of radiated seismic energy in the specific area, which limits the ability to more accurately assess the potential damage caused by an earthquake through integrated source parameters (including seismic moment, radiated seimic energy, derived apparent stress, stress drop, etc.). After the Wenchuan earthquake, we obtained sufficient earthquake records for research with the rapid development of the seismic station network in China. Based on the above analysis, we studied the static and dynamic source parameters for a large number of earthquakes occurring from 2008 to 2022 in the LMS fault zone. The seismic moment, radiated seismic energy, and corner frequency are estimated based on regional broadband seismic data, and the apparent stress, stress drop, radiation efficiency, and radiated energy enhancement factor are derived from the above parameters (Brune, 1970; Madariaga, 1976; Abercrombie, 1995; Allmann and Shearer, 2009; Ye et al., 2018). Afterward, we further discuss the detailed source properties in the LMS fault zone with the results of existing studies, and the main features and generation mechanism of earthquakes with different energy release levels.
The dataset of this study comprised 184 events between 2008 and 2022 in the LMS, including the aftershock sequences of two earthquakes that occurred in the area: the 2008 Wenchuan earthquake and the 2013 Lushan earthquake (Figure 1). Detailed earthquake information is shown in Supplementary Table S1. High-quality seismic waveforms for events well recorded at 198 seismic stations were provided by regional networks from China Earthquake Networks. For uniformity, the hypocenter information and focal mechanism solutions of the analyzed events were taken from the unified catalog of the China Earthquake Data Center (see the data availability), and we used the first-motion methods to determine the focal mechanism solutions of the events that were not available in the catalog (Anderson, 1988).
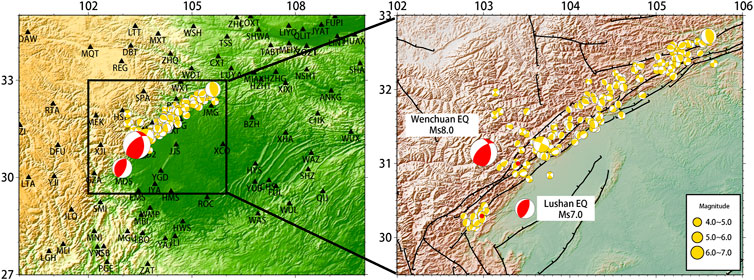
FIGURE 1. Map of the study area with the broadband seismological stations used in this study (black triangles). The zoomed map shows the earthquakes of the entire seismic sequence, with many of the identified active fault traces in the region.
For earthquakes in the sequence, we followed the methods of Madariaga (2011) and Satriano (2022) to estimate the source parameters. In the following, we first determined the seismic moment and corner frequency results of each event. Fourier-transformed displacement pulses radiated from a point moment tensor are then converted to displacement pulses
where Ω(ω) is the Fourier transform of the source time function. When ω tends to 0, Ω(ω) satisfies the relation
For the ω-square model, Ω(ω) is equal to
where ω0=2πf0 is the corner frequency. For each event, we use the horizontal component waveforms to invert the spectrum, take the average results of each station as M0 and f0 of this event, and determine the results according to the standard deviation (Figure 2).
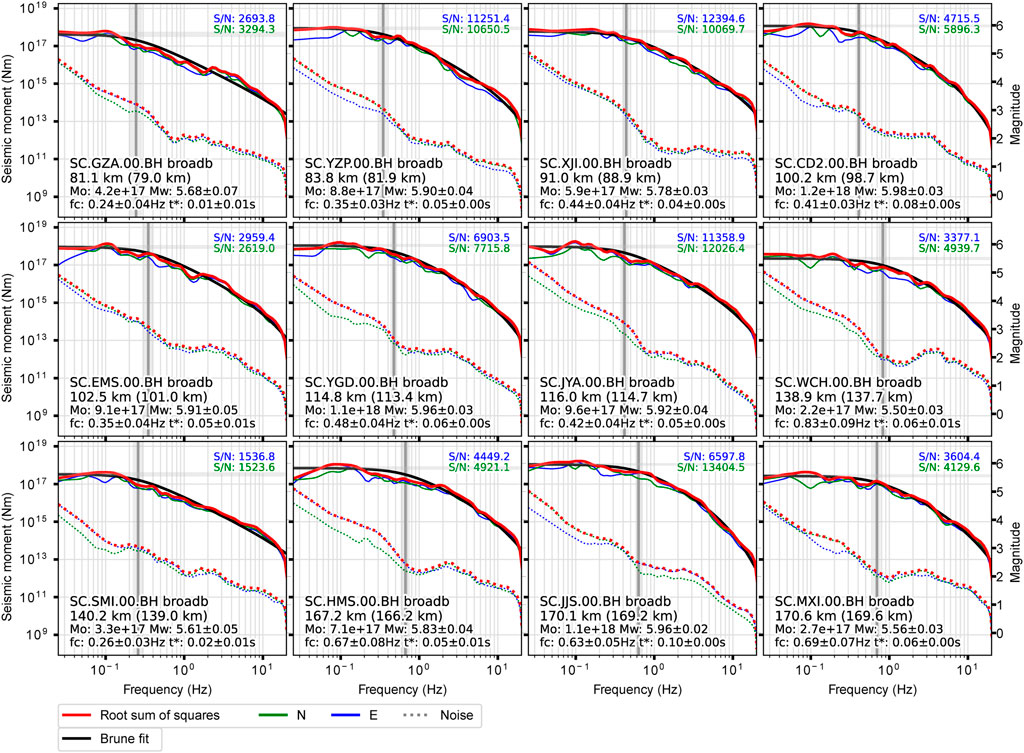
FIGURE 2. Examples of source spectra for a Mw = 5.8 event. The black dashed curves show the best fit ω−2 model spectra, and the vertical line represents the corner frequency.
To discuss the most basic relationship for seismic sources, we must determine the energy radiated from the source. The radiated seismic energy ER can be computed by the source spectral amplitude
where ρ(x)β(x) is the P or S wave impedance, and
The results of this method depend on the assumption about the shape of the spectra. However, the source spectra of different earthquakes exhibit strong variations and may not be well matched by an average Brune model. The moment-rate functions and their spectra are therefore unreachable for these small earthquakes and a reliable estimate of seismic energy cannot be established based on this technique. In practice, rather than using apparent moment-rate functions, we want to estimate seismic energy from observed ground motion. Therefore, we followed the method of Boatwright et al. (2002) based on local and regional data to estimate the radiated seismic energy
where r represents the distance between stations and the source, C contains the radiation pattern and free-surface amplification at the station site, and
For an accurate estimation of radiated seismic energy, spectral information above and below the earthquake corner frequency must be analyzed, where the energy density peaks most strongly. Therefore, we corrected the radiated seismic energy for the effect of the finite spectral bandwidth of observations using the ratio between the estimated and the true energy flow R (Di Bona and Rovelli 1988)
where fM is the high frequency of the integration.
Our results (Figure 3) showed the histograms of the source parameter distribution. Overall, both apparent stress and stress drop were log-normally distributed. In the following, we will analyze these parameters in detail.
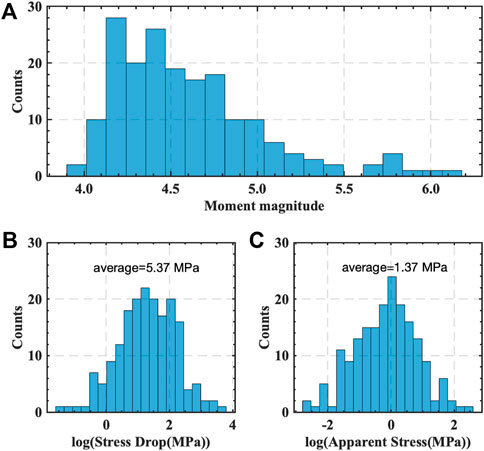
FIGURE 3. Histograms of the magnitude distribution (A) and rupture properties (B,C) for the studied earthquakes. The average value for the stress drop and apparent stress values are reported in each plot.
The apparent stress is a source parameter closely related to the radiated seismic energy and seismic moment
where μ is the shear modulus. Following previous studies, we take a value of μ = 33 GPa. For the dataset (Figure 4), the τa estimates are characterized by a large scatter, varying from 0.1 to 11 MPa, with an average value of 1.37 MPa, which is distinctly higher than the average τa value of 0.47 MPa for the global shallow earthquakes estimated by Choy and Boatwright (1995). In 71% of these events, the τa value is higher than 0.47 MPa.
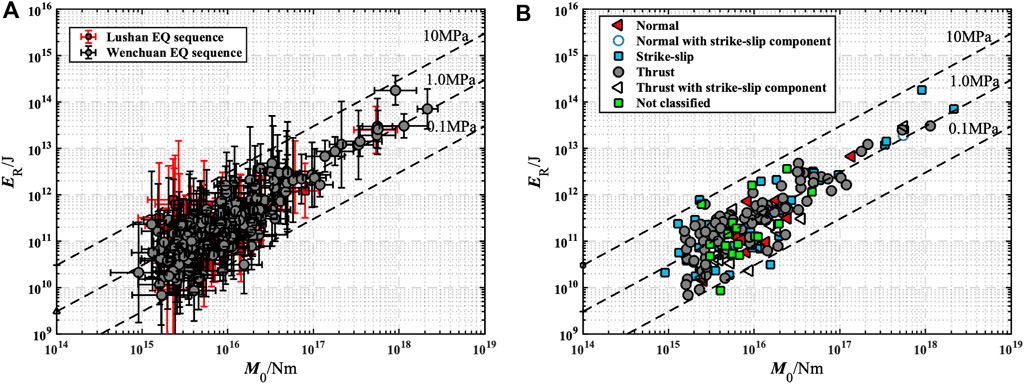
FIGURE 4. Scaling of the radiated seismic energy with the seismic moment and ± 1 standard deviation for the estimated parameters (horizontal and vertical black lines, respectively) for (A): the Lushan and Wenchuan earthquake sequences and (B): the type of mechanism.
Choy and Boatwright (1995) found that the focal mechanism plays a role in apparent stress, and according to teleseismic records, strike slip earthquakes have a greater ER/M0 and apparent stress than dip-slip earthquakes. Despite this, there has been debate related to the accuracy of the ER/M0 for strike slip earthquakes (Newman and Okal 1998; Kanamori et al., 2020). Teleseismic P waves cannot provide accurate estimates of strike slip earthquake energy because there is a strong effect of scattered energy near the source on nodal signals. In contrast, the energy estimation method based on regional data can use S waves, which carry most of the radiated energy regardless of the focal mechanism. We can use the average radiation pattern coefficients instead of specific source radiation pattern corrections according to the focal mechanism solutions on the determination of the radiated seismic energy because small errors in the radiation pattern coefficients can lead to substantial errors in estimates of the radiated energy, particularly if the coefficients are small. As Pwaves carry less than 5% of the radiated energy, their contribution to the total radiated seismic energy is usually negligible.
Therefore, to examine the patterns of apparent stress based on focal mechanisms, faulting style was classified for the analyzed events using the classification of Zoback (1992) in Table 1. The aftershocks were predominantly thrust fault earthquakes, followed by strike slip earthquakes and then normal fault earthquakes. The results show that the average τa value is larger than 1.37 MPa for the SS, NC, and TF mechanisms, respectively, and the apparent stress level of strike slip earthquakes is higher than that of other earthquakes, which is in accord with the results obtained by Choy and Boatwright (1995). Therefore, we can conclude that the strikeslip earthquake exhibits higher energy release efficiency.
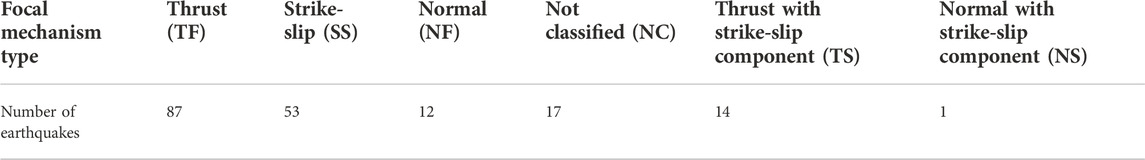
TABLE 1. Summary of the grouping of the focal mechanism solutions for the analysed events using the classification of Zoback (1992).
Choy and Kirby (2004) proposed the fault maturity model to explain the differences in energy release from earthquakes. In terms of the model, the enormous energy release by the earthquake can be related to strong deformation and high stress accumulation in an immature intraplate setting. By comparing the ER/M0 of the Tottori and Kyushu earthquakes in Japan, Choy and Boatwright (2009) found that the significantly high energy release from the Tottori earthquake (τa = 5.7 MPa) was related to the strong deformation in the immature intraplate environment of the fault on which the earthquake was located. In contrast, the apparent stress of the Kyushu earthquake (τa = 1.0 MPa) that occurred in the fault with high maturity is low. The LMS fault zone is located at the junction of the eastern edge of the Tibetan Plateau and the Sichuan Basin, and it is caused by the eastward movement of the Bayan Har terrane blocked by the Sichuan Basin. Therefore, it was in a strongly locked condition with a low fault slip rate. With the rapid accumulation of compressive stress in the LMS fault zone and the eastern part of the Bayan Har block, the stress in the fault zone is high. Therefore, the high energy release of earthquakes is related to the high stress accumulation and the strong deformation characteristics in the intraplate environment in the LMS fault zone.
Stress drops during earthquakes (the change in shear stress before and after the earthquake) are linked to fault properties. Based on Eshelby’s (1957) circular crack model and Brune’s (1970) relationship between the source dimension and corner frequency, the stress drop, seismic moment, and corner frequency are related as
Studies have shown that the stress drops for most moderate to large earthquakes (M>5) worldwide range from approximately 0.1–100 MPa (Allmann and Shearer, 2009). Stress drops for small events (M<5) range from 0.01 to 10 MPa (Abercrombie, 1995). Earthquakes in continental regions tend to have lower stress drops, and Oth (2013) found that for a large number of Japan crustal and subcrustal seismic sequences, Δσ values vary in the range of 0.1–100 MPa, with lower events Δσ occurring in the crust (<10 MPa). From our results (Figure 5), Δσ values are distributed between 0.24 MPa and 39 MPa, with an average value of 5.37 MPa. Of these, the Δσ values of the Wenchuan earthquake aftershocks are distributed between 0.24 MPa and 22 MPa, with an average value of 4.88 MPa, and the Δσ values of the Lushan aftershocks are distributed between 0.55 MPa and 39 MPa, with an average value of 8.63 MPa. That is, the stress drop level of the Lushan earthquake sequence is higher than the mean stress drop value of 4.89 MPa for global intraplate earthquakes (Allmann and Shearer, 2009), while the Wenchuan earthquake sequence is close to the average stress drop level.
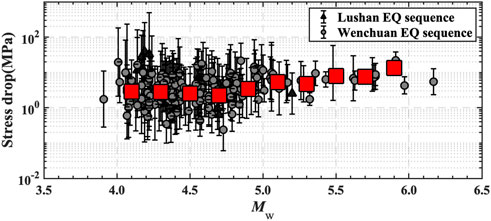
FIGURE 5. Stress drop estimates versus moment magnitude and ± 1 standard deviation for the estimated parameters (vertical black lines) for the Lushan and Wenchuan earthquake sequences. Red squares plot the median stress drop in 0.2 moment magnitude bins.
We observed a slight increase in the Brune stress drop with the seismic moment for aftershocks, and there are large variations in the stress drop at small magnitudes, which is the same as the results obtained by previous studies (Rovelli and Calderoni, 2014; Calderoni et al., 2019). In Figure 6, we can observe a large dispersion of stress drops within the LMS fault zone. A similar observation was made by Abercrombie et al. (2017) for New Zealand earthquake sequences, which indicated that earthquake variability is quite high within small tectonic regions. Several studies have indicated that there is a weak dependence on earthquake size for regions with tectonic characteristics that vary (Allmann and Shearer, 2009). However, as seismic moments increase in an earthquake sequence or a specific tectonic setting, stress drops tend to increase as well (Mayeda et al., 2005). The stress drop was found to be influenced by a variety of factors, including crustal thickness and heat flow conditions, according to Hauksson (2015). The larger stress drop changes for smaller magnitudes are associated with the higher sensitivity of smaller ruptures to source anisotropy and stress variation. Stress field heterogeneity controls rupture propagation during an earthquake, and the degree of heterogeneity affects slip (Ben-Zion and Zhu, 2002; Ben-Zion, 2008). Therefore, for small earthquakes, local variations occurring at the fracture zone can significantly affect the results of the stress drop.
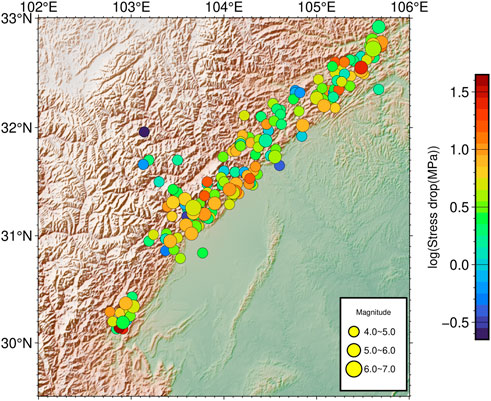
FIGURE 6. Spatial distribution of the stress drop in the LMS fault zone.
Some events exist in the dataset with greater uncertainty in the stress drop, and a few events show anomalously high or low stress drops. This phenomenon may be related to uncertainties in the variations in method, material properties, and data limitations. For the Brune model, the stress drop is determined from the cube of the corner frequency, and the seismic moment is inversely proportional to the cube of the corner frequency. Therefore, the small uncertainties in corner frequency contribute to significant variation and uncertainty in stressdrop estimates. To reduce the uncertainty of the results, we set the lower limit of earthquake magnitude in the dataset as approximate Mw 4.0 and did not consider earthquakes with smaller magnitudes. Overall, our results reflect the overall characteristics of the seismic sequence. The broad bandwidth of the recording instrument, stations with good azimuthal coverage, and the use of coda waves instead of body waves and surface waves can reduce the uncertainty of the results, which is also one of our future research objectives.
The radiation efficiency ηsw, as a parameter linking the kinematic and dynamic characteristics of the source, is determined by the fracture model and can be used to measure the dynamic strength of the material at the source. It is an important reference for studying the spatial, temporal, and intensity variations during earthquakes. The radiation efficiency is defined as the ratio of apparent stress to stress drop
This parameter was proposed by Savage and Wood (1971), and the theoretical radiation efficiency ηsw varied between the range of 0 and 0.5. According to Beeler et al. (2012), the expected value of ηsw was 0.23 for the ω−2 model, and earthquakes with ηsw > 0.5 and ηsw < 0.1 were classified as high- and low-efficiency earthquakes. Comparing the apparent stress and stress drop results for the aftershock events of the Wenchuan and Lushan earthquakes, it can be seen in Figure 7 that the apparent stress and stress drop are well correlated, with ηsw ranging from 0.1 to 0.3 for most of the earthquakes (median value 0.23). Some events deviate from the expected ratio ηsw = 0.23 due to their higher corner frequencies and anomalously high or low energy.
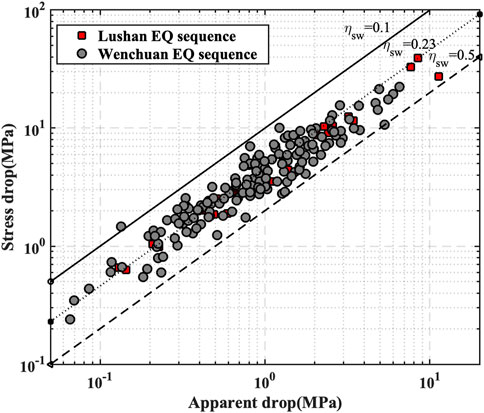
FIGURE 7. Apparent stress compared to stress drop, showing theoretical relation in black line.
However, Choy and Boatwright (1995) demonstrate that even though a large apparent stress implies a commensurately large stress drop, we avoid direct calculation of this. The ER/M0 ratio clearly defines apparent stress, but the stress drop is determined by the underlying model. The source complexity of great earthquakes leads to a very complex source time function that does not fit the ω−2 model, and a simple fit will inevitably yield unreliable results (Rudnicki and Kanamori, 1981). It depends on neither the fracture geometry nor the model to calculate apparent stress. A useful feature of apparent stresses is that they provide an independent constraint on stress drops predicted by geometry-dependent models of stress. With these considerations in mind, the radiated energy enhancement factor (REEF) proposed by Ye et al. (2018) is more suitable to measure rupture complexity. REEF is the ratio of directly measured radiated seismic energy, ER, to the minimum energy for a source of the same M0 and duration, ER min
where ρ is the rock density and β is the S-wave velocity at the depth of the source. T can be obtained from the corner frequency fc (Keisuke and Kanamori, 2022)
REEF combines three parameters, the seismic moment M0, radiated seismic energy ER, and rupture duration T, to describe the source complexity. In general, sources with a high REEF value are complex, and vice versa. When the shape of the moment-rate function (MRF) is parabolic, REEF=1, and as the complexity of the moment-rate function increases, the REEF also increases, and a high REEF represents a more complex source environment in the region where this earthquake is located. Theoretically, for the ω−2 source model, REEF≈3, and when REEF<5, it can be regarded as consistent with the model (Keisuke and Kanamori, 2022). Therefore, the seismic source spectra of most aftershocks are consistent with the Brune ω−2 source model based on the assumption of instantaneous rupture on circular faults. Figure 8A shows the distribution characteristics of REEF in terms of magnitude. The results showed that the range of earthquake REEF values was between 1.2 and 7.1, with an average of 2.5. The distribution of REEF of the Wenchuan earthquake ranges from 1.2 to 7.1 with an average of 2.8, and the Lushan earthquake ranged from 1.5 to 4.4 with a median of 2.5, suggesting similar source complexity in both sequences. For the earthquakes in the sequence, no significant REEF dependence on magnitude was found.
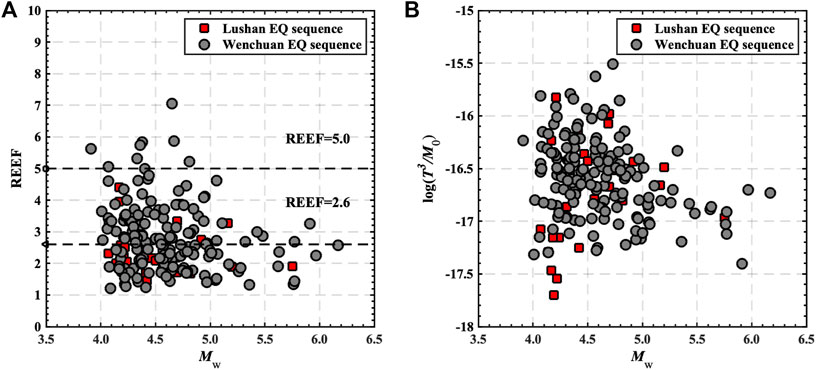
FIGURE 8. (A): REEF versus moment magnitude. (B): T3/M0 versus moment magnitude for the Lushan and Wenchuan earthquake sequences.
For moderate earthquakes in this study, Figure 8B shows that the trend observable on REEF agrees with that of T3/M0. From Eq. 11, we find that the REEF value depends on two components, ER/M0 and T3/M0. For strong and great earthquakes, ER/M0 is less different from that of small earthquakes, but the rupture duration is longer and more variable among different earthquakes. Ye et al. (2018) statistically obtained a global REEF range of 5–150 for strong earthquakes (Mw ≥ 7.0) in subduction zones with systematic regional variations, and Keisuke and Kanamori (2022) obtained a REEF range of 2–30 for Mw 3.0–7.0 earthquakes in Japan, with a variation range larger than the results of this study. Most earthquake rupture velocities are between 45 and 90% of shear wave velocities. However, the rupture velocity of supershear earthquakes is faster than the shear wave velocities, corresponding to the rupture duration being relatively short. In contrast, one of the prominent features and discriminatory conditions of tsunami earthquakes is the long rupture duration compared with other earthquakes (Newman and Okal, 1998). For such cases, the effect of T3/M0 on the REEF value far exceeds ER/M0.
In summary, compared with the radiation efficiency, the REEF is more suitable to compare earthquakes at different scales and is chosen as a daily output in the earthquake catalog.
The study of moderate magnitude earthquakes cannot be separated from the evaluation of their disasters, especially for those that caused great damage. For the same Mw, Baltay et al. (2013) found that earthquakes with greater stress drops cause larger ground motions, and therefore, they suggested that rapid estimates of the stress drop can allow for more accurate earthquake shaking predictions. From our results, both the apparent stress and stress drop estimates are highly variable, covering approximately three orders of magnitude. The differences in the spectral contents of the events are likely due to differences in the dynamics of the sources since the propagation paths for the event are virtually identical. Bindi et al. (2018) suggested that an earthquake’s radiated seismic energy could vary in response to stress-drop variability. In other words, high apparent stresses could be related to high stress drops.
Compared to M0, which is controlled solely by low-frequency amplitudes, the radiated seismic energy ER depends on the amount of high-frequency energy radiated by the seismic source, which is critical for better assessing the shaking potential of an earthquake. Currently, the estimates of the seismic moment have become accepted measures of source size and are regarded as daily output by various institutions. In comparison, the radiated seismic energy has attracted less attention in recent years. For global strong and great earthquakes, IRIS (http://www.iris.edu/dms/products/eqenergy/) estimates the radiated seismic energy soon after the earthquake’s origin time based on the method developed byConvers and Newman (2011). For a specific area, Italy is one of the most seismically active countries in Europe and is frequently hit by strong or moderate magnitude earthquakes, and the 2009 Mw 6.3 L’Aquila earthquake is a prototypical example of this. This moderate magnitude earthquake inflicted heavy casualties and property losses exceeded expectations. Calderoni et al. (2019) found that the apparent stress and stress drop of the earthquake reached 1.12 MPa and 8.68 MPa respectively, much higher than the global average level. In addition, Picozzi et al. (2017) analyzed the 2016 Central Italy sequence and also found large values for the apparent stress, extending from approximately 0.5–25 MPa. Spallarossa et al. (2021) proposed the RAMONES Service for rapid assessment of seismic moment and radiated seismic energy in Central Italy, which provides valuable and fundamental data for future related research.
With its location between the Pacific seismic zone and the Euro-Asian seismic zone, China is frequently hit by earthquakes and endures heavy natural disasters. In this work, we aim to provide a reference for helping earthquake disaster-risk management to more quickly and more reliably assess the potential earthquake impact in China. Although most of the moderate magnitude events were not disastrous due to limited energy radiation, it is necessary to identify characteristic properties of earthquakes with high shaking potential in real- or near-real time implementation, due to a relatively large number of earthquake-prone areas in China. As stated by Sagiya et al. (2011), all rapid-response systems for earthquakes would be more effective if source parameters could be quickly and accurately determined, and as we strive to mitigate earthquake effects, redundancy from independent real-time hazard assessments would be extremely valuable.
In this study, we systematically studied the source parameter characteristics of 184 earthquakes recorded at local and regional scales near the Longmen-Shan Fault zone, covering an overall magnitude range from Mw 3.9 to Mw 6.2. The primary objective of our study was to analyze the source parameters of moderate magnitude earthquakes in the Longmen-Shan Fault zone, describe the source characteristics of earthquakes in this area, and investigate the effect of the source parameters in the quantification of seismic hazard potential.
We found that the seismic energy release level in the LMS tectonic region was high, which was related to the high stress accumulation level in the zone and the strong deformation characteristics in the immature intraplate environment. After classifying the dataset according to the focal mechanism, it is found that strikeslip earthquakes show the highest average apparent stress level compared to other types of earthquakes. The stress drop level of the Lushan earthquake sequence is higher than the mean value of intraplate earthquakes, while the Wenchuan earthquake sequence is typical of intraplate earthquakes. The stress drops of the earthquakes increase as Mw increases.
By investigating the radiated energy enhancement factor (REEF) to quantify the source complexities, we found that the REEF values of most aftershocks correspond to the expected range of the ω−2 model. However, there were differences in the source complexity between earthquakes, indicating that the average ω−2 source model could not deliver a reliable estimate of the radiated seismic energy for some events in the dataset. We suggest that the REEF is more suitable for comparisons between earthquakes of different sizes than radiation efficiency.
Publicly available datasets were analyzed in this study. The local and regional waveforms, hypocenter information, and focal mechanism solutions can be found at http://data.earthquake.cn.
The first author ZW was responsible for the main work of this paper, such as proposing the viewpoint, implementing the algorithm, data processing, data analysis, picture drawing, deriving the conclusion, and discussing the results. The second author RL was responsible for guiding this work. The third author WL was responsible for discussing the results.
This work was supported by the Special Fund of the Institute of Geophysics, China Earthquake Administration (Grant Nos DQJB22B18).
We would like to thank the Editor Ruizhi Wen and two reviewers for their comments and suggestions that allowed us to significantly improve the manuscript content and form. We would like to thank Xiangyun Guo, Zhenyue Li and Yansong Hu for providing us with focal mechanism solutions for the earthquakes used in this study.
The authors declare that the research was conducted in the absence of any commercial or financial relationships that could be construed as a potential conflict of interest.
All claims expressed in this article are solely those of the authors and do not necessarily represent those of their affiliated organizations, or those of the publisher, the editors and the reviewers. Any product that may be evaluated in this article, or claim that may be made by its manufacturer, is not guaranteed or endorsed by the publisher.
The Supplementary Material for this article can be found online at: https://www.frontiersin.org/articles/10.3389/feart.2022.1061754/full#supplementary-material
Abercrombie, R. E. (1995). Earthquake source scaling relationships from −1 to 5MLusing seismograms recorded at 2.5-km depth. J. Geophys. Res. 100 (B12), 24015–24036. doi:10.1029/95JB02397
Abercrombie, R. E., Poli, P., and Bannister, S. (2017). Earthquake directivity, orientation, and stress drop within the subducting plate at the Hikurangi margin, New Zealand. J. Geophys. Res. Solid Earth 122 (12), 10176–10188. doi:10.1002/2017jb014935
Allmann, B. P., and Shearer, P. M. (2009). Global variations of stress drop for moderate to large earthquakes. J. Geophys. Res. 114, B01310. doi:10.1029/2008JB005821
Anderson, H. (1988). Comparison of centroid-moment tensor and first motion solutions for Western Mediterranean earthquakes. Phys. Earth Planet. Interiors 52, 1–7. doi:10.1016/0031-9201(88)90052-0
Baltay, A. S., Hanks, T. C., and Beroza, S. H. (2013). Stable stress-drop measurements and their variability: Implications for ground-motion prediction. Bull. Seismol. Soc. Am. 103 (1), 211–222
Beeler, N. M., Wong, T. F., and Hickman, S. H. (2003). On the expected relationships among apparent stress, static stress drop, effective shear fracture energy, and efficiency. Bull. Seismol. Soc. Am. 93 (3), 1381–1389. doi:10.1785/0120020162
Ben-Zion, Y., and Zhu, L. (2002). Potency-magnitude scaling relations for southern California earthquakes with 1.0< ML < 7.0. Geophys.J. Int. 148 (3), F1–F5.
Ben Zion, Y. (2008). Collective behavior of earthquakes and faults: Continuum-discrete transitions, evolutionary changes and corresponding dynamic regimes. Rev. Geophy. 46, RG4006. doi:10.1029/2008RG000260
Bindi, D., Cotton, F., Spallarossa, D., Picozzi, M., and Rivalta, E. (2018). Temporal variability of ground shaking and stress drop in central Italy: A hint for fault healing? Bull. Seismol. Soc. Am. 108 (4), 1853–1863. doi:10.1785/0120180078
Boatwright, J., Choy, G. L., and Seekins, L. C. (2002). Regional estimates of radiated seismic energy. Bull. Seismol. Soc. Am. 92 (4), 1241–1255. doi:10.1785/0120000932
Bormann, P., and Di Giacomo, D. (2011). The moment magnitude Mw and the energy magnitude me: Common roots and differences. J. Seismol. 15 (2), 411–427. doi:10.1007/s10950-010-9219-2
Brune, J. N. (1970). Tectonic stress and the spectra of seismic shear waves from earthquakes. J. Geophys. Res. 75 (26), 4997–5009. doi:10.1029/JB075i026p04997
Calderoni, G., Rovelli, A., and Di Giovambattista, R. (2019). Stress drop, apparent stress, and radiation efficiency of clustered earthquakes in the nucleation volume of the 6 April 2009, Mw 6.1 L'Aquila earthquake. J. Geophys. Res. Solid Earth 124, 10360–10375. doi:10.1029/2019JB017513
Choy, G. L., and Boatwright, J. L. (2009). Differential energy radiation from two earthquakes in Japan with identical Mw: The Kyushu 1996 and Tottori 2000 earthquakes. Bull. Seismol. Soc. Am. 99 (3), 1815–1826. doi:10.1785/0120080078
Choy, G. L., and Boatwright, J. L. (1995). Global patterns of radiated seismic energy and apparent stress. J. Geophys. Res. 100, 18205–18228. doi:10.1029/95jb01969
Choy, G. L., and Kirby, S. (2004). Apparent stress, fault maturity, and seismic hazard for normal-fault earthquakes at subduction zones. Geophys. J. Int. 159, 991–1012. doi:10.1111/j.1365-246x.2004.02449.x
Convers, J. A., and Newman, A. V. (2013). Rapid earthquake rupture duration estimates from teleseismic energy rates, with application to real-time warning. Geophys. Res. Lett. 40 (22), 5844–5848. doi:10.1002/2013gl057664
Cotton, F., Archuleta, R., and Causse, M. (2013). What is sigma of the stress drop? Seismol. Res. Lett. 84, 42–48. doi:10.1785/0220120087
Di Bona, M., and Rovelli, A. (1988). Effects of the bandwidth limitation of stress drops estimated from integrals of the ground motion. Bull. Seismol. Soc. Am. 78 (5), 1818–1825.
Eshelby, J. D. (1957). The determination of the elastic field of an ellipsoidal inclusion, and related problems. Proc. R. Soc. Lond. Ser. A 241 (1226), 376–396. doi:10.1098/rspa.1957.0133
Hauksson, E. (2015). Average stress drops of southern California earthquakes in the context of crustal geophysics: Implications for fault zone healing. Pure Appl. Geophys. 172 (5), 1359–1370. doi:10.1007/s00024-014-0934-4
Kanamori, H., Ross, Z. E., Rivera, L., Keisuke, Y., and Kanamori, H. (2020). Estimation of radiated energy using the KiK-net downhole records—Old method for modern data. Geophys. J. Int. 221 (2), 1029–1042. Time-domain source parameter estimation of Mw 3-7 earthquakes in Japan from a large database of moment-rate functions [Preprint]. Available at: doi:10.1093/gji/ggaa040 https://resolver.caltech.edu/CaltechAUTHORS:20220407-177319137(Accessed October 3, 2022).
Kanamori, H. (1977). The energy release in great earthquakes. J. Geophys. Res. 82, 2981–2987. doi:10.1029/jb082i020p02981
Madariaga, R. (1976). Dynamics of an expanding circular fault. Bull. Seismol. Soc. Am. 66 (3), 639–666. doi:10.1785/bssa0660030639
Madariaga, R. (2009). “Earthquake scaling laws,” in Encyclopedia of complexity and systems science (New York: Springer).
Mayeda, K., Gök, R., Walter, W. R., and Hofstetter, A. (2005). Evidence for non-constant energy/moment scaling from coda-derived source spectra. Geophys. Res. Lett. 32, L10306. doi:10.1029/2005GL022405
Newman, A. V., and Okal, E. A. (1998). Teleseismic estimates of radiated seismic energy: The E/M0 for tsunami earthquakes. J. Geophys. Res. 103 (B11), 26885–26898. doi:10.1029/98JB02236
Oth, A. (2013). On the characteristics of earthquake stress release variations in Japan. Earth Planet. Sci. Lett. 377, 132–141. doi:10.1016/j.epsl.2013.06.037
Pei, S., Niu, F., Ben-Zion, Y., Sun, Q., Xue, X., Su, J., et al. (2019). Seismic velocity reduction and accelerated recovery due to earthquakes on the Longmenshan fault. Nat. Geosci. 12, 387–392. doi:10.1038/s41561-019-0347-1
Picozzi, M., Bindi, D., Brondi, P., Di Giacomo, D., Parolai, S., and Zollo, A. (2017). Rapid determination of P wave-based energy magnitude: Insights on source parameter scaling of the 2016 Central Italy earthquake sequence. Geophys. Res. Lett. 44 (9), 4036–4045. doi:10.1002/2017gl073228
Rovelli, A., and Calderoni, G. (2014). Stress drops of the 1997–1998 colfiorito, central Italy earthquakes: Hints for a common behaviour of normal faults in the apennines. Pure Appl. Geophys. 171, 2731–2746. doi:10.1007/s00024-014-0856-1
Rudnicki, J. W., and Kanamori, H. (1981). Effects of fault interaction on moment, stress drop, and strain energy release. J. Geophys. Res. 86 (B3), 1785–1793. doi:10.1029/JB086iB03p01785
Sagiya, T., Kanamori, H., Yagi, Y., Yamada, M., and Mori, J. (2011). Rebuilding seismology. Nature 473 (7346), 146–148. doi:10.1038/473146a
Satriano, C. (2022). SourceSpec – earthquake source parameters from P- or S-wave displacement spectra (1.6). doi:10.5281/ZENODO.3688587
Savage, J. C., and Wood, M. D. (1971). The relation between apparent stress and stress drop. Bull. Seismol. Soc. Am. 61 (5), 1381–1388.
Spallarossa, D., Picozzi, M., Scafidi, D., Morasca, P., Turino, C., and Bindi, D. (2021). The RAMONES Service for rapid assessment of seismic moment and radiated energy in central Italy: Concepts, capabilities, and future perspectives. Seismol. Res. Lett. 92 (3), 1759–1772. doi:10.1785/0220200348
Xu, X., Wen, X., Yu, G., Chen, G., Klinger, Y., Hubbard, J., et al. (2009). Coseismic reverse-and oblique-slip surface faulting generated by the 2008 Mw 7.9 Wenchuan earthquake, China. Geology 37 (6), 515–518. doi:10.1130/g25462a.1
Ye, L., Kanamori, H., and Lay, T. (2018). Global variations of large megathrust earthquake rupture characteristics. Sci. Adv. 4, eaao4915. doi:10.1126/sciadv.aao4915
Keywords: earthquake dynamics, earthquake source observations, earthquake hazards, body waves, longmen-shan fault zone
Citation: Wang Z, Liu R and Liu W (2023) Source characteristics of the aftershocks of the Wenchuan and Lushan earthquake sequences in the Longmen-Shan fault zone. Front. Earth Sci. 10:1061754. doi: 10.3389/feart.2022.1061754
Received: 05 October 2022; Accepted: 09 November 2022;
Published: 10 January 2023.
Edited by:
Ruizhi Wen, Institute of Engineering Mechanics, China Earthquake Administration, ChinaReviewed by:
Raffaele Castaldo, National Research Council (CNR), ItalyCopyright © 2023 Wang, Liu and Liu. This is an open-access article distributed under the terms of the Creative Commons Attribution License (CC BY). The use, distribution or reproduction in other forums is permitted, provided the original author(s) and the copyright owner(s) are credited and that the original publication in this journal is cited, in accordance with accepted academic practice. No use, distribution or reproduction is permitted which does not comply with these terms.
*Correspondence: Ruifeng Liu, bGl1cmZAc2Vpcy5hYy5jbg==
Disclaimer: All claims expressed in this article are solely those of the authors and do not necessarily represent those of their affiliated organizations, or those of the publisher, the editors and the reviewers. Any product that may be evaluated in this article or claim that may be made by its manufacturer is not guaranteed or endorsed by the publisher.
Research integrity at Frontiers
Learn more about the work of our research integrity team to safeguard the quality of each article we publish.