
95% of researchers rate our articles as excellent or good
Learn more about the work of our research integrity team to safeguard the quality of each article we publish.
Find out more
ORIGINAL RESEARCH article
Front. Earth Sci. , 12 January 2023
Sec. Structural Geology and Tectonics
Volume 10 - 2022 | https://doi.org/10.3389/feart.2022.1059909
This article is part of the Research Topic Quantitative Characterization and Engineering Application of Pores and Fractures of Different Scales in Unconventional Reservoirs – Volume II View all 39 articles
 Youjun Tang1,2Yijun Wu1
 Ruyue Wang3
 Yahao Huang1,2*
 Yifan Xue1Zhonghong Chen1Tianwu Xu4Ting Wang1Hongbo Li1
Inorganic and organic fluids are widely found in sedimentary basins during oil and gas migration and accumulation. This research investigates two types of sandstone reservoirs with different pressure states and fluid evolution of the Shahejie Formation in the western slope belt of Dongpu Sag. Based on petrographic observations, micro-Raman spectroscopy, and fluorescent spectrometry, petroleum inclusions, CH4-bearing inclusions, and CO2-bearing inclusions were discovered in quartz-hosted minerals. The pressure–temperature–time–composition (P–T–t–X) properties of the CH4 and CO2 inclusions were obtained by quantitative Raman analysis and thermodynamic models. Minimum trapped pressure was predicted by the thermodynamic modeling of petroleum inclusions. Saffron yellow petroleum inclusions represent an early Oligocene oil-charging event (∼32–30 Ma), and the two kinds of reservoirs were all kept in moderate-overpressure conditions (average pressure coefficient: 1.26). Due to rapid uplift and denudation (Dongying movement) in the middle Oligocene in step II, crude oil degrades into CH4 and CO2 (density of CH4 gas inclusions: 0.1010–0.1339 g/cm3; density of CO2 gas inclusions: 0.450–0.612 g/cm3) and retains low-maturity (0.67–1.04%) bitumen in situ. Tectonic destruction causes the reservoir to be released to normal pressure. With the reburial of the Es3 Formation, step II entered the middle stage of oil generation again (average pressure coefficient: 0.90). However, in step I, with secondary hydrocarbons occurring, second-stage oil (performance for pale blue fluorescence in petroleum inclusions) accumulated at ∼12–0 Ma (late Miocene–Pliocene). The second oil charging event in step I remains a reservoir under high-overpressure conditions (average pressure coefficient: 1.67).
Reservoir pore fluid plays an important role in petroliferous basins and can reflect the dynamic process of hydrocarbon generation, migration, and accumulation (Dickinson, 1953; Tingay et al., 2009; Guo et al., 2011). Fluid activity (e.g., petroleum, CH4, and CO2) in natural strata can be trapped by lattice defects and fracture healing in minerals to form primary or secondary fluid inclusions (Mclimans, 1987; Goldstein, 2001). As independent geochemical systems, geo-fluid parameters such as temperature, pressure, components, and sources contained in fluid inclusions are codes of geological interpretation in relevant geological processes (Haszeldine et al., 1984; Roedder, 1984; Goldstein, 2003). Paleo-fluid pressure recovery and fluid source traces can be used as an index of oil and gas reservoir transformation and adjustment or for research on fault sealing (Gay et al., 2007; Weibull et al., 2010; Li et al., 2010; Wang et al., 2016; Guo et al., 2022). The maintenance of the overpressure state and fluid source are signs of good oil and gas enrichment and preservation conditions (Li et al., 2019; Li et al., 2022; Wang et al., 2016). The most direct and accurate method is to obtain the thermodynamic and physical–chemical data through the entrapment condition of the fluid inclusions (Burruss, 1987; Huang et al., 2018).
Laser Raman microprobe (LRM) spectroscopy, as a new micro-area analysis technique, has the characteristics of high precision and in situ, non-destructive and rapid analysis (Zozulya et al., 1998; Osborne and Haszeldine, 1993; Van den Kerkhof and Hein, 2001; Munz et al., 2004). Owing to the Raman quantitative function model, in the wide variation of pressure‒temperature, Raman spectroscopy directly determining the total composition and total density of inclusions at abnormal temperatures can be carried out (Seitz et al., 1996; Pironon et al., 2003). Microthermometric measurement and LRM spectroscopy performed for fluid inclusions, combined with thermodynamic modeling, enable fluid inclusion quantitative analysis (e.g., composition, entrapped pressure, and bulk density), representing a key approach to reconstruct P‒T entrapment conditions (Fabre and Couty, 1986; Gao et al., 2020; Dubessy et al., 1989, 2001; Burke, 2001). Raman spectroscopy can measure CH4 and CO2 solubility, salinity, pressure, or density in individual gaseous and aqueous inclusions (peak shift, peak separation, peak area ratio, peak height ratio, etc.) (Dubessy et al., 2001; Azbej et al., 2007; Baumgartner and Bakker, 2009; Caumon et al., 2014; Ou et al., 2015; Zhang et al., 2016; Gao et al., 2017); however, Raman quantitative microanalyses in geological applications are still weak.
The transition of diagenetic fluids in different environments leads to changes in the concentrations of key trace elements and isotopic compositions. The knowledge of alterations of rare earth elements (REEs) (e.g., seawater origin, meteoric water leaching-percolation, redox reactions, and hydrothermal origin) can be used to identify the extent and characteristics of diagenetic alterations of vein-filling minerals (Munz et al., 2004). These data can then provide information on the migration of geological fluids, stages of vein filling, and variations in diagenetic environments (Saimd and Ali, 2006).
Dongpu Sag is located in the southern Bohai Bay Basin in east China, and the western slope belt of Dongpu Sag is one of the main areas for oil and gas exploration and development in the SINOPEC Zhongyuan Oilfield. Fracture controls the structure-deposition evolution and formation of oil accumulation. Under the microscope work, in addition to oil inclusions, large numbers of primary and secondary gas-bearing fluid inclusions and pore-filled bitumen were found. Raman probe in situ analysis revealed that the fluid inclusions contain CH4 and CO2 gas. The purpose of this paper is to determine the paleo-fluid composition, paleo-pressure, and fluid charging period in the Shahejie Formation.
Dongpu Sag is located in the southern Bohai Bay Basin, which is part of Linqing Sag (Figure 1). According to the basement morphology and fault features, Dongpu Sag can be divided into five secondary-structural units: western slope belt; western sag belt; central uplift belt; eastern depression belt; and Dong Mingji fault step belt. The sedimentary cover of Dongpu Sag experienced two major stages: Paleogene rift and Neogene depression (Zuo et al., 2017). From old formation to new formation, this was filled with the Paleogene fourth member of the Shahejie Formation (Es4), the third member of the Shahejie Formation (Es3), the second member of the Shahejie Formation (Es2), the first member of the Shahejie Formation (Es1) and the Dongying Formation (Ed), the Neogene Guantao Formation (Ng), the Minghuazhen Formation (Nm), and the Quaternary. Among them, Es3 is the basin period of greatest prosperity. It represents the main formation stage of the source rock, salt rock, and favorable reservoir. It can be further divided into the lower (Es33), middle (Es32), and upper (Es31) sections (Figure 2).
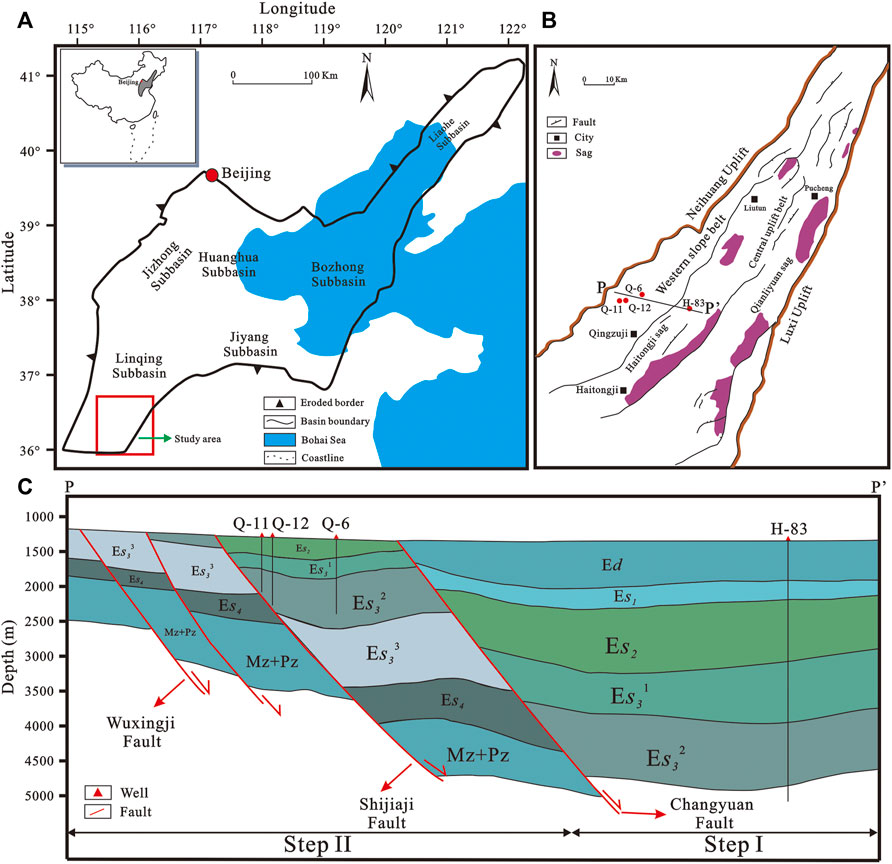
FIGURE 1. (A) Location map of Dongpu Sag in the Bohai Bay Basin. (B) Structural unit division map of Dongpu Sag. (C) Profile p-p’ of the present western slope belt. The location of line p-p’ is indicated in Figure 1 (adopted from Luo et al., 2016).
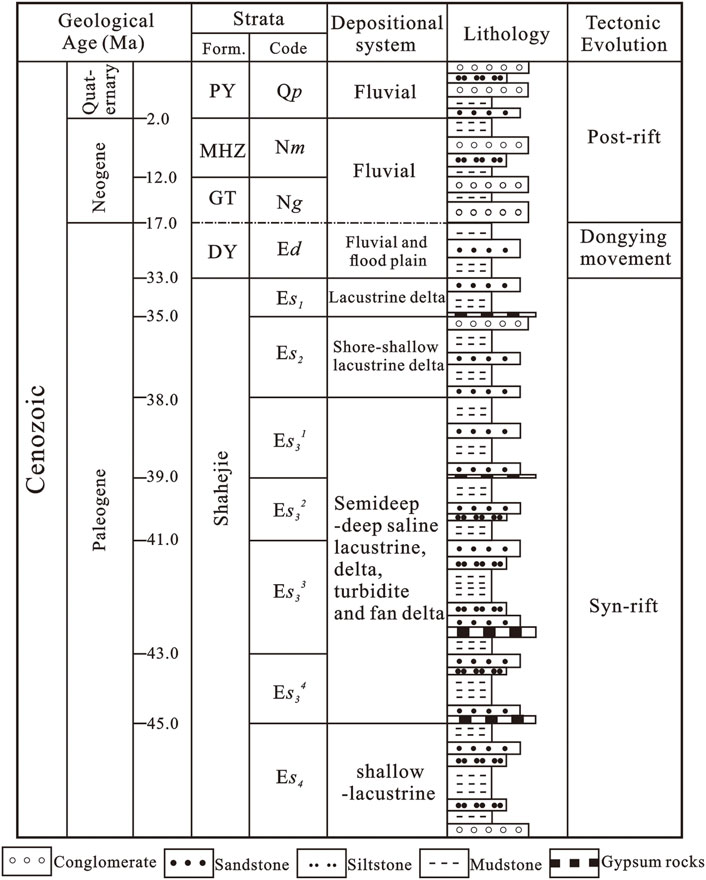
FIGURE 2. Cenozoic stratigraphic column of Dongpu Sag. PY: Ping Yuan Formation; MHZ: Ming Hua Zhen Formation; GT: Guan Tao Formation; DY: Dong Ying Formation.
The study area is located in the central part of the western slope belt (Figure 1A). Large faults in the area, such as Changyuan, Shijiaji, Xingzhuang, Wuxingji, and Mazhai, are distributed in the style of goose spread. The slope belt is cut into two east‒west fault belts (step I and step II in Figure 1C). Regionally, the Shahejie Formation in the western slope belt of Dongpu Sag mainly develops the source rocks of the first, third, and fourth members of the Paleogene strata, and the lithology is mainly dark mudstone, oil shale, calcareous, dolomitic shale, and calcareous rock. The kerogen type of source rocks is mainly mixed, and its parent material mainly comes from lower organisms and some higher plants (Song et al., 2010). The source rocks enter the maturity stage (Ro=0.5%) at a burial depth of approximately 2,500 m, enter the high maturity stage (Ro=1.3%) at a burial depth of approximately 4,000 m, and enter the dry gas stage (Ro=2.0%) at a burial depth of approximately 5,000 m. Source rocks of middle and lower sub-members of Es3 have also reached the mature hydrocarbon generation stage, which leads to step II having various oil sources, resulting in the wide distribution of oil and gas and enrichment. In the western slope belt, Es33 and Es32 are dominated by the underwater fan, the sedimentary center of the Es33 period is located in the Huzhuangji area, and the filling deposition of the fan middle channel is widely developed, which is mainly composed of gravel medium fine sandstone (Wu and Ye, 2009; Luo et al., 2016). The sedimentary center of the Es32 period moved east to Liutun–Haitongji Sag. At this time, due to the intense activity of the Changyuan and Xingzhuang faults, miniature slump fans often developed in the fault block. The upper member of Es3 is mainly deltaic deposit, and the development degree of sandstone is relatively poor, mainly distributed channel sand and sheet sand. Structural, lithologic, stratigraphical, and structural–stratigraphical types of traps developed in the study area (Liu et al., 2019).
Approximately 30 sandstone core samples were collected from well H-83 in step I and well Q-6, well Q-11, and well Q-12 in step II of the Es32 Formation. The study by Huang et al. (2018) offers further details on sheet disposal in the context of avoiding fluorescence interference.
A petrographic examination was conducted using an Olympus BX60 microscope (10×, 20×, 50×, and 100×). The homogenization temperature (Th) and ice melting temperature (Tm) for aqueous fluid inclusions were measured using a Linkam (TH–600) heating–cooling stage. The precision (reproducibility) of the Th and Tm values was ±1°C and ±0.1°C, respectively.
Oil inclusions can be illuminated with ultraviolet (UV) light to identify the degree of maturity (Burruss, 1991; Chang and Huang, 2008). A fluorescence spectrum device (Nikon 80I microscope connected to a high-pressure mercury lamp with a lamp excitation wavelength of 300–380 nm) was used for the spectral acquisition of oil-bearing inclusions. Fluorescence spectrum parameters usually include the selected λmax value (wavelength relevant to maximum intensity) and QF535 values (ratio of the 535–750 nm integral area to the 430–535 nm integral area) for characterizing the emission spectra of oils and maturity (Munz, 2001; Ping et al., 2019). Typical petroleum inclusions were selected to reconstruct the composition and pressure‒temperature (P‒T) entrapment conditions by microthermometry and volumetric analysis using confocal laser scanning microscopy (for details, see Ping et al., 2013; Pironon and Bourdet, 2008). This reliable method requires Th and the degree of bubble filling (Fv) as known parameters to determine the C7+ molar proportion of petroleum inclusions. The quantitative correlation among the C7+ mole fraction and Thoil and Fv can be used to predict the minimum trapped pressure.
The Raman instrument used was a JY/Horiba LABRAM HR800 (532-nm green laser; 400–500 mW output power) at China University of Geosciences (Wuhan) equipped with 10×/20×/50× long-focus objectives. Peak calibration was used with ∼520.7 cm−1 polished silicon during the experiments. Components of gaseous fluid inclusions were investigated by setting a 200-µm confocal hole and 300-gr·mm−1 grating with a 2,650 cm−1 grating center. The accumulative time varied from 0 to 500 s to acquire the optimal signal-to-noise ratio. Options of precise resolution (1,800 gr·mm−1 grating and 50-μm aperture) are also necessary for acquiring accurate Raman shifts in terms of single gas phase inclusions. At the same time, neon lamp-corrected measurement should also be applied to acquire strict Raman wavenumbers (Kawakami et al., 2003; Wang et al., 2011; Dubessy et al., 2012; Huang et al., 2018). The density of pure CH4 inclusions can be calculated by measuring the Raman shift of the C–H symmetric stretching band (v1) of CH4 (Seitz et al., 1993, 1996; Lu et al., 2007) at room temperature (25°C, ensured homogenization). After Raman spectrographic collection, the density of pure CH4 fluid inclusions can be determined by applying different equations (for more details, see Zhang et al., 2016). The density of pure CO2 inclusions can be measured as the separation between Fermi diad peaks of CO2 (Rosso and Bodnar, 1995). After the acquisition of the Raman spectrum in the homogenized state, the density of CO2 inclusions is calculated by applying multiple regression formulas (see Huang et al., 2018; Wang et al., 2019).
NaCl aqueous inclusions bearing dissolved CH4 are usually coeval with CH4-rich fluid inclusions in microfractures or isolated within quartz overgrowths. The quantitative factor (PAR/mCH4) of CH4–H2O–NaCl ternary fluids depends on salinity and temperature. To exactly calculate the CH4 solubility in a NaCl aqueous inclusion at a known temperature, the salinity must be determined first. The salinity of the aqueous fluid inclusions can be determined using the Raman spectra of the v(OH) stretching vibration of water (e.g., Dubessy et al., 1989; Caumon et al., 2015).
I3425/I3260 was calculated using the integral Raman intensity ratio of wavenumber intensity at 3,425 cm−1 to wavenumber intensity at 3,260 cm−1 at 25°C (Guillaume et al., 2003; Becker et al., 2008; Caumon et al., 2014). The measured I3425/I3260 and temperature were substituted into Eq. 1 (R2 > 0.997; Ou et al., 2015):
The integration of the Raman peak area ratio (PAR) of the CH4 v1 band (∼2,917 cm−1) to the OH stretching band of water in homogenized aqueous inclusions can determine the CH4 concentration of water-rich fluid inclusions (mol/kg; Ou et al., 2015):
where T is the experimental temperature (K) in a homogeneous state. The slope (a) and intercept (b) are determined by the square root of mNaCl (see Ou et al., 2015). Based on these parameters and the model of Duan et al. (2003) and Duan and Mao (2006), the density and homogenization pressure (Ph) of water-rich fluid inclusions can be obtained.
The integration of the Raman peak intensity ratio (HR) of the upper band (at ∼1,380 cm−1) of the CO2 Fermi dyad to the OH stretching band of water placed into the formula mentioned previously permits calculation of the concentration of CO2 in water (mol/kg; Guo et al., 2014):
With these parameters, the density of water-rich fluid inclusions can be obtained based on Duan and Sun (2003).
Thermal maturity can be estimated through multilinear regression analysis of Raman spectroscopic parameters of carbonaceous material (Wilkins et al., 2014, 2015, 2018). The peak separation distance, peak height ratio, and full width at half maximum (FWHM) of the G (1250–1450 cm−1) and D (1500–1605 cm−1) bands can be used to calculate the equivalent vitrinite reflectance (EqVR%). The application details of the equations are described by Liu et al. (2013).
BasinMod–1D (Version 7.06) software was adopted for the simulation of burial and thermal histories, which integrates the lithology, stratigraphic thickness, erosion thickness, absolute age, vitrinite reflectance, and measured borehole temperature data. Well completion reports (e.g., DST data) from the SINOPEC Zhongyuan Oilfield provide the measured Ro and borehole temperature values (Figure 3). Thermal history simulation was mainly corrected using the vitrinite reflectance and temperature. The simulation results of the burial history of well Q-12 in step II and well H-83 in step I are shown in Figure 4.
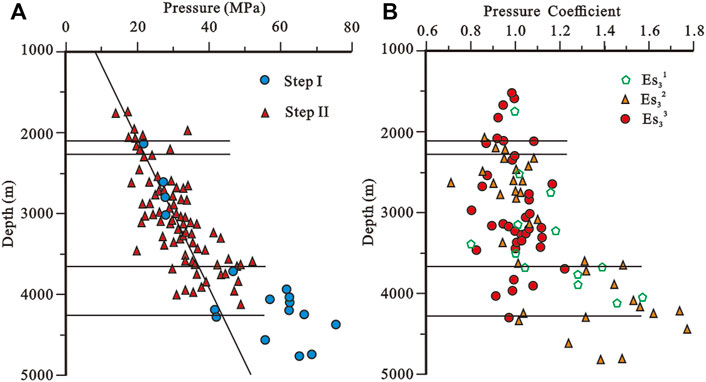
FIGURE 3. (A) Statistics of measured formation pressure and depth at different structural steps in the western slope belt of Dongpu Sag. (B) Statistics of the current pressure coefficient and depth at different horizons in the western slope belt of Dongpu Sag.
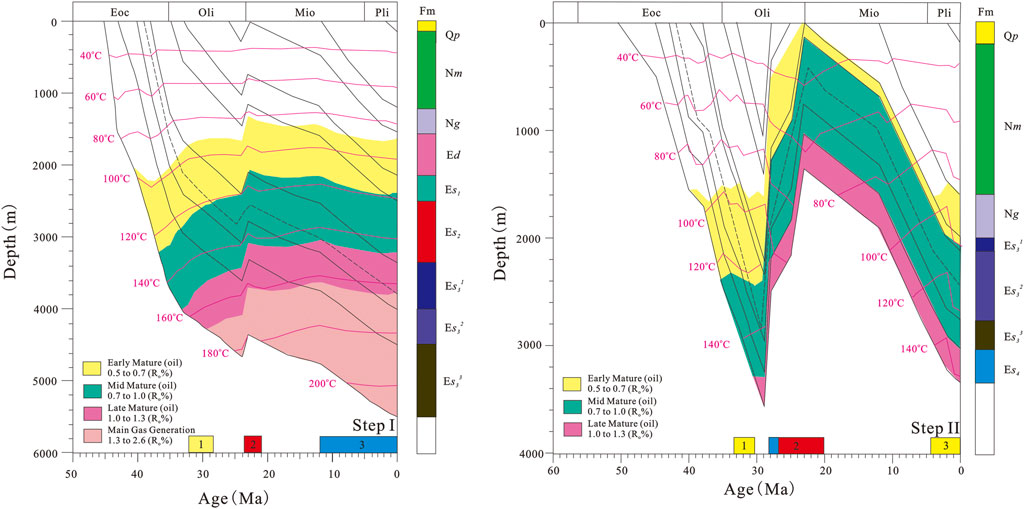
FIGURE 4. Paleocene Formation burial histories of steps I and II, illustrating the CH4 and CO2 charging times and multiple-staged oil charging times. The yellow frame represents the trapped period of yellow petroleum inclusions, the red frame represents the trapped period of CH4 and CO2, and the blue frame represents the trapped period of blue petroleum inclusions.
Analysis of oil testing pressure data shows that the reservoir pressure of different structural units in the study area has different development characteristics (Figure 3). The measured burial depth of the formation pressure point between 1,100 and 4,900 m ranges from 14.0 to 76.0 MPa, the pressure coefficient is 0.77–1.80, and the formation pressure increases with the burial depth. Es1, Es2, Es3, and Es4 were dominated by normal pressure. The shallow strata (<3,400 m) of Es31 and Es32 are mainly normal pressure, but the deep part is mostly in overpressure conditions. Overpressures are widespread in step I, but step II mainly occurs under normal pressure conditions, and faults in the distribution of the reservoir pressure have a significant control effect.
CH4, H2O, CO2, and petroleum fluids can be trapped by quartz grains or overgrowths during diagenetic processes. Petrographic observations at room temperature and the identification of UV fluorescence and Raman characteristic peaks can be comprehensively used to precisely classify the fluid inclusion assemblages (FIAs) into five types (Figures 5, 6):
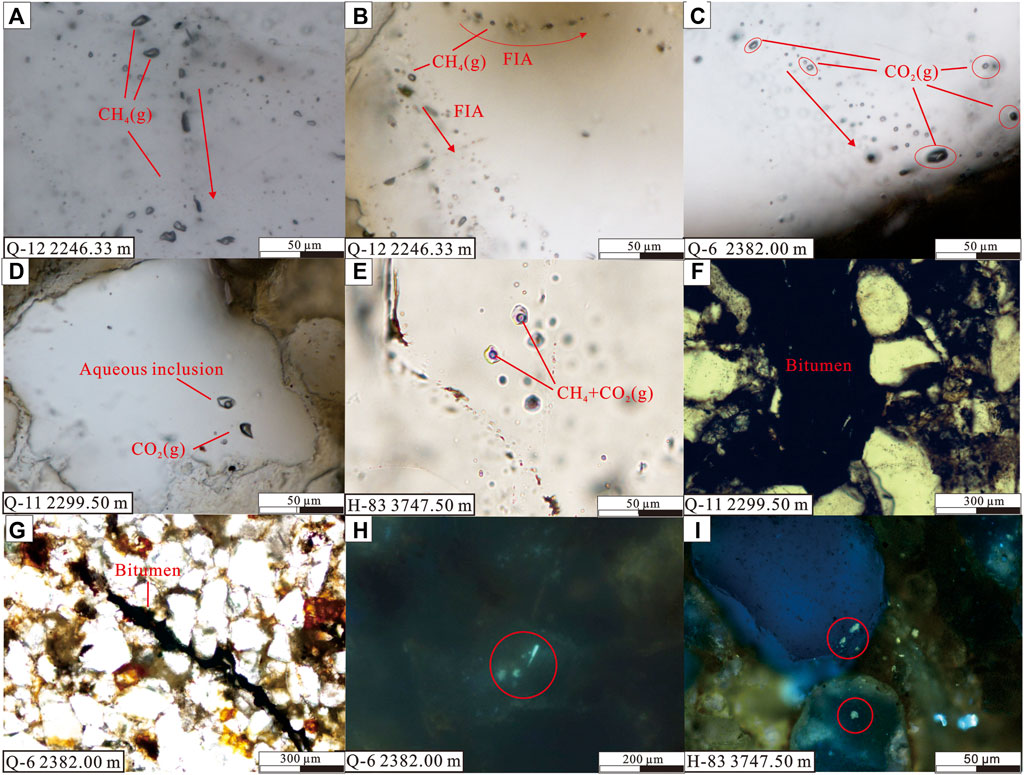
FIGURE 5. Typical microphotographs of fluid inclusions in the western slope belt of Dongpu Sag: (A,B) single-gas phase inclusions distributed along microfractures or in quartz grains; (C,D) CO2 gaseous inclusions arranged in the same direction in microfractures or coexisting with dissolved CO2 aqueous inclusions in quartz; (E) CH4 and CO2 dissolved aqueous inclusions exist in quartz; (F,G) bitumen as band shapes exist in pores of mineral grains; (H) blue-green fluorescent liquid hydrocarbon inclusions are located inside quartz particles; (I) yellow fluorescent liquid hydrocarbon inclusions are located in the interior of quartz overgrowths. Component identification of gas inclusions based on Raman spectroscopy qualitative analysis.
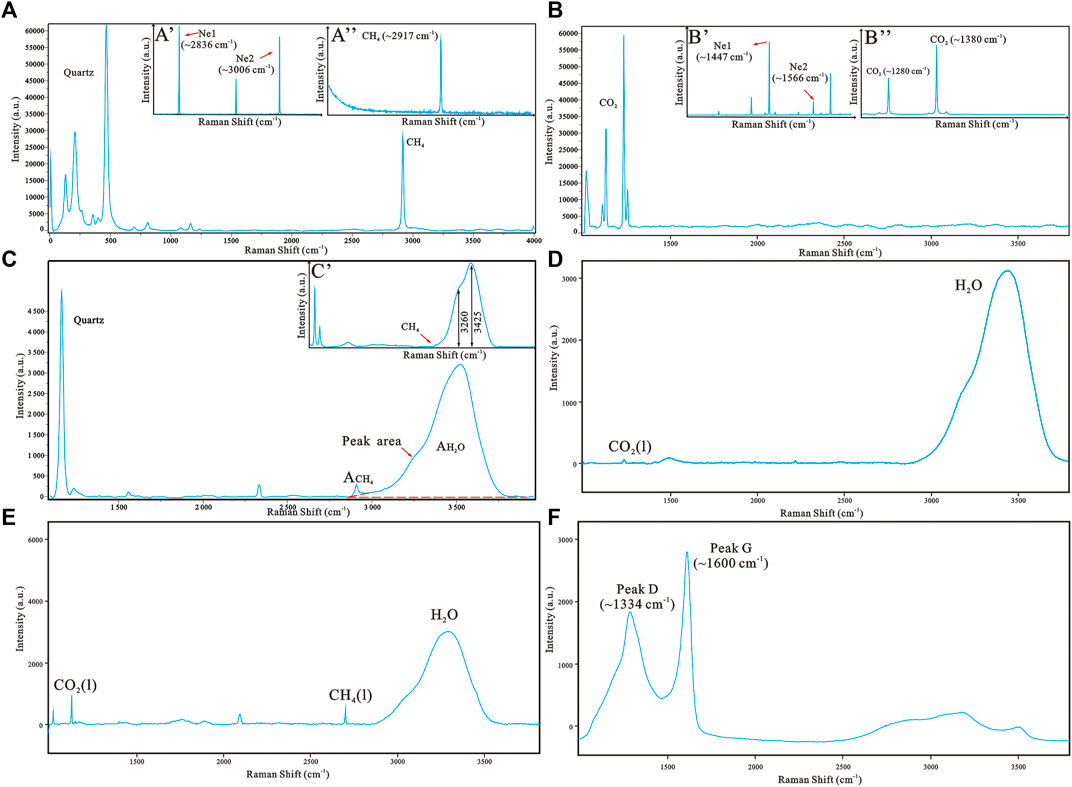
FIGURE 6. Classical Raman spectra of CH4- and CO2-bearing fluid inclusions: (A) spectra of the pure CH4 component collected using the 300 gr.mm−1 grating in quartz [the CH4 symmetric stretching band (v1) peak was collected using the 1,800 gr.mm−1 grating with a Ne lamp]; (B) spectra of the pure CO2 component collected using the 300 gr.mm−1 grating in quartz [the CO2 Fermi double peak was collected using the 1,800 gr.mm−1 grating with a Ne lamp]; (C) spectra of CH4–H2O–NaCl components collected using the 300 gr.mm−1 grating obtained in the homogeneous state [(C′) is the spectra of the liquid part at room temperature]; (D) spectra of CO2–H2O–NaCl components collected using the 300 gr.mm−1 grating obtained in the homogeneous state; (E) spectra of CH4–CO2–H2O–NaCl components collected using the 300 gr.mm−1 grating obtained in the homogeneous state; (F) G (∼1334 cm−1) and D (∼1600 cm−1) peaks of bitumen were collected at room temperature.
These single-vapor (VCH4) inclusions are most abundant in microfractures or occur in the overgrowths and are usually coeval with dissolved CH4 aqueous inclusions (Figures 5A,B), representing secondary generation. The diameters vary from 8 to 15 μm with rectangular or irregular shapes.
This type of inclusion is one-phase CO2 gas inclusions coexisting with CO2-dissolved aqueous inclusions found along healed microfractures and quartz overgrowths (Figures 5C,D), implying a secondary origin. The diameters range from 10 to 17 μm. The sizes and shapes of primary and secondary inclusions do not significantly differ.
With the spectral collection of homogeneous inclusions, dissolved CO2 and CH4 aqueous inclusions are found in quartz grains. They generally have elliptical to circular shapes (Figure 5E). The diameters range from 10 to 17 μm.
These inclusions are two-phase (L and V) petroleum inclusions. The characteristics of QF535 and λmax show saffron yellow and pale blue fluorescence. They are distributed along microfractures or occur in clusters (Figures 5H,I), implying primary and secondary origins. The diameters range from 7 to 15 μm. These HC inclusions are irregular, elliptical, and rod-shaped.
The abundance statistics of different component types of fluid inclusions have indicative significance for the fluid activity characteristics of reservoirs (Figure 7). The low abundance of CH4 and CO2 gas inclusions accounts for only 3% in well H-83 of step I. Blue and yellow fluorescent inclusions accounted for 51% and 46%, respectively. The abundance of blue fluorescent inclusions in each well in step II was low (2%), while that of CH4 and CO2 gas was high (61%), and that of yellow fluorescent oil accounted for 37%.
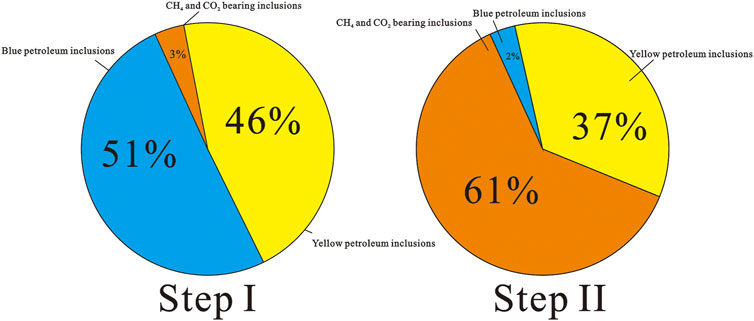
FIGURE 7. Statistics of the abundance of different types of inclusions in different structural steps.
Aqueous fluid inclusions coeval with CH4 and CO2 inclusions in quartz were selected for salinity measurements by the method of height ratio (I3425/I3260) calculation of the water band. Secondary aqueous fluid inclusions coeval with petroleum inclusions were heated to a homogeneous state by the disappearance of the vapor bubble. The salinities (wt% NaCl equivalent) of these fluid inclusions were calculated based on their final ice-melting temperatures (Tm, ice; Bodnar, 1993). Figures 8A–D show the statistical distribution of salinity and homogenization temperature of different types of inclusions in each well located in step I and Step II, respectively. The homogenization temperature and salinity of reservoir inclusions in step I have the following characteristics. The homogenization temperatures of aqueous inclusions, which are coeval with CO2 and CH4 gas inclusions, range from 110 to 130°C (Figure 8A). The salinity interval of these water-rich inclusions varies between 2.7 and 4.9 wt% NaCleq (Figure 8B). The bimodal Th distribution of aqueous inclusions coeval with yellow petroleum inclusions is 110–130°C, and that coeval with blue petroleum inclusions is 150–160°C. The Tm, ice of these water-rich inclusions varies between –2.6 and –5.2°C, with a salinity interval of 4.7–8.1 wt% NaCleq. In wells Q-6, Q-11, and Q-12, the homogenization temperatures of aqueous inclusions, which are coeval with CH4 gas inclusions, range from 95 to 110°C (Figure 8C). The salinity interval of these water-rich inclusions varies between 3.5 and 5.3 wt% NaCleq. The homogenization temperatures of aqueous inclusions, which are coeval with CO2 gas inclusions, range from 90 to 100°C and 105 to 110°C. The salinity interval is 3.4–7.3 wt% NaCleq. The bimodal Th distribution of aqueous inclusions coeval with yellow petroleum inclusions is 115–130°C, and that coeval with blue petroleum inclusions is 100–110°C. The Tm, ice of these water-rich inclusions varies between –2.3 and –9.8°C, with salinity intervals of 3.9–13.7 wt% (Figure 8D).
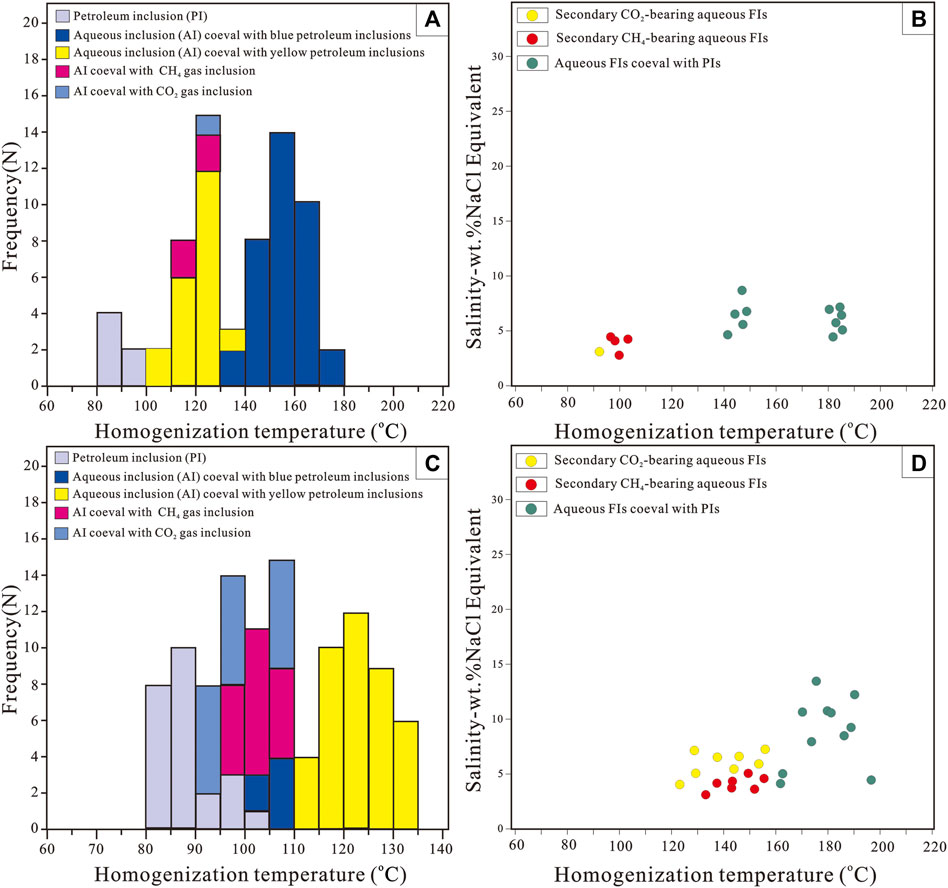
FIGURE 8. Homogenization temperature and salinity statistics of aqueous inclusions coeval with CO2, CH4, and petroleum inclusions in detrital grains in the Es32 Formation of step I (A,B) and step II (C,D).
The pressure and density of secondary CH4 gas fluid inclusions in quartz can be measured using quantitative Raman analysis. Figures 6A,C exhibit the typical Raman spectrum of CH4-system fluid inclusions, which were classified based on the petrographic characteristics and compositions in a homogeneous state. Table 1 lists the data for 15 pure CH4 inclusions (in type I), including their densities, obtained from the C–H symmetric stretching band (v1) of methane (Figure 6A, A′ and A″). The density varies from 0.1772 to 0.1785 g/cm3 in the wells of step I (average value: 0.1779 g/cm3). The density varies from 0.1010 to 0.1339 g/cm3 in the wells of step II (average value: 0.1126 g/cm3). The homogenization pressure (Ph) is calculated using the thermodynamic model (Peng and Robinson, 1960) with consideration of the densities and Th of coeval aqueous inclusions. Ph varies from 38.00 to 38.06 MPa (average value: 38.03 MPa) in step I and from 18.29 to 25.50 MPa (average value: 20.90 MPa) in step II. Meanwhile, with the discovery of CO2-bearing inclusions (Figure 6B), 13 pure CO2 inclusions (in type II) were quantified and are shown in Table 2. The density varies from 0.608 to 0.662 g/cm3 (average value: 0.555 g/cm3) in step I and from 0.450 to 0.612 g/cm3 (average value: 0.555 g/cm3) in step II. Ph varies from 32.82 to 39.56 MPa (average value: 36.19 MPa) in step I and from 19.34 to 28.68 MPa (average value: 24.94 MPa) in step II.
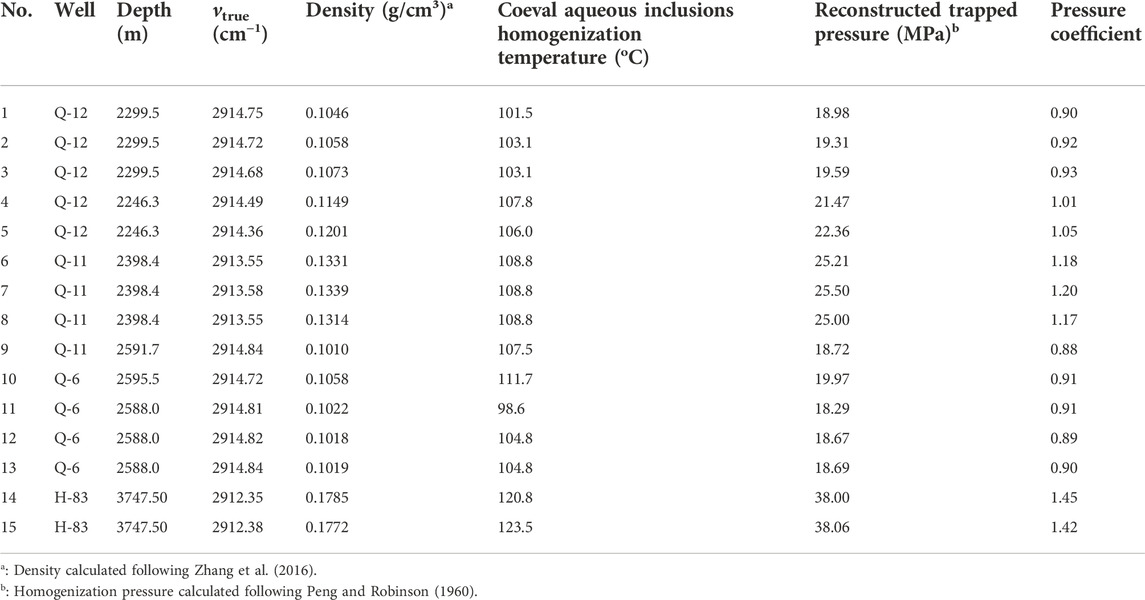
TABLE 1. Summary of Raman quantitative analysis of pure CH4 inclusions.
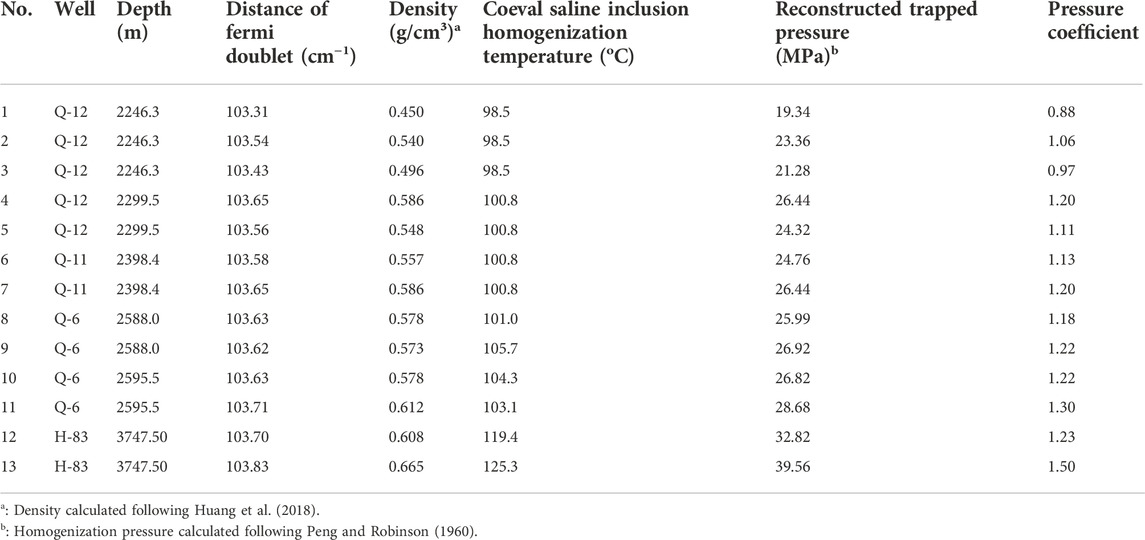
TABLE 2. Summary of Raman quantitative analysis of pure CO2 inclusions.
Tables 3, 4 show the data compilation of four dissolved CH4 inclusions in NaCl aqueous inclusions (in type I) and three dissolved CO2 inclusions in NaCl aqueous inclusions (in type I), which were analyzed by Raman spectroscopy in a homogeneous state (Figures 6C,D). The methane content (mCH4) of the dissolved methane inclusions can be determined and ranges from 0.387 to 0.690 mol/kg. The CO2 content (mCO2) of the dissolved CO2 inclusions can be mainly determined and ranges from 0.223 to 0.335 mol/kg.
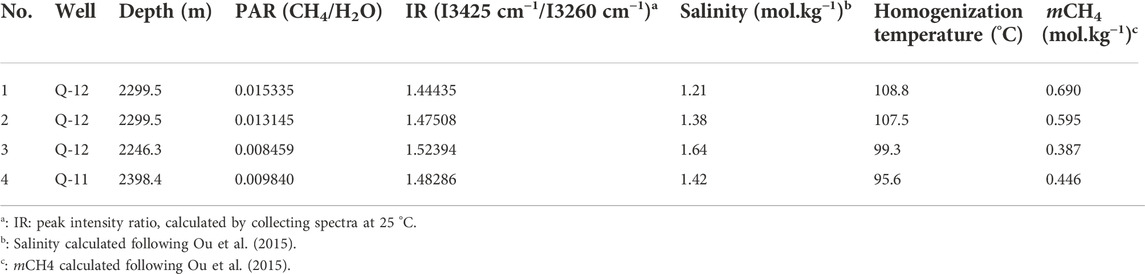
TABLE 3. Dissolved CH4 in NaCl aqueous inclusions obtained by Raman quantitative analysis.
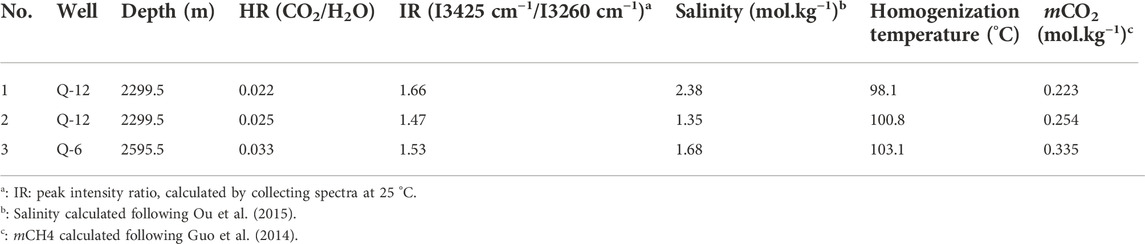
TABLE 4. Dissolved CO2 in NaCl aqueous inclusions obtained by Raman quantitative analysis.
The Raman maturity method can achieve targeted and convenient determination (e.g., organic matter in reservoir sandstone). A large amount of residual bitumen was found in the Paleocene reservoirs of the western slope belt in Dongpu Sag (Figures 5F,G). Residual bitumen is usually observed in the grain pores of quartz. The Raman peak parameters of bitumen were obtained by in situ Raman observation and software calculation, and equivalent vitrinite reflectance (EqVR%) was calculated (Table 5). In the Es32 Formation of wells Q-12, Q-11, and Q-6, the separation of the G and D peaks can be used to calculate the maturity of bitumen (Figure 6F). The EqVR% of these residual bitumen ranges between 0.67% and 1.04%. They are characterized by low maturity.
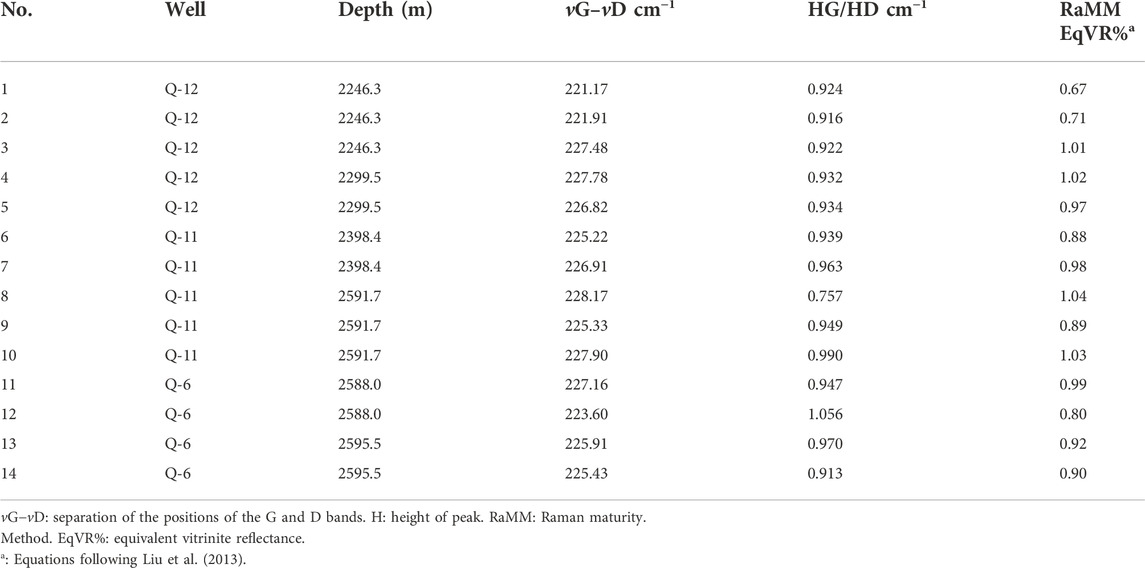
TABLE 5. Raman spectral parameters of vitrinite from Dongpu Sag samples.
According to parameters, such as homogenization temperature, petroleum inclusion composition, and bubble filling degree of oil inclusions and coexisting aqueous inclusions, the minimum trapped pressure (Pt) of inclusions can be obtained by PVTsim software simulation and fluorescence spectra (Figure 9).
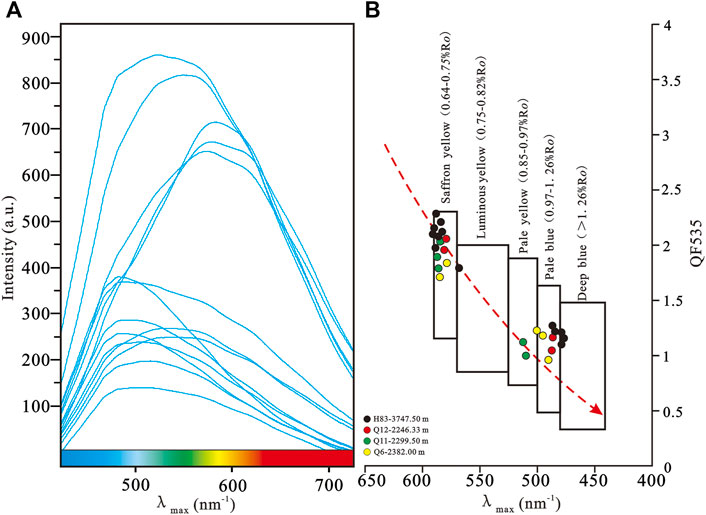
FIGURE 9. Microfluorescence spectra of liquid hydrocarbon inclusions (A) and λmax (wavelength of the maximum intensity) versus QF535 (ratio of the 535–750 nm flux to the 430–535 flux) diagram (B).
The content of CH4 (C1) in petroleum inclusions of the Es32 Formation in wells Q-6, Q-11, and Q-12 ranges from 14.92% to 30.82%, and the content of C7+ (hydrocarbons with carbon numbers over 7) varies from 43.33% to 61.08%. The oil content of petroleum inclusions varies from 80.5 to 95.7°C. The minimum trapped pressures of yellow and blue petroleum inclusions range from 19.08 to 27.87 MPa. The content of C1 in the petroleum inclusions of the Es32 Formation in the H-83 well ranges from 25.88% to 52.01%, and the content of C7+ varies from 19.98% to 48.60%. The oil content of petroleum inclusions varies from 80.5 to 88.7°C. The minimum trapped pressure of blue petroleum inclusions ranges from 42.91 to 54.46 MPa, and the minimum trapped pressure of yellow petroleum inclusions ranges from 32.76 to 34.45 MPa (Table 6).

TABLE 6. Petroleum inclusion trapped pressure analysis summary.
From the microscopic observation of the Es32 Formation in the sandstone reservoir sample, three kinds of fluid activities (petroleum, CH4, and CO2) are identified. Microthermometry was used to measure the homogenization temperature of aqueous inclusions, which was related to different types of fluid inclusions (petroleum, CH4, and CO2). The Th throwing-dot method can be used to estimate the CH4, CO2 and oil accumulation times (Figure 4) (Haszeldine et al., 1984; Horsfield and McLimans, 1984). Burial histories show the reservoir in two different steps undergoing different fluid evolution processes. In well H-83 of step I, saffron yellow petroleum inclusions with maturation ranges of 0.64–0.75% Ro accumulated at ∼32–29 Ma (Th interval: 110.0–130.0°C; yellow frame in Figure 4). CH4 and CO2 fluid accumulated at ∼24–21 Ma (Th interval: 120–130.0°C; red frame in Figure 4). Late generated oil (pale blue petroleum inclusions) with high maturation in 0.97–1.26% Ro accumulated at ∼12–0 Ma (Th interval: 150.0–160.0°C; blue frame in Figure 4). In wells Q-6, Q-11, and Q-12 of step II, saffron yellow petroleum inclusions accumulated at ∼33–30 Ma, and after the uplift and denudation of the Dongying movement, the source rocks were buried deep again. Secondary oil generation accumulated at 4–0 Ma (Th interval: 115.0–125.0°C; yellow frame in Figure 4). Low-abundance pale blue petroleum inclusions and high-abundance CH4 and CO2 gas inclusions are observed, which accumulated at ∼28–20 Ma (Th interval: 95.0–110.0°C; red and blue frame in Figure 4).
Currently, all development wells in step I and step II produce oil and no natural gas. In each well of step II, except for the discovery of multistage petroleum fluids, the greatest significance is that a large abundance of CH4- and CO2-gas-bearing inclusions is detected in situ by LRM spectroscopy. At the same time, a large amount of bitumen fills the grain pores of the sandstone reservoir. The EqVR% of bitumen ranges from 0.67% to 1.04%. According to the vitrinite reflectivity and occurrence, it belongs to the degraded and oxidized bitumen formed in situ. The coexistence of CH4 and CO2 gas in fluid inclusions indicates that the early oil in the reservoir underwent degradation and oxidation. Crude oil with a high carbon number will produce many light components (mainly methane) and CO2 after degradation and leave low-maturity bitumen in situ (Revesz et al., 1995; Head et al., 2010). The CH4 and CO2 fluid trapping period occurred after the first stage of the oil charging event. At this time, step II of the western slope belt experienced a strong uplifting structure and erosion because of the Dongying movement. Strong tectonic movement over a short period of time causes the opening of the fault and the exposure of crude oil. The Dongying movement has different tectonic control functions for different fault blocks. Compared with step II, step I has a very weak tectonic uplift and denudation, and the differences in the abundance of CH4 and CO2 gas inclusions in the two regions are also indicative (Figure 7).
Aqueous inclusions are simultaneously observed alongside gas/petroleum inclusions, indicating that immiscible FIAs were trapped during mineral crystallization (Roedder, 1984; Goldstein, 1986; Diamond, 2001; Hurai, 2010). Isochore calculations of fluid trapped pressure follow the approach of a two-phase immiscible field (Pironon, 1990; Thiery et al., 2000; Gao et al., 2017). Based on the combination of the Raman spectra with the relevant thermodynamic model (Peng and Robinson, 1960; Duan and Mao, 2006), the component concentration and density of the water-rich and gas-rich phases can be obtained (Dubessy et al., 2001; Becker et al., 2008; Lecumberri-Sanchez et al., 2012; Mao et al., 2013).
In petroliferous sedimentary basins, reservoir pore fluids usually consist of oil, gas, and formation water. Pore fluid pressure is one of the key parameters for reservoir fluid evaluation. The parameters of the formation fluid pressure and pressure coefficient are usually used in pore pressure characterization. The formation fluid pressure coefficient (Pc) here refers to the ratio of the actual formation fluid pressure (Pf) to the hydrostatic pressure (Phyd) at the same depth. It is a main parameter used to identify abnormal formation pressure (Law and Spencer, 1998). In this study, measured formation pressure and temperature data sets from drill stem tests (DSTs) were supplied by the SINOPEC Zhongyuan Oilfield (Figure 3). The current measured pressure coefficient of the Es32 Formation ranges from 1.50 to 1.66 (high overpressure) in step I and from 0.95 to 1.02 (normal pressure) in step II (Table 6). The trapped pressure of fluid inclusions represents the pore fluid pressure in the initial conditions (Parry and Bruhn, 1990; Evans, 1995). Recovering the paleo-pressure of pure CH4 and CO2 gas inclusions by Raman spectroscopy quantitative analysis and the minimum trapped pressure of petroleum inclusions calculated by the predictive model, we obtained the pressure evolution of the two stages of the oil charging event and one gas charging event in different tectonic units (Figure 10). In the early Oligocene, step I and step II entered the basin rifting stage, and the source rock was in the middle stage of oil generation. Saffron yellow petroleum inclusions are largely trapped in reservoir sandstone. The reservoir maintains moderate overpressure with a pressure coefficient between 1.25 and 1.28. In the middle Oligocene, and the Dongying movement resulted in severe uplift and denudation of step II. The late Oligocene–Miocene oil reservoir degraded into CH4 and CO2 gas reservoirs, and the reservoir pore pressure decreased (average Pc: 1.20). The wells of step I have only minor uplift denudation. With the reburial of the Es3 Formation, step I entered late oil generation in the late Miocene, and the maturity simulation was basically the same as the maturity of the pale blue petroleum inclusions. The pore pressure of the reservoir is approximately 1.67, which is at high overpressure conditions, and step II enters the middle stage of oil generation again (Ro%: 0.5–0.7). The maturity of late crude oil is consistent with that of trapped saffron yellow petroleum inclusions. Reservoirs maintain normal pressure conditions (average Pc: 0.90).
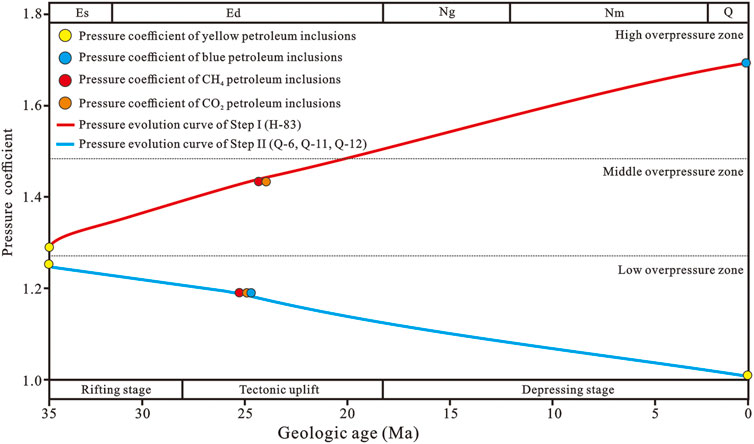
FIGURE 10. Pressure coefficient evolutionary process of fluid inclusions in the Es32 Formation in different tectonic steps of the western slope belt of Dongpu Sag.
In this research, multifarious paleo-fluids occurring in the sandstone reservoir of the Shahejie Formation provide information to pursue the pressure–temperature–time–composition (P–T–t–X). According to the previously mentioned results, the following conclusions can be reached:
1) Based on in situ Raman characteristic peak observations, fluorescence spectrum analysis, and microthermometry measurements, the fluid charging sequence of fluids in two types of reservoirs with different pressure states in Dongpu Sag is determined. The combination of the Th throwing-dot method and buried and thermal models can be used to constrain the gas or oil accumulation times. In well H-83 of step I (high overpressure reservoir), saffron yellow petroleum inclusions of low maturation accumulated in the early Oligoene (Th interval: 110.0–130.0°C). CH4 and CO2 fluid accumulated at ∼24–21 Ma (density of CH4 gas inclusions: 0.1772–0.1785 g/cm3; density of CO2 gas inclusions: 0.608–0.665 g/cm3). Late generated oil (pale blue petroleum inclusions) with high maturation accumulated at ∼12–0 Ma (Th interval: 150.0–160.0°C). In wells Q-6, Q-11, and Q-12 of step II (normal pressure reservoir), saffron yellow petroleum inclusions accumulated at ∼33–30 Ma, and after the uplift and denudation of the Dongying movement, the source rocks were buried deep again. Secondary oil generation accumulated at 4–0 Ma (Th interval: 115.0–125.0°C). Low-abundance pale blue petroleum inclusions and high-abundance CH4 and CO2 gas inclusions are observed, which accumulated at ∼28–20 Ma (density of CH4 gas inclusions: 0.1010–0.1339 g/cm3; density of CO2 gas inclusions: 0.450–0.612 g/cm3).
2) The recovery of paleo-pressure of CO2 and CH4 gas inclusions by Raman quantitative analysis and the minimum trapped pressure of oil inclusions were determined. Both types of oil reservoirs existed in the early Oligocene under medium-overpressure conditions (Pc: 1.25–1.28). In the middle Oligocene, the Dongying movement resulted in different degrees of uplift and denudation in the two types of reservoirs, causing the reservoir to change to different pressure preservation conditions. Step I involved late oil generation in the late Miocene, and the maturity simulation was basically the same as the maturity of the pale blue petroleum inclusions. The pore pressure of the reservoir is approximately 1.67, which is under high-overpressure conditions. Because of the degradation and oxidation of crude oil in the early stage of step II, the fault destroys the reservoir and produces a large amount of CO2 and CH4 gas inclusions (Pc: ∼1.20). The oil reservoir approaches normal pressure conditions. With the reburial of the Es3 Formation, step II entered the middle stage of oil generation again (Ro%: 0.5–0.7). The maturity of late crude oil is consistent with that of trapped saffron yellow petroleum inclusions. Reservoirs maintain normal pressure conditions (average Pc: 0.90).
The original contributions presented in the study are included in the article/Supplementary Material; further inquiries can be directed to the corresponding author.
YT: conceptualization, methodology, software, investigation, and writing—original draft. YW: Data processing and chart drawing. RW: validation, formal analysis, and visualization. YH: review and editing. YX: provided core and data. ZC: Review. TX: validation, formal analysis, and review and editing. TW: review and editing. HL: review and editing. All authors reviewed the article.
This paper was funded by the State Key Laboratory of Organic Geochemistry (Grant No. SKLOG202016), the Open Fund of the State Key Laboratory of Oil and Gas Reservoir Geology and Exploitation (Chengdu University of Technology) (Grant No. PLC20210206), the Joint Fund for Enterprise Innovation and Development (Grant No. U20B6001), and the National Natural Science Foundation of China (detection of phenylpolycyclic aromatic hydrocarbons and its petroleum geochemical significance) (Grant No. 41972148).
We thank the editor and reviewer for their constructive comments.
TX was employed by the SINOPEC Zhongyuan Oilfield Company.
The remaining authors declare that the research was conducted in the absence of any commercial or financial relationships that could be construed as a potential conflict of interest.
All claims expressed in this article are solely those of the authors and do not necessarily represent those of their affiliated organizations, or those of the publisher, the editors, and the reviewers. Any product that may be evaluated in this article, or claim that may be made by its manufacturer, is not guaranteed or endorsed by the publisher.
Azbej, T., Severs, M. J., Rusk, B. G., and Bodnar, R. J. (2007). In situ quantitative analysis of individual H2O–CO2 fluid inclusions by laser Raman spectroscopy. Chem. Geol. 237, 255–263. doi:10.1016/j.chemgeo.2006.06.025
Baumgartner, M., and Bakker, R. J. (2009). Raman spectroscopy of pure H2O and NaCl-H2O containing synthetic fluid inclusions in quartz—A study of polarization effects. Mineral. Pet. 95, 1–15. doi:10.1007/s00710-008-0028-z
Becker, S. P., Fall, A., and Bodnar, R. J. (2008). Synthetic fluid inclusions. XVII. PVTX properties of high salinity H2O-NaCl solutions (> 30 wt% NaCl): Application to fluid inclusions that homogenize by halite disappearance from porphyry copper and other hydrothermal ore deposits. Econ. Geol. 103, 539–554. doi:10.2113/gsecongeo.103.3.539
Bodnar, R. J. (1993). Revised equation and table for determining the freezing point depression of H2O-NaCl solutions. Geochim. Cosmochim. Acta 57, 683–684. doi:10.1016/0016-7037(93)90378-a
Burke, E. A. J. (2001). Raman microspectrometry of fluid inclusions. Lithos 55, 139–158. doi:10.1016/s0024-4937(00)00043-8
Burruss, R. C. (1987). Diagenetic palaeotemperatures from aqueous fluid inclusions: Re-equilibration of inclusions in carbonate cements by burial heating. Mineral. Mag. 51, 477–481. doi:10.1180/minmag.1987.051.362.02
Burruss, R. C. (1991). Practical aspects of fluorescence microscopy of petroleum fluid inclusions. Oklahoma, United States: SEPM.
Caumon, M.-C., Robert, P., Laverret, E., Tarantola, A., Randi, A., Pironon, J., et al. (2014). Determination of methane content in NaCl–H2O fluid inclusions by Raman spectroscopy. Calibration and application to the external part of the Central Alps (Switzerland). Chem. Geol. 378–379, 52–61. doi:10.1016/j.chemgeo.2014.03.016
Caumon, M.-C., Tarantola, A., and Mosser-Ruck, R. (2015). Raman spectra of water in fluid inclusions: I. Effect of host mineral birefringence on salinity measurement. J. Raman Spectrosc. 46, 969–976. doi:10.1002/jrs.4708
Chang, Y.-J., and Huang, W.-L. (2008). Simulation of the fluorescence evolution of “live” oils from kerogens in a diamond anvil cell: Application to inclusion oils in terms of maturity and source. Geochim. Cosmochim. Acta 72, 3771–3787. doi:10.1016/j.gca.2008.05.041
Diamond, L. W. (2001). Review of the systematics of CO2-H2O fluid inclusions. Lithos 55, 69–99. doi:10.1016/s0024-4937(00)00039-6
Dickinson, G. (1953). Geological aspects of abnormal reservoir pressures in Gulf Coast Louisiana. AAPG Bull. 37, 410–432.
Duan, Z., and Mao, S. (2006). A thermodynamic model for calculating methane solubility, density and gas phase composition of methane-bearing aqueous fluids from 273 to 523K and from 1 to 2000bar. Geochim. Cosmochim. Acta 70, 3369–3386. doi:10.1016/j.gca.2006.03.018
Duan, Z., Møller, N., and Weare, J. H. (2003). Equations of state for the NaCl-H2O-CH4 system and the NaCl-H2O-CO2-CH4 system : Phase equilibria and volumetric properties above 573 k. Geochim. Cosmochim. Acta 67, 671–680. doi:10.1016/s0016-7037(02)01226-7
Duan, Z., and Sun, R. (2003). An improved model calculating CO2 solubility in pure water and aqueous NaCl solutions from 273 to 533 K and from 0 to 2000 bar. Chem. Geol. 193, 257–271. doi:10.1016/s0009-2541(02)00263-2
Dubessy, J., Buschaert, S., Lamb, W., Pironon, J., and Thiéry, R. (2001). Methane-bearing aqueous fluid inclusions: Raman analysis, thermodynamic modelling and application to petroleum basins. Chem. Geol. 173, 193–205. doi:10.1016/s0009-2541(00)00275-8
Dubessy, J., Caumon, M. C., Rull, F., and Sharma, S. (2012). Instrumentation in Raman spectroscopy: Elementary theory and practice. Eur. Mineral. Union Notes Mineral. 12, 83–172.
Dubessy, J., Poty, B., and Ramboz, C. (1989). Advances in COHNS fluid geochemistry based on micro-Raman spectrometric analysis of fluid inclusions. Eur. J. Mineral. 1, 517–534. doi:10.1127/ejm/1/4/0517
Evans, M. A. (1995). Fluid inclusions in veins from the Middle Devonian shales: A record of deformation conditions and fluid evolution in the Appalachian Plateau. Geol. Soc. Am. Bull. 107, 327–339.
Fabre, D., and Couty, R. (1986). Investigation on the density effects in the Raman-spectrum of methane up to 3, 000 bar-application to the determination of pressure in fluid inclusions trapped in minerals. COMPTES RENDUS Acad. Sci. Ser. II 303, 1305–1308.
Gao, J., He, S., Zhao, J., and Yi, J. (2017). Geothermometry and geobarometry of overpressured lower Paleozoic gas shales in the Jiaoshiba field, Central China: Insight from fluid inclusions in fracture cements. Mar. Pet. Geol. 83, 124–139. doi:10.1016/j.marpetgeo.2017.02.018
Gao, Z., Fan, Y., Xuan, Q., and Zheng, G. (2020). A review of shale pore structure evolution characteristics with increasing thermal maturities. Adv. Geo-Energy Res. 4 (4), 247–259. doi:10.46690/ager.2020.03.03
Gay, A., Lopez, M., Berndt, C., and Seranne, M. (2007). Geological controls on focused fluid flow associated with seafloor seeps in the Lower Congo Basin. Mar. Geol. 244, 68–92. doi:10.1016/j.margeo.2007.06.003
Goldstein, R. H. (2001). Fluid inclusions in sedimentary and diagenetic systems. Lithos 55, 159–193. doi:10.1016/s0024-4937(00)00044-x
Goldstein, R. H. (2003). Petrographic analysis of fluid inclusions. Fluid Incl. Anal. Interpret. 32, 9–53.
Goldstein, R. H. (1986). Reequilibration of fluid inclusions in low-temperature calcium-carbonate cement. Geol. 14, 792–795. doi:10.1130/0091-7613(1986)14<792:rofiil>2.0.co;2
Guillaume, D., Teinturier, S., Dubessy, J., and Pironon, J. (2003). Calibration of methane analysis by Raman spectroscopy in H2O–NaCl–CH4 fluid inclusions. Chem. Geol. 194, 41–49. doi:10.1016/s0009-2541(02)00270-x
Guo, H., Wang, Z., Wang, B., Zhang, Y., Meng, H., and Sui, H. (2022). Molecular dynamics simulations of oil recovery from dolomite slit nanopores enhanced by CO2 and N2 injection. Adv. Geo-Energy Res. 6 (6), 306–313. doi:10.46690/ager.2022.04.05
Guo, H., Ying, C., Hu, Q., Lu, W., Ou, W., and Geng, L. (2014). Quantitative Raman spectroscopic investigation of geo-fluids high-pressure phase equilibria: Part I. Accurate calibration and determination of CO2 solubility in water from 273.15 to 573.15 K and from 10 to 120 MPa. Fluid Phase Equilibria 382, 70–79. doi:10.1016/j.fluid.2014.08.032
Guo, X., He, S., Liu, K., and Zheng, L. (2011). Quantitative estimation of overpressure caused by oil generation in petroliferous basins. Org. Geochem. 42, 1343–1350. doi:10.1016/j.orggeochem.2011.08.017
Haszeldine, R. S., Samson, I. M., and Cornford, C. (1984). Dating diagenesis in a petroleum basin, a new fluid inclusion method. Nature 307, 354–357. doi:10.1038/307354a0
Head, I. M., Larter, S. R., Gray, N. D., Sherry, A., Adams, J. J., Aitken, C. M., et al. (2010). Hydrocarbon degradation in petroleum reservoirs. Handb. Hydrocarb. Lipid Microbiol. 2010, 3097–3109.
Horsfield, B., and McLimans, R. K. (1984). Geothermometry and geochemistry of aqueous and oil-bearing fluid inclusions from Fateh Field, Dubai. Org. Geochem. 6, 733–740. doi:10.1016/0146-6380(84)90094-9
Huang, Y., Tarantola, A., Wang, W., Caumon, M.-C., Pironon, J., Lu, W., et al. (2018). Charge history of CO2 in Lishui sag, East China Sea basin: Evidence from quantitative Raman analysis of CO2-bearing fluid inclusions. Mar. Pet. Geol. 98, 50–65. doi:10.1016/j.marpetgeo.2018.07.030
Hurai, V. (2010). Fluid inclusion geobarometry: Pressure corrections for immiscible H2O–CH4 and H2O-CO2 fluids. Chem. Geol. 278, 201–211. doi:10.1016/j.chemgeo.2010.09.014
Kawakami, Y., Yamamoto, J., and Kagi, H. (2003). Micro-Raman densimeter for CO2 inclusions in mantle-derived minerals. Appl. Spectrosc. 57, 1333–1339. doi:10.1366/000370203322554473
Law, B. E., and Spencer, C. W. (1998). Memoir 70, chapter 1: Abnormal pressure in hydrocarbon environments. Oklahoma, United States: AAPG.
Lecumberri-Sanchez, P., Steele-MacInnis, M., and Bodnar, R. J. (2012). A numerical model to estimate trapping conditions of fluid inclusions that homogenize by halite disappearance. Geochim. Cosmochim. Acta 92, 14–22. doi:10.1016/j.gca.2012.05.044
Li, H., Tang, H. M., Qin, Q. R., Zhou, J. L., Qin, Z. J., Fan, C. H., et al. (2019). Characteristics, formation periods and genetic mechanisms of tectonic fractures in the tight gas sandstones reservoir: A case study of Xujiahe Formation in YB area, Sichuan Basin, China. J. Pet. Sci. Eng. 178, 723–735. doi:10.1016/j.petrol.2019.04.007
Li, H., Zhou, J. L., Mou, X. Y., Guo, H. X., Wang, X. X., An, H. Y., et al. (2022). Pore structure and fractal characteristics of the marine shale of the Longmaxi Formation in the Changning area, Southern Sichuan Basin, China. Front. Earth Sci. 10, 1018274. doi:10.3389/feart.2022.1018274
Li, R. F., Chen, L. Q., Li, Y. J., and Song, N. (2010). The thermal history reconstruction and hydrocarbon accumulation period discrimination of Gaoyou depression in Subei Basin. Earth Sci. Front. 17, 151–159.
Liu, D., Xiao, X., Tian, H., Min, Y., Zhou, Q., Cheng, P., et al. (2013). Sample maturation calculated using Raman spectroscopic parameters for solid organics: Methodology and geological applications. Chin. Sci. Bull. 58, 1285–1298. doi:10.1007/s11434-012-5535-y
Liu, J., Liu, T., Jiang, Y., Wan, T., and Liu, R. (2019). Distribution, origin, and evolution of overpressure in the Shahejie Formation of northern Dongpu depression, Bohai Bay Basin, China. J. Pet. Sci. Eng. 181, 106219. doi:10.1016/j.petrol.2019.106219
Lu, W., Chou, I.-M., Burruss, R. C., and Song, Y. (2007). A unified equation for calculating methane vapor pressures in the CH4–H2O system with measured Raman shifts. Geochim. Cosmochim. Acta 71, 3969–3978. doi:10.1016/j.gca.2007.06.004
Luo, Y., Liu, H., Zhao, Y., Wang, Y., Zhang, J., and Lü, X. (2016). Reevaluation of the origin of overpressure in the inter-salt shale-oil reservoir in Liutun Sag, Dongpu Depression, China. J. Pet. Sci. Eng. 146, 1092–1100. doi:10.1016/j.petrol.2016.08.011
Mao, S., Hu, J., Zhang, D., and Li, Y. (2013). Thermodynamic modeling of ternary CH2-H2O-NaCl fluid inclusions. Chem. Geol. 335, 128–135. doi:10.1016/j.chemgeo.2012.11.003
Mclimans, R. K. (1987). The application of fluid inclusions to migration of oil and diagenesis in petroleum reservoirs. Appl. Geochem. 2, 585–603. doi:10.1016/0883-2927(87)90011-4
Munz, I. A. (2001). Petroleum inclusions in sedimentary basins: Systematics, analytical methods and applications. Lithos 55, 195–212. doi:10.1016/s0024-4937(00)00045-1
Munz, I. A., Wangen, M., Girard, J.-P., Lacharpagne, J.-C., and Johansen, H. (2004). Pressure–temperature–time–composition (P–T–t–X) constraints of multiple petroleum charges in the Hild field, Norwegian North Sea. Mar. Pet. Geol. 21, 1043–1060. doi:10.1016/j.marpetgeo.2004.05.006
Osborne, M., and Haszeldine, S. (1993). Evidence for resetting of fluid inclusion temperatures from quartz cements in oilfields. Mar. Pet. Geol. 10, 271–278. doi:10.1016/0264-8172(93)90109-6
Ou, W., Guo, H., Lu, W., Wu, X., and Chou, I.-M. (2015). A re-evaluation of the effects of temperature and NaCl concentration on quantitative Raman spectroscopic measurements of dissolved CH4 in NaCl aqueous solutions: Application to fluid inclusion analysis. Chem. Geol. 417, 1–10. doi:10.1016/j.chemgeo.2015.09.018
Parry, W. T., and Bruhn, R. L. (1990). Fluid pressure transients on seismogenic normal faults. Tectonophysics 179, 335–344. doi:10.1016/0040-1951(90)90299-n
Peng, D. Y., and Robinson, D. B. (1960). A new two-constant equation of state. Minerva Ginecol. 12, 3069–3078.
Ping, H., Chen, H., and Thiéry, R. (2013). Thermodynamic modeling of petroleum inclusions: Composition modeling and prediction of the trapping pressure of crude oils. Fluid Phase Equilibria 346, 33–44. doi:10.1016/j.fluid.2013.02.016
Ping, H., Chen, H., Zhai, P., Junzhang, Z., and Simon, C. G. (2019). Petroleum charge history in the Baiyun depression and Panyu lower uplift in the Pearl River Mouth Basin, northern South China Sea: Constraints from integration of organic geochemical and fluid inclusion data. Am. Assoc. Pet. Geol. Bull. 103, 1401–1442. doi:10.1306/11151817369
Pironon, J., and Bourdet, J. (2008). Petroleum and aqueous inclusions from deeply buried reservoirs: Experimental simulations and consequences for overpressure estimates. Geochim. Cosmochim. Acta 72, 4916–4928. doi:10.1016/j.gca.2008.07.019
Pironon, J., Grimmer, J. O. W., Teinturier, S., Guillaume, D., and Dubessy, J. (2003). Dissolved methane in water: Temperature effect on Raman quantification in fluid inclusions. J. Geochem. Explor. 78–79, 111–115. doi:10.1016/s0375-6742(03)00136-5
Pironon, J. (1990). Synthesis of hydrocarbon fluid inclusions at low temperature. Am. Mineral. 75, 226–229.
Revesz, K., Coplen, T. B., Baedecker, M. J., Glynn, P. D., and Hult, M. (1995). Methane production and consumption monitored by stable H and C isotope ratios at a crude oil spill site, Bemidji, Minnesota. Appl. Geochem. 10, 505–516. doi:10.1016/0883-2927(95)00021-6
Rosso, K. M., and Bodnar, R. J. (1995). Microthermometric and Raman spectroscopic detection limits of CO2 in fluid inclusions and the Raman spectroscopic characterization of CO2. Geochim. Cosmochim. Acta 59, 3961–3975. doi:10.1016/0016-7037(95)94441-h
Saimd, T., and Ali, M. (2006). A comparative study of the Rare Earth Element (REE) distributions within the Lower Cretaceous dolomites and limestones of Central Tunisia. Sedimentology 32, 897–907. doi:10.1111/j.1365-3091.1985.tb00739.x
Seitz, J. C., Pasteris, J. D., and Chou, I. M. (1993). Raman spectroscopic characterization of gas mixtures; I, Quantitative composition and pressure determination of CH4, N2 and their mixtures. Am. J. Sci. 293, 297–321. doi:10.2475/ajs.293.4.297
Seitz, J. C., Pasteris, J. D., and Chou, I. M. (1996). Raman spectroscopic characterization of gas mixtures; II, Quantitative composition and pressure determination of the CO2-CH4 system. Am. J. Sci. 296, 577–600. doi:10.2475/ajs.296.6.577
Song, F., Ye, J., and Shen, C. (2010). Hydrocarbon filling history in the western slope belt of Dongpu depression. Nat. Gas. Geosci. 21, 264–269.
Thiery, R., Pironon, J., Walgenwitz, F., and Montel, F. (2000). PIT (petroleum inclusion thermodynamic): A new modeling tool for the characterization of hydrocarbon fluid inclusions from volumetric and microthermometric measurements. J. Geochem. Explor. 69, 701–704. doi:10.1016/s0375-6742(00)00085-6
Tingay, M. R., Hillis, R. R., Swarbrick, R. E., Morley, C. K., and Damit, A. R. (2009). Origin of overpressure and pore-pressure prediction in the Baram province, Brunei. Am. Assoc. Pet. Geol. Bull. 93, 51–74. doi:10.1306/08080808016
Van den Kerkhof, A. M., and Hein, U. F. (2001). Fluid inclusion petrography. Lithos 55, 27–47. doi:10.1016/s0024-4937(00)00037-2
Wang, R., Ding, W., Zhang, Y., Wang, Z., Wang, X., He, J., et al. (2016a). Analysis of developmental characteristics and dominant factors of fractures in Lower Cambrian marine shale reservoirs: A case study of Niutitang Formation in Cen’gong block, southern China. J. Petroleum Sci. Eng. 138, 31–49. doi:10.1016/j.petrol.2015.12.004
Wang, R., Gu, Y., Ding, W., Gong, D., Yin, S., Wang, X., et al. (2016b). Characteristics and dominant controlling factors of organic-rich marine shales with high thermal maturity: A case study of the Lower Cambrian Niutitang Formation in the Cen’gong block, southern China. J. Nat. Gas Sci. Eng. 33, 81–96. doi:10.1016/j.jngse.2016.05.009
Wang, W., Caumon, M.-C., Tarantola, A., Pironon, J., Lu, W., and Huang, Y. (2019). Raman spectroscopic densimeter for pure CO2 and CO2-H2O-NaCl fluid systems over a wide PT range up to 360° C and 50 MPa. Chem. Geol. 528, 119281. doi:10.1016/j.chemgeo.2019.119281
Wang, X., Chou, I. M., Hu, W., Burruss, R. C., Sun, Q., and Song, Y. (2011). Raman spectroscopic measurements of CO2 density: Experimental calibration with high-pressure optical cell (HPOC) and fused silica capillary capsule (FSCC) with application to fluid inclusion observations. Geochim. Cosmochim. Acta 75, 4080–4093. doi:10.1016/j.gca.2011.04.028
Weibull, W., Mienert, J., Bünz, S., and Hustoft, S. (2010). Fluid migration directions inferred from gradient of time surfaces of the sub seabed. Mar. Pet. Geol. 27, 1898–1909. doi:10.1016/j.marpetgeo.2010.07.014
Wilkins, R. W. T., Boudou, R., Sherwood, N., and Xiao, X. (2014). Thermal maturity evaluation from inertinites by Raman spectroscopy: The ‘RaMM’ technique. Int. J. Coal Geol. 128–129, 143–152. doi:10.1016/j.coal.2014.03.006
Wilkins, R. W. T., Sherwood, N., and Li, Z. (2018). RaMM (Raman maturity method) study of samples used in an interlaboratory exercise on a standard test method for determination of vitrinite reflectance on dispersed organic matter in rocks. Mar. Pet. Geol. 91, 236–250. doi:10.1016/j.marpetgeo.2017.12.030
Wilkins, R. W. T., Wang, M., Gan, H., and Li, Z. (2015). A RaMM study of thermal maturity of dispersed organic matter in marine source rocks. Int. J. Coal Geol. 150–151, 252–264. doi:10.1016/j.coal.2015.09.007
Wu, J., and Ye, J. (2009). Fluid history analysis in the western slope belt of Dongpu Sag. Geol. Sci. Technol. Inf. 28, 66–70.
Zhang, J., Qiao, S., Lu, W., Hu, Q., Chen, S., and Liu, Y. (2016). An equation for determining methane densities in fluid inclusions with Raman shifts. J. Geochem. Explor. 171, 20–28. doi:10.1016/j.gexplo.2015.12.003
Zozulya, A. A., Diddams, S. A., and Clement, T. S. (1998). Investigations of nonlinear femtosecond pulse propagation with the inclusion of Raman, shock, and third-order phase effects. Phys. Rev. A 58, 3303–3310. doi:10.1103/physreva.58.3303
Keywords: quantitative Raman spectroscopy, CH4 and CO2, fluid inclusion, Shahejie Formation, Dongpu Sag
Citation: Tang Y, Wu Y, Wang R, Huang Y, Xue Y, Chen Z, Xu T, Wang T and Li H (2023) Fluid evolution and paleo-pressure recovery by Raman quantitative analysis in the Shahejie Formation of the western slope belt in Dongpu Sag, Bohai Bay Basin, China. Front. Earth Sci. 10:1059909. doi: 10.3389/feart.2022.1059909
Received: 02 October 2022; Accepted: 08 November 2022;
Published: 12 January 2023.
Edited by:
Hu Li, Southwest Petroleum University, ChinaReviewed by:
Zhe Wang, China University of Geosciences Wuhan, ChinaCopyright © 2023 Tang, Wu, Wang, Huang, Xue, Chen, Xu, Wang and Li. This is an open-access article distributed under the terms of the Creative Commons Attribution License (CC BY). The use, distribution or reproduction in other forums is permitted, provided the original author(s) and the copyright owner(s) are credited and that the original publication in this journal is cited, in accordance with accepted academic practice. No use, distribution or reproduction is permitted which does not comply with these terms.
*Correspondence: Yahao Huang, aHlodHIwODkxNkAxNjMuY29t
Disclaimer: All claims expressed in this article are solely those of the authors and do not necessarily represent those of their affiliated organizations, or those of the publisher, the editors and the reviewers. Any product that may be evaluated in this article or claim that may be made by its manufacturer is not guaranteed or endorsed by the publisher.
Research integrity at Frontiers
Learn more about the work of our research integrity team to safeguard the quality of each article we publish.