- 1College of Meteorology and Oceanography, National University of Defense Technology, Changsha, China
- 2China Meteorological Administration and Key Laboratory of Numerical Modeling for Tropical Cyclone China Meteorological Administration, Shanghai Typhoon Institute, Shanghai, China
The impact of tropical cyclones (TCs) on the three-dimensional characteristics of mesoscale oceanic eddies is investigated in this study on the basis of statistical analysis by satellite-based eddy information and Argo data. By comparing the three-dimensional structure of the temperature, salinity, and geostrophic velocity in the upper ocean above 1,000 m depth, it was found that there is a heat pump effect in the changes of eddy structure similar to that in tropical cyclones. Under the forcing of TC, the abnormal signals in the strong cold core (warm core) structure originally existing in the upper layer of the cyclonic eddy (anticyclonic eddy) are transmitted to the middle and lower layers of the eddy and form retention, making the eddy structure not recover to the original state in a short period of time. To a certain extent, this shows that the influence of TC on the eddy structure is not limited to the ocean surface. At the same time, the change of barrier layer in the eddy is explored, and it was found that the barrier layer thickness in both cyclonic eddy and anticyclonic eddy has increased, which also confirms the previous research.
1 Introduction
Tropical cyclones (TCs) and mesoscale oceanic eddies are both physical phenomena that always exist and occur frequently on the vast ocean. The former are kind of devastating weather systems that originate and develop over warm ocean surface, with their energy coming mostly from sea-to-air enthalpy fluxes (Emanuel, 1986; Price, 1981; Ma and Fei, 2022). The latter are widespread throughout the ocean (cover 20%–30% of the ocean area) and are the most active form of motion in the ocean (Wang et al., 2003; Chaigneau et al., 2009; Chelton et al., 2011; Cheng et al., 2014), accounting for about 90% of the kinetic energy in the ocean (Ferrari and Wunsch, 2009). Mesoscale oceanic eddies also play pivotal roles in the distribution of ocean matter, water masses, and energy exchange between the ocean-atmosphere interface (Frenger et al., 2013; Zhang et al., 2014; Ma et al., 2016). Because of their similar geographical distribution and great contribution to ocean-atmosphere mass and energy exchange, the frequency of interactions between mesoscale eddies and tropical cyclones becomes incredibly remarkable and important, especially in regions where TCs are active. Above 90% of TCs over the western North Pacific have confronted mesoscale oceanic eddies during their lifetimes (Ma et al., 2017). In recent years, a growing number of studies have been devoted to the TC-eddy interactions.
Most studies revolve around the effects of mesoscale eddies on TC intensity. The change of TC intensity depends on the positive and negative feedback mechanism between it and the ocean surface. Thus the conditions of the underlying ocean, such as the warm sea surface temperature (SST) (Sun et al., 2016; Lavender et al., 2018; Schade, 2000) or the presence of a significant thick barrier layer (Wang et al., 2011; Neetu et al., 2012; Reul et al., 2014; Newinger and Toumi, 2015; Rudzin et al., 2017; Yan et al., 2017) which can feedback to TC intensity effectively have attracted considerable research attention. And in general, mesoscale eddies can be classed into two types according to their internal core temperature anomalies: the cyclonic eddies (CEs) with negative sea level anomaly (SLA) and cold water in the core region, and the anticyclonic eddies (AEs) with positive SLA and warm water in the core region. The influence of temperature anomaly in the core area of mesoscale eddies on TCs intensity has been widely studied (Shay et al., 2000; Chan et al., 2001; Lin et al., 2005, 2008; Wu et al., 2007; Yablonsky and Ginis, 2013; Walker et al., 2014; Jaimes et al., 2016; Ma et al., 2017). In summary, it is agreed that the intensification occurs when a tropical cyclone core encounters a warm anomaly (and the opposite for a cold anomaly) due to enhanced latent heat fluxes at the sea surface.
Compared with the concentrated researches on eddy feedback to TCs, there have been relatively few literatures about the influence of TCs on characteristics of mesoscale oceanic eddies. Based on the merged satellite observation data, Sun et al. (2014) probed into the effect of 15 super typhoons on the strength, spatial area, and kinetic energy of CEs in the Western North Pacific Ocean. They found that although the typhoons may significantly impact CEs, such samples were uncommon and only about 10% of CEs were significantly influenced by these super typhoons. By comparing the energy changes of CEs pre- and post-TC, Shang et al. (2015) found that slow-moving TCs can promote the energy increase of CEs. Based on numerical simulation, Lu et al. (2016) demonstrated that a typhoon can affect CE by increasing its intensity and area, and altering its 3D structure. The process from elliptical deformation to re-axisymmetric deformation of CE was found. Lu et al. (2020) further discovered that TCs can significantly disturb the strength and structure of eddies. Using Argo profiles, Liu et al. (2017) analyzed the response of the vertical temperature and salinity elements in eddies to TC, and found that there was divergence (convergence) of warm and fresh water in the surface of AEs (subsurface of CEs). Liu et al. (2020) discovered the enhancement (weakening) of the surface of cold (warm) eddy by super typhoon Mangkhut in the South China Sea of China. Some other studies have revealed the importance of marine chemical elements such as chlorophyll in eddies structure and their influence by TCs (Benitez-Nelson et al., 2007; Chelton et al., 2011; Lin, 2012).
The above studies are mainly based on case studies and model simulations, while a statistical explanation of the effect of TCs on the three-dimensional structure of mesoscale oceanic eddies is missing. Therefore, the purpose of this paper is to investigate the impact of TCs on the three-dimensional structural characteristics of CEs and AEs on the basis of statistical analysis by satellite-based eddy information and Argo data. The data and methodology are introduced in Inroduction presents the statistical results with a summary provided in Inroduction.
2 Data sources and methods
The research area in this paper is selected between 40° north and south latitude, covering part of the Pacific Ocean, Atlantic Ocean, and the Indian Ocean (Figure 1), which is also the main active area of TCs, especially in the western North Pacific, nearly one-third of tropical cyclones are generated there (Gray, 1968). Considering that the relative backwardness of satellite observation technology and Argo profiles is limited in quantity before this time, the time span is selected from 2001 to 2020.

FIGURE 1. The red dots in the figures denote the locations of all mesoscale eddies in contact with tropical cyclones between latitude 40 in the northern and southern hemispheres from 2001 to 2020. (A,B) represent anticyclonic and cyclonic eddies respectively.
2.1 TC information and satellite eddy data
The TC information including center position, maximum surface wind and translation speed are derived from the International Best Track Archive for Climate Stewardship (IBTrACS; Knapp et al., 2010). In this study, we focus on the 2001–2020 period, over which worldwide satellite coverage provides the position and estimated maximum wind speed every 6 h for more than 2000 TCs between 40° north and south latitude. Vincent et al. (2012) believed that during the 3–10 days before the storm, the ocean state was not affected by the storm and could be regarded as the pre-storm state. In this paper we define pre-TC as 5 days before the arrival of TC and post-TC as 5 days after the departure of TC (Ma et al., 2020).
The mesoscale ocean eddy information is derived from the delayed-time version 3.2 release of the Mesoscale Eddy Trajectory Atlas product (Mason et al., 2014; Pegliasco et al., 2022) provided by Archiving, Validation, and Interpretation of Satellite Oceanographic data, available from January 1993 to August 2021. The eddy is detected based on all-satellites merged sea level anomaly fields at resolutions of 0.25 × 0.25°. The eddy information includes the flow orientation (CEs or AEs), amplitude, center position, days from eddy genesis, circulation speed, radius, etc.
The TC-eddy interaction is defined to occur as their central distance is equal to or smaller than the double eddy radius. Considering the limited number of profiles that interact with TC and exist within one time of the eddy radius, the conditions for TC- eddy interaction are slightly relaxed here, the stricter standard is that the center distance is less than or equal to the eddy radius (Ma et al., 2017,2018,2021). When this eddy is confirmed to be engaged with TC, all profile data including pre- and post-TC will be counted. According to this definition, a total of 613 eddies interact with TC are counted, including 278 cyclonic eddies and 335 anticyclonic eddies.
2.2 Argo profiles and CARS climatology
The vertical structure of mesoscale eddies is investigated by using the profiles from Global Ocean Argo Scatter Dataset (V 3.0) (Liu et al., 2021). The profiles are quality-controlled in the delayed-time mode and provided by the international Argo project free of charge. The time span of the data used in this paper is from January 2001 to December 2020. Only the pressure (P), temperature (T) and salinity (S) data marked as GOOD (Argo quality mark 1) are kept in the analysis. Besides, following Chaigneau et al. (2001) and Yang et al. (2013), we operated stricter standards for the selection of profiles. The selected profiles must meet the following requirements: (1) The shallowest data are located between the surface and 10 dbar pressure, and the deepest data are collected below 1,000 dbar; (2) The pressure difference between two consecutive records does not exceed the given limit (
The CSIRO Atlas of Regional Seas 2009 (CARS 2009) was made by the Commonwealth Scientific and Industrial Research Organization and distributed in July 2009. It covers global oceans plotted on a 1/2° longitude-latitude grid mesh. In this study, the material is used to remove the climate trend from the profile data, so as to obtain the anomalies of temperature, salinity and dynamic height, and then to invert the structure of eddies. According to the position given by the Argo profiles, the data of each layer of CARS2009 is interpolated to the corresponding position by bilinear interpolation, and the more accurate climatic state of the position is obtained. The formula for calculating the climate state of CARS2009 on a certain day is (Ni, 2014; Dai et al., 2021):
where
2.3 Calculation of dynamic height, geostrophic velocity and eddy kinetic energy
The geostrophic current anomaly V′ (u′, v′) was derived from the dynamic height anomaly H′. The dynamic height H is computed as follows:
where α is the specific volume,
where u′ and v′ are the zonal and meridional components of V′, respectively; and f is the Coriolis parameter (Here, we choose Coriolis force of 20° north and south latitude as the mean value of interpolation area). The dynamic height anomaly H′ was computed from the temperature and salinity field.
The eddy kinetic energy (EKE) is defined as the average value of the eddy kinetic energy.
2.4 Definition and calculation of barrier layer
The presence of barrier layer (BL) is defined if the isothermal layer is thicker than the mixed layer. Its thickness is calculated as the difference between the isothermal layer and the mixed layer following De Boyer Montegut et al. (2007):
where BLT is barrier layer thickness, ILD is isothermal layer depth, and MLD is mixed layer depth. For the Argo dataset, MLD is defined as the depth where the density (ρ) had increased by 0.125 kg
3 Statistical result analysis
On the premise that the eddy has a similar three-dimensional structure (Zhang et al., 2014), this paper uses a method similar to that used in previous studies (Chaigneau et al., 2011; Souza et al., 2011; Yang et al., 2013; Zhang et al., 2016) to reconstruct the three-dimensional structure of the eddy’s temperature, salinity, and geostrophic velocity. For each eddy, we search the Argo float profile located within its radius, and calculate the relative distances ∆X and ∆Y of each Argo profile from the eddy center located at ΔX=ΔY=0, then normalize the obtained ∆X and ∆Y according to the eddy radius. For Argo profiles, temperature, salinity and dynamic height anomaly profiles are calculated by removing the daily mean climatologic profiles of CARS 2009. Then all these anomaly profiles are transformed into eddy-coordinate space (ΔX, ΔY) and mapped onto grids using an objective interpolation scheme (inversed distance weighting (IDW) interpolation; Barnes, 1973). Following previous researches (Chaigneau et al., 2011; Yang et al., 2013), if the data exceeds more than 3 times the interquartile spacing of the first or third quartile, the data will be regarded as outliers and discarded. The depth meter and pressure shown in the text are simply converted.
3.1 Pre-TC average vertical anomaly characteristics of eddies
According to the definition and method described in Pre-TC average vertical anomaly characteristics of eddies, the vertical average temperature, salinity and density anomalies of the CEs and AEs pre- and post-TC (Figure 2) are obtained by interpolating the selected ARGO profile data to the corresponding stratification for averaging and subtracting the climate state of the corresponding position. Figures 2A,C respectively present the typical average vertical distribution characteristics of temperature, salinity and density anomalies of AEs and CEs without the influence of TC. Temperature, salinity and density demonstrate opposite abnormal signals in CEs and AEs. In the upper ocean of 0–100 m, the positive temperature anomaly of AEs is more obvious than the negative temperature anomaly of CEs, and the temperature anomaly of CEs shows a close relation to positive signal at the surface layer, which may attribute to the stronger solar radiation in the middle and low latitudes. Due to the influence of radiation, a large amount of heat accumulates on the surface of the water, and there may be barriers layers and other factors in some areas. The existence of this surface salinity barrier hinders the downward transport of substances other than heat, then the phenomenon of temperature inversion appeared (Vialaed and Deleduse, 1998; De Boyer Montégut et al., 2007; Foltz and Mcphaden, 2009; Wang et al., 2011; Rudzin et al., 2017). The temperature anomalies of CEs and AEs gradually increase from the surface to the subsurface layer, with the maximum values appearing at the depth of 100–200 m. The salinity anomaly has opposite fluctuations at the upper 100 m, but at the depth below 200 m, the overall performance is normal, that is, the fluid body in CEs is characterized by low temperature, high salinity and high density, while the fluid body in AEs is characterized by high temperature, low salinity and low density (Chaigneau et al., 2011; Yang et al., 2013; Zhang et al., 2016; Dai et al., 2021).
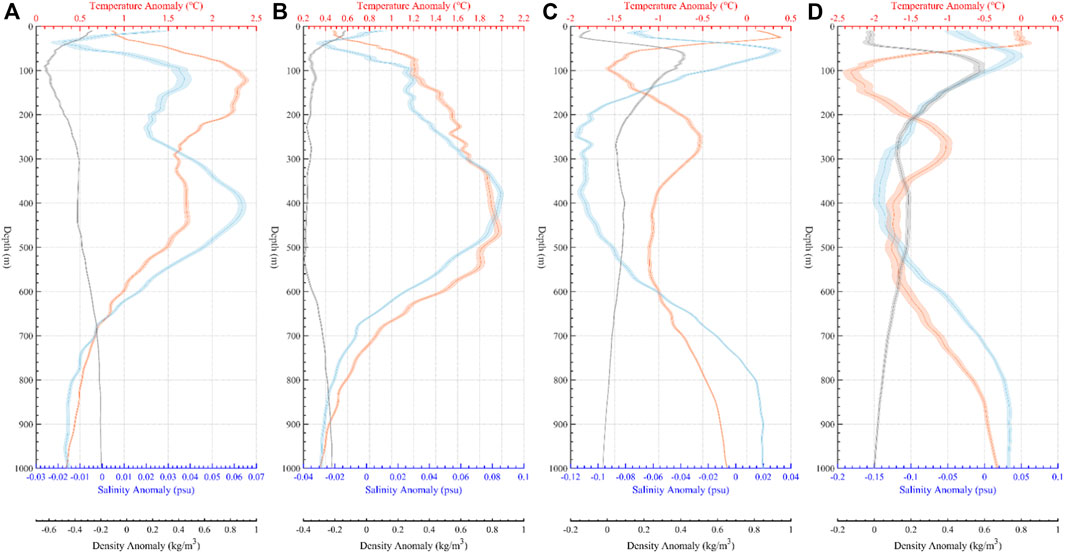
FIGURE 2. (A–D) present the vertical distribution of temperature (red lines), salinity (blue lines) and density (black lines) before and after the eddies engage with tropical cyclones by using ARGO data within one radius of the eddies. (A,B) respectively denote the vertical distribution of the anticyclonic eddies (AEs) pre- and post-tropical cyclones (TCs). (C,D) respectively denote the vertical distribution of the cyclonic eddies (CEs) pre- and post-TCs. The solid lines represent the average value and the shaded areas represent standard errors which are calculated as the standard deviation divided by the square root of each sample size.
3.2 Temperature anomaly structures
Figure 3 shows the transformation in the temperature anomaly of cyclonic eddies (CEs) from the surface layer to the bottom layer pre- (Left) and post-TC (Right). As can be seen from the Figure 3, under the influence of TC, the negative temperature anomaly signal undergoes two enhancement processes from the surface layer to the bottom layer. The temperature drops obviously from the surface layer to the depth of 300db, and the cooling rate and amplitude gradually increase from the surface layer to the maximum value of -1°C at the depth of about 100 db (recall Figure 2D). It is still obvious that the temperature drop from 100 db down to the depth of 300db, but the cooling amplitude is reduced to less than 0.5°C. However, the cooling area is not limited to the upper ocean, and a significant temperature drop at the depth of 300–700 db still exists. From the depth of 700db–1000 db at the bottom of our selected research scope, it seems that the temperature in the eddies did not change and was not being remarkably affected. For anticyclonic eddies (AEs, Figure 4), the positive temperature anomaly signal experienced a process of weakening from the surface layer to the enhancement process at the middle layer. Under the influence of TC, a significant cooling effect demonstrated in 100–200db, the cooling rate and range gradually increased from the surface layer, reaching a maximum of -1.2°C at approximately 120 db (recall Figure 2B). The cooling rate slowed down below this depth, and the temperature at about 250 db had been close to the state before TC came. Down from 250db, the positive temperature anomaly had been even more obvious than that before TC came. From 250 db to about 500db, the maximum temperature rise was reached, and the temperature rise rate between 500 and 700 db gradually decreased, 700 db to the bottom layer, the temperature anomaly gradually approached zero. Judging from the abnormal temperature of composite AE and CE pre- TC, the extreme center of abnormal temperature tended to be at the center of grid ΔX=ΔY=0, while the extreme position had a relatively obvious deviation after engaging with TC. This may mean that the structure of the eddy especially above 200 db is actually greatly deformed by the TC and is not recovered at least for a short period of time. In the thermocline layer (50–150 m), from the cooling range of CE after being affected by TC, it can be inferred that the area influenced by temperature anomaly has increased significantly compared with that before TC came, while the situation of AE is on the contrary, indicating that the strength of CE has been enhanced by TC to some extent, while AE has been weakened. These changes in CEs (AEs) were due to the magnitude and horizontal pattern of upwelling (downwelling), and the dynamic processes of eddy adjustment (Lu et al., 2016).
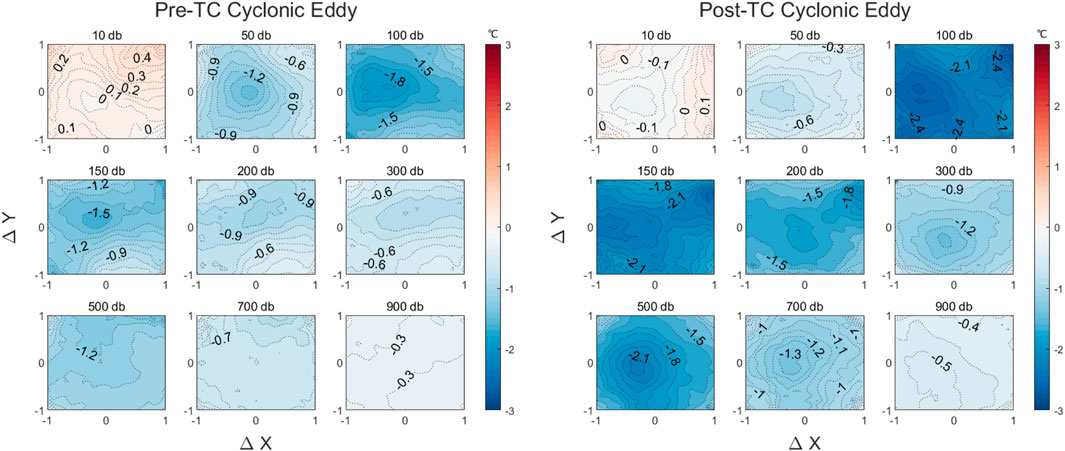
FIGURE 3. Temperature anomaly (in °C) of composite CE at 10, 50, 100, 150, 200, 300, 500, 700, 900 dbar.
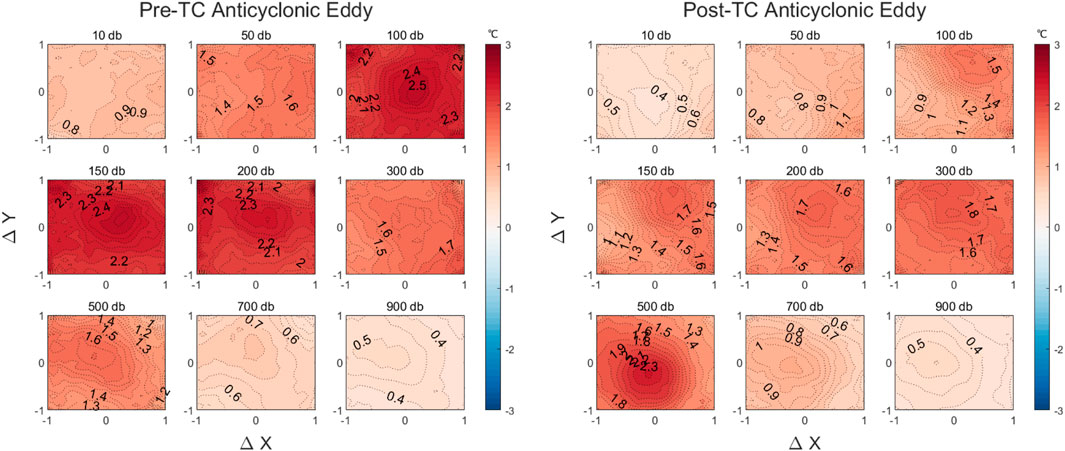
FIGURE 4. Temperature anomaly (in °C) of composite AE at 10, 50, 100, 150, 200, 300, 500, 700, 900 dbar.
The vertical sections of temperature anomaly of the composite CE and AE pre- TC at ΔY = 0 are shown separately in Figure 5. Interestingly, the composite CE show a clear dual-core vertical structure and this phenomenon is not very obvious in composite AE. The core in the upper layer of the eddy is at 50–150 m and in the deeper layer is 300–600 m. The temperature anomaly of core in the upper layer is stronger than that in the lower layer. The same findings appeared in previous studies (Yang et al., 2013; Dai et al.). In these studies, this dual-core structure is related to the low-potential vortex North Pacific subtropical modal water (STMW) in the main thermocline, which can be explained by the interaction of the eddy with the subtropical modal water. The presence of STMW divides the main thermocline into upper (<200 m) and lower layers (300–600 m). The eddy signal is usually stronger in shallow water, so the vertical fluctuation of the isotherm caused by eddy is more pronounced in the upper thermocline than in the lower thermocline (Yang et al., 2013; Ni, 2014). For CEs, the upwelling in the eddy makes the capacity of thermocline protrusion more significant, and the effect on the upper thermocline becomes more obvious. Therefore, the upper and deeper thermocline are more separated, which makes the upper and deeper cores more conspicuous. In AEs, the effect of downwelling makes the thermocline concave downward, thus the upper and lower thermoclines become closer in space and no obvious dual core structure can be seen. The Northwest Pacific region is an important TC active region, and the frequency of TC-eddy interaction is very high. Compared with other oceans, the number of samples obtained in this region accounts for the highest proportion, so the overall characteristics obtained are also in line with previous scholars in this region.
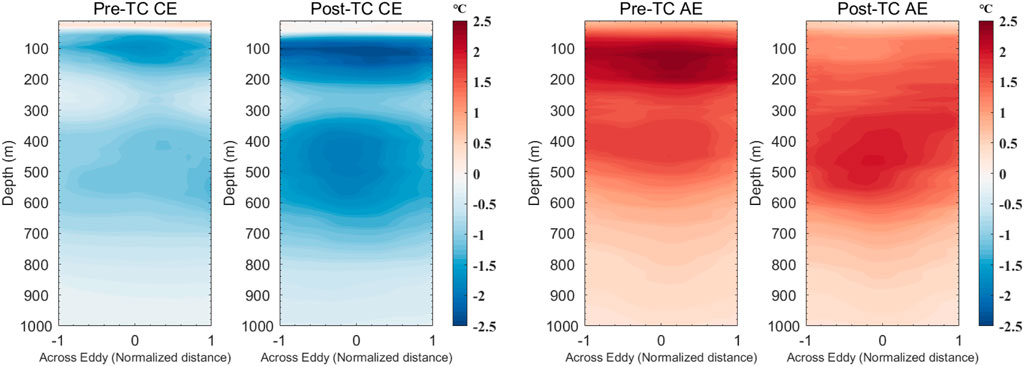
FIGURE 5. Vertical sections of the temperature anomaly of the composite (left) CE and (right) AE at ΔY
Under the effect of TC vertical mixing and enhanced heat exchange at the air-sea interface, after the slight positive temperature anomaly originally existed in the CE surface layer was mixed with the lower layer of cold water, the subsurface layer, which was originally low in temperature, showed a certain temperature recovery, and the temperature in the part above 50 m tended to be consistent. From the depth above 200m, the temperature of the original upper temperature anomaly core of the composite CE and AE was been greatly reduced due to the influence of TC. The specific manifestation is that the cold core of CE showed more obvious, while the original warm core of AE was no longer significant or even tended to disappear. However, the second core located at the underlayer 300–600 m seems to be enhanced, and the negative abnormal signal of the cold core in CE and the positive abnormal signal of the warm core in AE became more obvious. Here, a heat pump effect similar to the common effect of TC on sea surface temperature (SST) appeared. The abnormal signal in the upper layer propagated downward under the influence of TC, and remained inside the eddy after the TC. The tubular structure of the eddy acted as the “amplifier” for this effect, thus this kind of abnormal signal can be transmitted to the lower parts of the eddy structure, which further indicates that the effect of TC on the eddy may not be limited to the upper ocean.
However, compared with the heat pump effect corresponding to the influence of TC on the temperature of subsurface layer, the propagation depth of abnormal signals in the eddy is deeper, obviously reaching the middle layer of the its structure and located below the thermocline, and it shows similarities between CE and AE.
3.3 Salinity anomaly structures
The transformation in the salinity anomaly of CEs from the surface layer to the bottom layer pre- TC can be seen in Figure 6 (Left). In CE, the salinity anomaly signal shows the characteristics of negative-positive-negative distribution from the surface to the bottom. From the surface to the depth of 100 db (about the middle and lower part of the salinity thermocline), the salinity anomaly signal has a large turning point. From 100 db down to the depth of about 400db, the negative anomaly signal of salinity continues to increase and reaches the maximum value of about -0.12psu (recall Figure 2C) and gradually weakens at the depth of 400 db until it nearly disappears at the bottom. The salinity anomaly signal has a weak negative value in the surface layer of AE (Figure 7, Left), and a turning point occurs in the shallower subsurface layer. The anomaly shows a positive value as a whole from the depth of 100 db down, and its maximum positive anomaly signal (about +0.065psu) is close to the depth of the maximum negative salinity anomaly in CE, which is about 400 db. The abnormal signal of 400 db downward gradually weakens. Whether in CE or AE, the depth of the extreme value of salinity anomaly appears to be deeper than that of temperature anomaly. The change of salinity anomaly signal above 200 db seems to have little fluctuation under the influence of TC, and the phenomenon that this signal is enhanced can be clearly seen in both CE and AE between 200 and 500 db depth (Figures 6, 7, Right). Moreover, the amplified intensity of this salinity anomaly signal in CE seems to be higher than that in AE. The enhanced signal attenuates quickly below 500db, and a weaker opposite signal begins to appear below 700 db.
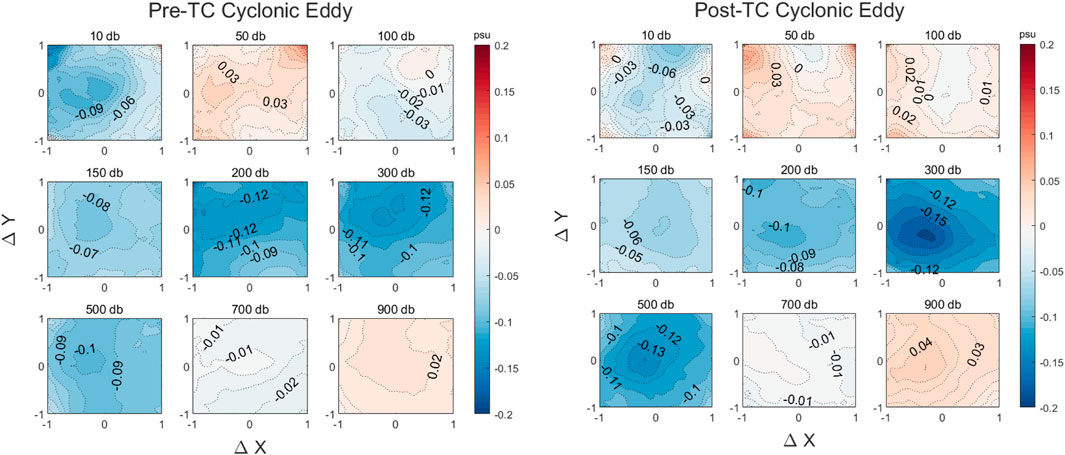
FIGURE 6. Salinity anomaly (in psu) of composite CE at 10, 50, 100, 150, 200, 300, 500, 700, 900 dbar.
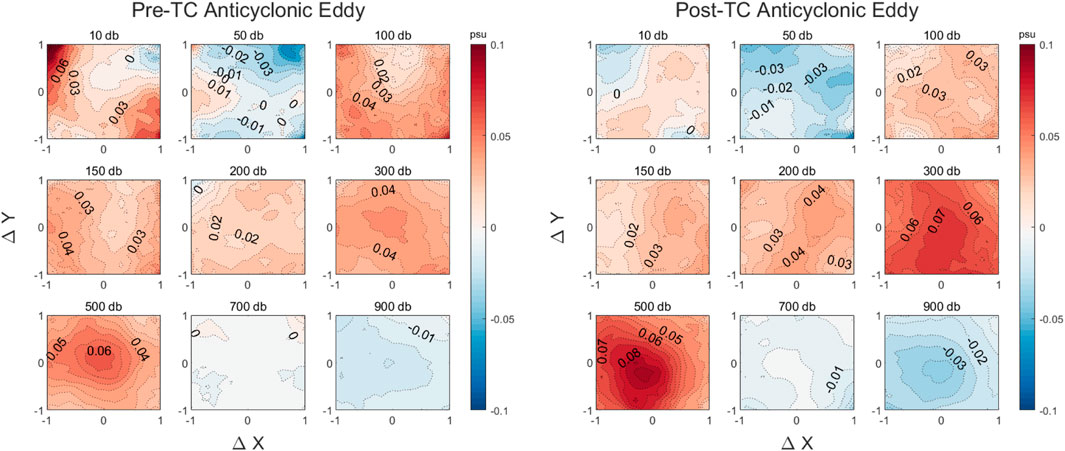
FIGURE 7. Salinity anomaly (in psu) of composite AE at 10, 50, 100, 150, 200, 300, 500, 700, 900 dbar.
The vertical sections of salinity anomaly of the composite CE and AE pre- TC at ΔY = 0 are shown separately in Figure 8. In the range of 250–500 m, before the influence of TC, a clear mononuclear structure can be seen in the salinity anomalies of CE and AE. At 10–100 m, salinity had a positive anomaly approximately 0.08. The negative anomaly is the upward movement of water caused by CE that raises the low salinity North Pacific mid-level water (NPIW) and then reduces the salinity of the water above it. Then the subsurface hypersaline North Pacific Tropical Water (NPTW) was also uplifted, resulting in anomalous positive surface salinity (Yang et al., 2011; Dai et al., 2021). The salinity patterns of the composite AEs feature an almost opposite vertical structure from CEs. Slight negative salinity anomaly at the surface may be the input of outside fresh water (Qiu, 1998; Li and Wang., 2012). Under the influence of the sinking effect of AE, the deepening of the NPTW produces large positive salinity anomaly in the entire subsurface layer, while the deepening of the NPIW in turn produces weak negative anomaly signal in the deeper layer.
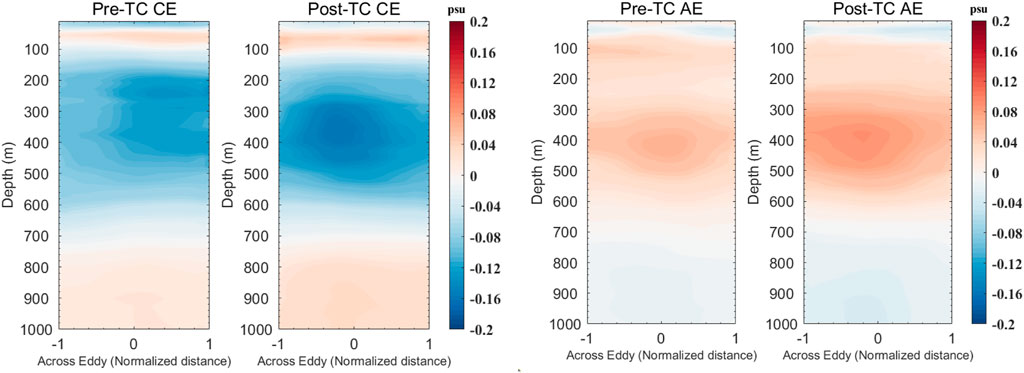
FIGURE 8. Vertical sections of the salinity anomaly of the composite (left) CE and (right) AE at ΔY
The vertical mixing of TC makes the negative anomaly signal of surface salinity disappear, and the overall salinity of seawater above 100 m in CE shows positive anomaly. At the depth above 50 m in AE, the original slight negative salinity anomaly has a deeper change. From 100 m down to the depth of 200 m, affected by the positive salinity anomaly signal in CE above 100 m, the original negative anomaly signal in this layer is weakened, and the salinity anomaly of the whole layer shifts to a positive value.
However, the positive and abnormal signals of AE in this layer are weakened. As described in Salinity anomaly structures, a similar effect is applied to the feedback of salinity anomaly we obtained here. Anomalous signals from the upper layers propagate downward and make the anomalous signals appear to be amplified at 250–600 m.
3.4 Dynamic height and geostrophic velocity anomaly structures
Figure 9 shows the variation of the dynamical height of the composite CE at different layers. Under the influence of TC, the dynamic height from the surface layer to the depth of 500 db has changed obviously. This negative abnormal signal is more obvious above the depth of 100db, and the signal intensity decreases with the increase of depth, which reflects the enhancement effect of TC on CE to some extent. The change of dynamic height in the vertical stratification of AE (Figure 10) can be divided into two steps. Above 150db, this positive abnormal signal is weakened, and around 200db–500db, it can be seen that the signal seems to be enhanced to a certain extent. Considering that the specific volume is proportional to the inverse of the density, it seems reasonable to obtain such a result in combination with the changes of temperature and salinity in CE and AE after being affected by TC.
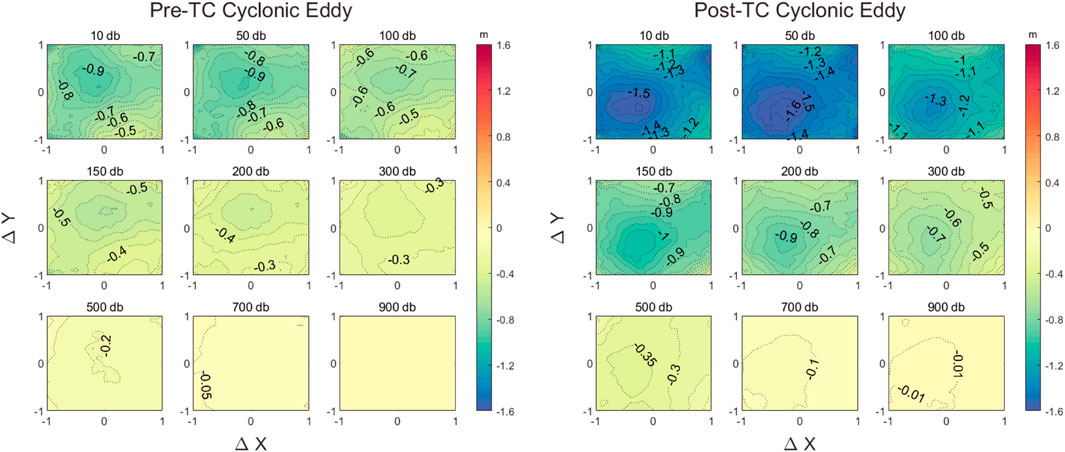
FIGURE 9. Dynamic height anomaly (in m) of composite CE at 10, 50, 100, 150, 200, 300, 500, 700, 900 dbar.
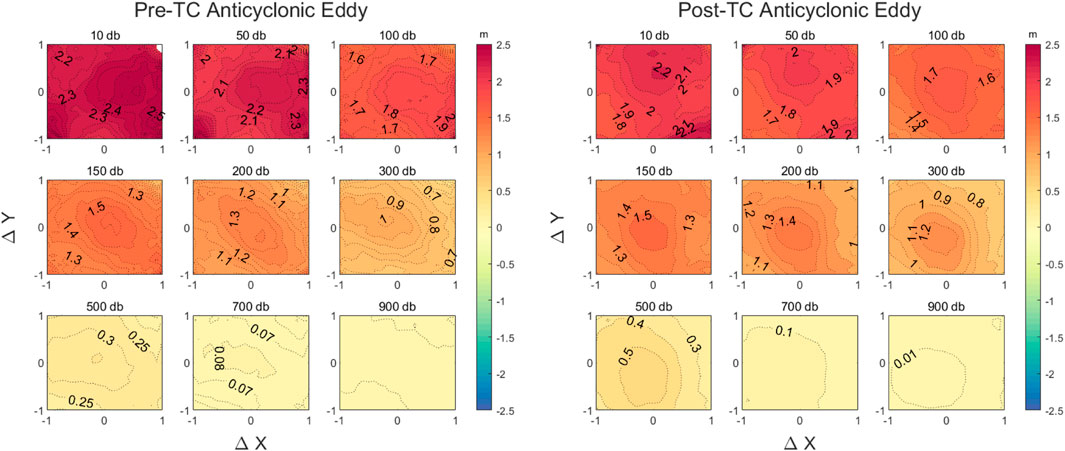
FIGURE 10. Dynamic height anomaly (in m) of composite AE at 10, 50, 100, 150, 200, 300, 500, 700, 900 dbar.
According to the obtained dynamic height distribution and the calculation formula of geostrophic flow, we inverted the flow field of composite CE (Figure 11) and AE (Figure 12) at different layers. The eddy center of CE shifted to a certain extent after being disturbed by TC, and is roughly located at the lower left of the original center of the grid, while the center of AE still seems to remain close to the center of the grid. In the horizontal direction, the velocity is weakest at the eddy center and increases with distance from the center. The flow velocity has a certain asymmetry around the center of the vortex, and there exists a large flow velocity disturbance at the edge of the grid, which may be caused by the forcing of the TC wind field. From the perspective of eddy kinetic energy (EKE, Figure 13), it can be seen that the energy of CE increased from the surface layer to the bottom layer after being affected by TC. The increase is most obvious in the surface layer, and the energy gradually decays downward. The performance of EKE in the upper layer of AE is almost opposite to that of CE. Above the depth of 300 m, the overall eddy kinetic energy of AE is attenuated compared with that before the impact of TC. The energy increase in the surface layer may be caused by the disturbance of TC at the edge of the grid which leads to the increase of velocity. Between 300 and 600 m, the EKE of AE has a certain increase. This is because the geostrophic velocity is affected by the change of the temperature salinity structure between the layers, resulting in a heat pump-like effect in the middle layer of the AE flow field structure.
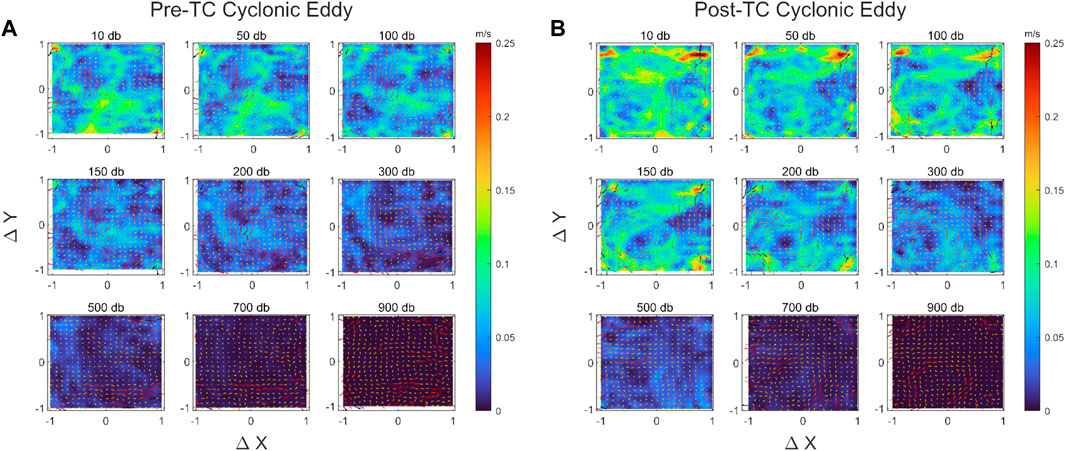
FIGURE 11. Horizontal fields of geostrophic velocity anomaly (vectors indicate flow directions only; color shading indicates the magnitude of the speed) of the composite CE at 10, 50, 100, 150, 200, 300, 500, 700, 900 dbar.
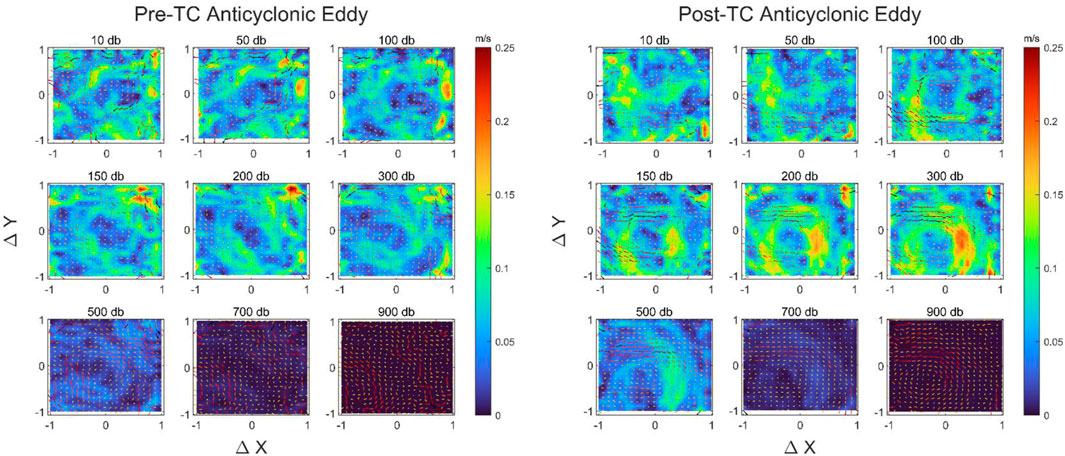
FIGURE 12. Horizontal fields of geostrophic velocity anomaly (vectors indicate flow directions only; color shading indicates the magnitude of the speed) of the composite AE at 10, 50, 100, 150, 200, 300, 500, 700, 900 dbar.
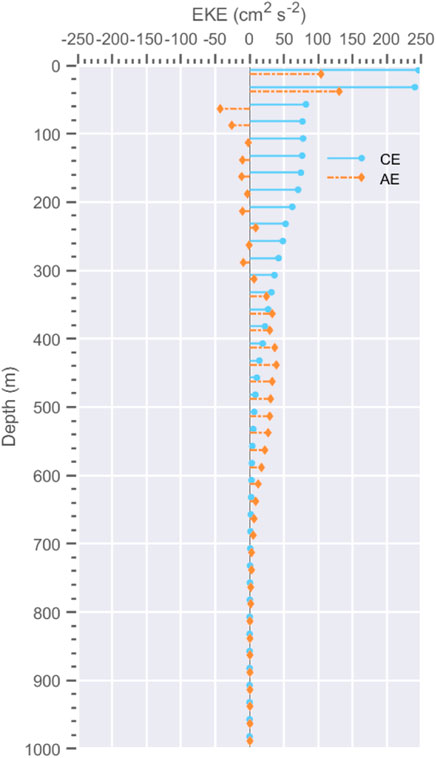
FIGURE 13. The difference of the average eddy kinetic energy (EKE) of each layer (post-TC minus pre-TC). Blue lines represent CE, red lines represent AE.
3.5 Response of barrier layer thickness inside eddy
Many previous scholars (Steffen and Bourassa, 2018; 2020; Zhang et al., 2022) studied the response of the barrier layer under the condition of TC. Here we focus on the changes of the barrier layer inside the eddy. The boxplots in Figure 14 clearly show the changes of the barrier layer thickness (BLT), isothermal layer depth (ILD), and mixed layer depth (MLD) before and after the influence of TC. The thickening trend of the BLT is consistent in both CE and AE. Although both ILD and MLD increased under TC forcing, the ILD was obviously more sensitive to the perturbation, resulting in an eventual thickening trend of the BLT. The trend of this type of thickening is consistent with the results obtained by previous study (Zhang et al., 2022). By comparing the BLT in CE and AE, it can be found that the BLT in AE was thicker, because the sinking effect of eddy current in AE made the IL deeper, while the lifting effect of eddy current in CE made the IL shallower. Generally speaking, the change of BLT caused by TC has little difference between AE and CE.
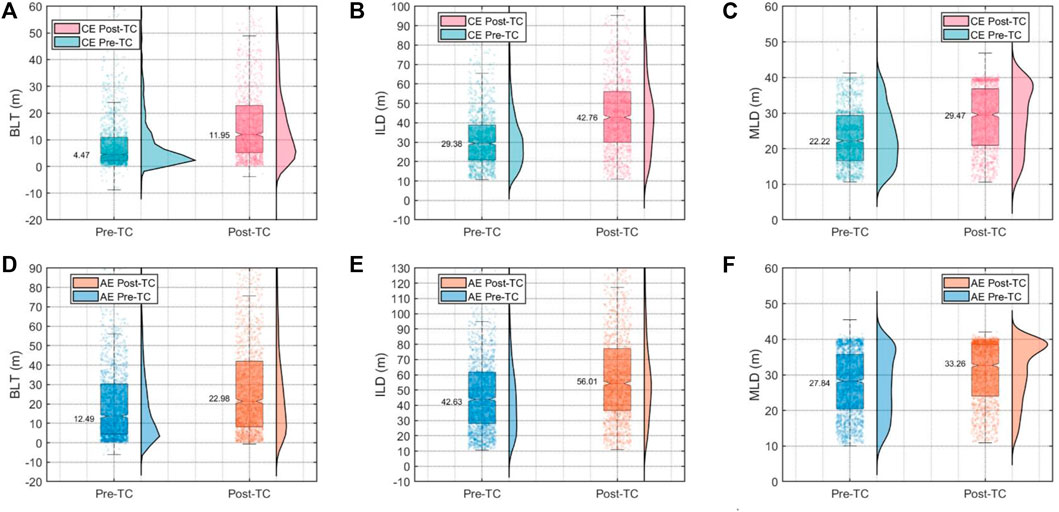
FIGURE 14. The boxplots in (A–C) denote the barrier layer thickness (BLT), isothermal layer depth (ILD), and mixed layer depth (MLD) of CE pre- and post-TC. (D–F) correspond to the relevant variables of AE. On the right side of each box diagram is the probability density distribution of the corresponding sample. The numbers in the figure represent the size of the 50th percentile. The difference between two adjacent groups is statistically significant above the 99% confidence level based on the Student’s t test.
4 Conclusion and discussion
The interaction between oceanic mesoscale eddies and TCs have attracted increasing attention in recent years. Previous studies have found a significant role of the eddy in modulating the TC-induced oceanic response as well as their feedback to the intensities of TCs (Shay et al., 2000; Chan et al., 2001; Lin et al., 2005, 2008; Wu et al., 2007; Yablonsky & Ginis, 2013; Walker et al., 2014; Jaimes et al., 2016; Ma et al., 2017). However, current knowledge of how the three-dimensional characteristics of eddies are determined by TCs is still limited. In this study we investigate the TC-induced changes in eddy three-dimensional characteristics in combination with satellite-based eddy information and Argo data.
While TC forcing brings cooling and desalination to the eddy surface, it seems to stimulate a heat pump-like effect, and the abnormal signals originally existing in the eddy surface are amplified in the subsurface and middle layers. The effect travels far deeper in the eddy than we thought, and the tube-like structure of the eddy appears to act as an amplifier. This also shows that the influence of TC on the deep structure of the eddy is not limited to the surface layer.
This study stresses the significant effects of TCs on modulating the eddy three-dimensional characteristics, and a heat-pump-like phenomenon is found in the eddy response to TC forcing. Limited by the shortage of the observation data of mesoscale eddies in the deep ocean, the flow field structure in the deep ocean cannot be more realistically inverted and it is hard to explore whether this change in the middle and lower structure is permanent or not. It is believed that with the further development of ocean observation technology in the future, the ocean data will be more abundant and the exploration of eddy structure will be more complete.
Data availability statement
The original contributions presented in the study are included in the article/supplementary material further inquiries can be directed to the corresponding author.
Author contributions
ZZ: Data processing, drawing and paper writing. YZ: Scientific research and academic guidance. HL: Paper revision and correction.
Funding
The project was supported by Southern Marine Science and Engineering Guangdong Laboratory (Zhuhai) (No. SML2021SP207). The study is supported by the Natural Science Foundation of Hunan Province, China (2020JJ3040), the National Natural Science Foundation of China (42022033, 41875062 and 42192552), the Program of Shanghai Academic/Technology Research Leader (21XD1404500), and the Research Program from Science and Technology Committee of Shanghai (19dz1200101).
Conflict of interest
The authors declare that the research was conducted in the absence of any commercial or financial relationships that could be construed as a potential conflict of interest.
Publisher’s note
All claims expressed in this article are solely those of the authors and do not necessarily represent those of their affiliated organizations, or those of the publisher, the editors and the reviewers. Any product that may be evaluated in this article, or claim that may be made by its manufacturer, is not guaranteed or endorsed by the publisher.
References
Barnes, S. L. (1973). NOAA tech memo, ERL NSSL-62. Norman, OK 73069: National Severe Storms Laboratory, 60.Mesoscale objective analysis using weighted time-series observations
Benitez-Nelson, C. R., Bidigare, R. R., Dickey, T. D., Landry, M. R., Leonard, C. L., Brown, S. L., et al. (2007). Mesoscale eddies drive increased silica export in the subtropical Pacific Ocean. Science 316, 1017–1021. doi:10.1126/science.1136221
Bosc, C., Delcroix, T., and Maes, C. (2009). Barrier layer variability in the Western Pacific warm pool from 2000 to 2007. J. Geophys. Res. 114 (C6), C06023. doi:10.1029/2008JC005187
Chaigneau, A., Eldin, G., Dewitte, B., and Dewitte, B. (2009). Eddy activity in the four major upwelling systems from satellite altimetry (1992–2007). Prog. Oceanogr. 83 (1–4), 117–123. doi:10.1016/j.pocean.2009.07.012
Chaigneau, A. M., Le, T., Eldin, G., Grados, C., and Pizarro, O. (2011). Vertical structure of mesoscale eddies in the eastern south Pacific ocean: A composite analysis from altimetry and Argo profiling floats. J. Geophys. Res. 116, C11025. doi:10.1029/2011JC007134
Chan, J. C. L., Duan, Y., and Shay, L. K. (2001). Tropical cyclone intensity change from a simple ocean-atmosphere coupled model. J. Atmos. Sci. 58 (2), 154–172. doi:10.1175/1520-0469(2001)058<0154:tcicfa>2.0.co;2
Chelton, D. B., Schlax, M. G., and Samelson, R. M. (2011). Global observations of nonlinear mesoscale eddies. Prog. Oceanogr. 91 (2), 167–216. doi:10.1016/j.pocean.2011.01.002
Cheng, Y., Ho, H., Zheng, C., R., and Zheng, Q. (2014). Statistical characteristics of mesoscale eddies in the north Pacific derived from satellite altimetry. Remote Sens. 6 (6), 5164–5183. doi:10.3390/rs6065164
Dai, J., Wang, H., Zhang, Z., Wang, W., M., and Luo, T., L. (2021). Three-dimensional structure of an observed cyclonic mesoscale eddy in the Northwest Pacific and its assimilation experiment. Acta Oceanol. Sin. 40 (5), 1–19. doi:10.1007/s13131-021-1810-6
De Boyer Montégut, C., Mignot, J., Lazar, A., and Cravatte, S. (2007). Control of salinity on the mixed layer depth in the world ocean: 1. General description. J. Geophys. Res. 112 (C6), C06011. doi:10.1029/2006JC003953
Ferrari, R., and Wunsch, C. (2009). Ocean circulation kinetic energy: Reservoirs, sources, and sinks. Annu. Rev. Fluid Mech. 41, 253–282. doi:10.1146/annurev.fluid.40.111406.102139
Foltz, G., and Mcphaden, R. (2009). Impact of barrier layer thickness on SST in the central tropical North Atlantic. J. Clim. 2 (2), 285–299. doi:10.1175/2008jcli2308.1
Frenger, I., Gruber, N., Knutti, R., and Münnich, M. (2013). Imprint of Southern Ocean eddies on winds, clouds and rainfall. Nat. Geosci. 6, 608–612. doi:10.1038/ngeo1863
Girishkumar, M. S., Suprit, K., Chiranjivi, J., Udaya Bhaskar, T. V. S., Ravichandran, M., Shesu, R. V., et al. (2014). Observed oceanic response to tropical cyclone Jal from a moored buoy in the south-Western Bay of Bengal. Ocean. Dyn. 64 (3), 325–335. doi:10.1007/s10236-014-0689-6
Gray, W. M. (1968). Global view of the origin of tropical disturbances and storms. Mon. Weather Rev. 96, 669–700. doi:10.1175/1520-0493(1968)096<0669:gvotoo>2.0.co;2
Jaimes, B., Shay, L. K., and Brewster, J. K. (2016). Observed air-sea interactions in tropical cyclone isaac over loop current mesoscale eddy features. Dyn. Atmos. Oceans 76, 306–324. doi:10.1016/j.dynatmoce.2016.03.001
Lavender, S. L., Hoeke, R. K., and Abbs, D. J. (2018). The influence of sea surface temperature on the intensity and associated storm surge of tropical cyclone yasi: A sensitivity study. Nat. Hazards Earth Syst. Sci. 18 (3), 795–805. doi:10.5194/nhess-18-795-2018
Levitus, S. (1982)., 13. Washington, DC: U.S. Govt. Printing Off, 173.Climatological atlas of the world oceanNOAA Prof. Pap.
Li, Y., and Wang, F. (2012). Spreading and salinity change of north Pacific tropical water in the philippine sea. J. Oceanogr. 68, 439–452. doi:10.1007/s10872-012-0110-3
Lin, I. I. (2012). Typhoon-induced phytoplankton blooms and primary productivity increase in the Western North Pacific subtropical ocean. J. Geophys. Res. 117, C03039. doi:10.1029/2011JC007626
Lin, I., Wu, C., Emanuel, C., Lee, I., Wu, H., and Pun, I., F. (2005). The interaction of super typhoon Maemi (2003) with a warm ocean eddy. Mon. Weather Rev. 133 (9), 2635–2649. doi:10.1175/mwr3005.1
Lin, I., Wu, I., Pun, C., and Ko, D., S. (2008). Upper-ocean thermal structure and the Western North Pacific category 5 typhoons. Part I: Ocean features and the category 5 typhoons intensification. Mon. Weather Rev. 136 (9), 3288–3306. doi:10.1175/2008MWR2277.1
Liu, S., Li, J., Sun, L., Wang, G., Tang, D., Huang, P., et al. (2020). Basin-wide responses of the South China sea environment to super typhoon Mangkhut (2018). Sci. Total Environ. 731, 139093. doi:10.1016/j.scitotenv.2020.139093
Liu, S. S., Sun, L., Wu, Q. Y., and Yang, Y. J. (2017). The responses of cyclonic and anticyclonic eddies to typhoon forcing: The vertical temperature-salinity structure changes associated with the horizontal convergence/divergence. J. Geophys. Res. Oceans 122 (6), 4974–4989. doi:10.1002/2017jc012814
Liu, Z., Li, H., Lu, Z., Q. S., Wu, L., Sun, X., F., and Xu J, C., H. (2021). Scattered data set of temperature and salinity profiles from the international Argo program. Digital Journal of Global Change Data Repository. doi:10.3974/geodb.2021.06.05.V1
Lu, Z., Wang, G., and Shang, X. (2016). Response of a preexisting cyclonic ocean eddy to a typhoon. J. Phys. Oceanogr. 46, 2403–2410. doi:10.1175/jpo-d-16-0040.1
Lu, Z., Wang, G., and Shang, X. (2020). Strength and spatial structure of the perturbation induced by a tropical cyclone to the underlying eddies. J. Geophys. Res. Oceans 125. doi:10.1029/2020JC016097
Ma, Z., Fei, J., Huang, X., and Cheng, X. (2022). Contributions of surface sensible heat fluxes to tropical cyclone. Part I: Evolution of tropical cyclone intensity and structure. J. Atmos. Sci. 79, 120–140. doi:10.1175/jas-d-14-0199.1
Ma, Z., Fei, J., Huang, X., and Cheng, X. (2018). Modulating effects of mesoscale oceanic eddies on sea surface temperature response to tropical cyclones over the Western North Pacific. J. Geophys. Res. Atmos. 123, 367–379. doi:10.1002/2017jd027806
Ma, Z., Fei, J., Lin, Y., and Huang, X. (2020). Modulation of clouds and rainfall by tropical cyclone's cold wakes. Geophys. Res. Lett. 47 (17). doi:10.1029/2020GL088873
Ma, Z., Fei, J., Liu, L., Huang, X., and Li, Y. (2017). An investigation of the influences of mesoscale ocean eddies on tropical cyclone intensities. Mon. Weather Rev. 145, 1181–1201. doi:10.1175/mwr-d-16-0253.1
Ma, Z., Zhang, Z., Fei, J., and Wang, H. (2021). Imprints of tropical cyclones on structural characteristics of mesoscale oceanic eddies over the Western North Pacific. Geophys. Res. Lett. 48, e2021GL092601. doi:10.1029/2021GL092601
Mason, E., Pascual, A., and McWilliams, J. C. (2014). A new sea surface height–based code for oceanic mesoscale eddy tracking. J. Atmos. Ocean. Technol. 31, 1181–1188. doi:10.1175/JTECH-D-14-00019.1
Neetu, S., Lengaigne, M., Vincent, E. M., Vialard, J., Madec, G., Samson, G., et al. (2012). Influence of upper-ocean stratification on tropical cyclone-induced surface cooling in the Bay of Bengal. J. Geophys. Res. 117 (C12). doi:10.1029/2012JC008433
Newinger, C., and Toumi, R. (2015). Potential impact of the colored Amazon and Orinoco plume on tropical cyclone intensity. J. Geophys. Res. Oceans 120 (2), 1296–1317. doi:10.1002/2014jc010533
Ni, Q., B. (2014). Statistical characteristics and composite three-dimensional structures of mesoscale eddies near the Luzon Strait (in Chinese) [dissertation]. Xiamen: Xiamen University.
Pegliasco, C., Delepoulle, A., Mason, E., Morrow, R., Faugere, Y., and Dlibarboure, G. (2022). META3.1exp: A new global mesoscale eddy trajectory atlas derived from altimetry. Earth Syst. Sci. Data 14, 1087–1107. doi:10.5194/essd-14-1087-2022
Price, J. F. (1981). Upper ocean response to a hurricane. J. Phys. Oceanogr. 11, 153–175. doi:10.1175/1520-0485(1981)011<0153:uortah>2.0.co;2
Qiu, B., and Chen, S. (2010). Interannual variability of the North Pacific Subtropical Countercurrent and its associated mesoscale eddy field. J. Phys. Oceanogr. 40, 213–225. doi:10.1175/2009jpo4285.1
Qiu, B. (1998). Seasonal eddy field modulation of the north pacific subtropical countercurrent: TOPEX/Poseidon observations and theory. J. Phys. Oceanogr. 29, 2471–2486. doi:10.1175/1520-0485(1999)029<2471:sefmot>2.0.co;2
Qu, T., Mitsudera, H., and Yamagata, T. (1998). On the Western boundary currents in the Philippine Sea. J. Geophys. Res. 103 (C4), 7537–7548. doi:10.1029/98jc00263
Reul, N., Quilfen, Y., Chapron, B., Fournier, S., Kudryavtsev, V., and Sabia, R. (2014). Multisensor observations of the Amazon-Orinoco river plume interactions with hurricanes. J. Geophys. Res. Oceans 119 (12), 8271–8295. doi:10.1002/2014jc010107
Rudzin, J. E., Shay, L. K., Jaimes, B., and Brewster, J. K. (2017). Upper ocean observations in eastern Caribbean Sea reveal barrier layer within a warm core eddy. JGR. Oceans 122 (2), 1057–1071. doi:10.1002/2016jc012339
Shang, X., Zhu, H., Chen, G., Xu, C., and Yang, Q. (2015). Research on cold core eddy change and phytoplankton bloom induced by typhoons: Case studies in the South China sea. Adv. Meteorology 2015, 1–19. doi:10.1155/2015/340432
Shay, L. K., Goni, G. J., and Black, P. G. (2000). Effects of a warm oceanic feature on hurricane Opal. Mon. Weather Rev. 128 (5), 1366–1383. doi:10.1175/1520-0493(2000)128<1366
Souza, J. M. A. C., de Boyer Montegut, C., Cabanes, C., and Klein, P. (2011). Estimation of the Agulhas ring impacts on meridional heat fluxes and transport using ARGO floats and satellite data. Geophys. Res. Lett. 38, L21602. doi:10.1029/2011GL049359
Steffen, J., and Bourassa, M. (2018). Barrier layer development local to tropical cyclones based on Argo float observations. J. Phys. Oceanogr. 48 (9), 1951–1968. doi:10.1175/jpo-d-17-0262.1
Sun, J., Zuo, J., Ling Z, C., and Yan, Y. (2016). Role of ocean upper layer warm water in the rapid intensification of tropical cyclones: A case study of typhoon rammasun (1409). Acta Oceanol. Sin. 35 (3), 63–68. doi:10.1007/s13131-015-0761-1
Sun, L., Yang, Y.-X. Y.-J., Wu, Q., Chen, X.-T., Li, Q.-Y., Li, Y.-B., et al. (2014). Effects of super typhoons on cyclonic ocean eddies in the Western north pacific: A satellite data-based evaluation between 2000 and 2008. J. Geophys. Res. Oceans 119, 5585–5598. doi:10.1002/2013jc009575
Vialaed, J., and Delecluse, P. (1998)., An OGCM study for the TOGA decade. Part I: Role of salinity in the physics of the Western Pacific fresh pool. J. Phys. Oceanogr., 28, (6): 071–1 088.
Vincent, E. M., Lengaigne, M., Madec, G., Vialard, J., Samson, G., Jourdain, N. C., et al. (2012). Processes setting the characteristics of sea surface cooling induced by tropical cyclones. J. Geophys. Res. 117, C02020–C02046. doi:10.1029/2011JC007396
Walker, N. D., Leben, R. R., Pilley, C. T., Shannon, M., Herndon, D. C., Pun, I., F., et al. (2014). Slow translation speed causes rapid collapse of Northeast Pacific Hurricane Kenneth over cold core eddy. Geophys. Res. Lett. 41, 7595–7601. doi:10.1002/2014GL061584
Wang, G., Su, H., and Chu, J, L. P., C. (2003). Mesoscale eddies in the South China Sea observed with altimeter data. Geophys. Res. Lett. 30 (21), 2121. doi:10.1029/2003GL018532
Wang, X., Han, G., Qi, Y., and Li, W. (2011). Impact of barrier layer on typhoon-induced sea surface cooling. Dyn. Atmos. Oceans 52 (3), 367–385. doi:10.1016/j.dynatmoce.2011.05.002
Wu, C., Lee, C., and Lin, I. (2007). The effect of the ocean eddy on tropical cyclone intensity. J. Atmos. Sci. 64 (10), 3562–3578. doi:10.1175/jas4051.1
Yablonsky, R. M., and Ginis, I. (2013). Impact of a warm ocean eddy's circulation on hurricane-induced sea surface cooling with implications for hurricane intensity. Mon. Weather Rev. 141 (3), 997–1021. doi:10.1175/mwr-d-12-00248.1
Yan, Y., Li, F., and Wang, L. (2017). The effects of oceanic barrier layer on the upper ocean response to tropical cyclones. J. Geophys. Res. Oceans 122 (6), 4829–4844. doi:10.1002/2017JC012694
Yang, G., Wang, F., Li, Y., and Lin, P. (2013). Mesoscale eddies in the northwestern subtropical Pacific Ocean: Statistical characteristics and three-dimensional structures. J. Geophys. Res. Oceans 118, 1906–1925. doi:10.1002/jgrc.20164
Ye, H., Sheng, J., Tang, D., Morozov, E., Kalhoro, M. A., Wang, S., et al. (2019). Examining the impact of tropical cyclones on air-sea CO2 exchanges in the Bay of Bengal based on satellite data and in situ observations. J. Geophys. Res. Oceans 124 (1), 555–576. doi:10.1029/2018jc014533
Zhang, Z, G., Wang, W., Qiu, B., and Qiu, B. (2014). Oceanic mass transport by mesoscale eddies. Science 345 (6194), 322–324. doi:10.1126/science.1252418
Keywords: tropical cycloe, mesoscale oceanic eddies, air sea interaction, eddy structure, temperature salinity anomaly
Citation: Zhang Z, Zheng Y and Li H (2023) Imprints of tropical cyclone on three-dimensional structural characteristics of mesoscale oceanic eddies. Front. Earth Sci. 10:1057798. doi: 10.3389/feart.2022.1057798
Received: 30 September 2022; Accepted: 07 November 2022;
Published: 18 January 2023.
Edited by:
Wei Zhang, Utah State University, United StatesReviewed by:
Ricardo de Camargo, University of São Paulo, BrazilYuanjian Yang, Nanjing University of Information Science and Technology, China
Copyright © 2023 Zhang, Zheng and Li. This is an open-access article distributed under the terms of the Creative Commons Attribution License (CC BY). The use, distribution or reproduction in other forums is permitted, provided the original author(s) and the copyright owner(s) are credited and that the original publication in this journal is cited, in accordance with accepted academic practice. No use, distribution or reproduction is permitted which does not comply with these terms.
*Correspondence: Yunxia Zheng, emhlbmd5eEB0eXBob29uLm9yZy5jbg==
 Zheliang Zhang
 Yunxia Zheng
 Hao Li