- 1State Key Laboratory of Severe Weather, Chinese Academy of Meteorological Sciences, Beijing, China
- 2China Meteorological Administration Training Centre, Beijing, China
- 3School of Atmospheric Sciences, Nanjing University of Information Science and Technology, Nanjing, China
The complex interactions between a tropical cyclone (TC) and the midlatitude upper-level trough or cutoff low (sometimes called a cold-core vortex) can lead to an unusual track, such as sudden turning motion, and intensity change of the tropical cyclone, often leading to large forecast errors. In this study, the track and intensity changes of Typhoon Bavi (2020) under the influence of the upper-level trough and the detached cutoff low from its base are investigated based on numerical experiments using the advanced Weather Research and Forecasting (WRF) model. Bavi formed over the western North Pacific between Taiwan and Okinawa Islands on 23 August 2020. Under the influence of an upper-level trough to the north, Bavi initially moved northeastward. As the trough propagated eastward, a cutoff low was detached from the base of the trough on the next day. The downward penetration of the upper-level cutoff low led to a sudden northwestward turning motion of Bavi when it intensified to a severe typhoon and then moved almost due north and made landfall over North Korea. These changes and processes are well captured in a control numerical experiment. In a sensitivity experiment with the mid-latitude upper-level trough removed in the initial conditions, the tropical cyclone moved primarily north-northeastward after 1-day simulation without the sudden northwestward turning. This track change led to an earlier landfall of the storm over South Korea and, thus, an earlier weakening than in the control experiment, which is termed as the indirect effect on the storm intensity due to the change in the tropical cyclone track. The results also show that eddy angular momentum flux convergence associated with the upper-level trough contributed little to the simulated tropical cyclone intensification, while the environmental vertical wind shear is key to the intensity change of Bavi.
1 Introduction
Skillful prediction of tropical cyclone (TC) sudden track change and intensity remains one of the great challenges for both research and operational communities. Although the improvements in TC track and intensity forecasts are envisioned over the past few decades, large track and intensity errors still occur in some situations (Wang and Wu, 2004). Particularly, large errors are often related to the unusual sudden change in TC motion and rapid intensification (Elsberry et al., 2013). In addition, the multiscale interactions between the TC and its environmental weather and climate systems make the forecasts of TC track and intensity changes more difficult (Xin et al., 2021).
TCs over the western North Pacific (WNP) often interact with the large-scale weather systems. In addition to the low-level systems, the upper-level synoptic systems, such as the nearby upper-level westerly trough and the associated cutoff low, often have significant impacts on TC track, intensity, and structure. Such effects have been given considerable attention in the literature (Holliday and Thompson, 1979; Hanley et al., 2001; Li et al., 2012; Leroux et al., 2013; Leroux et al., 2016; Wei et al., 2016; Fischer et al., 2019; Yan et al., 2021). Specifically, the upper-level outflow channel of a TC may be modified by the upper-level westerly trough, and the upper-level cutoff low may affect TC motion and intensity through downward penetration.
An upper-level westerly trough often induces TC recurvature, a typical track over the WNP. In those cases, a TC moves northwestward and turns northeastward in the Northern Hemisphere (Riehl and Shafer, 1944; George and Gray, 1976; JTWC, 1988; Dobos and Elsberry, 1993; O’Shay and Krishnamurti, 2004; Zhang et al., 2013). Favorable conditions for TCs to recurve in the WNP include the southward penetration of a midlatitude upper-level westerly trough and the eastward retreat of the WNP subtropical high (Riehl and Shafer, 1944; George and Gray, 1976; Holland and Merrill, 1984; Elsberry, 1990; Evans et al., 1991). Yu and Kwon (2005) noticed the recurvature tracks of typhoons Olga (1999) and Prapiroon (2000) under the influence of the midlatitude trough, although they mainly focused on the TC intensity change. Wu et al. (2009) found that the steering effect of the midlatitude trough is one of the dominant factors that led to the recurvature of Typhoon Shanshan (2006). By evaluating the structure and evolution of the total energy singular vectors, Kim and Jung (2009) revealed the dominant role of the midlatitude trough in the track recurvature of Typhoon Usagi (2007). Other studies have mainly focused on the TC intensity change when the TC interacts with an upper-level trough. Leroux et al. (2016) provided a comprehensive map summarizing processes that may lead to TC intensity change under the influence of the upper-level forcing (see their Figure 1). Among those effects, it is still hard to distinguish whether the upper-level trough is “good” or “bad” for the development of a TC.
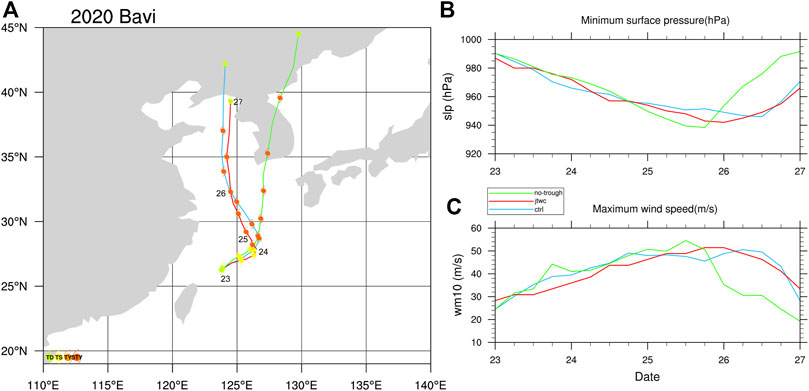
FIGURE 1. (A) Track of Typhoon Bavi (2010) with every 6-h position indicated by solid circles with different colors for different categories in storm intensity, (B) the storm’s central sea level pressure (hPa), and (C) the maximum sustained 10-m wind speed (m s−1) from 0000 UTC 23 August to 0000 UTC 27 August 2020 based on the JTWC best track data (red) and from both CTRL (blue) and No-trough (green) experiments.
The TC–trough interaction can induce a favorable environment for TC intensification. First, the upper-level outflow of a TC can be enhanced by the inward eddy angular momentum flux, which can lead to the strengthening of the secondary circulation and eyewall convection, and thus favorable for TC intensification (Sadler, 1975; Holland and Merrill, 1984; Merrill, 1988a, Merrill, 1988b; Molinari and Vollaro, 1989; Molinari and Vollaro, 1990; Molinari et al., 1995; Rodgers et al., 1991; Shi et al., 1997; Bosart et al., 2000; Titley and Elsberry, 2000). The upper-level potential vorticity (PV) associated with the midlatitude trough can serve as a dynamical forcing and also destabilizes the atmospheric vertical column, enhancing convection and the secondary circulation and, thus, the intensification of TC (Hoskins, 1990; Montgomery and Farrel, 1993; Molinari et al., 1995, 1998; Hanley et al., 2001). In addition, the upper-level trough is often accompanied by the upper-level westerly jet. The right entrance of the jet can trigger upward motion, which can enhance the outflow and eyewall convection when a TC moves into the region (Hoskins et al., 1985; Rodgers et al., 1991; Shi et al., 1997; Hanley et al., 2001; Komaromi and Doyle, 2018). Some other studies also found that the TC–trough interaction can trigger the secondary eyewall formation in TCs and lead to TC intensity change (Leoux et al., 2013; Leoux et al., 2016; Komaromi and Doyle, 2018). The TC–trough interaction may be unfavorable for TC intensification or lead to TC weakening. An approaching trough may bring strong vertical wind shear (VWS) that is unfavorable for TC intensification (Lewis and Jorgensen, 1978; Hanley et al., 2001). The cold and dry air intrusion may reduce the entropy gradient between the environment and the TC core and weaken the TC (Zhang et al., 2016).
The TC–trough interaction can be sensitive to the strength and depth of the trough and the initial structure of the TC (Kimball and Evans, 2002). Leroux et al. (2016) showed that the PV configuration associated with the upper-level trough increases the upper-level divergence while preventing strong VWS to affect TC Dora (2007). They found that TC intensification under the upper-level forcing is greater for stronger TCs and is favorable when the TC and the trough is at an appropriate distance. Based on idealized simulations, Komaromi and Doyle (2018) found that when the center of a TC is within 0.2–0.3 times the wavelength of a trough in the zonal direction and 0.8–1.2 times the amplitude of the trough in the meridional direction, the strong TC–trough interaction favors the occurrence of the TC intensification. From the climatological study of TCs in the North Atlantic during 1989–2016, Fischer et al. (2019) found that rapid intensifying TCs frequently occurred under the influence of the upper-level trough with shorter zonal wavelengths, especially at the base of the trough and greater upstream TC–trough displacement.
A number of studies have identified the eddy angular momentum flux convergence (EFC) as a parameter indicating the occurrence of TC–trough interaction (Molinari and Vollaro, 1990; Yu and Kwon, 2005; Komaromi and Doyle, 2018), but some other studies found that large EFC might not be a favorable factor for TC development (Titley and Elsberry 2000; Peirano et al., 2016). DeMaria et al. (1993) examined the EFC during the 1989–1991 hurricane seasons over the North Atlantic and found that TCs intensified just after the period of enhanced EFC. They defined the TC–trough interaction as any time when the EFC exceeded 10 m s−1 d−1 within 1,500 km of the TC center. When interacting with a trough, a TC over warm water is more likely to intensify than weaken in the composite study of TCs in the North Atlantic during 1985–1996 (Hanley et al., 2001). They adopted DeMaria’s 1993 criterion of the TC–trough interaction but added a temporal threshold, namely, the enhanced EFC must have lasted for two consecutive 12-h periods. Based on TCs over the North Atlantic during 1979–2014, Peirano et al. (2016) revisited the TC–trough interaction and found that troughs have a negative effect on TC intensification, and the EFC is a poor predictor of TC intensity change compared to the associated environmental VWS.
Large TC track forecast errors are often related to sudden turning motion or recurvature of TCs (George and Gray, 1976; Peak and Elsberry, 1986; Holland and Wang, 1995; Elsberry et al., 2013). In the WNP, most of TCs that experienced sudden turning motion are influenced by changes in large-scale circulations or synoptic interactions (George and Gray, 1976; Hodanish and Gray, 1993; Liu and Chan, 2003; Fudeyasu et al., 2006). The equatorial penetration of a midlatitude westerly trough or/and the associated cutoff low often provides favorable synoptic conditions for sudden turning motion or recurvature of a TC (Lander, 1996). Some previous statistical studies have indicated that part of the intensity forecast errors are related to errors in the predicted TC track, or equivalently skillful intensity forecasts may benefit from the improved track forecasts (DeMaria, 2010; Du et al., 2013; Kieu et al., 2021).
Most of the previous studies on the TC–trough interaction are based on global reanalysis data or real-case simulations to investigate the impact of TC–trough interaction on TC intensification as mentioned previously. However, few studies have focused on the sensitivity of the TC track to the upper-level trough or cutoff low, subsequently affecting the TC intensity change. In this study, Typhoon Bavi (2020) was chosen as a case study to illustrate how the upper-level trough affected the TC track and the associated intensity change. Bavi was selected because there were large differences in its track and intensity among the deterministic forecasts by different operational forecasting systems (Zhou et al., 2022). Notably, Bavi’s track was more difficult to predict than its intensity. Our study focuses on the dynamic processes that contributed to the northwestward track turning of Bavi, and the consequence of the track change under the influence of the midlatitude upper-level trough and the associated cutoff low based on numerical sensitivity experiments. Bavi experienced two sharp turning motions during its lifetime. One is the turning toward the northeast on August 23 and then the sudden northwestward turn on the next day. We will show that the interaction between the TC and the upper-level trough (and the associated cutoff low) played key roles in leading to the sudden track change but had little direct effect on the intensity. We will address the following two questions: what are the synoptic features or mechanisms that caused the special track of Bavi? Is the midlatitude upper-level trough “favorable” or “unfavorable” for the intensification of Bavi? The rest of the paper is organized as follows. Section 2 describes the data, model, and experimental design. An overview of Typhoon Bavi is given in Section 3. The simulation results are analyzed in Section 4. The robustness of the results is discussed with additional experiments in Section 5. Main conclusions are drawn in the last section.
2 Data, model, and experimental design
The fifth generation of the European Centre for Medium-Range Weather Forecasting (ECMWF) atmospheric reanalysis (ERA5) dataset was used to describe the synoptic conditions. The ERA5 dataset was chosen because of its high horizontal resolution (0.25° x 0.25°) and has shown improved representation of the location and intensity of TCs (Hersbach et al., 2020). The best track data are obtained from the Joint Typhoon Warning Center (JTWC), which include the 6-hourly TC position (longitude and latitude), maximum sustained near-surface wind speed, and minimum sea level pressure.
The numerical simulations presented in this study were performed using version 4.3.3 of the Advanced Research Weather Research and Forecasting Model (ARW-WRF; Skamarock et al., 2019), with three 2-way interactive nested meshes with horizontal grid spacings of 27, 9, and 3 km, respectively. The three meshes have sizes of 320 × 320, 310 × 310, and 478 × 358 grid points, respectively. The outermost mesh is fixed, and the two nested inner meshes automatically move following the model TC during the model integration so that the model TC is always located near the mesh centers. The model has 60 vertical levels extending from the surface to the model top at 50 hPa. The model’s physics include the Thompson cloud microphysics scheme (Thompson et al., 2008), Yonsei University planetary boundary layer (PBL) scheme (YSU, Hong et al., 2006), Rapid Radiative Transfer Model (RRTM; Mlawer et al., 1997) for longwave radiation calculation and the Dudhia scheme (Dudhia, 1989) for shortwave radiation calculation, Noah land surface scheme (Ek et al., 2003) for land surface processes, and Kain–Fritsch scheme (Kain, 2004) applied for the outermost model domain.
The model initial and lateral boundary conditions and daily SST dataset were obtained from the National Centers for Environment Prediction (NCEP) Global Forecast System (GFS) Final Analysis (FNL). The spectral nudging method was applied to the outermost domain to preserve the large-scale flow with wavelengths longer than 1,000 km throughout the model simulations (Wang et al., 2013). In the control experiment (CTRL), the upper-level trough to the north of the TC vortex was initially present as in the FNL analysis. In the sensitivity experiment (No-trough), the upper-level trough above 500 hPa, which is located to the north of Bavi, was removed in the initial fields by a smoothing algorithm (cubical smoothing algorithm with five-point approximation) such that the upper-level westerly trough was effectively filtered out in the initial conditions. As a result, a comparison of the simulations between CTRL and No-trough can help reveal the influences of the upper-level trough and its associated cutoff low on the track and intensity evolution of Typhoon Bavi.
3 An overview of the observed and simulated Typhoon Bavi (2020)
On 19 August 2020, a broad area of low pressure about a couple of hundred miles northeast of the Philippines archipelago developed. The system rapidly organized on the next day and became a tropical depression on August 21 and was subsequently named Bavi by the JTWC. Bavi gradually strengthened between Taiwan and Okinawa over the WNP and subsequently moved northward and further strengthened into a tropical storm on 22 August. Bavi experienced a brief rapid intensification followed by a slow intensification from 23 August (Figures 1B,C) and moved east-northeastward (Figure 1A). It suddenly turned northwestward and was upgraded to a typhoon by the next day. Bavi further intensified to a severe typhoon on 25 August, turned to the north, and reached its peak intensity on 26 August. Soon afterward, as Bavi continued moving northward, it weakened rapidly. Finally, it made landfall over North Korea and became an extratropical cyclone.
Figure 2 depicts the evolution of the 200-hPa PV and wind fields from 0000 UTC 23 to 1200 UTC 25 August from the ERA5 analyses. On 23 August, there was a northeast-southwest-oriented westerly trough located north of 30oN between 120o–135oE, which was accompanied by strong cyclonic PV anomalies (Figure 2A). Bavi was located near the base of the trough axis to the north. This configuration indicates the possible TC–trough interaction. The westerly trough propagated eastward and later a cutoff low appeared and was detached from the base of the trough at 1200oUTC 24 (Figure 2D). The cutoff low was maintained at around 135oE and 30oN, with the maximum PV of 6oPVU and to the east of the TC near the time when Bavi turned northwestward. As Bavi continued moving northward under the influence of the new-coming westerly trough, the cutoff low dissipated.
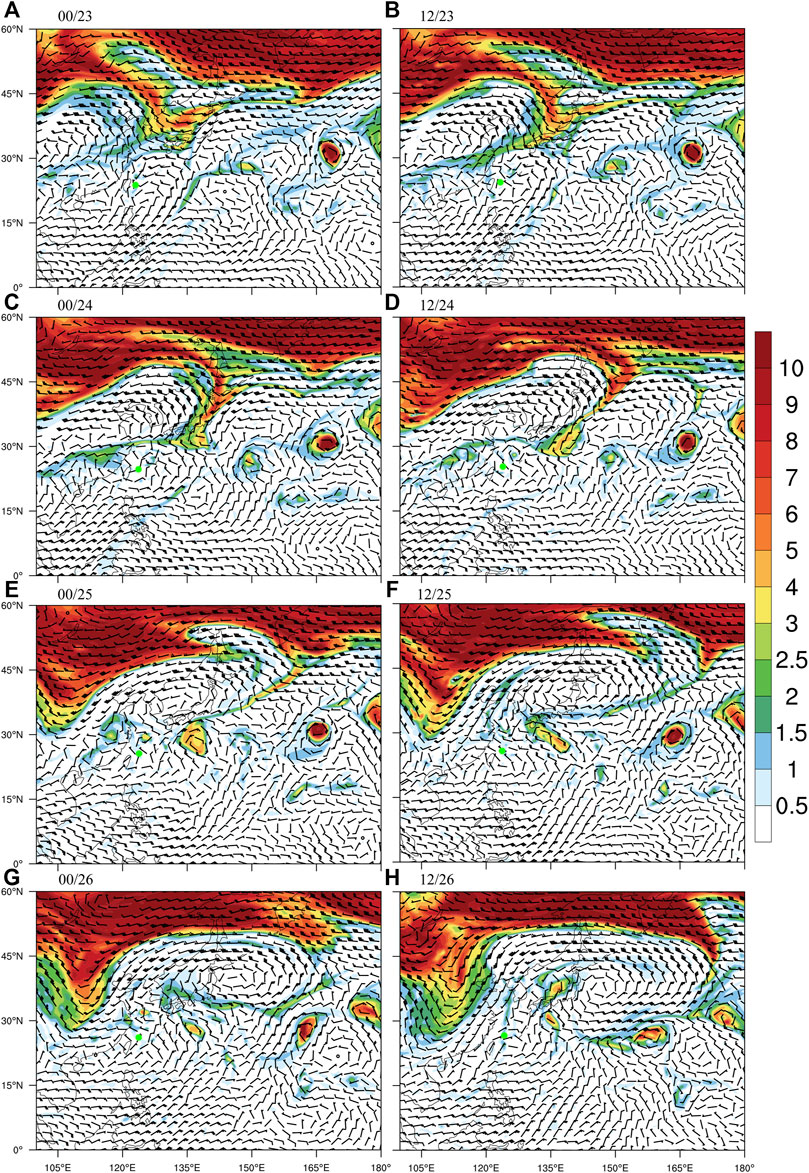
FIGURE 2. 200-hPa wind barbs (m s−1) and potential vorticity (shaded, PVU) based on ERA5 reanalysis data for Typhoon Bavi with 12-h intervals. The green dot indicates the TC center from the JTWC best track data.
The CTRL experiment simulated the track of Bavi reasonably well compared with the JTWC best track, except for some small errors during the turning period and the extratropical transition stage (Figure 1A). Both CTRL and No-trough simulated the northeastward movement on the first day but considerable differences between the two experiments appeared after one and half day of simulations. The simulated Bavi in CTRL turned suddenly northwestward after one-and-half-day simulation, while that in No-trough turned nearly north-northeastward. The large track differences between CTRL and No-trough indicate that the TC–trough interaction contributed to the unusual motion of Bavi.
The simulated Bavi shows similar intensity evolution in CTRL and No-trough in terms of the central sea level pressure and the maximum sustained near-surface wind speed and compared reasonably well with those shown in the JTWC best track data (Figures 1B,C). The rapid weakening of the storm in No-trough occurred earlier than in CTRL mainly because the storm made landfall over South Korea instead of the west of North Korea. This suggests that the upper-level trough had little direct effect on the simulated storm intensity when the storm was not affected by landfall. Large difference in intensity at the later stage was mainly due to the indirect effect associated with the changes in the simulated storm track. Such an indirect effect, however, has not been discussed in previous studies.
Figure 3 shows the 200-hPa PV, wind, and geopotential height fields simulated in CTRL and No-trough. The simulated large-scale fields in the CTRL (Figures 3A–D) show little deviation from those in the FNL analysis throughout the simulation. In the No-trough experiment (Figures 3E–H), because the trough originally located north to Bavi was removed at the initial time, the cutoff low detached from the base of the westerly trough was absent during the simulation. The weak westerly trough appeared to the north of the TC after 1-day simulation was due to the eastward propagation of the PV maximum and westerly trough to the north of 43oN at the initial time. Almost no TC–trough interaction occurred in this case because the weak trough was about 2,000 km northeast of the TC center by the end of the simulation. Note that in the simulation, the northern boundary of the smoothing area to remove the westerly trough at the initial time was chosen to be 43 N, but the results are similar if the northern boundary is moved further northward (not shown).
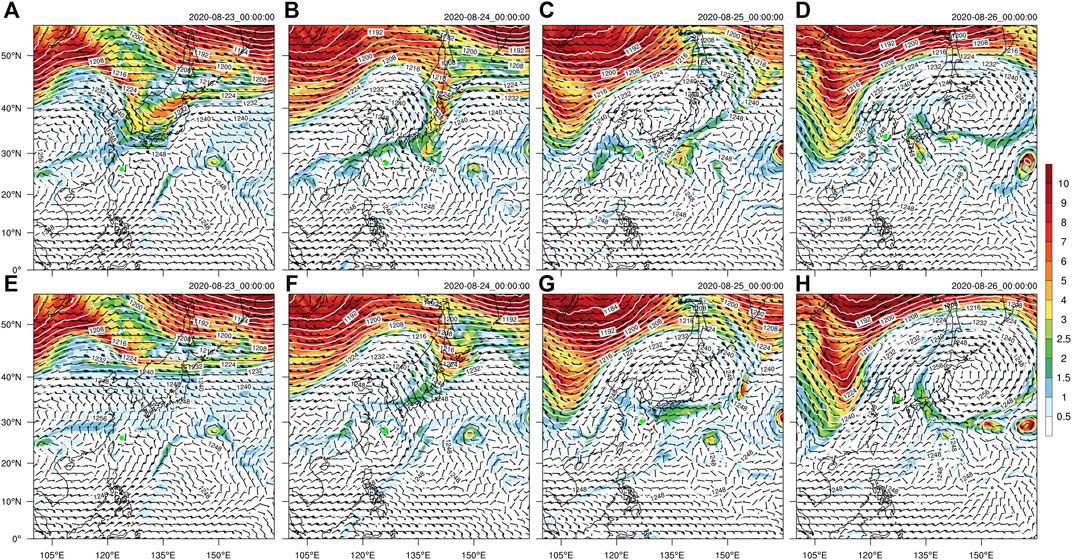
FIGURE 3. Simulated PV (shaded, PVU), wind vectors, and geopotential height (contour, m) at 200 hPa. The upper panels are for CTRL experiment and the lower panels are for No-trough experiment, respectively.
4 Effect of the upper-level trough on the track and intensity of the simulated Bavi
4.1 Relationship between the tropical cyclone track change and the steering flow
The TC track change is often related to changes in the large-scale environmental steering flow. The steering flow is often defined as the averaged wind vector between 300 and 850 hPa or at the nearly nondivergent level around 500 hPa (Wang and Elsberry, 1998). In this study, we calculated the steering flow as a wind vector averaged within a radius of 500 km from the TC center between 900 and 200 hPa. As we can see from Figure 4, the motion of the TC follows the steering flow well in the two experiments. The steering flow shows a strong northward component after one-and-half-day simulations in both experiments. The direction change of the zonal component of the steering flow is responsible for the sudden northwestward change of the track in CTRL, while the zonal component of the steering flow is always positive with a small magnitude in No-trough, indicating the slowly north-northeastward movement of the TC.
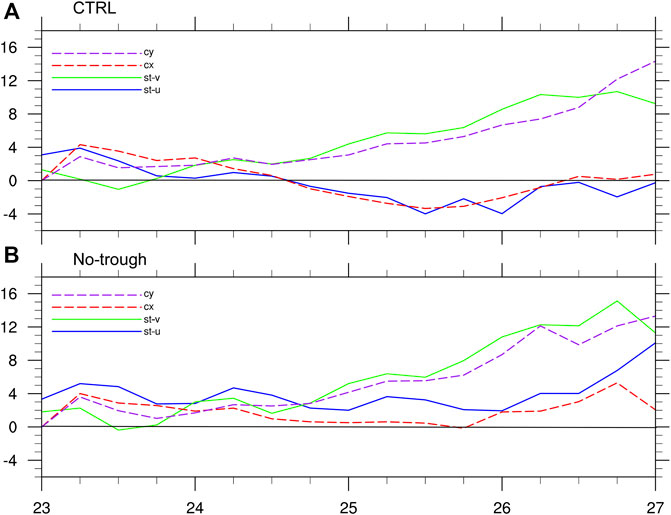
FIGURE 4. Time series of the zonal and meridional components (cx, cy; m s−1) of TC translation speed estimated with difference of the TC center positions and steering flow (st-u, st-v; m s−1) in the CTRL (A) and in No-trough experiments.
The TC movement is mainly steered by the asymmetric flow across the TC center. Figure 5 shows the evolution of the asymmetric wind fields at 500 hPa within 500 km from the TC center at 0000 UTC 24, 1200 UTC 24, 0000 UTC 25, and 0000 UTC 26, respectively, in CTRL and in No-trough. The calculated asymmetric flow is consistent with the TC motion, and the track change is largely caused by the change in the steering flow. The TC structure is nearly axisymmetric with weak asymmetric wind on the first day (Figure 5A), leading to the slowdown of the northeastward motion. In the next 12 h (Figure 5B), relatively strong northeasterly winds occurred in the northeastern quadrant of the TC, showing the interaction with the upper-level cutoff low. The southerly winds are prevalent in the northwestern quadrant of the TC, in agreement with the sudden northwestward turning motion of the TC. Weak southerly winds occur southwest of the TC center, while weak easterly winds appear east of the TC center, corresponding to the continuous northwestward motion of the TC during 1200 UTC 24 and 0000 UTC 25, (Figure 5C). By the next day (Figure 5D), the acceleration of motion speed is due to the gradually enhanced southerly winds in both the eastern and northwestern quadrants of the TC.

FIGURE 5. Simulated 500-hPa asymmetric winds (vectors, m s−1) and speeds greater than 2 m s−1 (shaded) in the 9-km domain in both CTRL (upper panels) and No-trough (lower panels). Black and blue thick arrows indicate the TC motion vector and the averaged asymmetric wind vector within 500 km from the TC center. Black dotted circles are 250 and 500 km away from the TC centers.
The asymmetric flow pattern in No-trough is greatly different from that in CTRL. At 0000 UTC 24 August (Figure 5E), strong southerly flow is dominant in the southeastern quadrant of the TC inner core, causing the northeastward turning of the TC track. In the next 12 h (Figure 5F), the TC structure becomes quasi-axisymmetric with relatively weak asymmetric winds, the TC continues moving northeastward. The TC accelerates due to the enhanced southerly winds outside the inner core since 0000 UTC 25 August (Figure 5G). During 0000 UTC 25–0000 UTC 26 August (Figure 5H), strong southerly winds rapidly spread in both the inner and outer core regions, leading to the faster north-northeastward movement of the TC. The direction of the TC motion corresponds well with the mean asymmetric wind vector at 500 hPa. This demonstrates that the middle-level asymmetric wind pattern can well indicate the TC motion.
4.2 Vertical penetration effect of the upper-level systems
The steering flow and the asymmetric winds over the TC core are largely controlled by the large-scale circulation that the storm is embedded. In the Bavi case, part of the steering flow is related to the vertical penetration effect of the upper-level synoptic system, namely, the cutoff low detached from the base of the westerly trough to the north as mentioned above. During the turning motion of the TC from 23 to 24 August, the upper-level PV streamer propagated along with the northwesterly winds down to the base of the trough. Then, a cutoff low characterized by cyclonic PV maximum and cyclonic circulation was detached from the base of the upper-level trough from 1200 UTC 24 August. To examine the interaction between the TC and the upper-level cutoff low, the orbiting tracks of the two systems are shown in Figure 6A. The interaction began when the two systems were oriented in the southwest-northeast direction. From 24 to 26 August, the separation distance between the TC and the upper-level cutoff low was around 1,000–1,200 km, which is within the critical distance of about 1,500 km defined by Patla et al. (2009). In the study by Patla et al. (2009), the upper-level system is a tropical upper-tropospheric trough (TUTT) cell, while here, the upper-level system is the cutoff low detached from the base of the westerly trough as an independent circulation system.
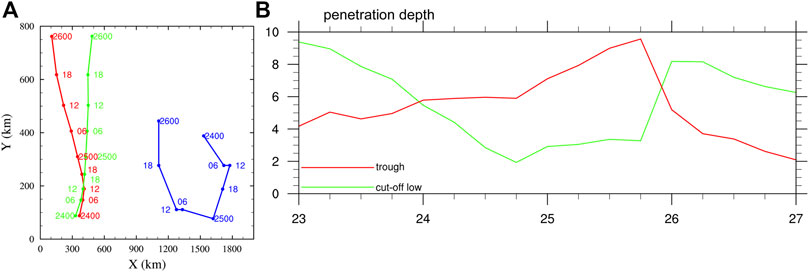
FIGURE 6. (A) Tracks of the TC and the cutoff low. The red (green) curve represents the track in CTRL (No-trough), and the blue curve denotes the track of the cutoff low and (B) the time evolution of the lowest level at which the upper-level trough and cutoff low can penetrate (km).
The upper-level cutoff low had a maximum PV of 5–6 PVU with a diameter of about 1,200 km based on the 200 hPa 0.5 PVU isoline. The cutoff low was located to the northeast of the TC center initially and then orbited anticyclonically with time because of the effect of the anticyclonic circulation in the outflow of Bavi from 0000 UTC 24 to 0012 UTC 24 August. Later, the directions of the TC and the upper-level cutoff low suddenly changed, with the TC moving from north-northeastward to northwestward and the upper-level cutoff low moving from southeastward to southwestward. During this period, the upper-level cutoff low increasingly affected the TC motion through vertical penetration and was responsible for the sudden northwestward turning motion of the TC. This is different from the track guidance for the influence of a TUTT cell on TC motion given by Patla et al. (2009). In their conceptual model, the TC moves toward the northeast if the upper-level TUTT cell is located to the northeast of the TC center. In No-trough with the cutoff low greatly suppressed, the TC kept moving north-northeastward, indicating that the upper-level cutoff low contributed to the northwestward motion of Typhoon Bavi during 24 and 25 August.
To further demonstrate the downward penetration effect of the upper-level system on the northwestward motion of Bavi, we estimated the Rossby penetration depth, which is defined as D = I×LR/N, where LR is the horizontal scale of the upper-level system, I is the inertial stability, and N is Brunt–Väisälä frequency. The horizontal scale of the upper-level cutoff low (trough) is defined as the outermost radius of the 0.5 PVU isoline of PV anomaly. The inertial stability at 200 hPa is calculated by using the tangential winds and relative vorticity radially averaged within the LR. N is also calculated within the LR at 200 hPa. For simplicity, D is shown as the lowest level to which the upper-level system can penetrate. There are two kinds of interactions during the track turning and the intensification of Typhoon Bavi (Figure 6B). During 23–24 August, the winds from the upper-level westerly tough can penetrate downward to around a 4-km height, indicating that the upper-level trough and the TC interacted with each other and the winds above 4 km were influenced by the upper-level trough. On the next day, the upper-level trough continuously propagated eastward with its base detached to form a cutoff low. The PV anomalies of the upper-level trough can penetrate down to about a 5.5-km height but become less penetrative from 1800 UTC 24 to 1800 UTC 25 August, indicating that the upper-level trough had a decreasing impact on the TC motion. However, the penetration depth increased again afterward because of the influence of the new-coming westerly trough from the west.
With the development of the upper-level cutoff low, the penetration depth increased with time. The largest penetration depth occurred on 1800 UTC 24 August, which corresponds to the direction change of the TC motion, indicating that the TC motion was influenced by the cutoff low. As the separation distance between the TC and the cutoff low increased, the effect of the upper-level cutoff low on the TC motion became negligible from 1800 UTC 25 August. The results, thus, strongly suggest that the Rossby penetration depth can help quantitatively evaluate the effects of the synoptical system on TC motion. In the case of Typhoon Bavi, both the upper-level trough and the associated cutoff low interacted with the TC at different stages of the TC development. Such interaction at different vertical levels contributed to the change in the steering flow and, thus, the TC motion.
4.3 Effects of vertical wind shear and eddy angular momentum flux convergence on intensity change of Bavi
Previous studies have demonstrated that the trough-related VWS in the TC environment can affect TC intensity change (Hanley et al., 2001; Peirano et al., 2016). The environmental VWS is commonly measured as the vector difference in the horizontal winds averaged over an area within a given radius (e.g., within a radius of 500 km from the TC center with the TC circulation removed) between 200 and 850 hPa (Emanuel, 2000; Zehr, 2003; Paterson et al., 2005). To investigate the effect of the environmental VWS associated with the upper-level circulation systems on the TC intensity change, we calculated the deep-layer shear between 200 and 850 hPa, upper-layer shear between 200 and 500 hPa, and low-layer shear between 500 and 850 hPa with the results shown in Figure 7.
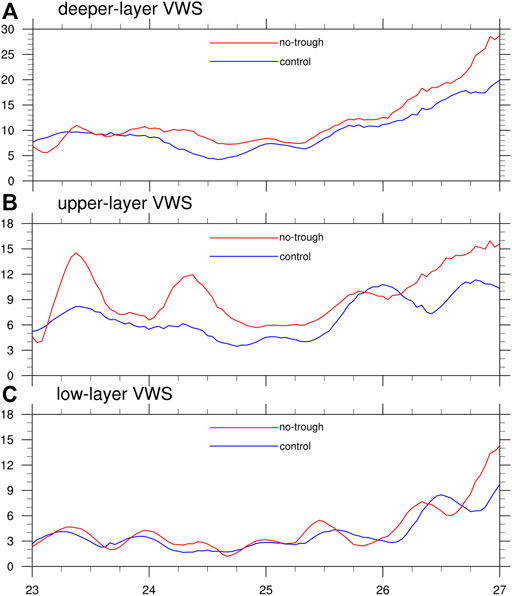
FIGURE 7. Time series of the deep-layer shear (A) between 200 and 850 hPa (m s−1), upper-layer shear (B) between 200 and 500 hPa (m s−1), and low-layer shear (C) between 500 and 850 hPa (m s−1) in CTRL (blue) and No-trough (red), respectively.
In CTRL, there were moderate deep-layer shear (between 4.5 and 11 m s−1; Rios-Berrios and Torn, 2017) and upper-layer shear during the first 60 h of the simulation, consistent with the intensification period of the TC. Both the deep-layer shear and upper-layer shear then decreased gradually until 1000 UTC 24 August except that a transient large shear value appeared at 0000 UTC 25 August but increased rapidly when the new-coming upper-level trough approached the TC. The low-layer shear exhibited steady evolution before the TC reached its maximum intensity at 0000UTC 26 August and then increased with time quickly. There existed a lagged correlation between the low-layer shear and the deep-layer shear. In No-trough, both the deep-layer shear and the upper-layer shear were greater than 6 m s−1 for most of the time during the TC intensification period except that two transient large values of around 15 m s−1 and 10 m s−1 appeared at 0800 UTC 23 and 0800 UTC 24 August. The deep-layer shear and the upper-layer shear began to increase after 1000 UTC 25 August and reached their maximum values by the end of the simulation. The low-layer shear was weak during the TC intensification period and began to increase after the TC reached its peak intensity, consistent with the evolution in CTRL. There also existed a lagged correction between the deep/upper-layer shear and the low-layer shear as well as the TC intensity. In both experiments, the TC intensity is highly correlated with the low-layer shear, which is consistent with some statistical results for TCs over the WNP (Shu et al., 2013; Wang et al., 2015). Note that the deep-layer shear and the upper-layer shear are largely correlated with the 200-hPa wind. The magnitude of deep-layer shear and upper-layer shear are relatively smaller in CTRL than in No-trough due to the westerly trough to the north in the former being replaced by the westerly jet in the latter. These results suggest that the upper-layer shear may have a relatively weaker effect on TC intensity change than the low-layer shear for TCs interacting with the midlatitude westerly systems (Elsberry and Jeffries, 1996; Wang et al., 2015; Finocchio et al., 2016).
In addition to the environmental VWS, the EFC is often used to quantitatively characterize the TC–trough interaction through both the magnitude and duration (e.g., Molinari and Vollaro, 1989). From the perspective of balanced response, the upper-level trough can be viewed as a momentum source, which can spin-up the TC outflow and increase the upper-level divergence and eyewall ascending model, leading to the falling of the central pressure and the increase in surface wind. The TC–trough interaction is assumed to occur when the EFC averaged within 300–600 km of the TC center at 200 hPa is greater than 10 (m s−1) day−1 (DeMaria et al., 1993; Hanley et al., 2001). The value of the EFC was greater than 10 (m s−1) day−1 in the first day of the simulation in CTRL (Figure 8), indicating that the trough was within 300–600 km radii of the TC center. Namely, the southwesterlies ahead of the upper-level trough did reach the inner radii of the TC, leading to the convergence of the eddy angular momentum at the upper levels and thus the spin-up of the outflow. The EFC was not persistently large during the intensification period from 24 to 26 August when the westerly trough moved eastward, and the cutoff low was detached from the trough base and began to interact with Bavi. The interaction between the TC and cutoff low was associated with weak EFC and did not satisfy the criteria for the TC–trough interaction given in previous studies (Molinari and Vollaro, 1989; DeMaria et al., 1993; Hanley et al., 2001).
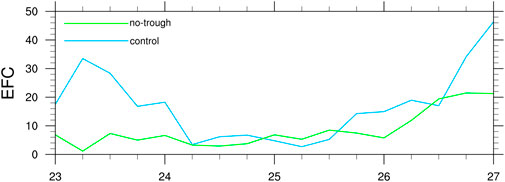
FIGURE 8. Time series of the EFC (m s−1 day−1) averaged over the annulus between the radii of 300–600 km at 200 hPa.
Although previous studies found that large EFC related to the upper-level trough is favorable for TC intensification, our results imply that the enhanced EFC used as a precursor for TC intensity change may depend on the type of the TC–trough interactions (Fischer et al., 2019). The TC continued to intensify after the TC interacted with the cutoff low. Note that when the TC reached its peak intensity, the EFC began to increase again. The enhanced EFC at the end of the simulation indicates the strengthened TC–trough interaction due to the new-coming trough. However, this new trough seemed to be a “bad-trough” and unfavorable for TC intensification. In No-trough, the EFC in the inner radii of the TC was almost unchanged in the 4-day simulation until 0600 UTC 26 August, showing quite small EFC forcing at the inner radii of the TC. This is consistent with the removal of the upper-level trough and subsequently, the absence of the upper-level cutoff low.
In addition, we noticed that the trough-induced large EFC that occurred on the first day of the simulation in CTRL could directly affect the outflow. The outflow in CTRL (Figure 9A) was much stronger than that in No-trough (Figure 9B). The enhanced outflow could strengthen the secondary circulation and thus the storm intensification. However, although the EFC differed greatly in the two experiments, the TC intensity evolution was comparable. This suggests that the TC–trough interaction might play a secondary role in the intensity change of Typhoon Bavi. The intensity change may be influenced more predominantly by the environmental VWS than the EFC in this case, which is consistent with the composite study by Peirano et al. (2016).
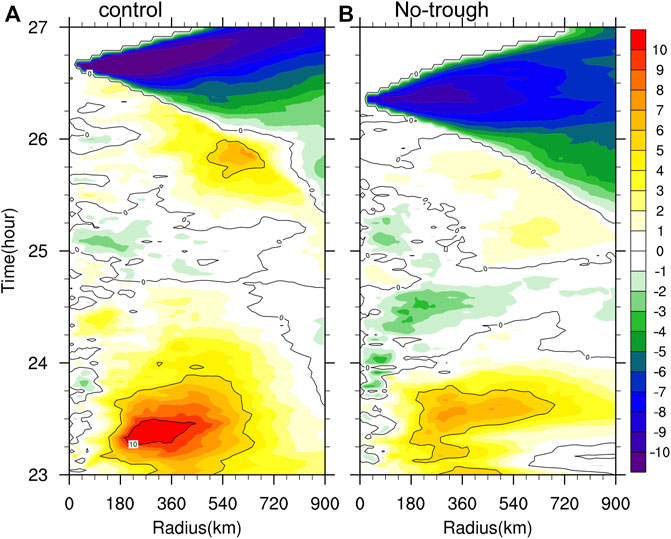
FIGURE 9. Radius–time plots of 200-hPa azimuthal-mean radial wind (m s−1) in CTRL (A) and No-trough (B), respectively.
5 Discussion with additional sensitivity experiments
The results discussed in Section 4 are based on one initial time. To see the robustness of the finding, similar experiments were conducted with the model initialized 24 h earlier. The upper-level westerly trough was orientated in the northeast-southwest direction and located north of 30oN between 115 and 130oE (Figure 10A). The PV maximum associated with the trough was concentrated near the trough line. At this time, Typhoon Bavi was located to the southeast of the trough line, which remained as the trough moved eastward. In No-trough, the aforementioned westerly trough was removed (Figure 10) as done in the No-trough experiment discussed in Section 4.
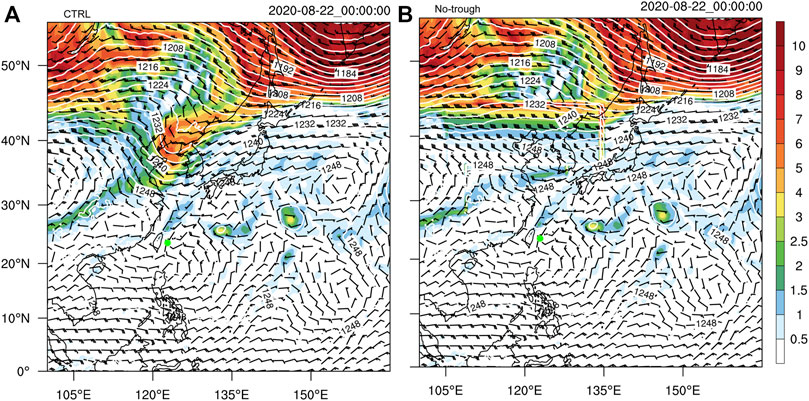
FIGURE 10. Simulated PV (shaded, PVU), wind vectors, and geopotential height (contour, m) at 200 hPa at the initial time of 0000 UTC 22 August in CTRL (A) and No-trough (B), respectively.
The simulated TC track and intensity in CTRL are similar to the observed (Figure 11). The TC began to move northeastward and then turned toward to the east-northeast as it interacted with the upper-level westerly trough. The sudden direction change occurred at 1200 UTC 24 August when the TC was influenced by the cutoff low, leading to the northwestward turning motion of the TC. The approach of the new-coming westerly trough caused the TC to accelerate northward eventually. In No-trough with the westerly trough initially removed, the TC moved northeastward after 2-day simulation and then turned northward with a faster translation speed than that in CTRL. The intensity in both experiments showed little difference in the first 4-day simulations. Significant differences appeared in the last day of the simulation, which was primarily due to the difference in the simulated TC track. This is an indirect effect of the upper-level trough on TC intensity. The direct effect of the upper-level trough on the TC is on the storm track in this case.
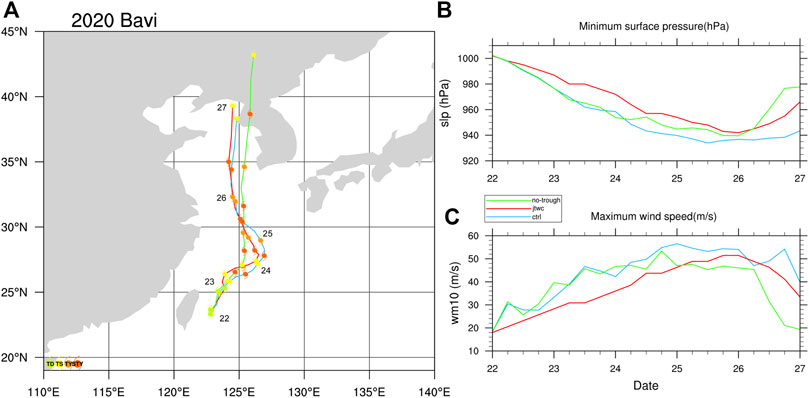
FIGURE 11. (A) Track of Typhoon Bavi (2010) with every 6-h position indicated by solid circles with different colors for different categories in storm intensity, (B) the storm’s central sea level pressure (hPa), and (C) the maximum sustained 10-m wind speed (m s−1) from 0000 UTC 22 to 0000 UTC 27 August 2020 based on the JTWC best track data (red) and from CTRL (blue) and No-trough (green).
An examination of the EFC (Figure 12A) confirms that the first TC–trough interaction occurred from 1800 UTC 23 to 0600 UTC 24 August and the second occurred from 0000 UTC 26 August, consistent with the result in the simulation initialized 24-h later discussed in Section 4. The steady evolution of the moderate VWS (Figures 12B–D) favored the TC intensification but the increased deep-layer shear associated with the new-coming upper-level westerly trough became unfavorable for TC intensification after 1000 UTC 25 August. Note that the VWS magnitude in the two experiments shows little difference. This further confirms that the VWS is the main control of TC intensification during the TC–trough interaction, consistent with the results discussed in Section 4 and also the findings by Peirano et al. (2016).
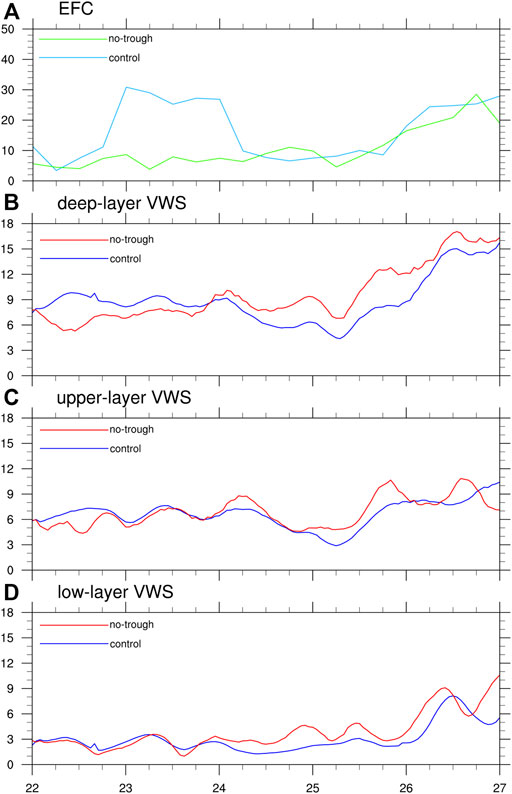
FIGURE 12. Time series of (A) the EFC (m s−1 day−1) calculated at 200 hPa averaged over the 300–600 km annulus and the deep-layer shear (B) between 200 and 850 hPa (m s−1), upper-layer shear (C) between 200 and 500 hPa (m s−1), and low-layer shear (D) between 500 and 850 hPa (m s−1) in CTRL (blue) and No-trough (red), respectively.
The aforementioned results together with those in Section 4 strongly suggest that the TC–trough interaction is complicated and more attention should be given to the relative importance of favorable and unfavorable aspects of the interaction. In addition to the direct effect, attention needs to be paid to the indirect effect as well. The TC–trough interaction directly led to the track change in the Typhoon Bavi case, while the effect on TC intensity was insignificant until the TC reached its peak intensity. Large intensity difference occurred by the end of the simulations largely due to the track difference. This effect is termed as the indirect effect of the TC–trough interaction in this study, which has not been emphasized in previous studies.
6 Conclusion
In this study, the effects of a midlatitude upper-level westerly trough on the track and intensity of Typhoon Bavi (2020) over the WNP has been investigated through numerical experiments using the advanced WRF model. Typhoon Bavi formed over the WNP on 23 August 2020 and moved northeastward between Taiwan and Okinawa Islands under the influence of the upper-level westerly trough. As the upper-level trough to the north of the TC center propagated eastward, a cutoff low formed as a detached circulation from the base of the westerly trough on the next day. The enhanced circulation of the cutoff low increased the vertical penetration depth, imposing a considerable effect on the motion of Bavi and leading to a sudden northwestward turning motion. Bavi intensified to a severe typhoon and moved almost due north under the influence of the upper-level cutoff low and finally made landfall over North Korea.
The aforementioned processes were well captured in a control numerical experiment and further confirmed with an experiment in which the upper-level westerly trough was removed in the initial conditions. Namely, in the experiment No-trough with the upper-level westerly trough above 500 hPa removed by a smoothing algorithm, the TC moved primarily north-northeastward after 1-day simulation without the sudden northwestward turning. We also showed that the interactions between the TC and the upper-level trough or the cutoff low were dominated by the downward penetration and steering effects on Bavi’s motion, while the effect of the environmental VWS associated with the upper-level systems showed little differences between the two experiments, implying that the VWS might play a secondary role in causing the different motion of the storm in the two experiments.
Although the EFC was shown to have an influence on the TC outflow through enhancing the TC outflow, the TC intensity showed little difference in the two experiments, while the EFC showed large different evolutions. This demonstrates that the TC–trough interaction is complicated, and the EFC is not always a good indicator of TC intensification, while the related VWS is the main control, at least in the Bavi case. Although the moderate deep-layer shear and upper-layer shear are favorable for the intensification of Bavi, the low-layer shear is also important to the intensity change of Typhoon Bavi. In the Bavi case, the increase in deep-layer shear and upper-layer shear occurred prior to the increase in the low-layer shear, and the increase in the low-layer shear corresponded well with the weakening of the TC in the late stage of the simulations.
The results from this study also show that the upper-level systems (including the westerly trough and the subsequent cutoff low) affect the TC motion through the downward penetration and modifying the steering flow. Such a downward penetration effect played a secondary role in affecting the TC intensification because the TC intensity change showed similar evolution before landfall in the experiments with and without the upper-level westerly trough. The difference in TC intensity in the later stage was mainly an indirect effect of the earlier landfall due to the change in the TC track. It should be pointed out that the interaction between a TC and the upper-level trough or cutoff low is complicated and could be quite sensitive to the relative location of the two systems. Komaromi and Doyle (2018) conducted idealized simulations to understand the TC–trough interactions, but they did not include the westerly jet environment. This study can be extended by conducting semi-idealized simulations with the upper-level trough of different strength and size and at different relative locations from the TC, which will be further conducted in a follow-up study.
Data availability statement
The original contributions presented in the study are included in the article/Supplementary Material; further inquiries can be directed to the corresponding author.
Author contributions
HW designed the study. HW, HX, DZ and JL analyzed the datasets and generated figures. HW and YY wrote the manuscript with contributions from Yuqing Wang.
Funding
This study was supported by the National Natural Science Foundation of China under grants 42175008, 42192554, and 41730960; National Key R&D Program of China under grant 2017YFC1501602 and 2022YFC3004200; Basic Research Fund of Chinese Academy of Meteorological Sciences (2020Y015); and Open Grants of the State Key Laboratory of Severe Weather (2021LASW-A14).
Conflict of interest
The authors declare that the research was conducted in the absence of any commercial or financial relationships that could be construed as a potential conflict of interest.
Publisher’s note
All claims expressed in this article are solely those of the authors and do not necessarily represent those of their affiliated organizations, or those of the publisher, the editors, and the reviewers. Any product that may be evaluated in this article, or claim that may be made by its manufacturer, is not guaranteed or endorsed by the publisher.
References
Bosart, L. F., Bracken, W. E., Molinari, J., Velden, C. S., and Black, P. G. (2000). Environmental influences on the rapid intensification of hurricane opal (1995) over the gulf of Mexico. Mon. Weather Rev. 128, 322–352. doi:10.1175/1520-0493(2000)128<0322:eiotri>2.0.co;2
DeMaria, M., Kaplan, J., and Baik, J. (1993). Upper-level eddy angular momentum fluxes and tropical cyclone intensity change. J. Atmos. Sci. 50 (8), 1133–1147. doi:10.1175/1520-0469(1993)050<1133:uleamf>2.0.co;2
DeMaria, M. (2010). “Tropical cyclone intensity change predictability estimates using a statistical-dynamical model,” in 29th conf. On hurricanes and tropical meteorology (Tucson, AZ: Amer. Meteor. Soc.). AvaliableAt: https://ams.confex.com/ams/29Hurricanes/techprogram/paper_167916.htm.
Dobos, P. H., and Elsberry, R. L. (1993). Forecasting tropical cyclone recurvature. Part I: Evaluation of existing methods. Mon. Wea. Rev. 121, 1273–1278. doi:10.1175/1520-0493(1993)121<1273:ftcrpi>2.0.co;2
Du, T. D., Ngo-Duc, T., Hoang, M. T., and Kieu, C. Q. (2013). A study of connection between tropical cyclone track and intensity errors in the WRF model. Meteor. Atmos. Phys. 122, 55–64. doi:10.1007/s00703-013-0278-0
Dudhia, J. (1989). Numerical study of convection observed during the winter monsoon experiment using a mesoscale two-dimensional model. J. Atmos. Sci. 46, 3077–3107. doi:10.1175/1520-0469(1989)046<3077:nsocod>2.0.co;2
Ek, M. B., Mitchell, K. E., Lin, Y., Rogers, E., Grunmann, P., Koren, V., et al. (2003). Implementation of Noah land surface model advances in the national centers for environmental prediction operational mesoscale eta model. J. Geophys. Res. 108, 2002JD003296. doi:10.1029/2002JD003296
Elsberry, L. E., Chen, L.-S., Davidson, J., Rogers, R., Wang, Y., and Wu, L. (2013). Advances in understanding and forecasting rapidly changing phenomena in tropical cyclones. Trop. Cyclone Res. Rev. 2, 13–24. doi:10.6057/2013TCRR01.02
Elsberry, R. L. (1990). International experiments to study tropical cyclones in the Western North Pacific. Bull. Amer. Meteor. Soc. 71, 1305–1316. doi:10.1175/1520-0477(1990)071<1305:ietstc>2.0.co;2
Elsberry, R. L., and Jeffries, R. (1996). Vertical wind shear influences on tropical cyclone formation and intensification during TCM-92 and TCM-93. Mon. Wea. Rev. 124, 1374–1387. doi:10.1175/1520-0493(1996)124<1374:vwsiot>2.0.co;2
Emanuel, K. A. (2000). A statistical analysis of tropical cyclone intensity. Mon. Wea. Rev. 128, 1139–1152. doi:10.1175/1520-0493(2000)128<1139:asaotc>2.0.co;2
Evans, J. L., Holland, G. J., and Elsberry, R. L. (1991). Interactions between a barotropic vortex and an idealized subtropical ridge. Part I: Vortex motion. J. Atmos. Sci. 48, 301–314. doi:10.1175/1520-0469(1991)048<0301:ibabva>2.0.co;2
Finocchio, P. M., Majumdar, S. J., Nolan, D. S., and Iskandarani, M. (2016). Idealized tropical cyclone responses to the height and depth of environmental vertical wind shear. Mon. Weather Rev. 144, 2155–2175. doi:10.1175/MWR-D-15-0320.1
Fischer, M. S., Tang, B. H., and Corbosiero, K. L. (2019). A climatological analysis of tropical cyclone rapid intensification in environments of upper-tropospheric troughs. Mon. Weather Rev. 147 (10), 3693–3719. doi:10.1175/MWR-D-19-0013.1
Fudeyasu, H., Iizuka, S., and Matsuura, T. (2006). Impact of ENSO on landfall characteristics of tropical cyclones over the Western North Pacific during the summer monsoon season. Geophys. Res. Lett. 33, L21815. doi:10.1029/2006GL027449
George, J. E., and Gray, W. M. (1976). Tropical cyclone motion and surrounding parameter relationships. J. Appl. Meteor. 15 (12), 1252–1264. doi:10.1175/1520-0450(1976)015<1252:tcmasp>2.0.co;2
Hanley, D. E., Molinari, J., and Keyser, D. (2001). A composite study of the interactions between tropical cyclones and upper-tropospheric troughs. Mon. Wea. Rev. 129, 2570–2584. doi:10.1175/1520-0493(2001)129<2570:acsoti>2.0.co;2
Hersbach, H., Bell, B., Berrisford, P., Hirahara, S., Horanyi, A., Munoz-Sabater, J., et al. (2020). The ERA 5 global reanalysis. Q. J. R. Meteorol. Soc. 146, 1999–2049. doi:10.1002/qj.3803
Hodanish, S., and Gray, W. M. (1993). An observational analysis of tropical cyclone recurvature. Mon. Wea. Rev. 121, 2665–2689. doi:10.1175/1520-0493(1993)121<2665:aoaotc>2.0.co;2
Holland, G. J., and Merrill, R. T. (1984). On the dynamics of tropical cyclone structural changes. Q. J. R. Meteorol. Soc. 110, 723–745. doi:10.1002/qj.49711046510
Holland, G. J., and Wang, Y. (1995). Baroclinic dynamics of simulated tropical cyclone recurvature. J. Atmos. Sci. 52, 410–426. doi:10.1175/1520-0469(1995)052<0410:bdostc>2.0.co;2
Holliday, C. R., and Thompson, A. H. (1979). Climatological characteristics of rapidly intensifying typhoons. Mon. Wea. Rev. 107 (8), 1022–1034. doi:10.1175/1520-0493(1979)107<1022:ccorit>2.0.co;2
Hong, S., Noh, Y., and Dudhia, J. (2006). A new vertical diffusion package with an explicit treatment of entrainment processes. Mon. Weather Rev. 134 (9), 2318–2341. doi:10.1175/MWR3199.1
Hoskins, B. J., Mclntyre, M. E., and Robertson, A. W. (1985). On the use and significance of isentropic potential-vorticity maps. Q. J. R. Meteorol. Soc. 111, 877–946. doi:10.1002/qj.49711147002
Hoskins, B. J. (1990). Theory of extratropical cyclones. Amer. Meteor. Soc. 64, 63–80. doi:10.1007/978-1-944970-33-8_5
JTWC (1988). 1988 annual tropical cyclone report. Guam, USA: Joint Typhoon Weather Center, 216. Available At: http://www.usno.navy.mil/NOOC/nmfc-ph/RSS/jtwc/atcr/1988atcr.pdf.
Kain, J. S. (2004). The Kain–Fritsch convective parameterization: An update. J. Appl. Meteor. 43, 170–181. doi:10.1175/1520-0450(2004)043<0170:tkcpau>2.0.co;2
Kieu, C., Evans, C., Jin, Y., Doyle, J. D., Jin, H., and Moskaitis, J. (2021). Track dependence of tropical cyclone intensity forecast errors in the COAMPS-TC model. Weather Forecast. 36 (2), 469–485. doi:10.1175/WAF-D-20-0085.1
Kim, H. M., and Jung, B. (2009). Singular vector structure and evolution of a recurving tropical cyclone. Mon. Weather Rev. 137 (2), 505–524. doi:10.1175/2008MWR2643.1
Kimball, S. K., and Evans, J. L. (2002). Idealized numerical simulations of hurricane–trough interaction. Mon. Wea. Rev. 130, 2210–2227. doi:10.1175/1520-0493(2002)130<2210:insoht>2.0.co;2
Komaromi, W. A., and Doyle, J. D. (2018). On the dynamics of tropical cyclone and trough interactions. J. Atmos. Sci. 75, 2687–2709. doi:10.1175/JAS-D-17-0272.1
Lander, M. (1996). Specific tropical cyclone track types and unusual tropical cyclone motions associated with a reverse-oriented monsoon trough in the Western North Pacific. Weather Forecast. 11, 170–186. doi:10.1175/1520-0434(1996)011<0170:stctta>2.0.co;2
Leroux, M. D., Plu, M., Barbary, D., Roux, F., and Arbogast, P. (2013). Dynamical and physical processes leading to tropical cyclone intensification under upper-level trough forcing. J. Atmos. Sci. 70, 2547–2565. doi:10.1175/JAS-D-12-0293.1
Leroux, M. D., Plu, M., and Roux, F. (2016). On the sensitivity of tropical cyclone intensification under upper-level trough forcing. Mon. Weather Rev. 144, 1179–1202. doi:10.1175/mwr-d-15-0224.1
Lewis, B. M., and Jorgensen, D. P. (1978). Study of the dissipation of hurricane gertrude (1974). Mon. Wea. Rev. 106 (9), 1288–1306. doi:10.1175/1520-0493(1978)106<1288:sotdoh>2.0.co;2
Li, Y., Guo, L., Ying, Y., and Hu, S. (2012). Impacts of upper-levelcold vortex on the rapid change of intensity and motion of Typhoon Meranti (2010). J. Trop. Meteor. 18, 207–219. doi:10.3969/j.issn.1006-8775.2012.02.010
Liu, K. S., and Chan, J. C. L. (2003). Climatological characteristics and seasonal forecasting of tropical cyclones making landfall along the south China coast. Mon. Weather Rev. 131, 1650–1662. doi:10.1175//2554.1
Merrill, R. T. (1988b). Characteristics of the upper-tropospheric environmental flow around hurricanes. J. Atmos. Sci. 45, 1665–1677. doi:10.1175/1520-0469(1988)045<1665:cotute>2.0.co;2
Merrill, R. T. (1988a). Environmental influences on hurricane intensification. J. Atmos. Sci. 45, 1678–1687. doi:10.1175/1520-0469(1988)045<1678:eiohi>2.0.co;2
Mlawer, E. J., Taubman, S. J., Brown, P. D., Iacono, M. J., and Clough, S. A. (1997). Radiative transfer for inhomogeneous atmospheres: RRTM, a validated correlated-k model for the longwave. J. Geophys. Res. 102, 16663–16682. doi:10.1029/97JD00237
Molinari, J., Skubis, S., Vollaro, D., Alsheimer, F., and Willoughby, H. E. (1998). Potential vorticity analysis of tropical cyclone intensification. J. Atmos. Sci. 55, 2632–2644. doi:10.1175/1520-0469(1998)055<2632:pvaotc>2.0.co;2
Molinari, J., Skubis, S., and Vollaro, D. (1995). External influences on hurricane intensity. Part III: Potential vorticity structure. J. Atmos. Sci. 52, 3593–3606. doi:10.1175/1520-0469(1995)052<3593:eiohip>2.0.co;2
Molinari, J., and Vollaro, D. (1989). External influences on hurricane intensity. Part I: Outflow layer eddy angular momentum fluxes. J. Atmos. Sci. 46, 1093–1105. doi:10.1175/1520-0469(1989)046<1093:eiohip>2.0.co;2
Molinari, J., and Vollaro, D. (1990). External influences on hurricane intensity. Part II: Vertical structure and response of the hurricane vortex. J. Atmos. Sci. 47, 1902–1918. doi:10.1175/1520-0469(1990)047<1902:eiohip>2.0.co;2
Montgomery, M. T., and Farrell, B. F. (1993). Tropical cyclone formation. J. Atmos. Sci. 50, 285–310. doi:10.1175/1520-0469(1993)050<0285:tcf>2.0.co;2
O’Shay, A. J., and Krishnamurti, T. N. (2004). An examination of a model’s components during tropical cyclone recurvature. Mon. Wea. Rev. 132, 1143–1166. doi:10.1175/1520-0493(2004)132<1143:aeoamc>2.0.co;2
Paterson, L. A., Hanstrum, B. N., Davidson, N. E., and Weber, H. C. (2005). Influence of environmental vertical wind shear on the intensity of hurricane-strength tropical cyclones in the Australian region. Mon. Weather Rev. 133, 3644–3660. doi:10.1175/MWR3041.1
Patla, J. E., Stevens, D., and Barnes, G. M. (2009). A conceptual model for the influence of TUTT cells on tropical cyclone motion in the Northwest Pacific Ocean. Weather Forecast. 24 (5), 1215–1235. doi:10.1175/2009WAF2222181.1
Peak, J. E., and Elsberry, R. L. (1986). Prediction of tropical cyclone turning and acceleration using empirical orthogonal function representations. Mon. Wea. Rev. 114, 156–164. doi:10.1175/1520-0493(1986)114<0156:potcta>2.0.co;2
Peirano, C. M., Corbosiero, K. L., and Tang, B. H. (2016). Revisiting trough interactions and tropical cyclone intensity change. Geophys. Res. Lett. 43, 5509–5515. doi:10.1002/2016GL069040
Riehl, H., and Shafer, R. J. (1944). The recurvature of tropical storms. J. Meteor. 1, 42–54. doi:10.1175/1520-0469(1944)001<0001:trots>2.0.co;2
Rios-Berrios, R., and Torn, R. D. (2017). Climatological analysis of tropical cyclone intensity changes under moderate vertical wind shear. Mon. Weather Rev. 145, 1717–1738. doi:10.1175/MWR-D-16-0350.1
Rodgers, E. B., Chang, S. W., Stout, J., Steranka, J., and Shi, J. J. (1991). Satellite observations of variations in tropical cyclone convection caused by upper-tropospheric troughs. J. Appl. Meteor. 30, 1163–1184. doi:10.1175/1520-0450(1991)030<1163:soovit>2.0.co;2
Sadler, J. C. (1975). The monsoon circulation and cloudiness over the GATE area. Mon. Wea. Rev. 103, 369–387. doi:10.1175/1520-0493(1975)103<0369:tmcaco>2.0.co;2
Shi, J. J., Chang, S., and Raman, S. (1997). Interaction between Hurricane Florence (1988) and an upper-tropospheric westerly trough. J. Atmos. Sci. 54, 1231–1247. doi:10.1175/1520-0469(1997)054<1231:ibhfaa>2.0.co;2
Shu, S., Wang, Y., and Bai, L. (2013). Insight into the role of lower-layer vertical wind shear in tropical cyclone intensification over the Western North Pacific. Acta Meteorol. Sin. 27, 356–363. doi:10.1007/s13351-013-0310-9
Skamarock, W. C., Klemp, J. B., Dudhia, J., Gill, D. O., Barker, D. M., Wang, W., et al. (2019). A description of the Advanced Research WRF Model version 4. NCAR Tech. Note NCAR/TN-556+STR, 145. doi:10.5065/1dfh-6P97
Thompson, G., Field, P. R., Rasmussen, R. M., and Hall, W. D. (2008). Explicit forecasts of winter precipitation using an improved bulk microphysics scheme. Part II: Implementation of a new snow parameterization. Mon. Weather Rev. 136 (12), 5095–5115. doi:10.1175/2008MWR2387.1
Titley, D. W., and Elsberry, R. L. (2000). Large intensity changes in tropical cyclones: A case study of super typhoon flo during TCM-90. Mon. Wea. Rev. 128, 3556–3573. doi:10.1175/1520-0493(2000)128<3556:licitc>2.0.co;2
Wang, B., Elsberry, R. L., and Wang, Y. (1998). Dynamics in tropical cyclone motion: A review. Chin. J. Atmos. Sci. 22, 416–434.
Wang, H., Wang, Y., and Xu, H.-M. (2013). Improving simulation of a tropical cyclone using dynamical initialization and largescale spectral nudging: A case study of typhoon megi (2010). Acta Meteorol. Sin. 27, 455–475. doi:10.1007/s13351-013-0418-y
Wang, Y., Rao, Y., Tan, Z.-M., and Schonemann, D. (2015). A statistical analysis of the effects of vertical wind shear on tropical cyclone intensity change over the Western North Pacific. Mon. Weather Rev. 143, 3434–3453. doi:10.1175/MWR-D-15-0049.1
Wang, Y., and Wu, C.-C. (2004). Current understanding of tropical cyclone structure and intensity changes-A review. Meteorol. Atmos. Phys. 87, 257–278. doi:10.1007/s00703-003-0055-6
Wei, N., Li, Y., Zhang, D. L., Mai, Z., and Yang, S. Q. (2016). A statistical analysis of the relationship between upper-tropospheric cold low and tropical cyclone track and intensity change over the Western North Pacific. Mon. Wea. Rev. 144, 1805–1822. doi:10.1175/MWR-D-15-0370.1
Wu, C., Chen, S., Chen, J., Chou, K., and Lin, P. (2009). Interaction of Typhoon Shanshan (2006) with the midlatitude trough from both adjoint-derived sensitivity steering vector and potential vorticity perspectives. Mon. Weather Rev. 137 (3), 852–862. doi:10.1175/2008mwr2585.1
Xin, J.-J., Yu, H., and Chen, P.-Y. (2021). Evaluation of tropical cyclone intensity forecasts from five global ensemble prediction systems during 2015-2019. J. Trop. Meteor. 27 (3), 218–231. doi:10.46267/j.1006-8775.2021.020
Yan, Z., Ge, X., Wang, Z., Wu, C., and Peng, M. (2021). Understanding the impacts of upper-tropospheric cold low on typhoon jongdari (2018) using piecewise potential vorticity inversion. Mon. Weather Rev. 149 (5), 1499–1515. doi:10.1175/MWR-D-20-0271.1
Yu, H., and Kwon, H. J. (2005). Effect of TC–trough interaction on the intensity change of two typhoons. Weather Forecast. 20 (2), 199–211. doi:10.1175/WAF836.1
Zehr, R. M. (2003). Environmental vertical wind shear with Hurricane Bertha (1996). Weather Forecast. 18, 345–356. doi:10.1175/1520-0434(2003)018<0345:evwswh>2.0.co;2
Zhang, G., Wang, Z., Dunkerton, T. J., Peng, M. S., and Magnusdottir, G. (2016). Extratropical impacts on Atlantic tropical cyclone activity. J. Atmos. Sci. 73, 1401–1418. doi:10.1175/JAS-D-15-0154.1
Zhang, W., Leung, Y., and Chan, J. C. L. (2013). The analysis of tropical cyclone tracks in the western north pacific through data mining. Part II: Tropical cyclone landfall. J. Appl. Meteorol. Climatol. 52 (6), 1417–1432. doi:10.1175/JAMC-D-12-046.1
Keywords: midlatitude upper-level trough, typhoon, track and intensity, numerical study, vertical wind shear (VWS)
Citation: Wang H, Yu Y, Xu H, Zhao D and Liang J (2023) A numerical study on the effects of a midlatitude upper-level trough on the track and intensity of Typhoon Bavi (2020). Front. Earth Sci. 10:1056882. doi: 10.3389/feart.2022.1056882
Received: 29 September 2022; Accepted: 31 October 2022;
Published: 12 January 2023.
Edited by:
Liguang Wu, Fudan University, ChinaReviewed by:
Xiaogang Huang, National University of Defense Technology, ChinaYubin Li, Nanjing University of Information Science and Technology, China
Zhanhong Ma, National University of Defense Technology, China
Copyright © 2023 Wang, Yu, Xu, Zhao and Liang. This is an open-access article distributed under the terms of the Creative Commons Attribution License (CC BY). The use, distribution or reproduction in other forums is permitted, provided the original author(s) and the copyright owner(s) are credited and that the original publication in this journal is cited, in accordance with accepted academic practice. No use, distribution or reproduction is permitted which does not comply with these terms.
*Correspondence: Yubin Yu, eXV5YkBjbWEuZ292LmNu
 Hui Wang
 Yubin Yu1,2*
 Dajun Zhao