 Margariete Malenda
 Tiziana Vanorio
- Rock and Geomaterials Laboratory, Stanford University, Stanford, CA, United States
Introduction: Large scale, Earth processes and bulk rock properties are influenced by underpinning, dynamic, microstructures within rocks and geomaterials. Traditionally, the amount of porosity has been considered the primary control on important bulk rock properties like seismic wave velocities (Vp and Vs) and permeability. However, in tight rocks, velocity and permeability (k) can change substantially despite small changes in the amount of porosity during cracking. Therefore, other microstructural features inherent to given lithologies, such as heterogeneity and anisotropy in mineral properties are considered as factors controlling these bulk rock properties. Understanding which microstructural features control Vp, Vs, and permeability in tight rocks is useful in applications like enhanced geothermal systems (EGS), where thermal shocking is used to increase permeability. Thermal shocking involves injecting surface water into the subsurface to cool mineral crystals, induce contraction of crystals, and cause thermal cracking.
Methods: We tested three tight lithologies with unique microstructures; granodiorite (SWG), basalt (PTB), and carbonate (MSA). We simulated thermal shocking by slowly heating samples to 350°C and then quenching them. We chose a temperature of 350°C because thermal shocking at this temperature is not well documented in literature, and this temperature is relevant to EGS. Using time-lapse microimaging, we assessed how thermal cracking occurs in each lithology and explored how thermal cracks influence connected porosity, Vp, Vs, and k.
Results: Microimaging shows extensive cracking in the SWG and MSA lithologies, and little to no cracking in PTB with thermal shocking treatment. Vp and Vs became more pressure sensitive, and elastic moduli decreased with treatment for all lithologies. This may be caused by reduced stiffness between mineral crystal boundaries with treatment.
Discussion: Lithologies with minerals that have anisotropy of or a wide range in thermal conductivity and/or thermal expansion coefficients can have increased thermal cracking. In thermally shocked SWG and MSA, Vp and Vs are good indicators of thermal cracking and k increases, but less so in PTB. Lithologies like PTB may require multiple thermal shock stimulations to increase permeability. Our results highlight how micro-scale changes influence bulk rock properties and when we can monitor permeability increases and microscale thermal cracking with Vp and Vs.
1 Introduction
Earth’s large-scale mechanisms are closely coupled with micro-scale processes and structures (Sengupta, 1997). In fact, in the discipline of material science, microstructural properties of engineered materials are deliberately designed to achieve desired macroscale or bulk material properties (Mercier et al., 2003). But as geoscientists, we have the need to reverse engineer bulk rock properties we observe or measure in the field or laboratory and determine how they are shaped by their underpinning microstructures. For example, fluid flow through microscale cracks and pores in rocks can contribute to the mass movement of underground fluid through a reservoir. Also, the existence of such microcracks (cracks less than 1 mm in length) can decrease the overall strength of a rock (Kranz, 1983). One bulk rock property that is extremely pertinent for geoscientists is the rock’s elastic behavior—how it responds to normal and shear forces applied when seismic waves travel through Earth (Bourbie et al., 1987; Burger et al., 2006). Understanding why rocks respond differently to seismic waves measured in the laboratory is critical to translating information from subsurface geophysical probing into the dynamic processes that change rock microstructures in the subsurface.
Therefore, many efforts have been made to correlate rock properties to seismic wave properties like compressional and shear wave velocities (Vp and Vs, respectively), all of which are measured in controlled laboratory environments. Traditionally, for high porosity (ϕ) rocks, the amount of ϕ is considered the first order control on the magnitude of Vp and Vs (Wyllie et al., 1962; Gregory, 1977). But in “tight rocks” (rocks with relatively low permeabilities; Law and Spencer, 1993; Tobin, 1997) there can be small spread in ϕ, and ϕ generally takes the form of low pore volume, microcracks. In these tight rocks, there is substantial scatter in Vp and Vs given this small spread in ϕ, and the general relationship between ϕ and bulk elastic rock properties does not hold. This indicates that factors other than porosity also control Vp and Vs in tight rocks, and in order to interpret seismic wave monitoring of tight reservoirs, properties other than ϕ must be sought out. The challenge is, we have yet to establish which rock properties are key to interpreting the subsurface when ϕ is not a viable option.
Such a key property may actually exist within the rock microstructure. For example, such a property could allow for a process, like cracking, to occur and alter the microstructure. More specifically, the role of microstructural geometric details in impacting bulk elastic properties, and therefore seismic monitoring, has never been fully understood or accurately incorporated into rock physics models (Bourbie et al., 1987; Mukerji and Mavko, 2006). These geometric details can take the form of arrangements, distributions and geometries of pores and mineral crystals. In fact, these geometries can influence micro-scale processes like crack formation and propagation and the resulting crack distribution. Without a full understanding of the geometric arrangement of the microstructure, the best we can do is estimate upper and lower bounds of bulk elastic behaviors using simple conceptual models of the microstructure (Mukerji and Mavko, 2006). However, a primary limitation to these conceptual models is that they often assume unrealistic pore geometries—such as pennies and spheroids. Therefore, these models are unable to fully describe properties of complex microstructures like the irregular crack networks that exist in actual reservoir rocks. Hence, we still struggle in estimating their bulk elastic properties. To add another layer of complexity, rocks of various lithologies can have different microstructures which dictate the rock’s stiffness, bulk density, and consequently its overall Vp and Vs. These variations in microstructures can result in distinct elastic behaviors for given lithologies. For example, tight rocks like volcanics and some carbonates have microstructures that are often comprised of mineral crystals that are assembled as interlocked crystals. In some cases, these interlocked crystals can be separated by the formation of pressure-sensitive microcracks. These microcracks can actually lower the magnitude of a tight rock’s Vp and Vs. However, if these thin, low aspect ratio, microcracks close in the presence of confining pressure, Vp and Vs can increase. Therefore, tight rocks with fewer microcracks may exhibit higher Vp and Vs at lower pressures compared to a tight rock with relatively more microcracks (Nur and Simmons, 1970; Nur, 1971; Coyner and Martin, 1988). It is important to note that this situation can exist with minimal to no difference in porosity between the two tight rocks.
Another factor that shapes elastic behavior is that the subsurface is dynamic, and therefore a rock’s microstructure can be altered over time through different processes. For example, as a rock experiences a thermal shock, or a change in temperature, its mineral crystals may either expand or contract. This expansion and contraction can generate what are called, ‘thermal cracks’ (Pearson, 1941; Johnson and Parsons, 1944; Heap et al., 2014). Thermal cracking is prevalent in geothermal reservoirs and is particularly pertinent to geothermal energy production (Siratovich et al., 2015; Eggertsson et al., 2020). Conventional geothermal systems (CGS) exist in reservoirs with naturally high permeability (k) that allows for water to circulate through pore spaces, heat up, and turn to steam, which is then produced to rotate a turbine and generate power (U.S. Department of Energy, 2019). Recently however, there is major interest in enhanced geothermal systems (EGS) because they have massive potential for energy production (McKittrick et al., 2019). These EGS reservoirs are often composed of tight rocks with low ϕ and k, preventing optimal fluid flow (U.S. Department of Energy, 2019). In order for fluid to cycle through these tight reservoirs, permeable pathways must be intentionally created. Traditionally, hydrofracking has been used to increase reservoir permeability in EGS, but because hydrofracking can result in induced seismicity, alternative, safer techniques must be explored (Hofmann et al., 2018). One alternative method to increase k is through injecting surface water (∼25°C–40°C) to chill naturally hot (>150°C) subsurface rocks using injection pressures lower than those used in hydrofracking (Dempsey et al., 2015; Rutqvist et al., 2015). When injected surface water comes in contact with the hot rock, a thermal shock is created and causes thermal cracking. These newly formed thermal cracks become pathways for fluid flow in the once impermeable reservoirs. Therefore, to enhance fluid flow, it is ideal to distinguish which microstructures, inherent to different reservoir lithologies, lend themselves to greater extents of thermal cracking. Yet, while we know the microstructure influences thermal cracking, we still have little understanding of which microstructures play key roles in thermal crack propagation (Daoud et al., 2020).
One approach to relate microstructures to given extents of thermal cracking is to document the underpinning microstructures through microimaging before and after heating and cooling. However, historically, microimaging has been difficult due to technological limitations. For example, optical microscopy coupled with thin sections, has been a popular method of microimaging rocks. But this technique has limited temporal resolution in that it cannot document time-lapse changes of the rock microstructure, due to the destructive nature of creating thin sections. Yet rock physicists have a crucial need to understand how rock microstructures and geological processes dynamically influence one another. Therefore, we turn to scanning electron microscopy (SEM), which involves non-destructive sample preparation. This allows us to image the same rock microstructures before and after any laboratory treatment meant to replicate geological processes. Particularly, with SEM imaging, we can observe how rock microstructures control certain processes—like thermal crack propagation. Therefore, SEM observations provide us with a fuller picture to better monitor changes in microstructural geometries with time-lapse microimaging (Vanorio, 2015). Such advancements can allow us to then correlate time-lapse, microstructural changes, like the propagation of thermal cracks, to time-lapse geophysical measurements, like Vp and Vs laboratory measurements. Establishing relationships between micro- to macro-scale time-lapse changes in the laboratory would allow us to better discern dynamic subsurface processes, like thermal cracking, from geophysical monitoring.
In attempts to relate thermal cracking to geophysical monitoring for geothermal reservoir development, benchtop Vp values (Yavuz et al., 2010; Jin et al., 2019; Shang et al., 2019) and Vs values (Keshavarz et al., 2010; Siratovich et al., 2015; Griffiths et al., 2018; Mordensky et al., 2019) were measured before and after thermal treatments that included heating and either slow cooling samples in air or quickly quenching samples in water (Supplementary Table S1). While benchtop Vp and Vs measurements can be helpful in documenting bulk elastic properties, an approach that is more representative of subsurface conditions includes Vp and Vs measurements taken in the presence of confining pressures. To our knowledge, few studies (Darot and Reuschlé, 2000; Vinciguerra et al., 2005) have measured confined Vp and Vs after documented thermal shocking, and only very few authors (Vinciguerra et al., 2005) complemented their confined Vp and Vs measurements with imaging of the rocks’ microstructures. One limitation of the microimaging approach by Vinciguerra et al., 2005 is that they imaged samples only before thermal treatment, therefore not documenting any resulting changes in the rock microstructure that could have influenced elastic rock properties. In order to improve seismic monitoring of tight, thermally shocked, geothermal reservoirs, we must build a systematic dataset that will aid in linking changes in Vp and Vs with increasing pressure to observations of thermal cracks generated in tight rocks of distinct microstructures.
In this paper, we systematically correlate microstructures of three tight lithologies to the extent of thermal cracking and to time-lapse, confined pressure Vp and Vs. measurements. We tested three lithologies prevalent in geothermal reservoirs: granodiorite, basalt, and carbonate. Each of our chosen lithologies inherently have their own distinct microstructural features, which allow us to constrain which microstructural geometries and features facilitate or hinder thermal shocking. Specifically, we focus on pore structure, mineralogy, and mineral thermal properties. With the SEM, we image our samples’ microstructures before and after thermally shocking them in order to specify which features are more relevant to thermal crack propagation. We also correlate our microstructural observations with benchtop and confined pressure Vp and Vs measurements taken before and after thermal treatment. Through microimaging and velocity measurements, we provide a systematic dataset that aids in linking microscale-controls and elastic properties in tight, geothermal reservoirs where thermal cracking is ubiquitous.
2 Materials and methods
2.1 Sample selection and lithologies imaging
We selected three tight lithologies prevalent in geothermal reservoirs: granodiorite, basalt, and carbonate (Figure 1). The general workflow including sample selection, characterization and treatment is shown in Figure 2. We tested three samples for each lithology, totaling nine samples, and all samples are 1” diameter, 1” long cores. Using X-ray diffraction (XRD), the Sierra White Granodiorite (SWG) samples were characterized by 35% calcium plagioclase, 30% sodium plagioclase, 24% quartz, 7% mica, and 4% hornblende (Table 1). The SWG samples were formed during a Mesozoic, regional, magmatic intrusion, and were later subjected to alteration and albitization (Crowder and Ross, 1973).
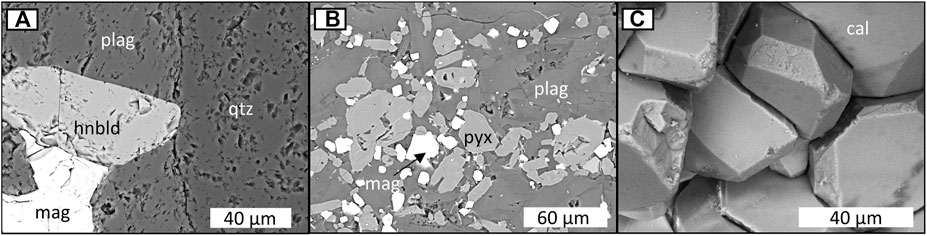
FIGURE 1. Tightly interlocked crystal structures of our selected granodiorite (A), basalt (B), and carbonate (C) samples. In particular, the SWG lithology has plagioclase (plag), hornblende (hnbld), quartz (qtz), and magnetite (mag) as identified with EDS. The PTB lithology as plag, pyroxene (pyx), and mag. The MSA lithology has calcite (cal) minerals here. All images were taken with an environmental SEM.
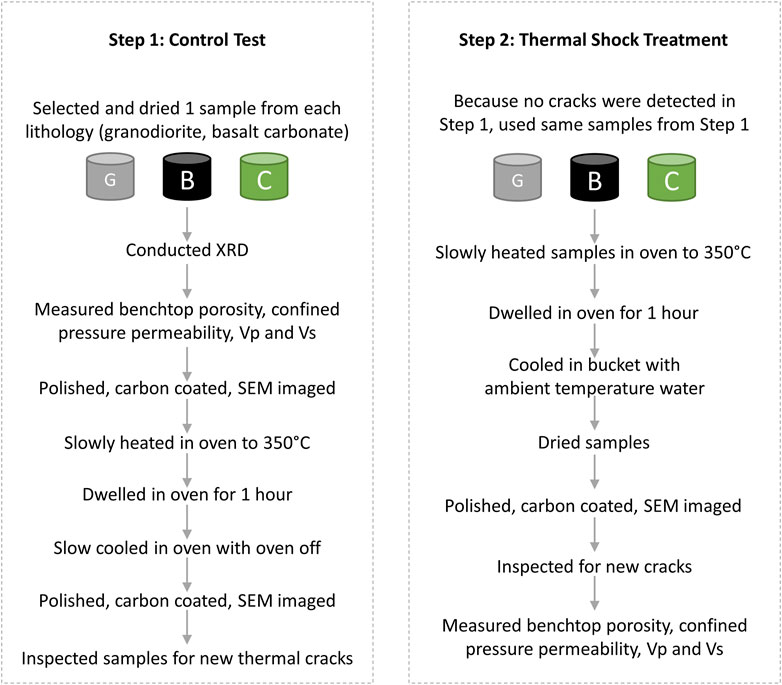
FIGURE 2. Workflow of how our experiment is conducted, including when we conducted various measurements, imaging, and thermal shock treatment. The left and right hand sides summarize tasks related to the control test and the thermal shock treatment procedure, respectively.
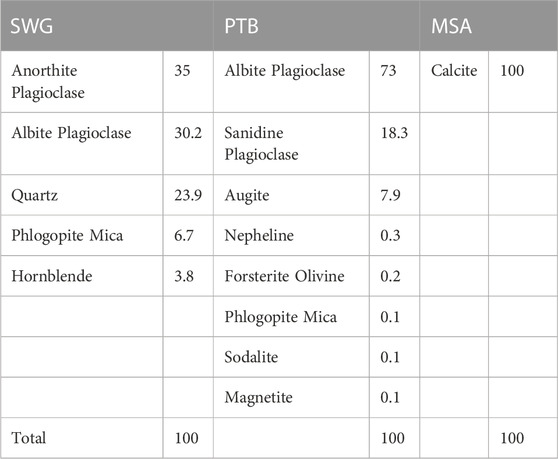
TABLE 1. Percent mineral composition (%) of the samples as characterized with XRD.
Two of the three Mt. Etna basalt samples are porphyritic trachybasalts (PTB, Tanguy et al., 1997) with 70% sodium plagioclase, 15% sanidine, 10% augite, and minimal (<5%) olivine and magnetite (Table 1). The third basalt sample is an alkali basalt (PAB) composed of 35% calcium plagioclase, 32% augite, 14% sanidine, 11% diopside, 7% olivine, and 1% magnetite (Table 1). Both the PTB and PAB samples were formed from a Mt. Etna eruption around two million years ago (Tanguy et al., 1997). This eruptive episode occurred while the volcanism was from more tholeiitic composition magma starting three million years ago to eventually more alkali magma (one to half a million years ago).
All three Mt. St. Angelo (MSA) carbonate samples are dominated by calcite (93%–100%), and one carbonate sample has minimal dolomite (7%) and quartz (<1%) detected in the XRD analysis (Table 1). Minimum quartz and amorphous SiO2 were observed during microimaging. The MSA samples were deposited in the Late Cretaceous as base-of-slope micro-crystalline calcite (micrite) (Borgomano, 2000). Micrite is specific to calcite crystals that range between 1–4 μm in width (Folk, 1959).
2.2 Lithologies imaging and rock physics measurements
Microstructural imaging was conducted to characterize pore and mineral crystal geometries, sizes, and distributions. Before imaging and thermal shock treatment, all sample cores are marked to ensure they were imaged and measured in the same manner during pre and post treatment analyses. Additionally, flat surfaces of the cylindrical cores are polished to a 1 μm grit with diamond polishing compound. Before each imaging session, all samples are coated with 15 nm of carbon using a Leica EM ACE600 coating system to prevent surface charging. A JEOL JSM-IT500HR environmental SEM was used for microstructural imaging, and a Thermo Scientific energy-dispersive spectrometer (EDS) was used to collect mineral phase information that complement our XRD analyses. XRD was completed using a Rigaku MiniFlex 600 Benchtop X-ray Diffraction System. Excess granodiorite material left over from coring was powdered and used to represent our SWG sample because it originated from the same block of rock (Table 1). For the basalt and carbonate samples, a clean blade was used to scrape material from the sample surfaces and collect powdered material. Therefore, each sample has it is unique XRD composition (Table 1).
Rock physics measurements include measuring connected ϕ, k, Vp and Vs. Before all geophysical measurements, samples were slowly heated (1°C min−1 increase) to a drying temperature of 100°C and maintained at this temperature until the sample weights stabilized. Using sample markings for orientation, samples were inserted into instruments in the same manner for each measurement.
Connected ϕ is measured with a benchtop helium porosimeter based on Boyle’s Law of Gas expansion, which says that given a constant temperature, the product of a gas’s pressure and its volume will remain constant, meaning that the pressure of the gas will decrease or increase if its volume increases or decreases, respectively. Therefore, by calibrating the system with helium of a known pressure and a known calibration reservoir volume and then releasing that same amount of helium gas into a reservoir with our porous sample, we can calculate the pore volume of the sample into which the helium infiltrated. From there, we compute the ϕ knowing the pore volume and the bulk volume of the sample. While the bulk density (ρb) of samples is computed knowing the samples’ masses and volumes, the crystal densities (ρg) are computed once having the sample ϕ and crystal, or solid, volumes. Uncertainty related to ϕ is within one percent (ϕ unit).
Permeability is measured using the pulse-decay technique (Bourbie and Walls, 1982; Jones, 1997) and the unsteady state decay technique under confining pressure. Through the pulse-decay technique, the cylindrical samples are jacketed such that a small reservoir exists on either end of the sample. At the upstream end, a small pore pressure pulse is applied to the sample using a gas, which is nitrogen in our case. As the gas moves through the sample, the pore pressure at the upstream end decreases, and the pore pressure at the downstream end increases. The rate of the pressure decrease in the upstream reservoir is controlled by the sample’s k—the lower the sample’s k, the slower the pressure decay. Rather than the steady-state pulse decay method, we use the unsteady-state, which offers two advantages when measuring k in tight rocks. First, the steady state method, requires waiting for equilibrium when the pressure gradient is constant and directly proportional to fluid velocity (Rushing and Cox, 2004). However, the unsteady-state method is more efficient, because it does not require waiting for these conditions to be met (Jones, 1997). Additionally, while the steady-state method relies on measuring the fluid flow-rate, the unsteady-state method measures the pressure decay of the fluid, which offers more accurate k values in tight rocks (Jones, 1997).
Samples with k greater than 5 μD were measured using the Coretest Systems, Inc. AP-608 Automated Permeameter, which determines the effective, or liquid k, of samples by measuring the pressure decay rate of nitrogen. The AP-608 has a detection limit of .1 μD. The initial nitrogen pore pressure is set to 1.4 MPa, and k measurements are taken at elevated confining pressures that result in effective pressures (Peff) of 5, 10, 20, 35, and 50 MPa. Samples with k’s less than 5 μD are measured at the same Peff’s using the Coretest Systems, Inc., NDP-605 NanoDarcy Permeameter. The NDP-605 has a detection limit of 10 nD. Through the Klinkenberg Correction (Klinkenberg, 1941), we used gas k’s measured at pore pressures of 1.8, 2.5 and 5 MPa to find the liquid k for Peff’s of 5, 10, 20, 35, and 50 MPa. For this study, the PTB sample was measured with the AP-608, while the SWG and MSA were measured with the NDP-605. Uncertainty related to k measurements is within one percent of the k value.
Vp and Vs are measured using the pulse transmission technique (Birch, 1960) under confining pressure conditions. The confining pressure Vp and Vs measurements are conducted using a house made acoustic pressure vessel (PV; Figure 3) which consists of a core holder, a set of three linear potentiometers, a pulse generator (Avtech AVR-7B-B), a switch (Hewlett Packard 4388A) and a digital oscilloscope (Tektronix TDS 1012B). We apply high-viscosity molasses to the flat ends of the cylindrical samples to ensure coupling between the transducers and the sample surfaces. The dry samples are then jacketed in rubber tubing to protect them from oil and loaded so that each end of the sample is flush with stainless-steel endcaps that house P- (1 MHz) and S- (700 kHz) wave piezoelectric (PZ) crystals. The samples are always loaded in the endcaps in the same orientation during pre and post treatment measurements. Confining pressure is increased using a pneumatic pump that pushes oil into the confining vessel. Samples are drained, meaning pore pressure lines are open and pore pressures are at atmospheric pressure. Upon pressurizing, the sample length and bulk volume change due to microcrack closure and pore collapse (thus decreasing porosity). To account for this length and volume change, three potentiometers are connected to the core holder endcaps. A constant voltage is applied to each potentiometer which changes in proportion to the sample length change with pressurization. This change in voltage is recorded and converted to sample length and volume change as a function of pressure, which allows us to monitor porosity change with pressure, assuming length change is related to pore closure upon pressurization.
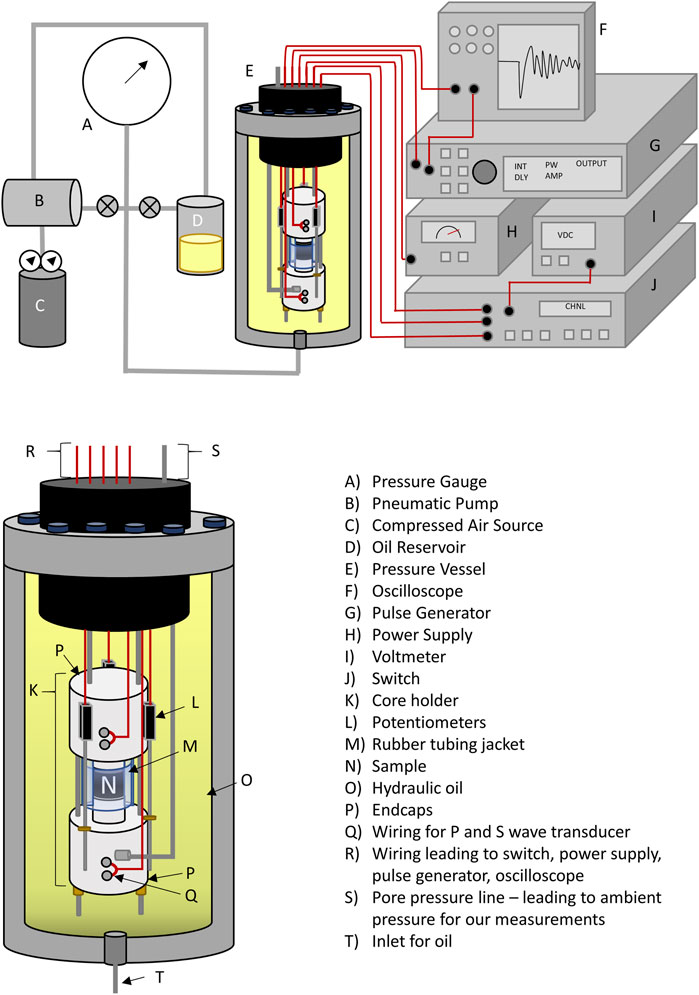
FIGURE 3. Diagram of our in-house made pressure vessel and acoustic system used to monitor Vp and Vs. On the top is a schematic of the entire system including the pressure gauge (A), pneumatic pump (B), compressed air supply (C), oil reservoir (D), pressure vessel (E), oscilloscope (F), pulse generator (G), power supply (H), voltmeter (I), and switch (J). Below this is a closer view of the pressure vessel itself including the core holder (K), the three linear potentiometers (L), the rubber tubing jacket (M), the sample (N), hydraulic oil (O), endcaps (P), wiring for the transducers (Q), wiring which exits the pressure vessel (R), the pore pressure line which exits the pressure vessel (S), and the inlet for hydraulic oil (T). The schematic is not to scale.
In the confining pressure vessel, a pulse of 400 V is sent from a pulse generator to the switch, which sends the pulse to either the P wave PZ crystals or the S wave PZ crystals in the transmitting endcaps. These PZ crystals convert electrical current to mechanical, ultrasonic waves. The waves pass through the sample and upon reaching the P- and S- piezoelectric crystals in the receiving endcap, are turned from mechanical waves back to electrical current. The waveforms are digitally displayed on the oscilloscope, from which we manually select arrival times of the wavefronts and calculate Vp and Vs at each pressure point considering changes in sample length. Time resolution for both the P and S waves is about 100 ns. Velocity error is about 1% and is mainly attributed to error in picking the first arrival. Before the sample measurements, a time calibration is completed by measuring Vp and Vs. with the transmitting and receiving endcaps directly in contact and with their surfaces flush. In doing so, we measure the time needed for P and S waves to pass through only the stainless-steel housing of the PZ crystals. This time delay of ∼11 μs and ∼19 μs for the P- and S-waves is subtracted from the arrival times of the sample for each measurement. Uncertainty in the P- and S-wave measurements is less than ±1% of the wave velocities.
2.3 Control test and thermal shocking
We have two major steps in testing how the three lithologies react upon thermal shocking (Figure 2). In the first step, we conduct a control test where we slowly heat and slowly cool samples. The pre-and post-treatment observations from this test are then compared to pre-and post-treatment observations of the second step, which involves thermal shocking where we slowly heat and quickly cool samples. In doing the control test, we determine whether or not the slow heating we conduct in our thermal shocking procedure imparts thermal cracks, even before we are able to shock our samples. This is critical for us to be able to conclude with confidence that any thermal cracks we observe in the three lithologies after thermal shocking are the result of thermal shocking alone, and not the slow heating.
Before conducting either the control test or thermal shocking, we established a target “reservoir temperature” of 350°C, up to which we would heat our samples before cooling them to 25°C. This hot temperature is representative of various geothermal reservoirs ideal for EGS operations (Schiffman et al., 1984; Rose et al., 2006; Reinsch et al., 2017). More importantly, we see an opportunity to contribute something that to our knowledge is still missing in the body of literature testing this specific thermal change of about 325°C: a systematic dataset of confined pressure Vp and Vs values. Considering current studies in the literature (Supplementary Table S1), to our knowledge, there is only one study (Siratovich et al., 2015) which characterizes permeability under pressure, and no studies characterizing Vp and Vs under pressure before and after thermal shock treatment. Additionally, before the control test, we conducted all rock physics measurements to determine pre-treatment values of Vp, Vs, and k.
Next, we conducted our control test on one sample from each lithology in order to verify whether slow heating (1°C min−1 increase) followed by slow cooling (<2°C min−1 decrease) contributes to cracking. For all three samples, microphotographs were initially taken at different locations throughout the three samples (Figure 4, top row; Figures 3–5, left column). Then, each sample was heated to our target “reservoir temperature” of 350°C and remained at that temperature for an hour to equilibrate. This dwell time—and even lower dwell times (Darot et al., 1992; Darot and Reuschlé, 2000; Kim et al., 2014; Browning et al., 2016; Mordensky et al., 2019), or in some cases no reported dwell times (Vinciguerra et al., 2005)—has been used by others testing the influence of thermal treatment without compromising their findings (Jones et al., 1997; Keshavarz et al., 2010; Heap et al., 2014). After equilibration, we allowed the samples to cool slowly by shutting the oven off, keeping its door closed, and keeping the samples in the oven. After several hours, the samples were finally ambient temperature (∼25°C) and were removed from the oven. Each location on the samples was reimaged, for a second time, after conducting the control test (Figure 4, bottom row) to determine whether or not the slow heating introduces cracks. Through our microimaging, no additional cracks were observed, and no cracks which were initially present appeared to have extended or widened with thermal treatment. Our control test verified that any thermal cracks we would observe after thermal shocking are the result of thermal shocking alone and are not imparted during slow heating to the reservoir temperature.
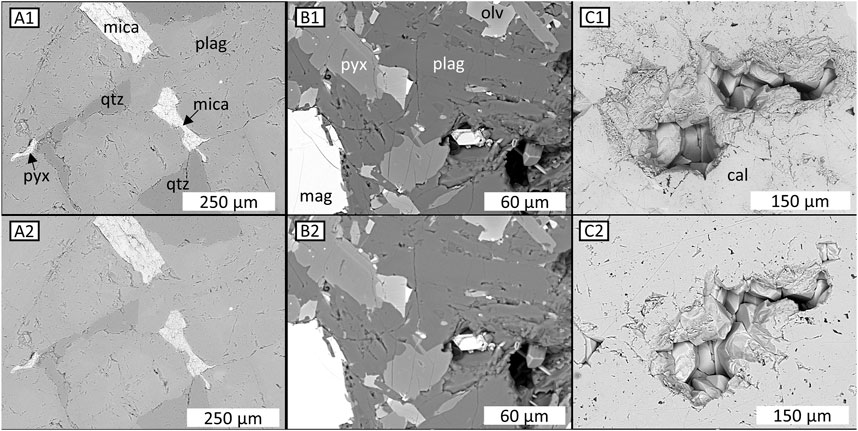
FIGURE 4. Time-lapse images of the granodiorite (A1,A2), basalt (B1,B2), and carbonate (C1,C2) samples before and after slow heating (1°C min−1 increase) and then slow cooling (<2°C min−1 decrease). Before images are in the top row while after images are in the bottom row. Notice minimal to no cracking after the control protocol. Minerals are labeled accordingly and were identified using EDS: mica (mica), quartz (qtz), plagioclase (plag), pyroxene (pyx), olivine (olv), magnetite (mag) and calcite (cal).
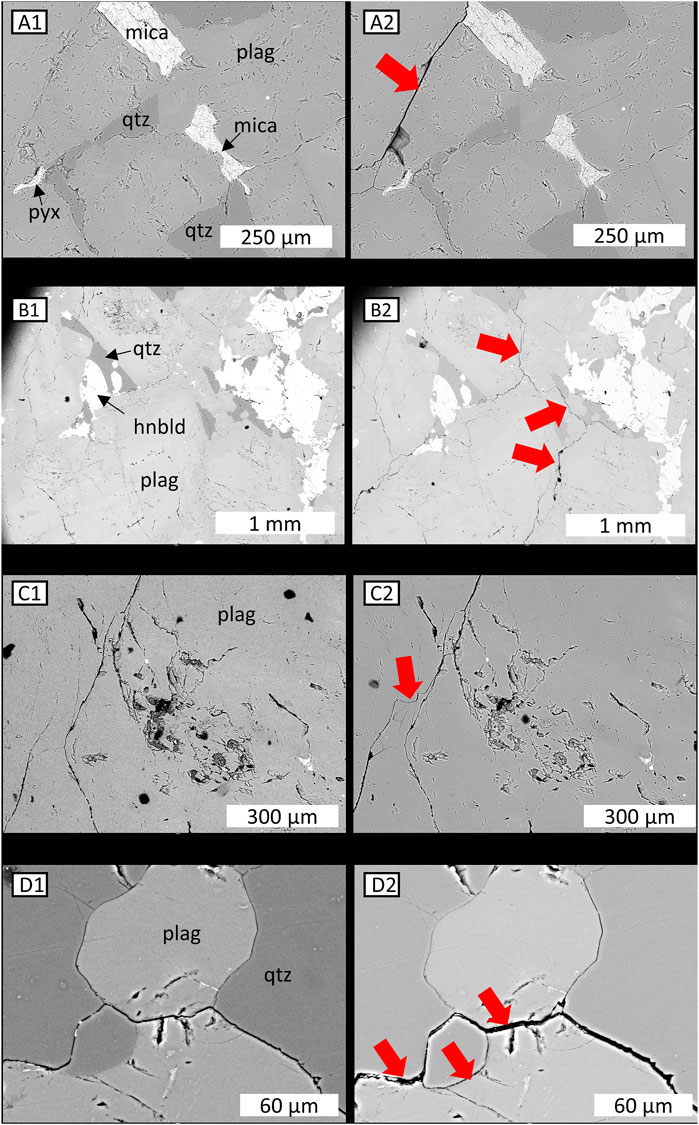
FIGURE 5. SEM images of the SWG lithology before and after thermal shocking. The first column (A1,B1,C1,D1) includes examples of pre-shocking images. The second column includes examples of post thermal shocking images (A2,B2,C2,D2). Any newly observed cracks created during thermal treatment are indicated with red arrows. Minerals are labeled accordingly and were identified using EDS: mica (mica), quartz (qtz), plagioclase (plag), and hornblende (hnbld).
Because our control test verified that slow heating would not impart significant cracking in our samples, we continued on to step two of our experiment: performing thermal shocking on the same samples. Crack networks were intentionally induced in the three samples by slowly heating the samples to 350°C, allowing them to equilibrate for an hour, and then immersing them in a room temperature (∼25°C) water bath. This “bucket quenching” procedure has been used by others to simulate thermal shock cooling in geothermal reservoirs (Kim et al., 2014; Zhu et al., 2019; Eggertsson et al., 2020). Finally, each location on the samples was again reimaged, for a third time, after thermal shocking (Figures 5–7, right hand column) in order to verify whether thermal cracks were imparted with shocking. After micro-imaging, we took post-treatment rock physics measurements of Vp, Vs, and k.
3 Results
3.1 Initial sample microstructures
The lefthand columns of Figures 5–7, include images of the three lithology microstructures before thermal shocking. Specifically, the left column of Figure 5 presents features of the SWG microstructure, which contains tightly bound plagioclase crystals. Among the plagioclase are smaller mica, quartz, and hornblende crystals (A1, B1, D1). Additionally, there are no macroporous vugs in the SWG samples (A1-D1), and the only porosity is in the form of pre-existing microcracks (C1, D1) and faint depressions within and along mineral crystals (A1, D1).
Different microstructures of the PTB lithology before thermal shocking are shown in the lefthand column of Figure 6. PTB contains a groundmass of tightly mated plagioclase, pyroxene, magnetite, and olivine crystals (A1). Within the groundmass are small, pre-existing cracks, larger pores that contain a few well-defined crystals (A1), and plagioclase phenocrysts (B1-D1). In some cases, there are long (more than 100 mm) cracks within the groundmass and phenocrysts (B1-D1). The PTB lithology has irregular, oblate, vuggy pore spaces (A1-D1). In some cases, pre-existing cracks travel through these vugs from one side to another (B1-D1).
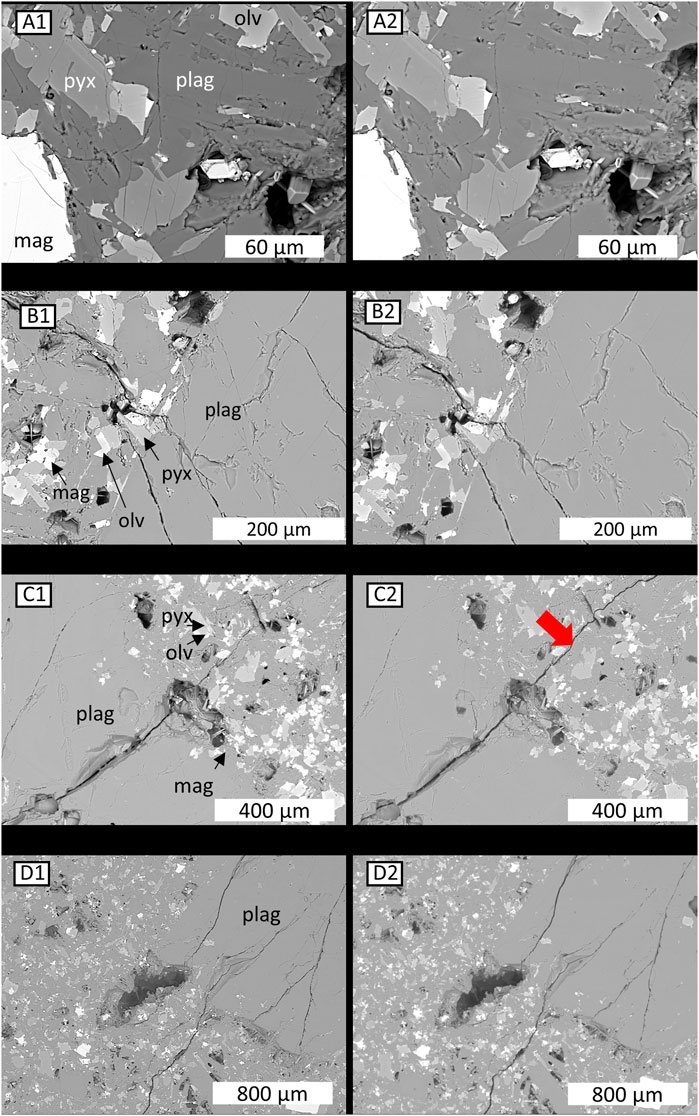
FIGURE 6. SEM images of the PTB lithology before and after thermal shocking. The first column (A1,B1,C1,D1) includes examples of pre-shocking images. The second column includes examples of post thermal shocking images (A2,B2,C2,D2). Any newly observed cracks created or cracks which were widened during thermal treatment are indicated with red arrows. Minerals are labeled accordingly and were identified using EDS: plagioclase (plag), pyroxene (pyx), olivine (olv), and magnetite (mag).
The lefthand column of Figure 7 includes MSA microstructures before thermal shocking. The most distinct structures of MSA are vuggy, irregularly shaped, oblate pores (A1-C1) that tend to pinch out at two ends (A1, B1). In some cases, these vugs are lined with rhombohedric calcite crystals (A1, B1). Although not detected with XRD, MSA also contains some quartz which fills vugs (C1). The quartz itself has disjointed pieces. Additionally, patches of quartz are interspersed within calcite (D1), and these patchy quartz-calcite areas span multiple mm’s in length. The dashed red line in C1 highlights several boundaries between the quartz-rich area and the calcite matrix.
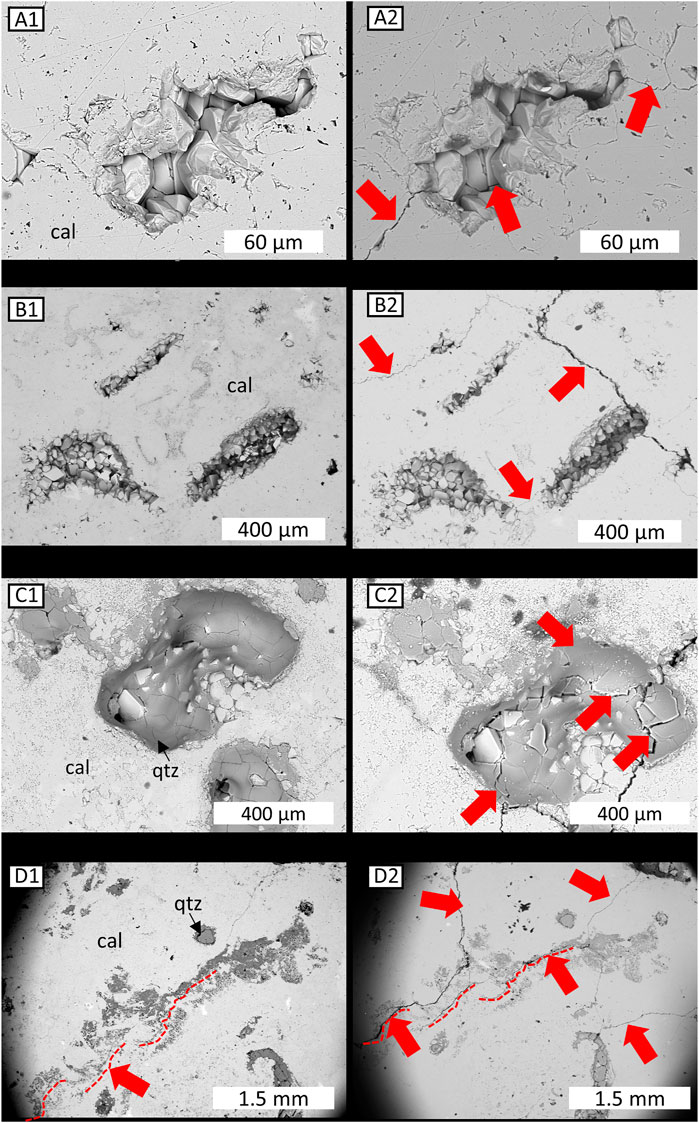
FIGURE 7. SEM images of the MSA lithology before and after thermal shocking. The first column (A1,B1,C1,D1) includes examples of pre-shocking images. The second column includes examples of post thermal shocking images (A2,B2,C2,D2). Any newly observed cracks created during thermal treatment are indicated with red arrows. Minerals are labeled accordingly and were identified using EDS: quartz (qtz) and calcite (cal).
3.2 Time-lapse microimaging of thermally shocked lithologies
The right columns of Figures 5–7 present the post-thermal shocking microstructures of SWG, PTB, and MSA, respectively. Often, thermal cracks in the SWG begin at boundaries between plagioclase crystals and crystals of mica, quartz, or hornblende (Figures 5A2, B2, D2). These cracks then branch away, travel through large areas of plagioclase, and travel towards new crystals of mica, quartz, and hornblende. Finally, the cracks travel further along boundaries between plagioclase crystals and crystals of mica, quartz, or hornblende (A2, B2, D2). This pattern of cracking is so prevalent, that an additional example is provided (Supplementary Figures SA1, SA2). Thermal cracking along boundaries between crystals of different minerals is common in SWG. In fact, one quartz crystal has loosened from its originally tightly bound, well mated, arrangement (Figure 5D2; middle arrow). Additionally, thermal shocking extended (C2) and widened (D2) pre-existing cracks.
Changes, or lack thereof, in the PTB microstructure upon thermal shocking are shown in the right column of Figure 6. Most pre-existing cracks in the plagioclase-dominated groundmass (A2) or plagioclase phenocrysts (B2-D2) do not appear elongated or widened with thermal shocking. Even upon close inspection of a region around one vug, we found no newly formed thermal cracks (Supplementary Figures SB1, SB2). We observed one instance of crack widening, which occurred along a pre-existing crack passing first through a plagioclase phenocryst, then through a vug, and finally through the groundmass (Figure 6C2). Overall, however, there was little to no difference in the PTB microstructure after thermal shocking.
The righthand column of Figure 7 shows thermal cracking in the MSA lithology. Thermal cracks propagated from where the vugs pinch out in the MSA sample (A2, B2). Looking closely within the vug shown in A2, we see a new, thermally induced crack passes through rhombohedral calcite crystals lining the vug (middle arrow). This thermal crack likely passes from one edge of the vug which pinches out, through the crystals lining the vug, towards the other edge of the vug that pinches out, and finally exits the vug completely. Additionally, B2 shows thermal cracks extending from one vug, passing through micrite rich areas of MSA, and traveling until reaching other vugs. In fact, multiple cracks from the same vug extend through the micrite and then enter other vugs. Importantly, these thermal cracks serve as channels between vuggy pores, connecting their porosity. Thermal cracks also extend from and propagate through areas of quartz (C2) and loosen once interlocked quartz pieces. As D2 zooms out to entire regions of patchy quartz and calcite, we see thermal cracks traveling along boundaries between quartz patches and calcite dominated areas. Dashed red lines in D1 and D2 outline these boundaries, and the same dashed red lines in D2 outline the path of cracks along these boundaries.
3.3 Time-lapse rock physics measurements of thermally shocked lithologies
Upon thermal shocking, benchtop connected ϕ for all lithologies only slightly increased (Table 2), and the ρbulk and ρgrain for all samples remained the same. Figure 8 shows Vp and Vs with effective pressure for all three samples before (smaller, open symbols) and after (larger, closed symbols) thermal shocking. Figure 9 shows permeability with effective pressure for all three samples before (smaller, open symbols) and after (larger, closed symbols) thermal shocking. Data related to finding conducting Klinkenberg correct permeabilities can be found in the Supplementary Table S2; Supplementary Figure S2. For Figures 8, 9, SWG data is presented in panel A, PTB data is presented in panel B, and MSA data is presented in panel C. In Figure 9A, the pre-thermal shocking SWG permeability is not presented because it was below the detection limit of our NDP .01 μD. We see that Vp and Vs were impacted by thermal shocking for all three lithologies, however, the influence on permeability on all three lithologies is not as straight forward.
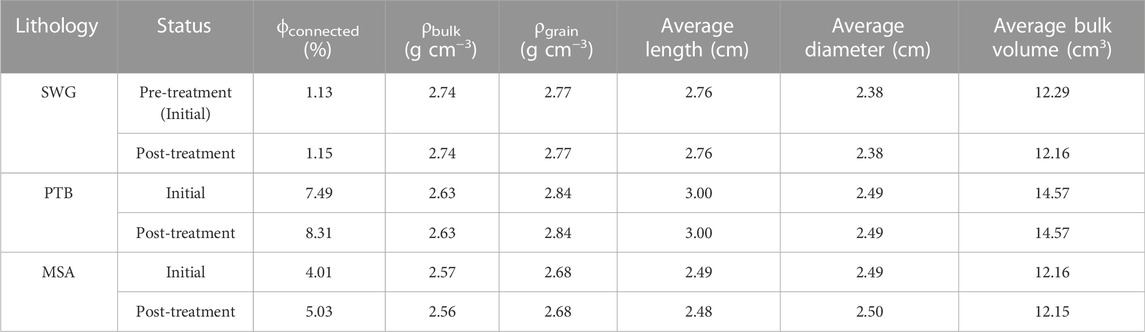
TABLE 2. Benchtop ϕconnected, ρbulk and ρgrain measurements of samples before and after thermal shocking. Eight measurements of length and diameter were taken for each sample, and the average of these are included here. The bulk volumes are calculated from these averages.
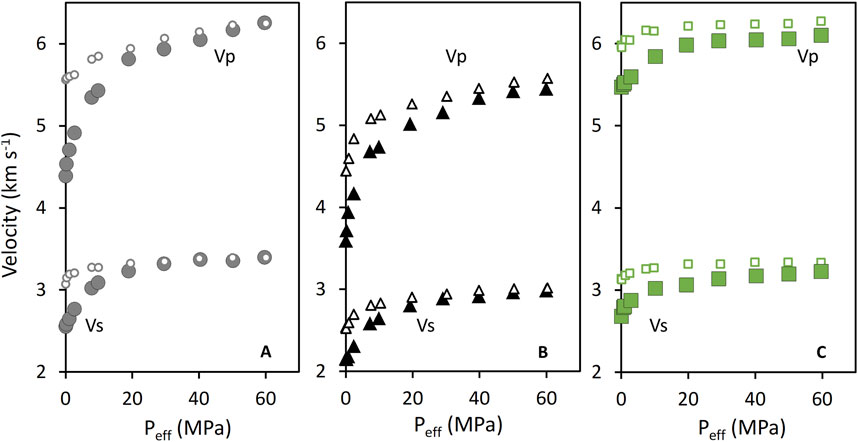
FIGURE 8. Vp and Vs. measurements with Peff’s for the SWG (A), PTB (B), MSA (C) lithologies. Measurements taken before thermal shocking are shown as smaller, open symbols, while measurements taken after thermal shocking are indicated with larger and filled symbols. All data presented was measured during the “pressure up” ramp, as Peff was increased from 0 to 60 MPa. Pore pressure remained 0 MPa. Error bars are less than 1% of measured values.
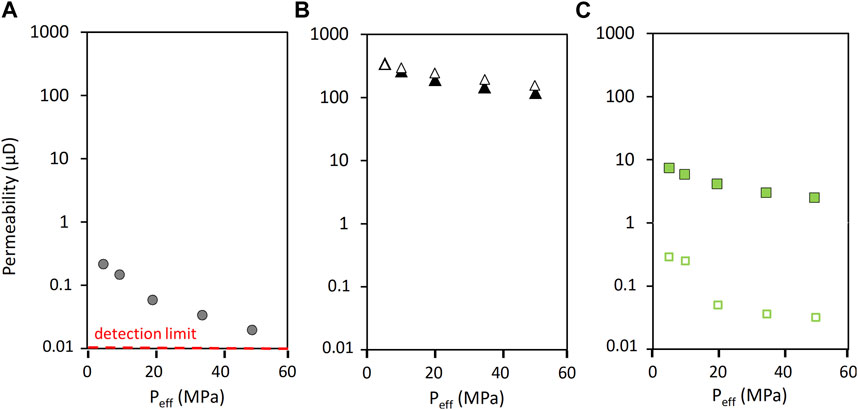
FIGURE 9. Permeability versus Peff for the SWG (A), PTB (B), and MSA (C) lithologies before and after thermal shocking. Smaller, empty symbols represent k data associated with pre-thermal shocking and larger, filled symbols represent k data associated with post-thermal shocking. Permeability for the SWG sample before thermal shocking was below the detection limit of the permeameter (0.01 μD), and therefore is not plotted. Error bars are less than 1% of measured values.
Of the three lithologies, SWG ϕ increased the least (by only .2%; Table 2). Figure 8A shows that both Vp and Vs of SWG decreased from the original magnitudes upon thermal shocking, at least at lower effective pressures. However, when effective pressure reaches 60 MPa and 30 MPa, Vp and Vs recover to their pre-shocking magnitudes, respectively. At low confining pressures, Vp and Vs are more sensitive to pressure after thermal shocking, compared to before thermal shocking. In Figure 9A, the pre-thermal shocking SWG permeability is not presented because it was below the detection limit of our NDP .01 μD. The post-thermal shocking SWG k is presented however, and we see that k increased by at least an order of magnitude. Permeability for SWG decreases slightly with Peff, indicating pressure sensitivity of permeability after thermal shocking.
Connected porosity for the PTB lithology increased slightly by less than 1% (Table 2). Figure 8B shows that both Vp and Vs for PTB decreased from their initial values upon thermal shocking for all effective pressures. Particularly at lower MPa, pressure sensitivity for both Vp and Vs increased with thermal shocking. Unlike the SWG lithology, neither Vp nor Vs values for PTB ever fully recover to their original magnitudes despite increasing effective pressure. In Figure 9B, the magnitude of permeability of PTB shows little to no change after thermal shocking at lower Peff, and slight decreases at higher Peff. The spread in k increased from about 150 μD to 230 μD, meaning that k became more pressure sensitive after thermal shocking.
Connected porosity for the MSA lithology increased slightly by 1% (Table 2). Figure 8C, shows that even before thermal shocking, MSA Vp and Vs values are less pressure sensitive compared to the pre-thermal shocking values of the SWG or PTB lithologies (Figures 8A, B, respectively). However, similar to SWG and PTB, the magnitude of MSA Vp and Vs decreased after thermal shocking. Like PTB, neither MSA Vp nor Vs recovered to the original magnitudes, regardless of increasing effective pressure. Pressure sensitivity for MSA Vp and Vs increased after thermal shocking, however, the pressure sensitivity did not increase as much for the SWG or PTB lithologies with thermal shocking. Figure 9C shows that MSA permeability increased upon thermal shocking, regardless of effective pressure. Additionally, the spread in k increased from less than 1 μD to almost 9 μD with thermal shocking, meaning that similar to PTB, the pressure sensitivity of k increased with thermal shocking.
4 Discussion
We explored how three tight lithologies with distinct mineralogies and microstructures are impacted by thermal shocking and how microstructural changes influence bulk rock properties like seismic wave velocity and permeability. We paired time-lapse imaging with time-lapse rock physics measurements to determine how the impacts of thermal shocking can be detected with Vp and Vs used for remote monitoring in the field. We found that with thermal shocking, connected porosity—which is often considered the first order control on Vp and Vs—undergoes little to no change for any of the three lithologies. This may be explained by the fact that with thermal shocking induces cracks, which contributes minimal porosity to the overall connected porosity. We observe changes in Vp and Vs, as well as permeability with pressure despite the minimal connected porosity change, which is consistent with the literature (Yavuz et al., 2010; Siratovich et al., 2015; Mordensky et al., 2019; Shang et al., 2019). Because connected porosity does not appear to be a primary control on either Vp, Vs or permeability, we explore whether and how other features of the microstructure and mineralogy could control these three rock physics properties.
Of the three lithologies, SWG’s Vp and Vs were most affected by thermal shocking (Figure 8). At lower effective pressures, both Vp and Vs decrease significantly, and did not recover to pre-thermal shocking values until Peff was 60 MPa and 30 MPa, respectively. Compared to Vs, Vp decreases more at lower Peff and Vp needs a greater Peff in order to recover to pre-treatment values. Therefore, Vp is more affected by thermal shocking than Vs in SWG. Acoustic wave velocities decreased while connected porosity remained constant, and Vp became more sensitive to thermal shocking than Vs, which led us to consider whether ρbulk and elastic moduli were impacted by thermal shocking. Specifically, the magnitude of Vp and Vs rely upon a rock’s bulk moduli (K), shear moduli (μ), and bulk density (ρbulk) as shown in Eqs 1, 2.
We found that SWG ρbulk remains constant with thermal shocking (Table 2), so likely is not a contributing factor to the changes in Vp and Vs Figure 10 shows elastic moduli with effective pressure for the SWG (A), PTB (B), and MSA (C) lithologies before and after thermal shocking. Figure 10A shows that SWG’s K and μ decreased after thermal shocking, resulting in the decreases of Vp and Vs (Figure 8A). We also see that K decreased more after thermal shocking than μ, meaning that the lithology’s ability to resist compressional forces has been more compromised than its ability to resist shear forces. This would result in a greater sensitivity of Vp to thermal shocking compared to Vs The compressibility of SWG is also reflected in the pressure sensitivity of permeability measured after thermal shocking. Clearly SWG became less stiff with thermal shocking, which calls for exploring what underlying mechanisms are responsible for the decrease in stiffness.
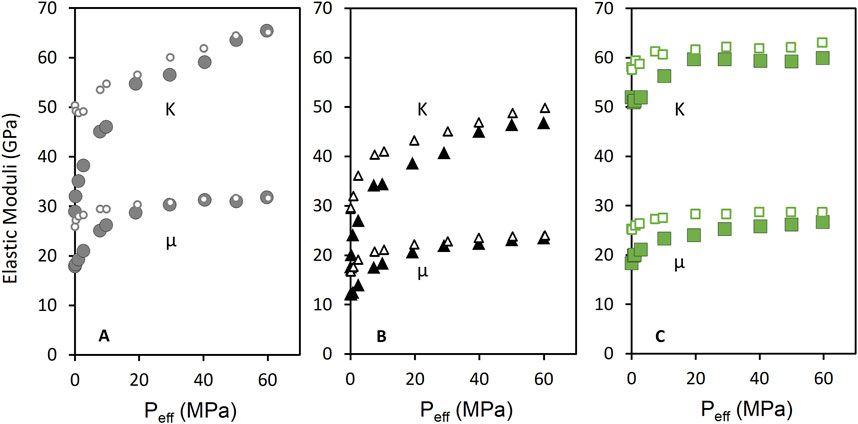
FIGURE 10. Elastic moduli versus Peff for the SWG (A), PTB (B), and MSA (C) lithologies before and after thermal shocking. Smaller, empty symbols represent data associated with pre-thermal shocking and larger, filled symbols represent data associated with post-thermal shocking. Each plot includes bulk moduli (K) values with Peff and shear moduli (μ) with Peff.
The decreased stiffness of SWG likely results from newly propagated thermal cracks (Figure 5A2, B2, C2, D2), and a decreased stiffness at the contacts between mineral crystals. In fact, we interpret the cracks traveling “through” large areas of plagioclase in Figure 5A2, B2 to actually follow boundaries between separate plagioclase crystals. For example, Figure 11 shows two examples of microimaging plagioclase crystals which are tightly mated together. With optical microscopy (A), the boundaries between these crystals may be more easily distinguished than with electron microscopy (B). Many of the thermal cracks in Figure 5A2, B2 are occurring along boundaries between what were tightly mated plagioclase crystals before thermal shocking (A1, B1). As minerals cool quickly, they often contract, which is a form of tensile straining of the mineral crystal. This strain is released by tensile cracking along planes of weakness (Kranz, 1983), which in our case, are boundaries between separate mineral crystals. Additionally, crack lengthening (C2) and widening (D2) of pre-existing cracks reduces rock stiffness. Although the widening and lengthening of cracks contribute to a negligible increase in pore volume and hence no new connected porosity to the overall sample, cracks create more room for mineral crystals to compress towards one another and to shear past one another as confining pressure is applied. This translates into an increased Vp and Vs to pressure, despite the negligible changes in connected porosity. In fact, a portion of quartz mineral crystal appears slightly dislodged with thermal shocking (D2). Such loosened mineral crystals increase the rock’s pressure sensitivity, as reflected in Vp and Vs measurements (Figure 8A). Overall, thermal cracking along crystal boundaries in SWG is detectable using both Vp and Vs measured with effective pressure. Additionally, SWG’s thermal cracks became so well connected, that they contributed to enhance flow through the sample (Figure 9A).
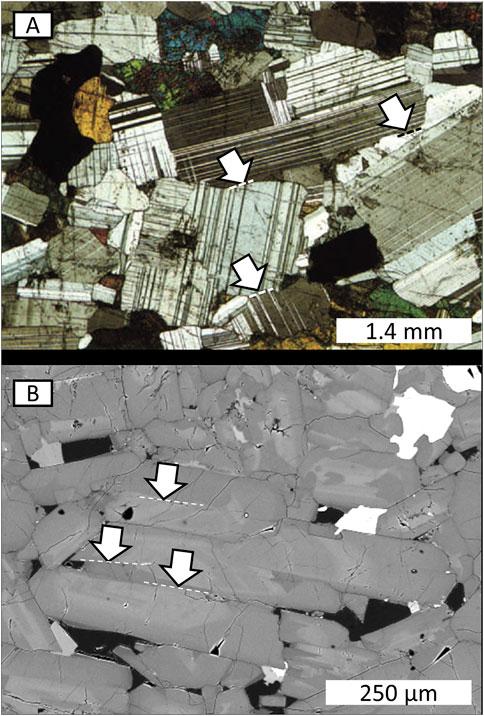
FIGURE 11. Example of plagioclase mineral crystals and crystal boundaries observed with optical microscopy ((A), Deer et al., 2013) and SEM imaging ((B), Srogi et al., 2020). Examples of crystal boundaries are identified with white arrows in both images. Dashed white and black lines are also meant to highlight the boundary features. Plagioclase crystals exist between the boundaries.
Figure 8B and Figure 9B show that neither Vp, Vs, nor k in PTB were as influenced by thermal shocking compared to SWG. The decreased Vp and Vs values reflect crack widening upon thermal shocking of PTB, which we observed with the microimaging (Figure 6C2). Figure 10B shows that any new thermal cracks reduced K and μ of the PTB sample, making it slightly less stiff than it originally was. Like SWG, K in PTB has decreased more with thermal shocking compared to μ. Additionally, although the slight changes in Vp and Vs measurements indicate some thermal cracking, these pre-existing cracks are simply wider but not pervasive enough to coalesce and substantially increase permeability, as shown in Figure 9B. In fact, as Peff increases, permeability after treatment is slightly lower than permeability values before treatment. This implies that thermal shocking made PTB pore space more compliant, so much so that it closes as Peff’s increases obstructing once permeable pathways. This increase in compliance is reflected in the reduction in K and μ (Figure10B). Changes in pore space during pressurization can be found in Supplementary Table S3 and seen in Supplementary Figure S3. Therefore, at lower effective pressures, which in the field translates to higher pore pressures, Vp and Vs may not be ideal indicators for change in permeability upon thermal shocking of PTB. Our permeability observations are similar to those of Siratovich et al. (2015) who heated a basalt sample to 325°C and then quenched it with room temperature water. Both our basalt and the one in Siratovich et al. (2015) showed a very slight increase in k of 35 μD at low Peff after a single thermal shocking. We consider that additional thermal shock stimulations may be needed to increase k in the PTB, but this is outside of the scope of our current study. In fact, Eggertsson et al. (2020) found that multiple thermal shock stimulations were effective in increasing k in a basalt sample. Additionally, Eggertsson et al. (2020) used a thermal gradient larger than ours (425°C) to quench their basalt, leading us to consider that thermal gradients larger than 325°C may be necessary to increase permeability in PTB. While testing multiple thermal gradients would be useful to better understand sensitivity of PTB to thermal stimulation, this current work remains focused on the role of lithology when rocks are exposed to the same thermal gradient.
The lower degree of thermal cracking in PTB compared to SWG is related to differences in mineralogy of the two lithologies and thermal properties inherent to their minerals. We consider two thermal properties in our discussion on the PTB and SWG lithologies: thermal conductivity and volumetric thermal expansion coefficient. Thermal conductivity (kT; units of W m−1 K−1) describes how easily heat moves through a mineral crystal for a given temperature and can be found through Eq. 3 (Robertson, 1988; Tritt, 2004; Gautam et al., 2018).
Here, Q is the quantity of heat (W) transmitted through a unit thickness, L (m), in a direction normal to a surface of unit area, A (m2), given a temperature gradient, ΔT (Kelvin or degrees Celsius). The greater the thermal conductivity of a mineral is, the easier it is for the mineral crystal to heat up or cool down. The volumetric thermal expansion coefficient (αv; units of K−1) describes how much a mineral expands or contracts, given a certain heat input or heat withdraw and can be found through Eq. 4 (Cooper and Simmons, 1977; Robertson, 1988; Clauser, 2006).
Here, ΔV is the change in mineral crystal volume (m3) for a given ΔT, and V0 is the initial mineral volume (m3) prior to the temperature fluctuation. The volumetric thermal expansion coefficient describes volumetric changes that involve length changes along all of a mineral’s crystallographic axes. The greater αv is, the more a mineral will expand upon heating and contract upon cooling. Table 3 shows the thermal conductivities of each mineral in SWG and PTB as well as the volumetric thermal expansion coefficients. The SWG lithology includes more than 20% quartz, which has a high thermal conductivity of 7.69 W m−1 K−1 and a high volumetric thermal expansion coefficient of 4.96 K−1. This means that more than 20% of SWG conducts heat more easily and contracts more with thermal shocking compared to many minerals in PTB.
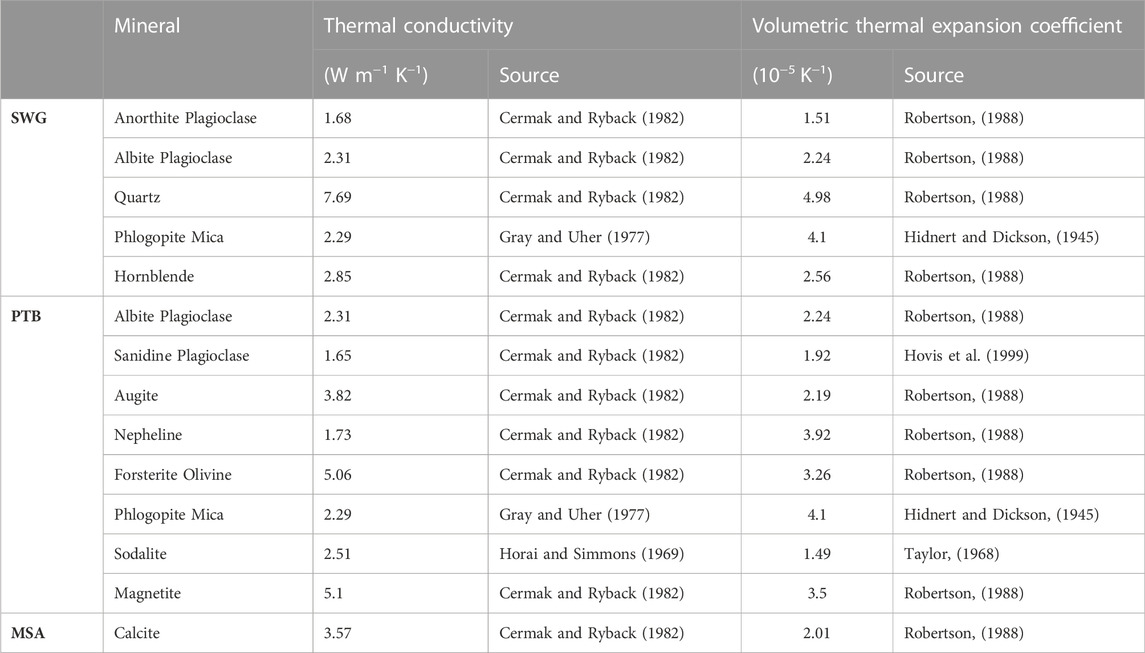
TABLE 3. Thermal conductivity and volumetric thermal expansion coefficients of minerals that compose the SWG, PTB, and MSA lithologies.
Focusing on SWG, we see that the minerals with the greatest thermal conductivity and expansion coefficients are quartz, then phlogopite mica, and then hornblende (Table 3). The thermal properties of these minerals are inconsistent with the lower thermal properties of plagioclase. This may explain why thermal cracks in SWG appear to travel between mineral crystals of plagioclase and crystals of these three specific minerals. Quartz, mica, and hornblende may be contracting during the thermal shock, pulling away from the surrounding plagioclase, which is contracting, but to a lesser extent. The thermal cracks generated here, may continue to travel between plagioclase crystals along planes of weakness. Alternatively, more than 90% of the PTB lithology is dominated by albite and sanidine, which do not have high thermal conductivities or volumetric thermal expansion coefficients. Compared to the quartz, phlogopite mica and hornblende in SWG, the albite and sanidine in PTB will be less likely to shrink with thermal shocking and generate thermal cracks. Therefore, the difference in mineralogy between the SWG and PTB lithologies, and the differences in their minerals’ ability to conduct heat and contract with cooling are likely major reasons we observe more thermal cracking in SWG than in PTB.
MSA was impacted less than SWG, but more than PTB by the thermal shocking. For example, Figure 8 shows that Vp and Vs for MSA decreased after thermal shocking, similar to SWG and PTB. Figure 10C shows that both K and μ were influenced by thermal shocking, indicating new thermal cracks also compromised the stiffness of MSA and reduced Vp and Vs. Thermal shocking was so effective in MSA, that the permeability of the MSA sample increased (Figure 9). Not only did thermal cracks propagate throughout the MSA sample, but they connected to one another allowing for permeability to increase by almost 10 μD.
Two more thermal properties we must now consider are the linear expansion coefficients (αL) of minerals and their thermal anisotropy. While αv describes how an entire, 3D mineral crystal expands or contracts with a thermal gradient, αL describes the two-dimensional expansion along one mineral crystal axis and can be calculated by Eq. 5 where ΔV from Eq. 4 was replaced with ΔL (m), the change in length of the mineral along the crystallographic axis, and V0 was replaced with L0 (m), the initial mineral length along the axis.
It is important to note that the αL along a single crystallographic axis of a mineral crystal can differ in value from αL of other axes of the mineral (Robertson, 1988). Because non-cubic minerals have distinct crystal axes with properties different from one another, the crystallographic axis parallel to a given direction may expand or contract more than an axis perpendicular to that direction. This results in more expansion or contraction in one direction compared to the other. To quantify this difference between thermal properties, we use an “anisotropic ratio”, which is the ratio of αL parallel to a crystallographic axis compared to αL perpendicular that same axis (Eq. 6; Cooper and Simmons, 1977).
A negative value of this ratio indicates one crystallographic axis expands with heating and contracts with cooling, while the other axis contracts with heating and expands with cooling. The further the ratio is from zero (either in the negative or positive direction), the more anisotropic its expansion or contraction with a thermal gradient is. Table 4 includes the thermal expansion along two separate crystallographic axes and the anisotropic ratio, as calculated with Eq. 6, for each mineral in the SWG, PTB, and MSA lithologies detected with XRD.
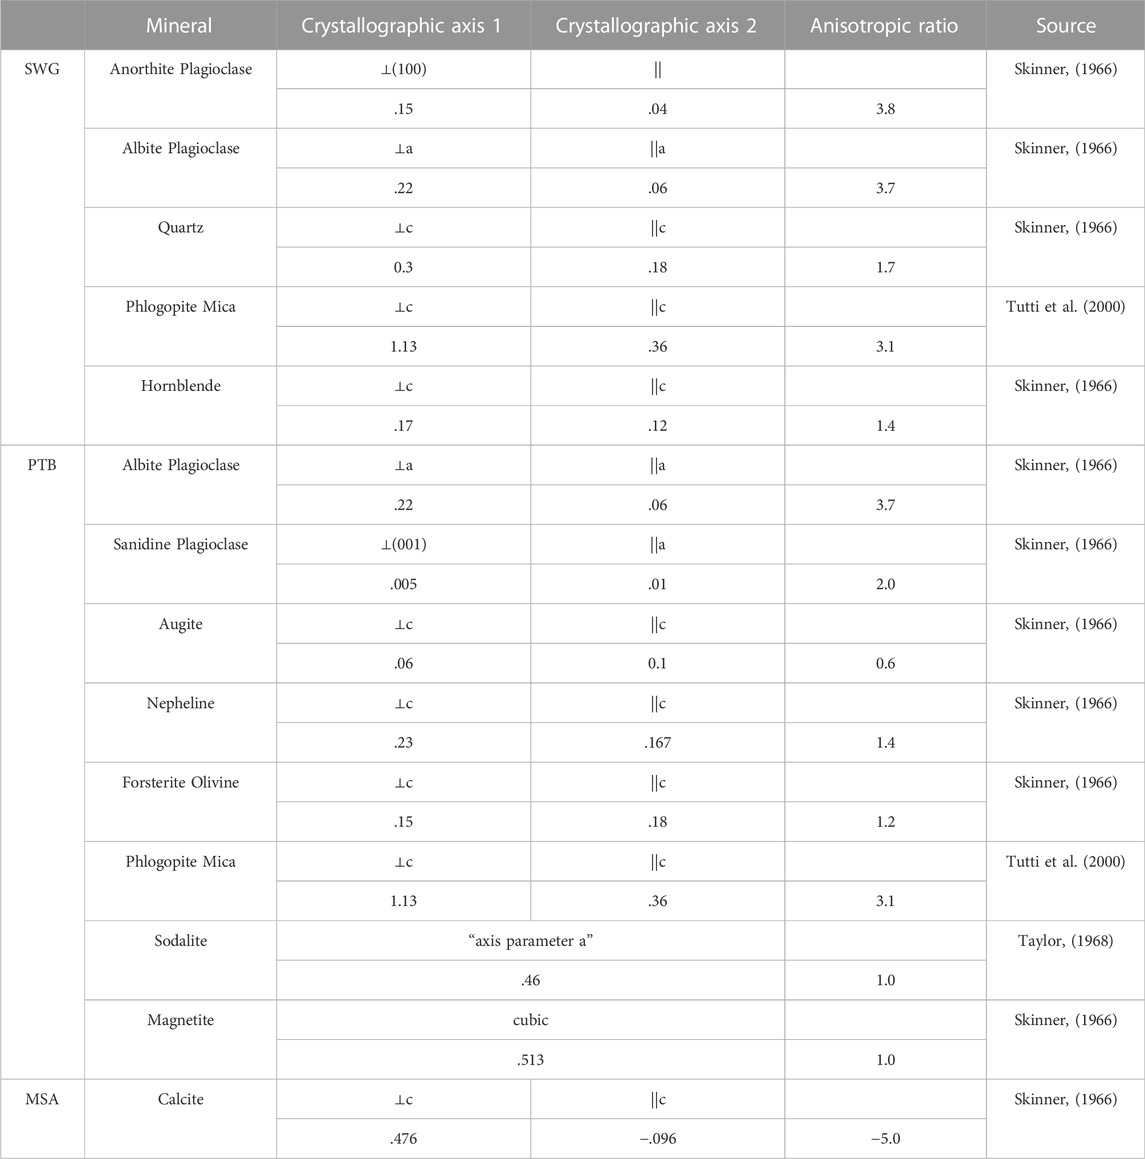
TABLE 4. Linear thermal expansion coefficient of axes in minerals composing the SWG, PTB, and MSA lithologies. The specified crystallographic axes vary from mineral to mineral and are included under “crystallographic axis 1” and “crystallographic axis 2”. The anisotropic ratio is calculated by dividing the greater linear expansion coefficient of the two axes by the lesser coefficient of the two axes.
We believe that the thermal anisotropy of calcite is among the reasons we see thermal cracking in MSA. MSA is almost entirely composed of calcite, which has an anisotropic ratio of -5. This makes MSA the only lithology with a negative anisotropic ratio, and the magnitude of its ratio is greater than any mineral present in the other lithologies. MSA is comprised almost entirely of tightly mated, randomly oriented, calcite crystals. These calcite crystals are expanding in one direction and contracting in another direction during thermal shocking. The high degree of anisotropic expansion and contraction likely adds mechanical stresses in the MSA lithology and contributes to thermal cracking.
Secondly, similar to the SWG sample, MSA contains trace amounts of quartz that was observed in the SEM, but not detected with XRD. These quartz crystals have a relatively high kT and αv making them sensitive to thermal gradients. These crystals contract with thermal shocking, pulling away from neighbouring calcite crystals to create thermal cracks (Figure 7D2). Even within pockets of quartz itself, thermal cracks appear to proliferate along what were disjointed planes prior to shocking (C1).
Finally, MSA’s macroporous vugs clearly facilitated thermal cracking in the MSA sample (Figure 7A2, B2, C2, D2). Thermal cracks extend from edges of these vugs, travel from one vug to new vugs, and upon reaching new vugs, the cracks travel along the vug, cutting through to the other side (A2). Radial cracking which extends from pore spaces due a thermal gradient alone (no additional pressure imposed) has been observed in composite materials (Goltermann, 1995; Zhou et al., 2001; Fu et al., 2004). Cracking results from mechanical stress building up around inclusions due to mismatching of thermal properties between the matrix and inclusion (Fu et al., 2004). In our case, there is a mismatch between thermal properties of the calcite matrix and the air-filled inclusion. We also see that cracking at the edges of vugs sometimes occurs where the vugs are thinnest or pinch out (A2, B2). Not only do mechanical stresses build up around the inclusion, but the stress build up is uneven, and concentrates where inclusions are the thinnest, resulting in cracking (Rao et al., 1971; Shiah, 2016). This means that in areas where vugs in MSA pinch out, there are regions of relatively high stress, which may explain why we observe cracking propagating primarily from where these vugs thin out.
Our results have several implications for the EGS development. First, we can infer that reservoirs rich with minerals like quartz, which have high thermal conductivities and expansion coefficients, will be more sensitive to thermal stimulation compared to reservoirs rich with minerals like sanidine plagioclase, which have lower thermal properties. Therefore, the permeability in reservoirs dominated by lithologies such as granodiorite will increase more than reservoirs dominated with lithologies like basalt when exposed to the same thermal stimulation. Second, the influence of thermal stimulation on reservoir rocks in these thermally sensitive reservoirs should be detectable with remote monitoring using Vp and Vs. For EGS operations in reservoirs with less thermally sensitive lithologies, such as PTB, Vp and Vs should still be able to detect changes in tight, thermally cracked rocks when Peff’s are low. Third, EGS operators should consider low porosity carbonate reservoirs composed of calcite, which is sensitive to thermal shocking due to its thermal anisotropy. EGS reservoirs with connected vugs interspersed throughout the low porosity carbonate will likely contribute to enhanced thermal cracking and increased flow through the reservoir.
This study tested the effects of a single cycle of thermal stimulation per lithology. If EGS operators conduct multiple thermal stimulations, the influence of their subsequent stimulations on permeability, Vp and Vs remain to be systematically addressed. The influence of multiple thermal stimulations should be considered for future studies.
5 Conclusion
A lithology’s underpinning mineralogy and microstructure control it is response to natural and engineered processes, and to what degree we can remotely monitor the response using seismic wave velocities. We tested this idea by thermally shocking three tight lithologies relevant to enhanced geothermal systems, and monitoring changes in each lithology with time-lapse microimaging and rock physics measurements. Our imaging observations and comprehensive dataset of pre and post thermal shocking ϕ, Vp, Vs, and k measurements lead us to the following conclusions:
1) SWG was the lithology most impacted by thermal shocking, followed by MSA, and finally, PTB. For all lithologies, Vp and Vs decreased because thermal cracks reduce the stiffness between mineral crystal boundaries. Thermal cracks are effective enough to connect pre-existing pore spaces and increase permeability in SWG and MSA, but not PTB.
2) For SWG, the presence of minerals with high thermal conductivity and volumetric thermal expansion coefficients contributed greatly to thermal cracking. Thermal cracks preferentially navigated along mineral crystal boundaries which serve as planes of weakness as minerals expand and contract with temperature changes.
3) For PTB, the majority of the rock is composed of minerals with relatively low thermal conductivity and low volumetric thermal expansion coefficients. Because Vp and Vs did decrease for this lithology while k was unaffected at low Peff, Vp and Vs may not be useful indicators of k upon thermal shocking at high pore pressures. Additional thermal shock stimulations or a greater thermal gradient may be necessary to increase k in PTB.
4) For MSA, the presence of minerals with high thermal anisotropy contributes to thermal cracking, reduction in Vp and Vs, and increased k. Secondly, the mismatch in thermal properties of calcite and trace amounts of quartz leads to thermal cracking. Finally, macroporous vugs concentrate stress imparted during thermal shocking, which leads to thermal cracking.
In conclusion, large changes in Vp, Vs, and k can be expected in tight lithologies, despite little to no change in ϕ upon thermal shocking. Features of the microstructure control these changes. Lithologies with even few minerals that have high thermal conductivity, expansion coefficients (like SWG), or anisotropy (like MSA) will experience more thermal cracking and more permeability stimulation than lithologies without thermally sensitive minerals. Vp and Vs will be useful for detecting the presence of thermal cracks and likely an increase in permeability in some tight lithologies. Lithologies that lack minerals with high thermal conductivity, expansion coefficients, or anisotropy (like PTB) will not respond as well with a single thermal shock and may require additional stimulations or stimulation with a temperature gradient greater that 325°C to increase permeability.
Data availability statement
The datasets presented in this study can be found in online repositories. The names of the repository/repositories and accession number(s) can be found in the article/Supplementary Material.
Author contributions
Methodology and funding acquisition: TV. Data curation: MM. Data analysis: MM and TV. Manuscript writing: MM and TV.
Funding
This work was supported by the Stanford Rock Physics Affiliates Program and the School of Earth, Energy, and Environmental Sciences.
Acknowledgments
Part of the work was performed at the Stanford Environmental Measurements Facility with assistance of Juan Salvador Lezama Pacheco and the Scanning Electron Microscope Facility with guidance of Dale Burns.
Conflict of interest
The authors declare that the research was conducted in the absence of any commercial or financial relationships that could be construed as a potential conflict of interest.
Publisher’s note
All claims expressed in this article are solely those of the authors and do not necessarily represent those of their affiliated organizations, or those of the publisher, the editors and the reviewers. Any product that may be evaluated in this article, or claim that may be made by its manufacturer, is not guaranteed or endorsed by the publisher.
Supplementary material
The Supplementary Material for this article can be found online at: https://www.frontiersin.org/articles/10.3389/feart.2022.1054469/full#supplementary-material
References
Birch, F. (1960). The velocity of compressional waves in rocks to 10 kilobars: 1. J. Geophys. Res. 65, 1083–1102. doi:10.1029/JZ065i004p01083
Borgomano, J. R. F. (2000). The upper cretaceous carbonates of the gargano-murge region, southern Italy: A model of platform-to-basin transition. Bulletin 84. doi:10.1306/8626BF01-173B-11D7-8645000102C1865D
Bourbie, T., Coussy, O., and Zinszner, B. (1987). Acoustics of porous media. France: Imprimerie Nouvelle.
Bourbie, T., and Walls, J. (1982). Pulse decay permeability: Analytical solution and experimental test. Soc. Petroleum Eng. J. 22 (05), 719–721. doi:10.2118/9744-pa
Browning, J., Meredith, P., and Gudmundsson, A. (2016). Cooling-dominated cracking in thermally stressed volcanic rocks: Cooling-Dominated Cracking. Geophys. Res. Lett. 43, 8417–8425. doi:10.1002/2016GL070532
Burger, R., Sheehan, A., and Jones, C. (2006). Introduction to applied Geophysics. New York: W. W. Norton and Company, Inc.
Cermak, V., and Rybach, L. (1982). “Thermal Properties: Thermal conductivity and specific heat of minerals and rocks,” in Landolt-Bernstein Zahlenwerte and Funktionen aus Natuwissenschaften und Technik, Neue Serie, Physikalisched Eignschaften der Gesteine. Editor G. Angeneister (Berlin, Heidelberg and New York: Springer-Verlag), 305–343.
Clauser, C. (2006). “8.1 the Earth’s thermal regime,” in Renewable energy landolt-börnstein - group VIII advanced materials and technologies. Editor K. Heinloth (Springer Berlin Heidelberg), 493–548. doi:10.1007/10858992_17
Cooper, H. W., and Simmons, G. (1977). The effect of cracks on the thermal expansion of rocks. Earth Planet. Sci. Lett. 36, 404–412. doi:10.1016/0012-821X(77)90065-6
Coyner, K. B., and Martin, R. J. (1988). Frequency dependent attenuation in rocks. Fort Belvoir, VA: Defense Technical Information Center. doi:10.21236/ADA205276
Crowder, R., and Ross, D. (1973). Petrography of some granitic bodies in the northern White Mountains. California-Nevada: United States Department of interior and Geological Survey. Available at: https://permanent.fdlp.gov/gpo88501/report.pdf.
Daoud, A., Browning, J., Meredith, P. G., and Mitchell, T. M. (2020). Microstructural controls on thermal crack damage and the presence of a temperature-memory effect during cyclic thermal stressing of rocks. Geophys. Res. Lett. 47. doi:10.1029/2020GL088693
Darot, M., Gueguen, Y., and Baratin, M.-L. (1992). Permeability of thermally cracked granite. Geophys. Res. Lett. 19, 869–872. doi:10.1029/92GL00579
Darot, M., and Reuschlé, T. (2000). Effect of pore and confining pressures on V P in thermally pre-cracked granites. Geophys. Res. Lett. 27, 1057–1060. doi:10.1029/1999GL008414
Deer, W. A., Howie, R. A., and Zussman, J. (2013). An introduction to the rock-forming minerals. 3rd edn. London: Mineralogical Society of Great Britain and Ireland.
Dempsey, D., Kelkar, S., Davatzes, N., Hickman, S., and Moos, D. (2015). Numerical modeling of injection, stress and permeability enhancement during shear stimulation at the Desert Peak Enhanced Geothermal System. Int. J. Rock Mech. Min. Sci. 78, 190–206. doi:10.1016/j.ijrmms.2015.06.003
Eggertsson, G. H., Lavallée, Y., Kendrick, J. E., and Markússon, S. H. (2020). Improving fluid flow in geothermal reservoirs by thermal and mechanical stimulation: The case of Krafla volcano, Iceland. J. Volcanol. Geotherm. Res. 391, 106351. doi:10.1016/j.jvolgeores.2018.04.008
Folk, R. (1959). Practical petrographic classification of limestones. Bulletin 43. doi:10.1306/0BDA5C36-16BD-11D7-8645000102C1865D
Fu, Y. F., Wong, Y. L., Tang, C. A., and Poon, C. S. (2004). Thermal induced stress and associated cracking in cement-based composite at elevated temperatures––Part I: Thermal cracking around single inclusion. Cem. Concr. Compos. 26, 99–111. doi:10.1016/S0958-9465(03)00086-6
Gautam, P. K., Verma, A. K., Sharma, P., and Singh, T. N. (2018). Evolution of thermal damage threshold of jalore granite. Rock Mech. Rock Eng. 51, 2949–2956. doi:10.1007/s00603-018-1493-2
Goltermann, P. (1995). Mechanical predictions of concrete deterioration; Part 2. Farmington Hills, MI: Classification of Crack Patterns. MJ 92. doi:10.14359/1177
Gray, A. S., and Uher, C. (1977). Thermal conductivity of mica at low temperatures. J. Mater Sci. 12, 959–965. doi:10.1007/BF00540978
Gregory, A. R. (1977). “Aspects of rock physics from laboratory and log data that are important to seismic Interpretation1,” in Seismic stratigraphy — applications to hydrocarbon exploration (American Association of Petroleum Geologists). doi:10.1306/M26490C2
Griffiths, L., Lengliné, O., Heap, M. J., Baud, P., and Schmittbuhl, J. (2018). Thermal cracking in westerly granite monitored using direct wave velocity, coda wave interferometry, and acoustic emissions. J. Geophys. Res. Solid Earth 123, 2246–2261. doi:10.1002/2017JB015191
Heap, M. J., Lavallée, Y., Petrakova, L., Baud, P., Reuschlé, T., Varley, N. R., et al. (2014). Microstructural controls on the physical and mechanical properties of edifice-forming andesites at Volcán de Colima, Mexico. J. Geophys. Res. Solid Earth 119, 2925–2963. doi:10.1002/2013JB010521
Hidnert, P., and Dickson, G. (1945). Some physical properties of mica. J. Res. Natl. Bur. STAN. 35, 309. doi:10.6028/jres.035.014
Hofmann, H., Zimmermann, G., Zang, A., and Min, K.-B. (2018). Cyclic soft stimulation (CSS): A new fluid injection protocol and traffic light system to mitigate seismic risks of hydraulic stimulation treatments. Geotherm. Energy 6, 27. doi:10.1186/s40517-018-0114-3
Horai, K., and Simmons, G. (1969). Thermal conductivity of rock-forming minerals. Earth Planet. Sci. Lett. 6, 355–358. doi:10.1016/0012-821x(69)90076-4
Hovis, G. L., Brennon, S., Keohane, M., and Crelling, J. (1999). High Temperature Xray Investigation of Sanidine - analbite crystalline solutions: Thermal expansion, phase transitions, and volumes of mixing. Can. Mineralogist 37, 701–709.
Jin, P., Hu, Y., Shao, J., Zhao, G., Zhu, X., and Li, C. (2019). Influence of different thermal cycling treatments on the physical, mechanical and transport properties of granite. Geothermics 78, 118–128. doi:10.1016/j.geothermics.2018.12.008
Johnson, W. H., and Parsons, W. H. (1944). Thermal expansion of concrete aggregate materials. J. Res. Nat. Bur. Stds 32, 101. doi:10.6028/jres.032.002
Jones, C., Keaney, G., Meredith, P. G., and Murrell, S. A. F. (1997). Acoustic emission and fluid permeability measurements on thermally cracked rocks. Phys. Chem. Earth 22, 13–17. doi:10.1016/S0079-1946(97)00071-2
Jones, S. C. (1997). A technique for faster pulse-decay permeability measurements in tight rocks. SPE Form. Eval. 12, 19–25. doi:10.2118/28450-PA
Keshavarz, M., Pellet, F. L., and Loret, B. (2010). Damage and changes in mechanical properties of a gabbro thermally loaded up to 1, 000°C. Pure Appl. Geophys. 167, 1511–1523. doi:10.1007/s00024-010-0130-0
Kim, K., Kemeny, J., and Nickerson, M. (2014). Effect of rapid thermal cooling on mechanical rock properties. Rock Mech. Rock Eng. 47, 2005–2019. doi:10.1007/s00603-013-0523-3
Klinkenberg, L. J. (1941). The permeability of porous media to liquids and gases. "Proceedings" "OilGasScientificResearchProjects" Inst. SOCAR. (2), 57–73. doi:10.5510/ogp20120200114
Kranz, R. L. (1983). Microcracks in rocks: A review. Tectonophysics 100, 449–480. doi:10.1016/0040-1951(83)90198-1
Law, B. E., and Spencer, C. W. (1993). “Gas in tight reservoirs-an emerging major source of energy,” in The Future of energy gases 1570 (US Geological Survey Professional Papers), 233–252. Available at: https://books.google.com/books?hl=en&lr=&id=ZiMsAQAAIAAJ&oi=fnd&pg=PA233&ots=MNWvCv8JOO&sig=jlF0rrlrxQWDvkcfZnQzxH1Q_aA#v=onepage&q&f=false.
McKittrick, A., Abrahams, L., Clavin, C., Rozansky, R., and Bernstein, D. (2019). FORGE full report 2019.pdf. IDA science and Technology policy Institute. Available at: https://www.ida.org/-/media/feature/publications/f/fo/forge/d-10474.ashx.
Mercier, J., Zambelli, G., and Kurz, W. (2003). Introduction to materials science. Elsevier limited. Available at: https://www.sciencedirect.com/book/9782842992866/introduction-to-materials-science.
Mordensky, S. P., Kennedy, B. M., Villeneuve, M. C., Lavallée, Y., Reichow, M. K., Wallace, P. A., et al. (2019). Increasing the permeability of hydrothermally altered andesite by transitory heating. Geochem. Geophys. Geosyst. 20, 5251–5269. doi:10.1029/2019GC008409
Mukerji, T., and Mavko, G. (2006). Recent advances in rock physics and fluid substitution. Can. Soc. Explor. Geophys. 31, 14.
Nur, A. (1971). Effects of stress on velocity anisotropy in rocks with cracks. J. Geophys. Res. 76, 2022–2034. doi:10.1029/JB076i008p02022
Nur, A., and Simmons, G. (1970). The origin of small cracks in igneous rocks. Int. J. Rock Mech. Min. Sci. Geomechanics Abstr. 7, 307–314. doi:10.1016/0148-9062(70)90044-6
Pearson, B. J. C. (1941). A concrete failure attributed to aggregate of low thermal coefficient. ACI J. Proc. 38. Available at: https://www.concrete.org/publications/internationalconcreteabstractsportal/m/details/id/8585.
Rao, K. S., Bapu Rao, M. N., and Ariman, T. (1971). Thermal stresses in plates with circular holes. Nucl. Eng. Des. 15, 97–112. doi:10.1016/0029-5493(71)90058-6
Reinsch, T., Dobson, P., Asanuma, H., Huenges, E., Poletto, F., and Sanjuan, B. (2017). Utilizing supercritical geothermal systems: A review of past ventures and ongoing research activities. Geotherm. Energy 5, 16. doi:10.1186/s40517-017-0075-y
Robertson, E. (1988). Thermal properties of rocks. Reston, VA: US Department of Interior Geologic Survey.
Rose, P., McCulloch, J., Davatzes, N., Moore, J., Kovac, K., Adams, M., et al. (2006). Creation of an enhanced geothermal system through hydrualic and thermal stimulation. Available at: https://www.osti.gov/servlets/purl/1076593.
Rushing, J. A., and Cox, J. C. (2004). Klinkenberg-Corrected Permeability Measurements in Tight Gas Sands: Steady-State Versus Unsteady-State Techniques, 11.
Rutqvist, J., Dobson, P. F., Garcia, J., Hartline, C., Jeanne, P., Oldenburg, C. M., et al. (2015). The Northwest geysers EGS demonstration project, California: Pre-stimulation modeling and interpretation of the stimulation. Math. Geosci. 47, 3–29. doi:10.1007/s11004-013-9493-y
Schiffman, P., Elders, W. A., Williams, A. E., and McDowell, S. D. (1984). Active metasomatism in the cerro prieto geothermal system, baja California, Mexico: A telescoped low-pressure, low-temperature metamorphic fades series. Geology 4.
Sengupta, S. (1997). Evolution of geological structures in micro- to macro-scales. Dordrecht: Springer.
Shang, Z., Xu, L., Zhang, Z., Xu, X., Liu, T., and Xing, Y. (2019). Mineral composition, pore structure, and mechanical characteristics of pyroxene granite exposed to heat treatments. Minerals 9, 553. doi:10.3390/min9090553
Shiah, Y. C. (2016). Analysis of thermoelastic stress-concentration around oblate cavities in three-dimensional generally anisotropic bodies by the boundary element method. Int. J. Solids Struct. 81, 350–360. doi:10.1016/j.ijsolstr.2015.12.008
Siratovich, P. A., Villeneuve, M. C., Cole, J. W., Kennedy, B. M., and Bégué, F. (2015). Saturated heating and quenching of three crustal rocks and implications for thermal stimulation of permeability in geothermal reservoirs. Int. J. Rock Mech. Min. Sci. 80, 265–280. doi:10.1016/j.ijrmms.2015.09.023
Skinner, B. J. (1966). Section 6: Thermal expansion. Boulder, CO: Geological Society of America Memoirs (Geological Society of America), 75–96. doi:10.1130/MEM97-p75
Srogi, L., Watson, N., and Lutz, T. (2020). Dynamic development of mineral layering and crystal alignments by pulsed magmatic flow in crystal mush of an upper-crustal diabase sill. Geology V51H-0151. doi:10.1002/essoar.10501932.1
Tanguy, J. C., Condomines, M., and Kieffer, G. (1997). Evolution of the Mount Etna magma: Constraints on the present feeding system and eruptive mechanism. J. Volcanol. Geotherm. Res. 75, 221–250. doi:10.1016/S0377-0273(96)00065-0
Taylor, D. (1968). The thermal expansion of the sodalite group of minerals. Mineral. Mag. J. Mineral. Soc. 36, 761–769. doi:10.1180/minmag.1968.036.282.02
Tobin, R. (1997). “Chapter 1: Porosity prediction in frontier basins: A systematic approach to estimating subsurface reservoir quality from outcrop samples,” in Reservoir quality prediction in sandstones and carbonates: AAPG memoir 69. Editors J. A. Kupecz, J. Gluyas, and S. Bloch, 1–18.
T. M. Tritt (Editor) (2004). Thermal conductivity: Theory, properties, and applications (New York: Kluwer Academic/Plenum Publishers).
Tutti, F., Dubrovinsky, L. S., and Nygren, M. (2000). High-temperature study and thermal expansion of phlogopite. Phys. Chem. Minerals 27, 599–603. doi:10.1007/s002690000098
U.S. Department of Energy (2019). GeoVision: Harnessing the heat beneath our feet. Available at: https://www.energy.gov/eere/geothermal/downloads/geovision-harnessing-heat-beneath-our-feet.
Vanorio, T. (2015). Recent advances in time-lapse, laboratory rock physics for the characterization and monitoring of fluid-rock interactions. GEOPHYSICS 80, WA49–WA59. doi:10.1190/geo2014-0202.1
Vinciguerra, S., Trovato, C., Meredith, P. G., and Benson, P. M. (2005). Relating seismic velocities, thermal cracking and permeability in Mt. Etna and Iceland basalts. Int. J. Rock Mech. Min. Sci. 42, 900–910. doi:10.1016/j.ijrmms.2005.05.022
Wyllie, M. R. J., Gardner, G. H. F., and Gregory, A. R. (1962). Studies of elastic wave attenuation in porous media. GEOPHYSICS 27, 569–589. doi:10.1190/1.1439063
Yavuz, H., Demirdag, S., and Caran, S. (2010). Thermal effect on the physical properties of carbonate rocks. Int. J. Rock Mech. Min. Sci. 47, 94–103. doi:10.1016/j.ijrmms.2009.09.014
Zhou, Y. C., Long, S. G., Duan, Z. P., and Hashida, T. (2001). Thermal damage in particulate-reinforced metal matrix composites. J. Eng. Mater. Technol. 123, 251–260. doi:10.1115/1.1362675
Keywords: thermal shocking, microstructure, elastic moduli, permeability, time-lapse, micro-imaging, tight rocks
Citation: Malenda M and Vanorio T (2023) Using acoustic velocities and microimaging to probe microstructural changes caused by thermal shocking of tight rocks. Front. Earth Sci. 10:1054469. doi: 10.3389/feart.2022.1054469
Received: 26 September 2022; Accepted: 15 December 2022;
Published: 16 January 2023.
Edited by:
Luc Louis Lavier, The University of Texas at Austin, United StatesReviewed by:
Santanu Misra, Indian Institute of Technology Kanpur, IndiaKang Peng, Chongqing University, China
Copyright © 2023 Malenda and Vanorio. This is an open-access article distributed under the terms of the Creative Commons Attribution License (CC BY). The use, distribution or reproduction in other forums is permitted, provided the original author(s) and the copyright owner(s) are credited and that the original publication in this journal is cited, in accordance with accepted academic practice. No use, distribution or reproduction is permitted which does not comply with these terms.
*Correspondence: Margariete Malenda, bWFsZW5kYUBzdGFuZm9yZC5lZHU=