 Gang Zhang
 Fangzhou Tu
 Yushu Tang1
 Xingchang Chen
- 1School of Environment and Resource, Southwest University of Science and Technology, Mianyang, Sichuan, China
- 2Tianfu Institute of Research and Innovation, Southwest University of Science and Technology, Mianyang, Sichuan, China
- 3Mianyang S&T City Division, the National Remote Sensing Center of China, Mianyang, Sichuan, China
Natural disasters such as debris flow caused by earthquakes seriously threaten the local infrastructure and economy, as well as the lives of people in the area. As the material source of debris flow, it has significance to accurately and effectively study the underground structure of the landslide to prevent debris flow disasters. A landslide has a complex structural system, and its underground characteristics play an important role in its stability. The early identification of fracture surfaces and unstable bodies, and assessment of potential hazards are essential for prevention and protection. The research object of this paper is a landslide that occurred in Yige Village, Xianshui Town, Daofu County, which is on the Xianshui River Earthquake Zone, an area subject to frequent earthquakes. In western Sichuan, the frequent occurrence of landslides has caused considerable economic losses. Developing methods for efficient and accurate risk assessment is a top priority. The Daofu landslide is a typical example of a landslide directly threatening the road below and forming a debris flow channel. The lithology is composed of Jurassic sedimentary rocks, such as marl and clay, covered by limestone. In this study, we combined traditional methods (drilling and field investigation) with two geophysical techniques, multichannel analysis of surface waves (MASW) and electrical resistivity tomography (ERT) to effectively determine the electrical characteristics, velocity characteristics and spatial structure of the landslide. It is found that the buried depth of the sliding surface of the landslide is about 16–20 m. The sliding body above the sliding surface forms a low velocity and low resistivity Quaternary cover. The rock mass below the sliding surface is Triassic Zhuwo Formation sandstone and slate with high velocity and high resistivity. According to comprehensive analysis, the landslide lacks sufficient stability under rainstorm. Our study shows that the use of MASW and ERT can quickly and effectively characterize the subsurface of landslides to assess landslide risk and prevent debris flow hazards.
1 Introduction
Daofu county, where this study was conducted, is located in the western of Sichuan Province and lies on the Xianshui River Earthquake Zone (Allen et al., 1991). Historically, this seismic zone has been characterized by frequent seismic activity, large magnitude and strong intensity of damage, which is the highest in Sichuan (Papadimitriou et al., 2004).
Landslide is one of the most common geological disasters in nature, and it is also one of the most dangerous natural phenomena (Petley and D., 2012). In a landslide, the soil or rock mass on a slope slides down as a whole or in a way along a certain weak surface or zone, affected by river scouring, rainwater soaking, groundwater movement, earthquake, or artificial slope cutting (Mekonnen et al.; Allen, 2017; Wang et al., 2022). Debris flow caused by landslide remains one of the greatest threats to the lives, properties, and infrastructure of residents during or following an earthquake. Landslides occur frequently in western Sichuan, examples include the Jiagu landslide in 2006 (Yin et al., 2010), the No. 2 landslide of the Sichuan Tibet Highway 102 landslide group in 2002 (Li et al., 2003), and the Qingning landslide in 2008 (Hu et al., 2008). It is a time and resource consuming task to thoroughly investigate them and fully prevent debris flow disasters before they occur. The estimation of landslide stability must consider the three-dimensional shape of the unstable body, especially the possible location of the slip surface associated with it (Yueping et al., 2013). Consequently, it is necessary and urgent to formulate and implement actions to accurately and quickly identify the underground characteristics of natural slopes.
When investigate landslide hazards, the distribution characteristics of the sliding surface, landslide zone, and geological stratification must be determined (Liu et al., 2022). The means of landslide identification and monitoring are extremely rich. In terms of exploration methods in geological engineering and geological disaster prevention, traditional geophysical prospecting methods, such as drilling and geological survey, have some shortcomings, such as high cost, insufficient information acquisition, and low efficiency (McCann and Forster, 1990). Geophysical exploration is an indirect observation method that uses the properties for known ore rock specimens, according to an established relationship (mathematical, physical model) and the principle of the corresponding method, to explain the parameter values observed in the field, and then the final results (physical parameters information of the corresponding profiles after inversion) are sufficient to illustrate the information on the subsurface structure of the exploration site. In recent years, the application of geophysics for landslide studies has widely increased, especially for near-surface exploration of landslide areas marked by a complex geological setting (Popescu et al., 2016).
Due to complex and changeable ground conditions and the influence of the working climate, the efficiency and results of different geophysical methods may significantly vary (Hussain et al., 2019; Qiu et al., 2022). A single geophysical exploration method usually only analyzes one kind of physical characteristic of the target medium, and the results of interpretation often have many solutions and other limitations (Cardarelli et al., 2013). Therefore, we use two geophysical methods to fully obtain the subsurface information of the landslide, and also to overcome the limitation of single method results interpretation, which can improve the efficiency of the work and the accuracy of the results (Schrott and Sass, 2008; Cardarelli et al., 2013).
In recent years, using comprehensive exploration geophysical methods to carry out geological exploration has gradually become the norm (Bedair et al., 2021). The two geophysical methods used in this paper are multichannel analysis of surface waves (MASW) and electrical resistivity tomography (ERT), both have proved to be the efficient methods for landslide research among all geophysical methods, (Loke et al., 2015; Khalil et al., 2017; Marciniak et al., 2021). We use a combination of these two methods because a single geophysical method is non-unique in the interpretation of the results, which limit us to make accurate judgments about the subsurface structural information obtained from the inversion, MASW is a good match for ERT in terms of detection depth, and the combination of their inversion results can provide more complete information to the subsurface structural of the landslide. To some extent, this can eliminate the impact of multiple solutions of a single geophysical method.
Many seismic methods have been proposed for near-surface characterization and measurement of shear wave velocity, using various test configurations, processing techniques, and inversion algorithms. The most widely used technologies are spectral analysis of surface waves (SASW) and multichannel analysis of surface waves (MASW). The MASW used in this paper is widely used due to its easy generation, detection (recording), and processing, as well as its effectiveness and reliability. This technology uses the propagation of surface waves (mainly Rayleigh) and is, therefore, based on the Rayleigh wave dispersion principle.
ERT has been widely used in various landslide studies under different geological environments (Dahlin, 2001; Jongmans and Garambois, 2007), it responds to changes in resistivity and is used to determine the distribution of resistivity of subsurface media. The resistivity of the subsurface medium varies over a wide range and the electrical conductivity of the medium is influenced by various factors such as mineral composition, soil porosity and water content, etc. ERT has the ability to efficiently respond to differences in the electrical conductivity of the medium (Colangelo et al., 2008; Falae et al., 2019; Wang et al., 2021).
The advantages of geophysical methods can almost entirely compensate for the disadvantages of conventional geotechnical engineering (Al-Heety et al., 2021). The joint application of MASW and ERT can solve the problems encountered in most shallow geophysical explorations. Specifically, MASW provides more useful shallow layer information, while ERT is more suitable for medium-thick layers (Rahimi et al., 2018). Therefore, the combination of the two methods is considered to be a valuable tool for pre-evaluating high-risk slip areas. However, more verification of the accuracy and applicability of this combined approach is required when detecting landslides. Therefore, in this study, based on using a combination of MASW and ERT to distinguish the underground structure of a clay slope, geological drilling was also conducted on five survey lines at the same time. Through the verification and calibration of borehole data and on-site observation, unstable bodies and potential slip surfaces can be fully inferred, which ensures the scientific basis and accuracy of the exploration results of the two geophysical methods.
The aim of this paper is to demonstrate the utility of the combination of geophysical methods (MASW and ERT) to characterize the subsoil media and potential risk areas for landslides in Daofu County. By analyzing the media and geophysical inversion below the surface and investigating the bedrock structures near the surface, such as cavities, soft soil, and weak zones, we can infer the possible location of the sliding surface, which can then make preparations for the prevention and control of debris flow disasters.
2 Research background
2.1 Study area
The landslide under study is in Yige village, Xianshui Town, Daofu county (Figure 1B). The geographical coordinates of the landslide are 101° 07′ 52″–101° 08′10″E and 31° 00′ 00”–31° 01′ 10″ N (Figure 1A). The landslide location is in the north of Daofu County, about 5 km away from city proper, it is an accumulation slope with a gradient of 40–60°, an elevation of 3,110–4000 m, and a relative elevation difference of about 900 m. At the foot of the slope is County Road 179 (Daofu county to Malkang, Figure 1C), which is also the direct threat of the landslide. The exploration area is located at the foot of the middle and low mountain formed due to tectonic erosion, with convenient transportation. A total of five ERT survey lines, one MASW survey lines, and six geological boreholes were made (Figure 1C).
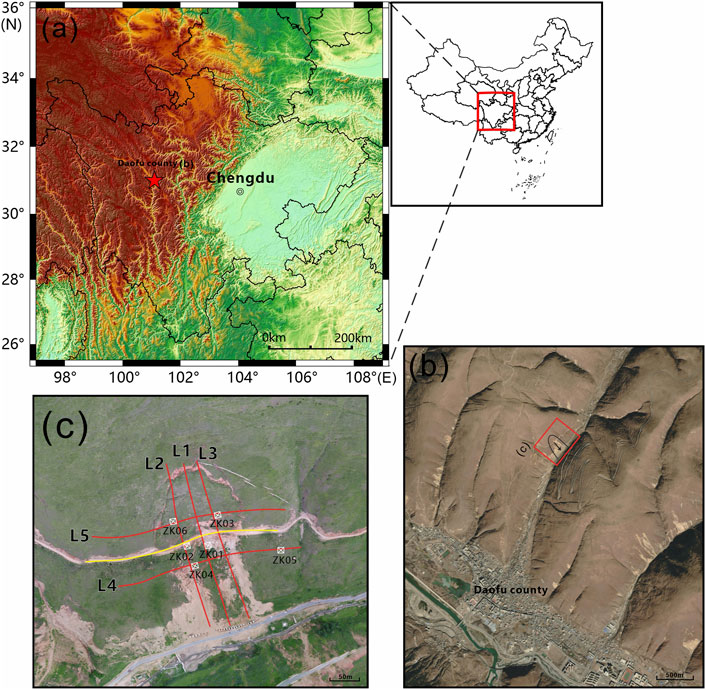
FIGURE 1. (A)Map of China, Location of Sichuan Province(B)Elevation topographic map of Sichuan Province and location of study area, the red five pointed star is the location of the study area(C)Aerial photo of the study area, survey line layout and borehole location.
Daofu County belongs to the subtropical humid climate zone of the Qinghai Tibet Plateau, with a plateau valley cold temperate climate. Winters are cold, summers are mild, sunshine is sufficient, the frost-free period is short, the temperature difference between day and night is large, and the dry and wet seasons are distinct. According to the statistical data from Daofu County Meteorological Station from 1957 to 2007, the rainy season in Daofu County generally lasts from the first 10 days of June to the last 10 days of September, with an average annual precipitation of 458.6 mm, accounting for 74.2% of the annual total. The highest precipitation occurs in July, followed by August and October. The dry season generally lasts from the last 10 days of October to the last 10 days of March of the following year, with precipitation of only 21.3 mm, accounting for only 3.4% of the annual total. The maximum rainfall in 24 h is 49.7 mm,14.00 mm in 1 h, and 11.9 mm in 10 min. All these values exceed the critical rainfall values for forming debris flow and causing landslides.
Affected by the relative position relationship between landslide and Daofu County. When landslide occurs, it will directly threaten County Road 179 below the toe of the slope, and the landslide will wash into the ditch under the action of rain, causing the blockage of the debris flow ditch in the Daofu Valley, which can lead to the formation of a barrier lake that will seriously threaten the safety of the lives and property of the residents of Daofu County and various government agencies based at the gully mouth.
2.2 Stratum lithology in the study area
In order to better have the geological information of the study area, we made a detailed geological survey and six geological boreholes. According to geological drilling and geological survey results, the exposed strata in the survey area are mainly the Quaternary Holocene colluvium and slope deposit (Q4cl+dl), landslide accumulation (Q4del), alluvial proluvial (Q3apl)strata of the Cenozoic, and the upper triassic Zhuwo formation (T3zh), as follows:
2.2.1 Quaternary system (Q4)
1) Holocene landslide deposit (Q4del): mainly distributed on the landslide mass. It is mostly composed of angular rock fragments in clay and loam, with a loose structure.
2) Holocene colluvium and diluvium (Q4cl+dl): mainly distributed on the hillsides on both sides of the valley. It is mostly composed of angular rock fragments contained in clay and loam, generally loose ∼ slightly dense, and the accumulation thickness is large around Daofu county.
3) Pleistocene alluvium (Q3apl): distributed on the high-level platform on both sides of the river, it is composed of yellowish-gray clay, loam, coarse sand, gravelly sand, gravelly soil, pebble soil, and boulder soil, containing calcareous nodules and calcareous semi cementation. It has an obvious binary structure. The lithology is generally miscellaneous, with good compactness, and is generally slightly dense to medium dense.
2.2.2 Upper Triassic Zhuwo Formation (T3zh)
It is gray to dark gray, thin, medium to thick, with a few massive fine-grained meta feldspathic quartz sandstones, meta lithic sandstones, meta fine sandstones, siltstones, locally meta tuffaceous sandstones, tuffs of this layer, and dark gray silty slate, spotted sericite slate, phyllite slate (or phyllite), dark gray to black-gray carbonaceous phyllite (or slate) are produced in an unequal thickness distribution. Sandstone and slate are interbedded, the attitude of the rock stratum is 55°∠ 45°, and the thickness ratio of the upper sandstone and slate is about 5:3; the middle part is of rhythmic interbedding with unequal thickness, which is often mixed with 1–2 layers of thick massive metasandstone with a thickness of tens of meters. The thickness ratio of sandstone to slate is about 1:1; there are more sandstones in the lower part, and sandstone and slate are produced in unequal thickness interbedding, with a thickness ratio of sandstone to slate of about 4:1.
2.3 Sample soil parameters
During the drilling activity, soil and rock samples from six boreholes were carefully collected and transported to the laboratory for measurement of their basic physical properties and mechanical parameters. According to this survey, six undisturbed samples (undisturbed soil samples) were collected by the static pressing method using a thin-walled soil sampler in the borehole. All samples were sealed with wax on-site, packed in special shockproof wooden boxes, and sent immediately to the Geotechnical Test Center. The accuracy of the test data met the requirements of this study. The specific parameters were comprehensively determined by laboratory tests of the rock and soil samples taken from the boreholes, empirical analogy, and the parameter inversion method, Table 1 and Table 2 show the physical and mechanical properties of soil samples obtained in the experiment.
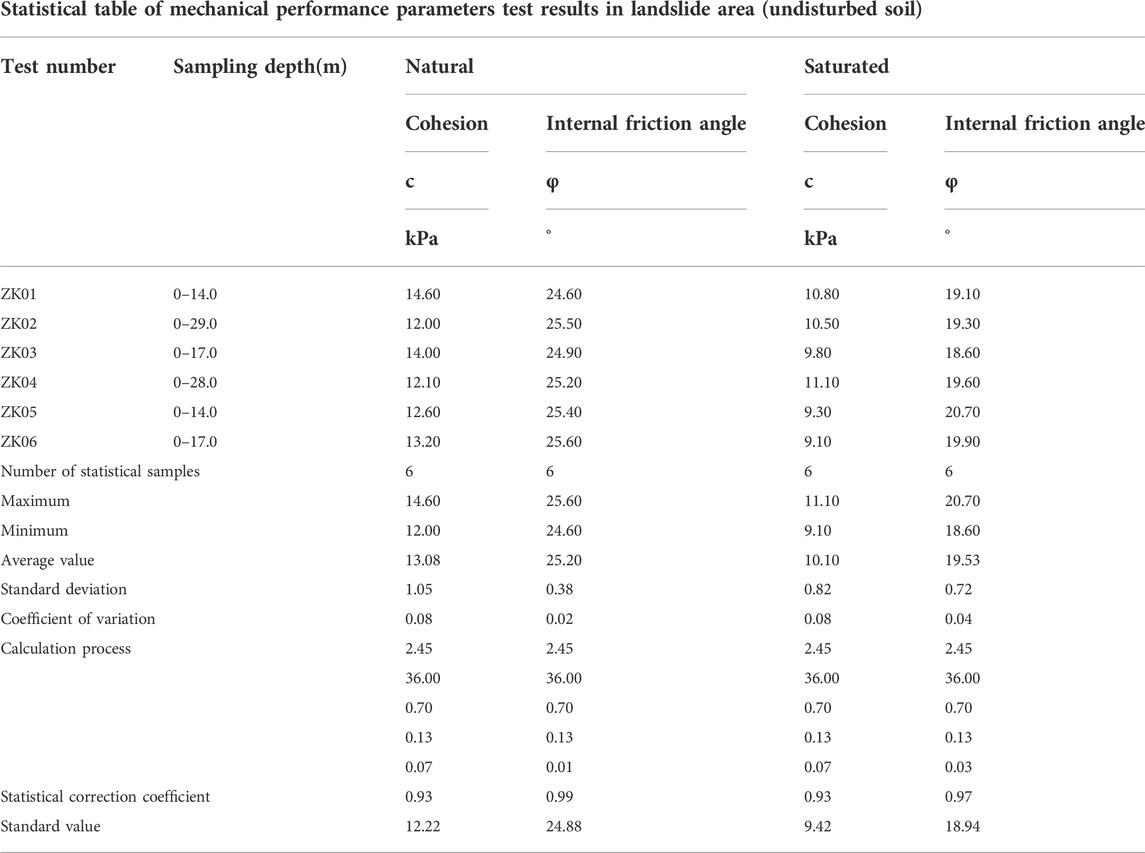
TABLE 1. Statistical table of soil mechanical parameters in landslide area.
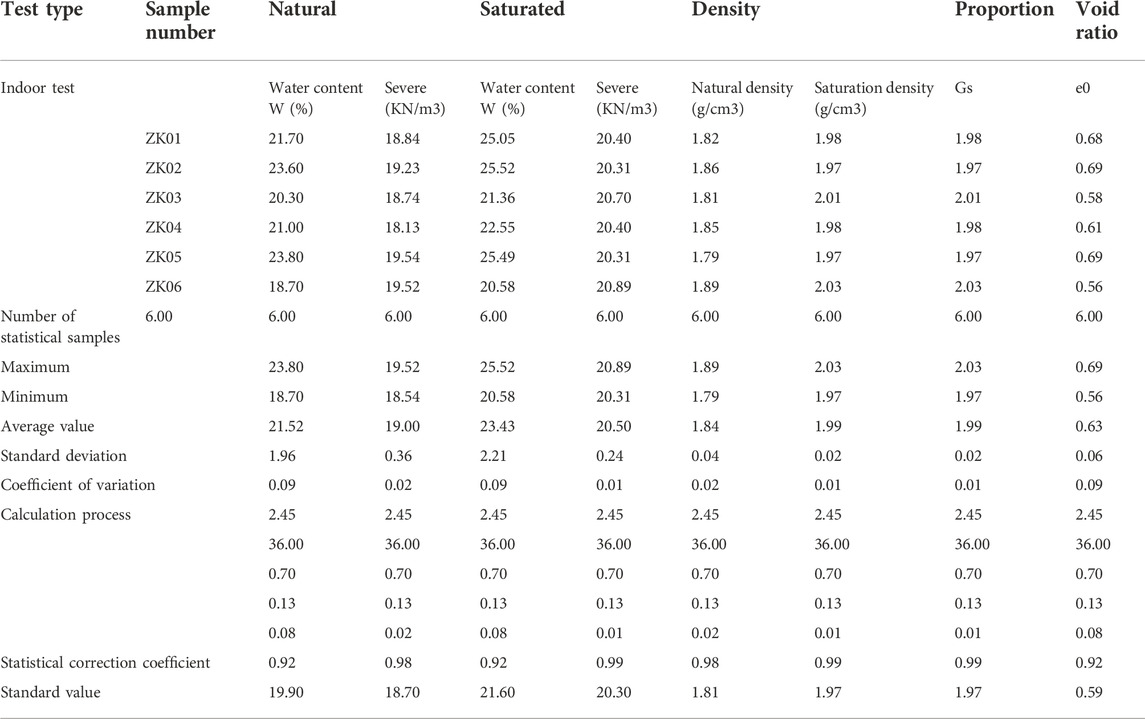
TABLE 2. Statistical table of physical and mechanical parameters of landslide area.
As the original crushed stone composition in the soil mass is removed before the mechanical properties of the sliding zone soil are measured, the experimental data is different from the local empirical data and only serves as a reference in terms of a comprehensive value. Based on the geological drilling data, the mechanical parameters of the soil in the landslide area are calculated, and the corresponding geotechnical engineering soil mechanical information is obtained. The data in Table 1 can help us calculate the shear strength of the soil (Sharma and Bora, 2003; Tang et al., 2010), the data in Table 2 directly provides three proportional indicators of the sample soil (Jabro, 1992). Finally, combined with soil sample data,CD-test (consolidation drained test) is conducted, and the results provide strong material support for geophysical inversion interpretation. The above materials and experimental results were combined to conclude that the specimen soil is susceptible to shear failure under saturated conditions. This conclusion indicates that the landslide body in the study area has low shear strength and poor stability under heavy rainfall conditions.
3 Methodology and data
3.1 Methodology
Combining MASW and ERT surveys with geological drilling samples, we identified and studied the underground characteristics of landslides, especially the profiles of potentially unstable bodies and potential sliding surfaces, which are initially assumed to be fault or joint planes, and the interfaces between highly fractured rocks of topsoil or complete bedrock (Duc, 2013).
MASW method is a geophysical method to derive the velocity profile of underground shear wave based on the dispersion characteristics of Rayleigh wave in layered media. Rayleigh waves are surface waves that propagate along a free surface, such as a solid-air or solid-water interface. Relatively low velocity, low frequency and high amplitude are the characteristics of Rayleigh wave (Largo et al., 2021). It is the result of interference P-wave and SV-wave, corresponding to the vertical component and radial component of surface wave respectively. The amplitude of this wave motion decreases exponentially with depth and is confined to a vertical plane consistent with the wave propagation direction (Xia et al., 2004). The propagation velocity of surface wave is related to frequency, which is called dispersion (Park et al., 1999). Put it another way: assuming that the vertical velocity changes, surface wave has a different propagation velocity on each unique frequency component (Foti, 2005). The principle states that if there is a low-velocity capping layer or a layered medium on the surface, the Rayleigh wave will have a distinct “dispersion” characteristic, i.e., the different frequency harmonic components of the Rayleigh wave will propagate at different speeds. Through an effective inversion process, the dispersion curve can be inverted to obtain the one-dimensional (depth) shear wave velocity (Vs.) profile of the surveyed site and the final pseudo-two-dimensional section can then be obtained by combining multiple one-dimensional profiles (Zhang et al., 2004; Bensen et al., 2007; Ritzwoller et al., 2008). Compared to other geophysical methods, MASW has been proved to be a more effective method to reveal the nature of shallow underground (Anbazhagan and Sitharam, 2008).
ERT method is to use conventional resistivity measurement methods and high and new technologies such as resistivity imaging (C-T) to conduct high resolution and high efficiency electrical exploration (Huntley et al., 2019). It is performed by applying a constant current to the ground through two current electrodes and measuring the voltage difference generated across the two electrodes. From the current and voltage values, an apparent resistivity value is calculated. The basic principle is to study the distribution law of conductive current of geological body in underground half space under the action of external electric field based on the difference of conductivity of underground medium (Auken et al., 2006; Tsai et al., 2021). The features are high horizontal resolution and vertical resolution. The electrodes are laid at one time, reducing the faults and interference caused by electrode setting; At the same time, more abundant geological information about geoelectric section can be obtained (Abdullah et al., 2018). The main drawback of the ERT method is the extensive overlap of the subsurface resistivity ranges of different geological units. For example, the resistivity of chalk loam is 30–100 Ω, mudstone is 105 Ω, and limestone is 100–105 Ω. The resistivity depends to a large extent on the porosity and water content (Sass et al., 2008).
3.2 Data acquisition
To investigate the underground structure and obtain the input data of the Daofu landslide, we completed a total five ERT (L1 to L5) and one MASW survey lines of measurement in June 2022. As seismic methods use the same lens collection method, multiple geophysical methods aimed at collecting datasets are cost-effective. These survey lines cover the landslide area so that the landslide mass is in the middle of them. MASW survey line is located in the middle of landslide (Figure 1C, yellow line).
The technical parameters adopted for ERT method detection are as follows: the electrodes are arranged in a Wenner device, the electrode spacing is 5m, the minimum isolation coefficient Nmin=1, the maximum isolation coefficient Nmax=19, the power supply time is 2s, the number of electrodes is 60, and the maximum detection depth is about 40 m. In this structure, the divergence between current electrode pairs (AB) is the same as that between potential electrode pairs (MN), and is usually an integral multiple. Wenner structure is very sensitive to the horizontal changes and resistivity changes between each dipole and electrode, so it can well plot vertical structures such as cavities. To obtain a dense dataset, so the geophone and electrode spacing was set to 5 m. This electrode spacing is ideal because it allows the use of gradient arrays for surveys up to 40 m deep. In the Daofu country landslide, the two-dimensional mapping of the multi-electrode resistivity method was carried out by applying a constant current to the ground through two current electrodes and measuring the voltage difference between the two electrodes.
The device used in the MASW study was an SWS-5 multi-wave train digital image engineering exploration and engineering detection device. This is a high-performance and multi-functional geotechnical engineering investigation and detection device. An active artificial source multichannel transient surface wave survey was adopted for this study, with an offset and track spacing of 5 m. It is symmetrically arranged with the test point as the center, and 24 channel geophone receiving mode is selected. The frequency of the detector is 40Hz, the sampling interval time is 0.5 ms, and the recording length is 1.5s.
3.3 Data processing
Code and algorithms within the RES2DINV software package developed by Aarhus GeoSoftware (Denmark) were used to invert the resistivity datasets on all profiles collected. By eliminating bad data points, terrain positioning, root mean square convergence constraints, least squares inversion, and robust smoothing constraints, two-dimensional resistivity images were obtained (Loke, 1996). The inherent error (RMS) of the two-dimensional inversion model ranged from 4.3% to 8.3%, and the results were good and reliable. However, it was found that as the surface soil of the landslide at the research site is dry and loose, this led to poor contact of some electrodes, resulting in noisy data in some areas and high error, but this did not seriously affect the data interpretation.
MASW data processing uses the frequency velocity (F-P) method was used to calculate the anti-dispersion curve to determine the variation of shear wave velocity profile with depth (Grandjean et al., 2011; Lima Júnior et al., 2012). After assembling multiple 1D pseudo-profiles, the final shear wave velocity-depth two-dimensional pseudo-profile is obtained.
4 Results and discussion
4.1 Interpretation of ERT inversion results
Figures 2–6 show the underground information obtained from the ERT profiles, corresponding to the five measuring lines L1, L2, L3, L4, and L5, respectively. Besides, the location, depth and lithology information of borehole ZK01-06 are also marked in the figure. The deepest measurement depth of the borehole is about 30 m underground.
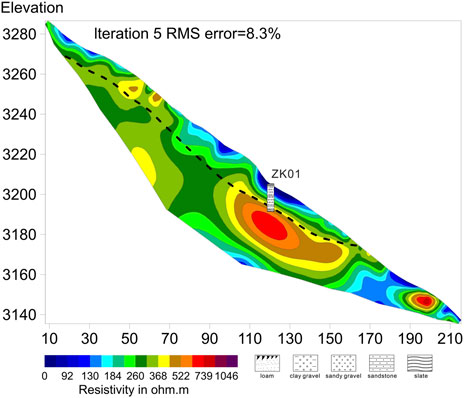
FIGURE 2. Inversion results of L1 survey line.
The electrical structure model of each section obtained in this study can provide the corresponding formation lithology information, and also reveal the morphological characteristics of geoelectric section or stratum to a certain extent, which provides an effective basis for the structure and stability evaluation of landslide.
From the inversion electrical structure model (Figures 2–6), it can be seen that the study area has an overall low resistivity-high resistivity electrical characteristic from shallow to deep. The electrical properties of shallow layers are generally characterized by low resistivity, mainly concentrated in the landslide surface depth of about 5 m–30 m; the middle and deep electrical properties are mainly characterized by medium and high resistivity, while there are banded or massive abnormal bodies with low resistivity locally in the section. Combined with the information from the borehole, the lithology from the surface to the depth is mainly sandy clay layer of the Quaternary—sand and gravel layer—bedrock (sandstone and slate) of the Upper Triassic Zhuwo Formation. The location where there is obvious difference or change in electrical properties is usually the place that reflects the boundary of electrical media. Obviously, as shown in the figure, there is a significant interface of electrical properties difference between shallow low resistivity and deep high resistivity. Combined with the borehole data, it can be known that this interface is the stratum contact surface of the Quaternary system and Triassic system. Therefore, we infer this stratigraphic interface as the main sliding surface of the landslide (as shown by the dotted line in the figure), and consider this landslide as a bedding landslide.
The low resistivity anomaly in the profile is divided into two parts by taking the sliding surface as the boundary, the low-resistivity anomalies above the sliding surface are mainly caused by the water-bearing clay and conglomerate debris with loose structure of the Quaternary System, while the low-resistivity anomalies below the sliding surface are presumed to be caused by the water-filled cracks formed by a series of tensile shear damage to the underlying bedrock during the landslide deformation. In addition, the section shows a typical electrical gradient zone between the high resistivity layer and the overlying rock and soil mass, and the high resistivity part of the gradient zone is sandstone and slate of the Upper Triassic Zhuwo Formation according to the borehole information.
By analyzing the inversion results of L1 survey line (Figure 2), The surface shallow layer generally presents low resistivity characteristics (<368 Ω·m), which is related to the overburden bond layer composed of silty clay and granular gravel. The high resistivity zone is located directly below well ZK01 and is approximately 18–28 m thick, and the borehole data indicate that the high resistivity anomaly in this block is derived from the metamorphic rocks of the Upper Triassic Zhuwo Formation. Moreover, There is a low resistivity abnormal zone at the lower edge of the section, which divides two high resistivity abnormal bodies. It is speculated that the abnormal zone is caused by the shear failure of the underlying rock strata caused by the landslide deformation and the water filling in the cracks. Similar situations can be seen in the inversion results of L3 lines (Figure 4). On the other hand, in Figures 2, 3, it can be seen that the local high resistivity anomaly occurs on the shallow surface of the landslide. It is presumed to be the residue formed after denudation of high resistivity rock mass which was transported to here.
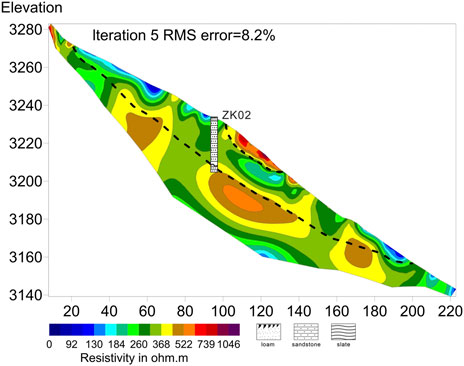
FIGURE 3. Inversion results of L2 survey line.
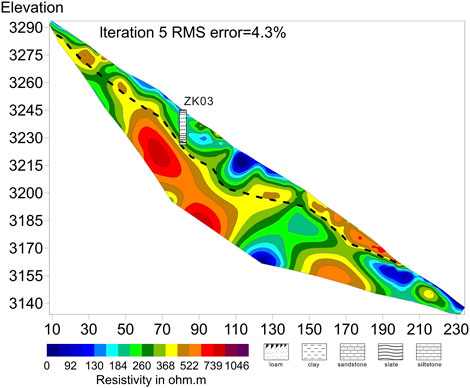
FIGURE 4. Inversion results of L3 survey line.
The inversion result of L4 (Figure 5) shows that in the middle section (horizontal distance 120–140 m), there is a longitudinal low-resistivity abnormal zone running up and down the section. We speculate that the cause is surface water infiltration in the cracks caused by the compression deformation of the landslide front.
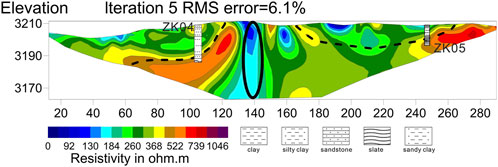
FIGURE 5. Inversion results of L4 survey line.
Figure 6 shows the inversion results of L5. There are many areas with high resistivity anomalies near the shallow surface. There are some abnormal areas of high resistivity in the shallow part of the landslide, and the electrical transition between these high-resistance blocks and the deep high-resistance bodies is natural and interconnected. From the surface geological survey, it is known that there is a reverse fault near the landslide. Therefore, we speculate that this phenomenon is caused by the fact that under the control of the fault structure in this area, the original underlying bedrock invades the landslide accumulation body under the action of compressive stress and shear stress. This interpretation is also applicable to the interpretation of high resistivity areas in the landslide body of Line L2-4 in Figures 3–5.
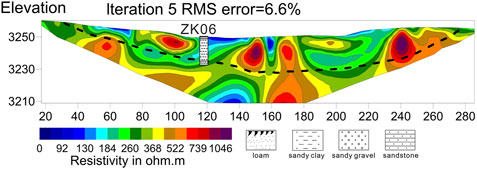
FIGURE 6. Inversion results of L5 survey line.
After obtaining all the results, by comparing the ERT electrical results with the borehole data (Figure 7, representative geological borehole sampling images, ZK05 and ZK06), we concluded that the electrical structure was in good agreement with the borehole data. The inversion structure of three longitudinal and two transverse survey lines at the same place of coincidence also shows the accuracy of the underground electrical structure obtained from the study. In order to further verify the validity of the above results and conduct a more comprehensive landslide risk assessment, we conducted a MASW survey.
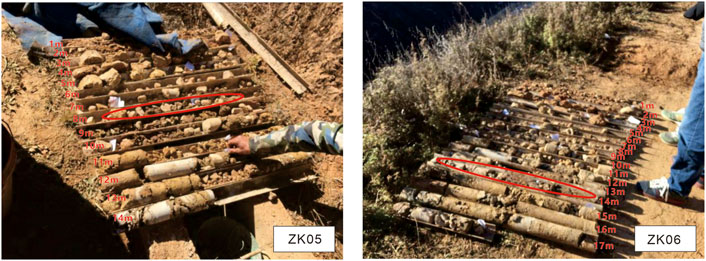
FIGURE 7. Geological drilling sample (ZK05,ZK06).
4.2 Interpretation of MASW inversion results
Figure 8 shows the MASW inversion results, the Vs. model inversion results of the MASW transverse section along the survey line. The shear wave velocity ranges from 309 m/s to 809 m/s. From shallow layer to deep layer, the shear wave velocity generally presents the characteristics of low-velocity, medium-velocity and high-velocity structure, which reflects the changes of the composition, structure and rock strength of the underground media of the landslide to a certain extent.
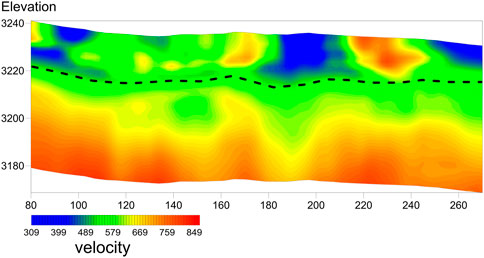
FIGURE 8. Inversion results of MASW survey line.
As can be seen from the figure, there are three low-velocity abnormal areas (<400 m/s) above the elevation of 3220 m, corresponding to the low-resistivity abnormal areas shown in the ERT section and the landslide deposits with low strength in the borehole data. Besides, there are two high-velocity abnormal areas (>669 m/s) on the surface at the distance of 170 m and 230 m. Similarly, we believe that this is related to the upward invasion of the underlying bedrock to the landslide under the action of tectonic stress, which is mainly caused by metamorphic rocks with high strength. In addition, part of the 486–669 m/s wave velocity at the surface may be related to less weathering/fracture of the surface bedrock and the crystalline gypsum in the mudstone interbedding. The dotted line in the figure shows the boundary position between the shallow high-speed layer and the low-speed layer on the surface, and the interface is presumed to be a landslide surface. On the other hand, we can see from the diagram, below the sliding surface of high velocity layer exist evident in the interface, we believe that in the process of landslide movement under the cover of the bedrock under stress produced in the bedrock fissure deformation or damage, caused the top velocity is relatively low, bedrock lower due to relatively intact rock mass, the strength is larger, Therefore, the shear wave velocity is higher.
5 Conclusion
In this study, a total of 5 ERT survey lines and 1 MASW survey line were completed to completely cover the target landslide area. The electrical structure of the five profiles was studied by inversion calculations using the least squares method, and the results showed that the overall electrical characteristics of the study area ranged from low resistivity to high resistivity from shallow to deep. The sliding surface is roughly located on the interface between the high resistivity and low resistivity areas. The shallow low-resistivity area above the slip surface is composed of the Quaternary accumulation; the deeper high-resistivity area below the slip surface is composed of the Upper Triassic Zhuwo Formation. Through velocity structure model obtained by inversion of MASW data, the results show that the study area has a low-moderate-high velocity structure from shallow to deep. The shallow low-velocity area is composed of loose overburden, and the medium-velocity zone is composed of cracked bedrock, while the high-speed area is composed of more complete bedrock and slate. Furthermore, the structural characteristics of the landslide in the study area are determined by combining the borehole data and the structural characteristics of the two models. The main sliding surface of the landslide is the interface between the Quaternary overburden layer and the sandstone/slab layer of the Triassic Zhuwo Formation, which belongs to the bedding landslide. The average buried depth of the sliding surface is about 16–20 m. The area above the sliding surface has the characteristics of low speed and low resistance. The sliding surface is characterized by high speed and high resistance, and the sliding surface is located at the interface between the low speed zone and the high speed zone.
Based on the study results, we believe that combining MASW and ERT for landslide exploration to obtain subsurface information is an effective method. This is also a more efficient and economical solution for debris flow prevention and management than traditional exploration methods such as geological boreholes.
Data availability statement
The original contributions presented in the study are included in the article/Supplementary Material, further inquiries can be directed to the corresponding author.
Author contributions
GZ contributed to the conception of the study. GZ performed the experiment. FT contributed significantly to analysis and manuscript preparation. FT performed the data analyses and wrote the manuscript. YT helped modify the pictures. YT improved the paper contents. XC helped perform the analysis with constructive discussions. KX provided the soil sample experimental data. SD revised paper contents.
Funding
This paper was supported by The Second Tibetan Plateau Scientific Expedition and Research (STEP) program (Grant No. 2019QZKK0902).
Conflict of interest
The authors declare that the research was conducted in the absence of any commercial or financial relationships that could be construed as a potential conflict of interest.
Publisher’s note
All claims expressed in this article are solely those of the authors and do not necessarily represent those of their affiliated organizations, or those of the publisher, the editors and the reviewers. Any product that may be evaluated in this article, or claim that may be made by its manufacturer, is not guaranteed or endorsed by the publisher.
References
Abdullah, F. M., Loke, M. H., Nawawi, M., and Abdullah, K. (2018). Assessing the reliability and performance of optimized and conventional resistivity arrays for shallow subsurface investigations. J. Appl. Geophys. 155, 155237–155245. doi:10.1016/j.jappgeo.2018.06.018
AL-Heety, A. J., Hassouneh, M., and Abdullah, F. M. (2021). Application of MASW and ERT methods for geotechnical site characterization: A case study for roads construction and infrastructure assessment in abu dhabi, uae. J. Appl. Geophys. 193104408, 104408. doi:10.1016/j.jappgeo.2021.104408
Allen, C. R., Zhuoli, L., Hong, Q., Xueze, W., Huawei, Z., and Weishi, H. (1991). Field study of a highly active fault zone: The Xianshuihe fault of southwestern China. Geol. Soc. Am. Bull. 103 (9), 1178–1199. doi:10.1130/0016-7606(1991)103<1178:fsoaha>2.3.co;2
Allen, P. A. (2017).Cambridge, UK Sediment routing systems: The fate of sediment from source to sink. Cambridge University Press.
Anbazhagan, P., and Sitharam, T. G. (2008). Mapping of average shear wave velocity for Bangalore region: A case study. J. Environ. Eng. Geophys. 13 (2), 69–84. doi:10.2113/jeeg13.2.69
Auken, E., Pellerin, L., Christensen, N. B., and Sørensen, K. (2006). A survey of current trends in near-surface electrical and electromagnetic methods. Geophysics 71, G249–G260. doi:10.1190/1.2335575
Bedair, S., Abdel-Raouf, O., and Meneisy, A. M. (2021). Combined GPR, DC resistivity, and hydrogeochemical data for hydrogeological exploration: A case study at the red sea coast. Arab. J. Geosci. 14 (8), 727–815. doi:10.1007/s12517-021-07039-w
Bensen, G. D., Ritzwoller, M. H., Barmin, M. P., Levshin, A. L., Lin, F., Moschetti, M. P., et al. (2007). Processing seismic ambient noise data to obtain reliable broad-band surface wave dispersion measurements. Geophys. J. Int. 169 (3), 1239–1260. doi:10.1111/j.1365-246x.2007.03374.x
Cardarelli, E., Cercato, M., De Donno, G., and Di Filippo, G. (2013). Detection and imaging of piping sinkholes by integrated geophysical methods. Near Surf. Geophys. 12 (3), 439–450. doi:10.3997/1873-0604.2013051
Colangelo, G., Lapenna, V., Loperte, A., Perrone, A., and Telesca, L. (2008). 2D electrical resistivity tomographies for investigating recent activation landslides in Basilicata Region (Southern Italy). Ann. Geophys. 51 (1), 275–285.
Dahlin, T. (2001). The development of DC resistivity imaging techniques. Comput. Geosciences 27 (9), 1019–1029. doi:10.1016/s0098-3004(00)00160-6
Duc, D. M. (2013). Rainfall-triggered large landslides on 15 december 2005 in van canh district, binh dinh province, vietnam. Landslides 10 (2), 219–230. doi:10.1007/s10346-012-0362-4
Falae, P. O., Kanungo, D. P., Chauhan, P. K. S., and Dash, R. K. (2019). Electrical resistivity tomography (ERT) based subsurface characterisation of Pakhi Landslide, Garhwal Himalayas, India. Environ. Earth Sci. 78 (14), 430–518. doi:10.1007/s12665-019-8430-x
Foti, S. (2005).Vienna, Austria. Springer, 47–71.Surface wave testing for geotechnical characterization", Surface waves in geomechanics, direct inverse Model. soils rocks
Grandjean, G., Gourry, J., Sanchez, O., Bitri, A., and Garambois, S. (2011). Structural study of the Ballandaz landslide (French Alps) using geophysical imagery. J. Appl. Geophys. 75 (3), 531–542. doi:10.1016/j.jappgeo.2011.07.008
Hu, R., Ming, Z., and Cui, F. (2008). Analysis of basic characteristics and forming mechanism of Qingning landslide, Daxian, Sichuan Province, China. Earth Sci. Front. 15 (4), 250–257. doi:10.3321/j.issn:1005-2321.2008.04.030
Huntley, D., Bobrowsky, P., Hendry, M., Macciotta, R., Elwood, D., Sattler, K., et al. (2019). Application of multi-dimensional electrical resistivity tomography datasets to investigate a very slow-moving landslide near Ashcroft, British Columbia, Canada. Landslides 16 (5), 1033–1042. doi:10.1007/s10346-019-01147-1
Hussain, Y., Hussain, S. M., Martino, S., Cardenas-Soto, M., Hamza, O., Rodriguez-Rebolledo, J. F., et al. (2019). Typological analysis of slidequakes emitted from landslides: Experiments on an expander body pile and sobradinho landslide (brasilia, Brazil). Rem. Int. Eng. J. 72, 72453–72460. doi:10.1590/0370-44672018720110
Jabro, J. D. (1992). Estimation of saturated hydraulic conductivity of soils from particle size distribution and bulk density data. Trans. ASAE 35 (2), 557–560. doi:10.13031/2013.28633
Jongmans, D., and Garambois, S. (2007). Geophysical investigation of landslides: A review. Bull. Société géologique Fr. 178 (2), 101–112. doi:10.2113/gssgfbull.178.2.101
Khalil, A. E., Nawawi, M., Arifin, M. H., Abdullah, F. M., Kayode, J. S., Usman, N., et al. (2017). Soil investigation at wet world hot spring complex for future development using active multichannel analysis of surface waves. Sains Malays. 46 (4), 537–543. doi:10.17576/jsm-2017-4604-04
Largo, D., Hidalgo, C., and Olarte, J. (2021). Bristol, UK“Comparison of invasive and non-invasive methods in site response, case study: Soil deposits of La estrella, IOP conference series: Earth and environmental science (IOP Publishing), 012119.
Li, T. L., Zhao, J. L., and Li, P. (2003). Analysis on the characteristics and stability of the No. 2 landslide of 102 landslide group on Sichuan-Tibet Highway. J. Catastrophol 18 (4), 40–45.
Lima Júnior, S. B., Prado, R. L., and Mendes, R. M. (2012). Brazil.Application of multichannel analysis of surface waves method (MASW) in an area susceptible to landslide at Ubatuba City, Revista Brasileira de Geografia.
Liu, Z., Qiu, H., Zhu, Y., Liu, Y., Yang, D., Ma, S., et al. (2022). Efficient identification and monitoring of landslides by time-series InSAR combining single-and multi-look phases. Remote Sens. 14 (4), 1026. doi:10.3390/rs14041026
Loke, M. H. (1996).TheNetherlands “Least-squares inversion of large 3D resistivity data sets using auxiliary storage,” in 58th EAGE conference and exhibition (European Association of Geoscientists & Engineers), 48–00591.
Loke, M. H., Wilkinson, P. B., and Chambers, J. E. (2015).TheNetherlands “Rapid inversion of data from 2-D and from 3-D resistivity surveys with shifted electrodes, Near surface geoscience 2015-21st European meeting of environmental and engineering geophysics (European Association of Geoscientists & Engineers), 1–5.
Marciniak, A., Kowalczyk, S., Gontar, T., Owoc, B., Nawrot, A., Luks, B., et al. (2021). Integrated geophysical imaging of a mountain landslide–a case study from the Outer Carpathians, Poland. J. Appl. Geophys. 191104364, 104364. doi:10.1016/j.jappgeo.2021.104364
Mccann, D. M., and Forster, A. (1990). Reconnaissance geophysical methods in landslide investigations. Eng. Geol. 29 (1), 59–78. doi:10.1016/0013-7952(90)90082-c
Mekonnen, A. A., Raghuvanshi, T. K., Suryabhagavan, K. V., and Kassawmar, T.Gis-based landslide susceptibility zonation and risk assessment in complex landscape, A Case Beshilo Watershed, North. Ethiop., 100586, 8,2022
Papadimitriou, E., Wen, X., Karakostas, V., and Jin, X. (2004). Earthquake triggering along the Xianshuihe fault zone of Western Sichuan, China. Pure Appl. Geophys. 161 (8), 1683–1707. doi:10.1007/s00024-003-2471-4
Park, C. B., Miller, R. D., and Xia, J. (1999). Multichannel analysis of surface waves. Geophysics 64 (3), 800–808. doi:10.1190/1.1444590
Petley &, D. (2012). Global patterns of loss of life from landslides. Geology 40 (10), 927–930. doi:10.1130/g33217.1
Popescu, M., Serban, R., Urdea, P., and Onaca, A. L. (2016). Conventional geophysical surveys for landslide investigations: Two case studies from Romania. Carpathian J. earth Environ. Sci. 11 (1), 281–292.
Qiu, H., Zhu, Y., Zhou, W., Sun, H., He, J., and Liu, Z. (2022). Influence of DEM resolution on landslide simulation performance based on the Scoops3D model. Geomatics, Nat. Hazards Risk 13 (1), 1663–1681. doi:10.1080/19475705.2022.2097451
Rahimi, S., Wood, C. M., Coker, F., Moody, T., Bernhardt-Barry, M., and Kouchaki, B. M. (2018). The combined use of MASW and resistivity surveys for levee assessment: A case study of the melvin price reach of the wood river levee. Eng. Geol. 241, 24111–24124. doi:10.1016/j.enggeo.2018.05.009
Ritzwoller, M. H., Yang, Y., and Pasyanos, M. E. (2008).Boulder, CO, USA Short-period surface-wave dispersion from ambient noise tomography in western China. Colorado univ at boulder.
Sass, O., Bell, R., and Glade, T. (2008). Comparison of GPR, 2D-resistivity and traditional techniques for the subsurface exploration of the Öschingen landslide, Swabian Alb (Germany). Geomorphology 93 (1-2), 89–103. doi:10.1016/j.geomorph.2006.12.019
Schrott, L., and Sass, O. (2008). Application of field geophysics in geomorphology: Advances and limitations exemplified by case studies. Geomorphology 93 (1-2), 55–73. doi:10.1016/j.geomorph.2006.12.024
Sharma, B., and Bora, P. K. (2003). Plastic limit, liquid limit and undrained shear strength of soil-reappraisal. J. Geotech. Geoenviron. Eng. 129 (8), 774–777. doi:10.1061/(asce)1090-0241(2003)129:8(774)
Tang, C., Shi, B., and Zhao, L. (2010). Interfacial shear strength of fiber reinforced soil. Geotext. Geomembranes 28 (1), 54–62. doi:10.1016/j.geotexmem.2009.10.001
Tsai, W., Chen, C., Chiang, C., Chen, P., Kuo, C., Wang, K., et al. (2021). Electrical resistivity tomography (ERT) monitoring for landslides: Case study in the lantai area, yilan taiping mountain, northeast taiwan. Front. Earth Sci. (Lausanne). 929. doi:10.3389/feart.2021.737271
Wang, B., Wang, J., Tian, G., Shi, Z., and Zhao, W. (2021). Three-dimensional high-density resistivity measurement method based on electrode random distribution and exploration system.WO/2019/200905.
Wang, L., Qiu, H., Zhou, W., Zhu, Y., Liu, Z., Ma, S., et al. (2022). The post-failure spatiotemporal deformation of certain translational landslides may follow the pre-failure pattern. Remote Sens. 14 (10), 2333. doi:10.3390/rs14102333
Xia, J., Miller, R. D., Park, C. B., Ivanov, J., Tian, G., and Chen, C. (2004). Utilization of high-frequency Rayleigh waves in near-surface geophysics. Lead. Edge 23 (8), 753–759. doi:10.1190/1.1786895
Yin, Y., Zheng, W., Liu, Y., Zhang, J., and Li, X. (2010). Integration of GPS with InSAR to monitoring of the jiaju landslide in sichuan, China. Landslides 7 (3), 359–365. doi:10.1007/s10346-010-0225-9
Yueping, Y., Chuanzheng, L., Hongqi, C., Jian, R., and Chuanbing, Z. (2013). Investigation on catastrophic landslide of january 11, 2013 at zhaojiagou, zhenxiong county, yunnan province. J. Eng. Mater. 21 (1), 6–15.
Keywords: ERT, MASW, landslide, subsurface structure, integrated geophysics
Citation: Zhang G, Tu F, Tang Y, Chen X, Xie K and Dai S (2023) Application of geophysical prospecting methods ERT and MASW in the landslide of Daofu County, China. Front. Earth Sci. 10:1054394. doi: 10.3389/feart.2022.1054394
Received: 26 September 2022; Accepted: 31 October 2022;
Published: 13 January 2023.
Edited by:
Haijun Qiu, Northwest University, ChinaReviewed by:
Li Jun, Chengdu University of Technology, ChinaHui Wang, China University of Mining and Technology, China
Copyright © 2023 Zhang, Tu, Tang, Chen, Xie and Dai. This is an open-access article distributed under the terms of the Creative Commons Attribution License (CC BY). The use, distribution or reproduction in other forums is permitted, provided the original author(s) and the copyright owner(s) are credited and that the original publication in this journal is cited, in accordance with accepted academic practice. No use, distribution or reproduction is permitted which does not comply with these terms.
*Correspondence: Gang Zhang, emdAc3d1c3QuZWR1LmNu; Xingchang Chen, bXlnZW90ZWNoQDEyNi5jb20=