 Haihua Gu
 Yu Lei
95% of researchers rate our articles as excellent or good
Learn more about the work of our research integrity team to safeguard the quality of each article we publish.
Find out more
ORIGINAL RESEARCH article
Front. Earth Sci. , 12 January 2023
Sec. Geohazards and Georisks
Volume 10 - 2022 | https://doi.org/10.3389/feart.2022.1053461
This article is part of the Research Topic Monitoring, Early Warning and Mitigation of Natural and Engineered Slopes – Volume II View all 17 articles
Flash floods cause damage to engineering structures and buildings mainly due to their huge impact force. Scientific investigation of the impact process of flash floods has significant theoretical and engineering implications in ensuring the safety of flood-resistant structures and human life. In this experimental study, the impact pressure and flow velocity in the flow field were measured synchronously using the impact detection system and a particle image velocimetry system in a water channel and the effects of the turbulence structure on the impact process of flash flood were investigated. As shown by the experimental measurements, the large-scale coherent structure in the flow field reached six times the boundary layer thickness. The turbulence and impact force energy spectra were very similar in the low-frequency, large-scale wave band, indicating that the large-scale turbulence structure dominated the impact process. Both the mean and maximum impact pressures increased with the turbulence kinetic energy. An equation for impact force characterization that considers the effects of turbulence and thus was more accurate was given, providing a theoretical basis for the protection of engineering structures from the damage by flash floods.
Because of the complex natural environment, the frequency, intensity, and range of influence of disasters in the word have increased. These disasters include landslides, debris flows, flash floods and so on (Cui, 1999; Yang et al., 2015; Lei et al., 2018; Liu et al., 2022; Qiu et al., 2022; Wang et al., 2022). In the mountainous regions, the flash flood disasters are attracting a great deal of attention throughout the world (Zhang et al., 2019; Bazai et al., 2022). Flash floods are characterized by sporadic events, high flow velocity, strong transport capacity, with wide impacts and great destructive potential (Yang et al., 2015). Mountains account for approximately more than two thirds of China’s territory, with rapid economic development and increasing anthropogenic activities, the occurrence of flash floods is rising in these areas. The flash floods have caused severe damage to railway bridges, buildings, and other engineering structures in these areas. For example, the Sichuan-Tibet Railway, the Sichuan-Tibet Road, the China-Pakistan Economic Corridor, and other major engineering projects have been impacted by flash flood disasters at different degrees.
Flash flood disaster is also a common problem facing the world’s countries and has received extensive attention from researchers (Yanmaz and Altinbilek, 1991; Kobayashi et al., 1988; Cui, 1999; Veerappadevaru et al., 2012; Lei et al., 2018). Field experiments, flume experiments and numerical methods have been carried out to detect the impact force of flash flood (Zanuttigh and Lamberti, 2006; Hu et al., 2011; Cui et al., 2015). At the macroscopic level, previous studies focused on the physical, destructive, and spatiotemporal characteristics, cause of formation, and early warning of flash flood disasters, providing scientific guidance on disaster prevention and mitigation.
On the other hand, there are many opportunities to observe turbulent flows in our surroundings, such as the flash flood or debris flow, or a strong wind. An important characteristic of turbulence is its ability to transport and mix fluid more effectively than a laminae flow, which were first demonstrated by the famous Reynolds’ experiment by Osborne Reynolds (Reynolds, 1883). Since then, more and more researchers began to study the physical mechanism of turbulence aimed to developing tractable mathematical models that can accurately predict properties of turbulent flows, such as energy cascade and Kolmogorov hypotheses (Richardson, 1922; Kolmogorov, 1941). Moreover, an important focus of research on turbulence was inspired by the observation of coherent structures in turbulent boundary layers (Theodorsen, 1952; Kline et al., 1967; Townsend, 1976). Smits et al. (2011) identify four principal characteristic elements of turbulent structure: near-wall streaks, hairpin or horseshoe vortices, large-scale motions (LSMs) and very-large-scale motions (LSMs) (Theodorsen 1952; Kline et al., 1967; Kim and Adrian 1999; Wang and Zheng, 2016; Gu et al., 2019; Wang et al., 2020). Notably, the coherent structures have been evidenced in wall-bounded flows and demonstrated to play a crucial role in the turbulent kinetic energy (TKE), the momentum flux and the mass transport process (Baas and Sherman, 2005; Balakumar and Adrian, 2007; Dupont et al., 2013; Zheng et al., 2013; Wang et al., 2017). The studies on the coherent structures give an in-depth understanding of the flow phenomena and physical mechanisms in wall-bounded flows. Moreover, studies on large-scale turbulence structures have provided new approaches and perspectives to the examination of the impact process of flash floods.
However, the following aspects of the impart process of flash floods have remained unclear. The effects of the coherent turbulent structures on the impact process (whether the impact force is directly correlated with the coherent turbulent structure, and the quantitative effects of the turbulence characteristics on the impact force). In this experimental study, the turbulence characteristics of flash flood and the inherent physical mechanisms of the impact force were investigated, and an equational characterization of the impact force that considered the turbulence characteristics was established, with the aim of providing theoretical criteria for disaster prevention and mitigation engineering.
The experimental setup consisted of a water channel measuring 4 m (length) × 0.2 m (width) × 0.4 m (height), its slope was set to 7° or 13° (a schematic diagram of the flume is shown in Figure 1). A material supply tank with a maximum volume of 1.3 m3 was configured on top of the channel. A valve was configured at the water inlet to control the depth of flow in the channel. The flow velocity at the middle section of the channel (2 m from the water inlet) was measured using particle image velocimetry (PIV). Impact pressure sensors were configured at the end of the PIV measurement section to avoid interfering with the flow field, thereby enabling synchronous measurement of the flow field and impact force.
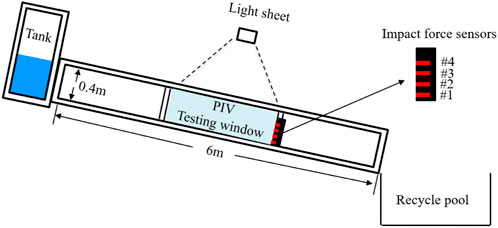
FIGURE 1. Schematic diagram of the experimental setup.
Turbulence intensity (TI) describes the rate at which the flow velocity varies with time and reflects the relative intensity of the velocity fluctuation. Turbulence intensity is defined as the ratio of the standard deviation of flow velocity (root mean square of fluctuating velocity) to the mean velocity (U). During the experiment, the turbulence intensity was varied by using grilles of two different grille blocking rate (30% and 50%) (just as show in Figure 2).
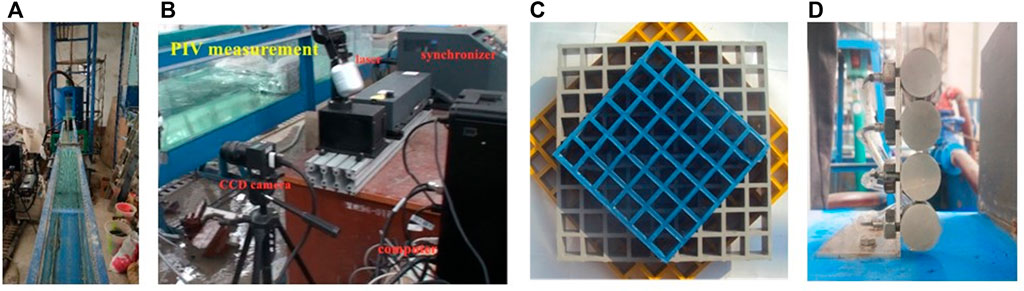
FIGURE 2. Experiment setups: (A) the flume; (B) PIV measurement; (C) grilles; (D) impact force sensor.
Two major parameters of the impact process of flash flood, flow velocity and impact force in the flow field, were measured using a high-speed PIV system and impact force sensors, respectively. The PIV system was used to record the flow morphology of flash floods and analyze their flow characteristics such as flow velocity, depth of flow, turbulence intensity, and the scale of coherent turbulent structure. The PIV system mainly consisted with: CCD, laser emitter, synchronizerand a computer. The glass spheres with a medium diameter of 10 μm and a density of 1.05 gcm−3 were used as tracer particles during our experiment. The impact force sensor was of piezoresistive type and had a measurement range of 0–200 kPa. The diameter of the sensor was 20 mm and the precision of sensor was 0.02%. The data collection system had a sampling frequency of 1,000 Hz in this study. Four sensors were installed at four different heights (1.5, 4.5, 7.5, and 10.5 cm) from the bottom of the water channel and were referred to as sensors #1–#4, respectively (just as show in Figure 1). The impact force sensors were connected to the data collection system, which was then connected to the computer. Prior to the start of the experiment, the computer times of the PIV system and the impact force measurement system were synchronized, thereby realizing synchronized measurement of the flow field and impact force.
A total of 18 experiments were performed. Table 1 shows the major parameters for each of the experiments. Each experiment was repeated three times to minimize experimental error. The mean velocity with the flume slope of 7° (for all 9 Set experiments) was calculated at 4.67 m/s and the corresponding standard deviation was 0.15 m/s. When the flume slope of 13°, the mean velocity was calculated at 4.89 m/s and the corresponding standard deviation was 0.10 m/s, which is litter bigger than the velocity with the flume slope of 7°.
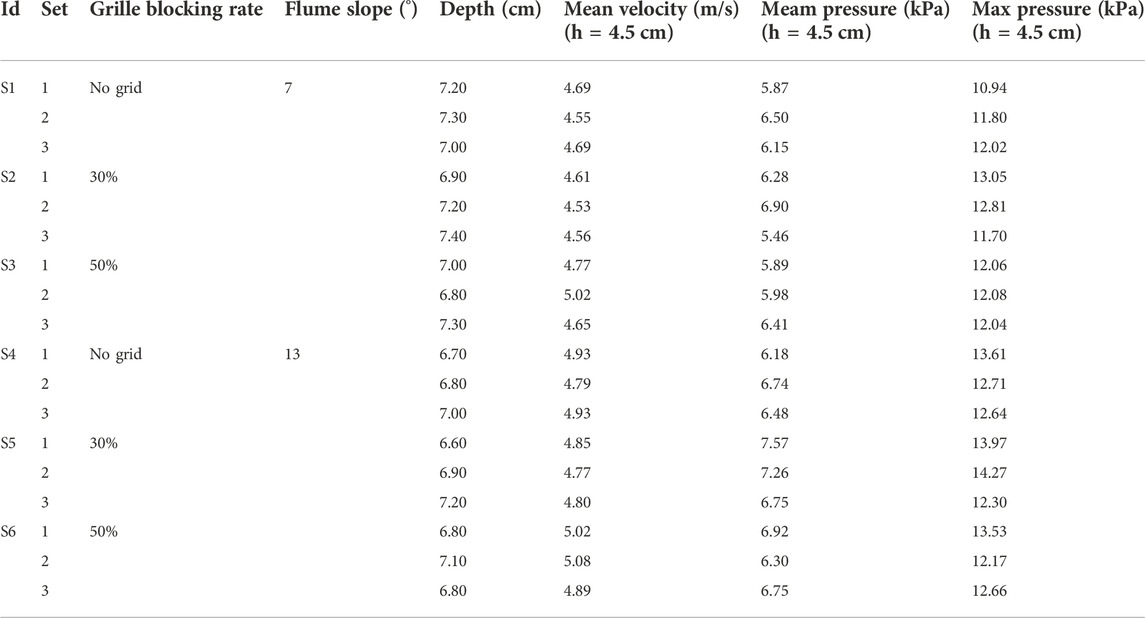
TABLE 1. List of work conditions and main parameters of the measurement.
The black line in Figure 3 shows the original impact pressure signal fluctuations obtained from experiment s1-2 (h = 4.5 cm). The maximum impact pressure was 11.80 kPa. The blue line in this figure shows the streamwise velocity fluctuations from PIV measurement. From Figure 3, the streamwise velocity (blue line) has an obviously decreasing trend during this time period (as shown by the red rectangle in Figure 3). The envelopes defined by the local maxima and local minima of impact pressure (black line) also have a decreasing trend although it is not obviously. This phenomenon may be caused by the pressure signal fluctuations cannot respond as quickly as the velocity signal fluctuations. In general, from a comparison with the streamwise velocity fluctuations of the flow obtained by the PIV system, the impact pressure signal fluctuations were correlated with the streamwise velocity fluctuation.
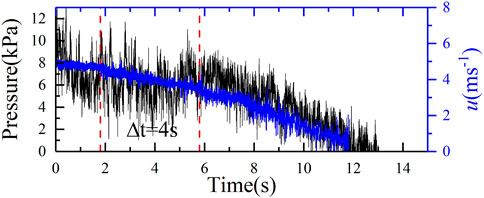
FIGURE 3. The streamwise velocity fluctuations from PIV measurement (blue line) and the impact force signal fluctuations from pressure sensor (black line) at 0.45 cm of s1-2.
The subsequent analyses mainly focused on the mechanisms underlying the effects of the turbulence structure on the impact force. Such analyses require stable data. However, the streamwise velocity and impact pressure signals obtained from the experiments showed an evidently decreasing trend which were not suitable for our analyses. Therefore, to facilitate subsequent spectral analysis, some specific selection and pretreatment should be performed on the flow velocity fluctuation and impact pressure signals. Figure 4 shows an illustration of the treatment process (the streamwise velocity fluctuations at 0.45 cm of s1-2 for example). First, the impact pressure signals and velocity fluctuation were divided into 4-s segments (as shown by the red rectangle in Figure 3). Then, each segment of velocity fluctuation and impact force signal fluctuations was subjected to linear fitting, thereby obtaining the linearly fit trend of each segment of data (as shown by the red solid line in Figure 4). Finally, the trend component of the signals was subtracted from the original raw data, thereby obtaining the de-trended fluctuations in the impact pressure and velocity, the grey line in Figure 4.

FIGURE 4. The de-trending process, the black line is the raw streamwise velocity fluctuations at 0.45 cm of s1-2, the red line is the linearly fit trend signal and the grey line is the de-trended signal.
Experimental and numerical studies have shown that a turbulence structure induces continuous losses in the streamwise velocity, resulting in the streamwise velocity in the structural space being lower than the mean horizontal convection velocity. For example, Hutchins and Marusic (2007) used streamwise velocity contours to represent turbulence structures and found the existence of a meandering morphology of the large-scale structure. Different from the method of Hutchins and Marusic (2007) of using the horizontal contours of streamwise velocity for flow visualization (x-y plane), the vertical contours of streamwise velocity were used for flow visualization in this experimental study. In this way, the vertical scale variations and streamwise motions of the large-scale turbulence structure were revealed in a more straightforward manner (x-z plane). The temporal scale of the flow was converted to the streamwise length according to Taylor’s frozen turbulence hypothesis. Figure 5 shows the streamwise velocity contours obtained from experiment of s1-2, where the blue areas indicate velocity losses. From the velocity losses shown in Figure 5, there existed turbulent motions with a large streamwise length (approximately 0.23 m) in the flow field. The scale reached three times the thickness of the boundary layer (approximately 0.07 m, just as show in Table 1) and exhibited a trend of increasing with the height, which is consistent with previous studies.
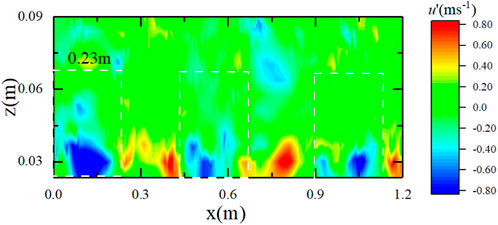
FIGURE 5. The contours of the streamwise velocity fluctuations of s1-2.
From the streamwise velocity contours in Figure 5, we have confirmed the existence of large-scale turbulence structure in our experiment. We will analyse whether the impact force is directly correlated with the coherent turbulent structure. To clarify that the time scales and energy fractions between the streamwise velocity and the impart force, we obtained their normalized energy spectra using the wavelet transform method (Baas, 2006; Tang et al., 2013; Zheng et al., 2013; Gu et al., 2019). We used the basis functions of the Daubechies wavelet in this study. In order to reveal the relation between the flow filed and the impart force, the normalized energy spectra of the streamwise velocity u and the impart force p measured at 0.45 cm of s1-2 are compared in Figure 6A. Figure 6A clearly shows that the energy-containing turbulence structure in the flow field obtained from this experiment had a frequency of 10 Hz. As the mean flow velocity was 4.7 m/s for experiment of s1-2, the spatial scale of the large-scale structure was 0.47 m based on Taylor’s frozen turbulence hypothesis, which was equal to six times the boundary layer thickness (approximately 0.07 m). In addition, the impact pressure spectrum not only exhibited a distribution pattern similar to that of the flow velocity spectrum but also peaked at 10 Hz, indicating that the impact force fluctuation is actually a manifestation of and is highly consistent with the flow field fluctuation.
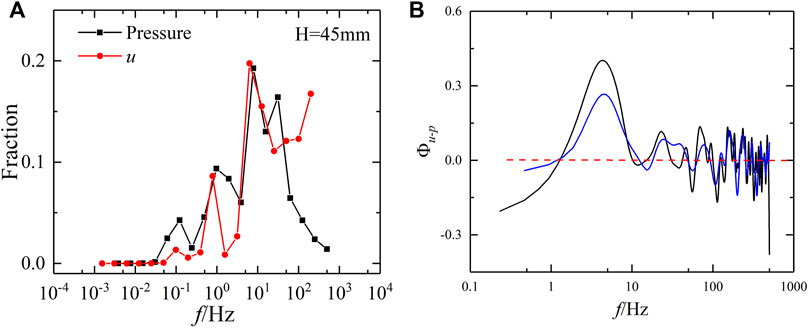
FIGURE 6. (A) The normalized energy spectra of the streamwise velocity u and the impart force p measured at 0.45 cm of s1-2. (B) The co-spectra for the streamwise velocity perturbations u and impart force p measured at 0.45 cm of s1-2.
To identify the frequency (scale) at which the flow field fluctuation is more significantly correlated with the impact pressure, a cross-spectral analysis of the flow velocity and impact pressure was performed (Figure 6B). As discussed above, the recurrent large-scale structure have a character frequency of 1–10 Hz and have a substantial contribution to the impart force as shown in Figure 6B. This also indicates that the large-scale coherent structure dominated the impact process.
The addition of a grille (with a perforation ratio of 30% or 50%) can change the turbulence intensity in the flow field, but not change the mean velocity at the same experiment condition. Figure 7A shows the variations in the impact pressure (maximum and mean impact pressures) with the flow velocity obtained from the experiments. The mean flow velocities under several sets of experimental conditions were all approximately 4.6 m/s, and the correlation between the impact pressure (maximum and mean impact pressures) and the mean flow velocity was nonsignificant. Figure 7B shows the variations in the impact pressure (maximum and mean impact pressures) with the normalized turbulence intensity. Both the maximum and mean impact pressures increased with the turbulence intensity. Therefore, turbulence intensity-induced impact pressure variations are nonnegligible to the investigation of impact pressure.
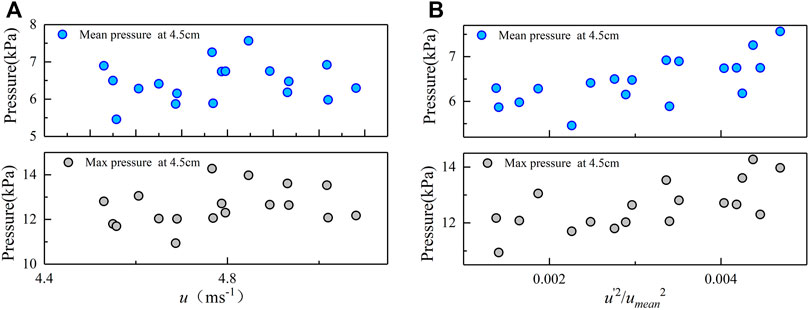
FIGURE 7. (A) Variations in the mean impact pressure and max impact pressure with the streamwise velocity; (B) Variations in the mean impact pressure and max impact pressure with the normalized turbulent intensity.
For the impact process of flash flood, the impact pressure of the liquid-phase slurry can be calculated using Eq. 1:
The coefficient
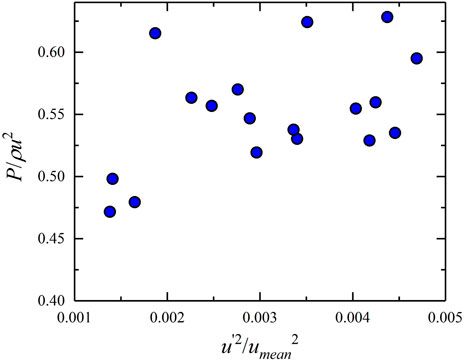
FIGURE 8. Variations in the
The coefficient
Based on the spectral and cross-spectral analyses of the large-scale turbulence structure and impact pressure in the flow field, the cause of this phenomenon possibly lies in the large-scale structure. The meandering large-scale structure controlled the transport of kinetic energy and momentum. On the other hand, the inclination angle of the large-scale turbulence structure, which is believed to be a pathway for mass and momentum transport (Cheng et al., 2011; Dupont et al., 2013). The phenomenon of large-scale structures inclined at a shallow angle away from the wall is originally studied by Kovasznay et al. (1970). Studies also have found that the inclination angle decreases near linearly with the streamwise velocity gradient (Liu et al., 2017). Thus, the inclination angle of the large-scale turbulence structure is smaller at high turbulence intensities than low turbulence intensities in our experiment. This possibly resulted in the local maximum impact pressure being larger than the dynamic pressure of the fluid, thereby causing the phenomenon found in this experimental study.
This study conducts the synchronous measurements on the impact pressure and flow velocity in the flow field, aims to reveal the relation between the flow filed and the impart force of flash floods. Analysis on the measured data show that:
1) The existence of large-scale turbulence structure in flash flood from the streamwise velocity contours and the large-scale coherent structure in the flow field can reach up to six times the boundary layer thickness. Moreover, the turbulence and impact force energy spectra were very similar, indicating that the large-scale turbulence structure dominated the impact process.
2) The correlation between the impact pressure (maximum and mean impact pressures) and the mean flow velocity was nonsignificant. But the mean and maximum impact pressures increased with the turbulence kinetic energy. The cause of this phenomenon possibly lies in the large-scale structure. Therefore, the turbulence effect must be considered when assessing the vulnerability of a group of buildings. An equation for impact force characterization that considers the effects of turbulence and thus was more accurate was also given, providing a theoretical basis for the protection of engineering structures from the damage by flash floods.
The original contributions presented in the study are included in the article/Supplementary Material, further inquiries can be directed to the corresponding author.
HG carried out the experimental investigation, data analysis, and manuscript writing. YL was involved in writing reviewing, manuscript editing, and supervision. All the authors participated and contributed to the final manuscript.
This work was supported by the Second Tibetan Plateau Scientific Expedition and Research Program (STEP) (Grant No.2019QZKK0903); The National Natural Science Foundation of China (Grant No. 41790433); The Sichuan Science and Technology Program (2021YFH0009) and the Chinese Academy of Sciences President’s International Fellowship Initiative (2020FYC0004).
The authors declare that the research was conducted in the absence of any commercial or financial relationships that could be construed as a potential conflict of interest.
All claims expressed in this article are solely those of the authors and do not necessarily represent those of their affiliated organizations, or those of the publisher, the editors and the reviewers. Any product that may be evaluated in this article, or claim that may be made by its manufacturer, is not guaranteed or endorsed by the publisher.
Baas, A. C. W., and Sherman, D. J. (2005). Formation and behavior of aeolian streamers. J. Geophys. Res. 110 (F3), F03011. doi:10.1029/2004jf000270
Baas, A. C. (2006). Wavelet power spectra of aeolian sand transport by boundary layer turbulence. Geophys. Res. Lett. 33 (5), L05403. doi:10.1029/2005gl025547
Balakumar, B. J., and Adrian, R. J. (2007). Large-and very-large-scale motions in channel and boundary-layer flows. Phil. Trans. R. Soc. A 365 (1852), 665–681. doi:10.1098/rsta.2006.1940
Bazai, N. A., Cui, P., Zhou, K. J., Abdul, S., Cui, K. F., Wang, H., et al. (2022). Application of the soil conservation service model in small and medium basins of the mountainous region of Heilongjiang, China. Int. J. Environ. Sci. Technol. (Tehran). 19 (1), 433–448. doi:10.1007/s13762-021-03136-1
Cheng, X., Zeng, Q. C., and Hu, F. (2011). Characteristics of gusty wind disturbances and turbulent fluctuations in windy atmospheric boundary layer behind cold fronts. J. Geophys. Res. 116 (D6), D06101. doi:10.1029/2010jd015081
Cui, P., Zeng, C., and Lei, Y. (2015). Experimental analysis on the impact force of viscous debris flow. Earth Surf. Process. Landf. 40 (12), 1644–1655. doi:10.1002/esp.3744
Cui, P. (1999). Impact of debris flow on river cannel in the upper reaches of the yangtse river. Intern. J. Sediment Res. 14, 201–203.
Dupont, S., Bergametti, G., Marticorena, B., and Simoëns, S. (2013). Modeling saltation intermittency. J. Geophys. Res. Atmos. 118 (13), 7109–7128. doi:10.1002/jgrd.50528
Gu, H., Wang, G., Zhu, W., and Zheng, X. (2019). Gusty wind disturbances and large-scale turbulent structures in the neutral atmospheric surface layer. Sci. China Phys. Mech. Astron. 62 (11), 114711–114717. doi:10.1007/s11433-019-9398-5
Hu, K., Wei, F., and Li, Y. (2011). Real-time measurement and preliminary analysis of debris-flow impact force at Jiangjia Ravine, China. Earth Surf. Process. Landf. 36 (9), 1268–1278. doi:10.1002/esp.2155
Hutchins, N., and Marusic, I. (2007). Large-scale influences in near-wall turbulence. Phil. Trans. R. Soc. A 365 (1852), 647–664. doi:10.1098/rsta.2006.1942
Kim, K. C., and Adrian, R. J. (1999). Very large-scale motion in the outer layer. Phys. Fluids 11 (2), 417–422. doi:10.1063/1.869889
Kline, S. J., Reynolds, W. C., Schraub, F. A., and Runstadler, P. W. (1967). The structure of turbulent boundary layers. J. Fluid Mech. 30 (4), 741–773. doi:10.1017/s0022112067001740
Kobayashi, H., Masutani, S. M., Azuhata, S., Arashi, N., and Nishinuma, Y. (1988). Dispersed phase transport in a plane mixing layer. Transp. Phenom. Turbul. Flows Theory, Exp. Numer. Simul. 34, 433–446.
Kolmogorov, A. N. (1941). Dissipation of energy in locally isotropic turbulence in an incompressible viscous liquid. Dokl. Akad. Nauk. SSSR 30, 299–303.
Kovasznay, L. S., Kibens, V., and Blackwelder, R. F. (1970). Large-scale motion in the intermittent region of a turbulent boundary layer. J. Fluid Mech. 41 (2), 283–325. doi:10.1017/s0022112070000629
Lei, Y., Cui, P., Zeng, C., and Guo, Y. (2018). An empirical mode decomposition-based signal process method for two-phase debris flow impact. Landslides 15 (2), 297–307. doi:10.1007/s10346-017-0864-1
Liu, H. Y., Bo, T. L., and Liang, Y. R. (2017). The variation of large-scale structure inclination angles in high Reynolds number atmospheric surface layers. Phys. Fluids 29 (3), 035104. doi:10.1063/1.4978803
Liu, Z., Qiu, H., Zhu, Y., Liu, Y., Yang, D., Ma, S., et al. (2022). Efficient identification and monitoring of landslides by time-series InSAR combining single-and multi-look phases. Remote Sens. 14 (4), 1026. doi:10.3390/rs14041026
Qiu, H., Zhu, Y., Zhou, W., Sun, H., He, J., and Liu, Z. (2022). Influence of DEM resolution on landslide simulation performance based on the Scoops3D model. Geomatics. Nat. Hazards Risk 13 (1), 1663–1681. doi:10.1080/19475705.2022.2097451
Reynolds, O. (1883). XXIX. An experimental investigation of the circumstances which determine whether the motion of water shall be direct or sinuous, and of the law of resistance in parallel channels. Philos. Trans. R. Soc. Lond. 174, 935–982.
Smits, A. J., McKeon, B. J., and Marusic, I. (2011). High–Reynolds number wall turbulence. Annu. Rev. Fluid Mech. 43, 353–375. doi:10.1146/annurev-fluid-122109-160753
Tang, J. B., Hu, K. H., Zhou, G. D., Chen, H. Y., Zhu, X. H., and Ma, C. (2013). Debris flow impact pressure signal processing by Wavelet Analysis. J. Sichuan Univ. Eng. Sci. Ed. 45 (1), 8–13. (in Chinese).
Theodorsen, T. (1952). “Mechanism of turbulence,” in Proceedings of the Second Midwestern Conference on Fluid Mechanics, 1952, Columbus, Ohio, March 17-19, 1952, 1–19.
Townsend, A. A. (1976). The structure of turbulent shear flow. Cambridge, UK: Cambridge Univ. Press.
Veerappadevaru, G., Gangadharaiah, T., and Jagadeesh, T. R. (2012). Temporal variation of vortex scour process around caisson piers. J. Hydraul. Res. 50 (2), 200–207. doi:10.1080/00221686.2012.666832
Wang, G., and Zheng, X. (2016). Very large scale motions in the atmospheric surface layer: A field investigation. J. Fluid Mech. 802, 464–489. doi:10.1017/jfm.2016.439
Wang, G., Zheng, X., and Tao, J. (2017). Very large scale motions and PM10 concentration in a high-Re boundary layer. Phys. Fluids 29 (6), 061701. doi:10.1063/1.4990087
Wang, G., Gu, H., and Zheng, X. (2020). Large scale structures of turbulent flows in the atmospheric surface layer with and without sand. Phys. Fluids 32 (10), 106604. doi:10.1063/5.0023126
Wang, L., Qiu, H., Zhou, W., Zhu, Y., Liu, Z., Ma, S., et al. (2022). The post-failure spatiotemporal deformation of certain translational landslides may follow the pre-failure pattern. Remote Sens. 14 (10), 2333. doi:10.3390/rs14102333
Yang, Y. C. E., Ray, P. A., Brown, C. M., Khalil, A. F., and Yu, W. H. (2015). Estimation of flood damage functions for river basin planning: A case study in Bangladesh. Nat. Hazards (Dordr). 75 (3), 2773–2791. doi:10.1007/s11069-014-1459-y
Yanmaz, A. M., and Altinbilek, H. D. G. A. (1991). Study of time-depenbent local scour around bridge piers. J. Hydraul. Eng. 117 (10), 1247–1268. doi:10.1061/(asce)0733-9429(1991)117:10(1247)
Zanuttigh, B., and Lamberti, A. (2006). Experimental analysis of the impact of dry avalanches on structures and implication for debris flows. J. Hydraulic Res. 44 (4), 522–534. doi:10.1080/00221686.2006.9521703
Zhang, G., Cui, P., Yin, Y., Liu, D., Jin, W., Wang, H., et al. (2019). Real-time monitoring and estimation of the discharge of flash floods in a steep mountain catchment. Hydrol. Process. 33 (25), 3195–3212. doi:10.1002/hyp.13551
Keywords: flash flood, impact force, coherent structure, experimental study, turbulence kinetic energy
Citation: Gu H and Lei Y (2023) Experimental investigation of the effects of the turbulence on the impact force of flash flood. Front. Earth Sci. 10:1053461. doi: 10.3389/feart.2022.1053461
Received: 25 September 2022; Accepted: 31 October 2022;
Published: 12 January 2023.
Edited by:
Haijun Qiu, Northwest University, ChinaCopyright © 2023 Gu and Lei. This is an open-access article distributed under the terms of the Creative Commons Attribution License (CC BY). The use, distribution or reproduction in other forums is permitted, provided the original author(s) and the copyright owner(s) are credited and that the original publication in this journal is cited, in accordance with accepted academic practice. No use, distribution or reproduction is permitted which does not comply with these terms.
*Correspondence: Yu Lei, bGVpeXVAaW1kZS5hYy5jbg==
Disclaimer: All claims expressed in this article are solely those of the authors and do not necessarily represent those of their affiliated organizations, or those of the publisher, the editors and the reviewers. Any product that may be evaluated in this article or claim that may be made by its manufacturer is not guaranteed or endorsed by the publisher.
Research integrity at Frontiers
Learn more about the work of our research integrity team to safeguard the quality of each article we publish.