 Li Yizhe
 Wang Huiliang
 Zhang Xin2
 Li Chenhao
 Tian Zihao
 Lv Xizhi
- 1Yellow River Laboratory, Zhengzhou University, Zhengzhou, China
- 2State Key Laboratory of Simulation and Regulation of Water Cycle in River Basin, China Institute of Water Resources and Hydropower Research, Beijing, China
- 3College of Resource Environment and Tourism, Capital Normal University, Beijing, China
- 4Key Laboratory of the Loess Plateau Soil Erosion and Water Loss Process and Control of Ministry of Water Resources, Yellow River Institute of Hydraulic Research, Zhengzhou, China
The variations in the reference evapotranspiration (ET0) are closely related to meteorological factors. The purpose of this study is to explore the relationships between the meteorological factors and the ET0. Based on meteorological data from 26 meteorological stations in the Yiluo River Basin (YLRB) and its surrounding areas from 1958 to 2020, in this study, the temporal and spatial variations and driving factors of the ET0 in the YLRB are investigated. The results are as follows. Spatially, the annual ET0 decreases from the northeast to the southwest in the YLRB. Temporally, the annual ET0 exhibits a fluctuating decreasing trend rather than a monotonic decreasing trend during the entire period. The trend of the ET0 contains two mutation points, in 1972 and 1994. Thus, the research period can be divided into three periods. It is concluded that the variations in the ET0 are the most sensitive to the relative humidity, but the driving factor that contributes the most to the variations in the ET0 is the wind speed. The driving factors are closely related to the rates of relative change of the meteorological factors.
1 Introduction
According to the high-quality development requirements of the Yellow River, the development of the YLRB has mainly focused on ecological protection. Evapotranspiration is an important component of water exchange in nature, a main link in the water cycle (Jiang et al., 2016; She et al., 2017; Yu et al., 2020), and an important indicator of ecological assessment. Evapotranspiration is also an important exchange channel in the global energy balance (Yin et al., 2010; Vadeboncoeur et al., 2018). The ET0 is affected by many meteorological factors, mainly including the temperature, relative humidity, sunshine duration, and wind speed (Allen et al., 1998). The ET0 changes as the meteorological factors change (Darshana et al., 2013). In the past few decades, the climate has been warming (Bian et al., 2020). Moreover, with the returning farmland to forests initiative, the vegetation coverage on the Loess Plateau has increased greatly (Li et al., 2016; Feng et al., 2016). With the increase in vegetation cover, the regional water cycle has also been indirectly or directly affected (Zhang et al., 2018; Lv et al., 2019; Yu et al., 2020).
In studies of the driving factors of ET0 changes, the main point is the impacts of the meteorological factors (Allen et al., 1998; Yin et al., 2010; Zhang et al., 2014; Wu et al., 2021). A range of methods are required to determine the driving factors. For time series, the Mann-Kendall (M-K) trend test (Han et al., 2018; Wang et al., 2019; Pour et al., 2020), Sen’s slope (Xu et al., 2015; Shi et al., 2017; Wu et al., 2021), and least square method (She et al., 2017; Bian et al., 2020; Xie et al., 2020) can be used to analyze the trend of the ET0. In addition, the M-K test (Pour et al., 2020), moving T-test (Yang et al., 2021), and Pettitt test (Shi et al., 2017) are the main methods for testing ET0 mutation points. The most common spatial interpolation methods are mostly Spline interpolation (Xu et al., 2015), inverse distance weight interpolation (IDW), and Kriging interpolation (Yu et al., 2020). Kriging interpolation has a better effect on spatial interpolation, but the data requirements are more complex. The methods of evaluating the contributions of meteorological factors to ET0 changes mainly include the differential method (She et al., 2017; Wu et al., 2021) and stepwise regression method (Yu et al., 2020). Furthermore, the main driving factors are determined by the contributions of the meteorological factors to the ET0 changes. According to the previous research, the ET0 changed from a decreasing trend to an increasing trend in 1990s in most parts of China (Yin et al., 2010; Han et al., 2018; Wang et al., 2019; Wang et al., 2019). The driving factor of ET0 change is wind speed in most regions (She et al., 2017; Chai et al., 2018; Wu et al., 2021). The driving factors of ET0 change vary spatially and temporally (Chai et al., 2018). In Bangladesh, the sunshine duration and wind speed were found to be the main driving factors of the ET0 reduction (Bian et al., 2020). However, in Malaysia, it was found that the ET0 exhibited an increasing trend, and the main driving factor was the minimum temperature (Pour et al., 2020).
Under the policies of returning farmland to forests and protecting natural forests, the forest area in the Yellow River Basin has steadily increased (Li et al., 2016). The YLRB is an important area in the middle reaches of the Yellow River Basin. The YLRB has been evaluated as an ecological civilization demonstration area. The variations in and driving factors of the ET0 after ecological construction were the focus of this study. In addition, the driving factors of the variations in the ET0 were assessed through the relative rates of change of the meteorological factors. The main goals of this study were to determine characteristics of the temporal and spatial variations in the ET0 and to analyze the driving factors of the variations in the ET0.
2 Data and methods
2.1 Study area
The Yiluo River is a tributary of the Yellow River, and it is located in the southeastern part of the Yellow River Basin. The YLRB mainly includes two rivers, the Luo River and the Yi River. The YLRB covers an area of 18462.96 square kilometers. As showed in Figure 1, the terrain of the YLRB is high in the southwest and low in the northeast. The altitude range is 92–2,587 m. The annual average precipitation is 647–845 mm in the basin. The upper reaches of the YLRB are humid areas, and the rest are semi-humid areas. The basin climate is continental monsoon.

FIGURE 1. Map of the study area.
The data used in this study were mainly meteorological data, land use data, and digital elevation model (DEM) data (Table 1). Daily data from 26 meteorological stations were obtained (Figure 1). Based on the daily meteorological data, the daily ET0 data were calculated by using the Penman-Monteith formula. Then, the monthly and annual scale ET0 data were accumulated by using daily ET0 data. The meteorological data included daily average temperature, wind speed, atmospheric pressure, average relative humidity, and sunshine duration from 1958 to 2020. The DEM data were used to analyze the topographic changes in the YLRB. The land use data were used to analyze the impact of the land use change on the ET0. The spatial distribution of the daily ET0 was obtained by using IDW spatial interpolation method.
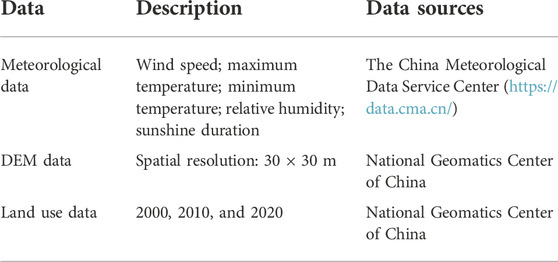
TABLE 1. The sources and description of data.
2.2 Penman-Monteith formula.
The ET0 is the amount of evaporation from a reference surface when it is sufficiently wet. The ET0 was calculated using the Penman-Monteith formula recommended by the Food and Agriculture Organization of the United Nations (FAO) (Allen et al., 1998). The background of this method is an ideal grass cropland (crop height = 0.12 m, albedo = 0.23, resistance surface = 70 m/s), where the land surface is sufficiently wet. The meteorological factors required to use the Penman-Monteith formula are the daily average temperature (T, °C), average relative humidity (RH, %), sunshine duration (SSD, hour), and wind speed (U, m/s) 2 m above the ground. The daily average temperature is defined as the average value of the daily maximum temperature and minimum temperature. Actual vapor pression is derived as:
where ea is the actual vapor pression (kPa), RH mean relative humidity, e0 (Tmax) saturated vapor pressure at a maximum temperature, e0 (Tmin) saturated vapor pressure at a minimum temperature.
2.3 Sensitivity analysis
S(x) is the sensitivity coefficient of the variable, and it reflects the response degree of the dependent variable to the change in the independent variable (McCuen, 1974). The ET0 is influenced by multiple meteorological elements, and the essence of the sensitivity analysis of the ET0 is the response degree between the ET0 and climatic factors. Sensitivity analysis was conducted to derive the dimensionless formula of the ET0 sensitivity coefficient to a single meteorological factor through the partial derivative (Zhang et al., 2014; Wang et al., 2016). When the sensitivity coefficient is positive, the ET0 increases as the climate factor increases. When the sensitivity coefficient is negative, the ET0 decreases as the climate factor increases. The greater the absolute value of the sensitivity coefficient is, the greater the sensitivity of the ET0 to the meteorological factor is.
2.4 Contributions of climate variables to the ET0 changes
In this study, the contributions of the meteorological factors to the ET0 changes were explored using the differential equation method (Zhang et al., 2014; Zheng and Wang, 2015). The proportional contribution of the climate factors to the long-term trend of the ET0 is calculated as follows:
where, L(ET0) is the long-term change trend of the ET0, and C(x) is the contribution of the meteorological factors.
In general, the sum of the contribution proportions of the meteorological factors to the ET0 change will not be strictly equal to 100%. This is because there is an uncertain relationship among the variables, and the calculated contribution rate will be greater than or less than 100%.
2.5 Trend detection method
2.5.1 Sen’s slope
In this study, Sen’s slope was used to calculate the change trends of the meteorological data and the ET0 time series data (Sen, 1968). Sen’s slope is widely used in meteorological and hydrological research. Its advantage is that it can reduce the influence of the outliers in the data.
2.5.2 M-K test
The Mann-Kendall test is a non-parametric statistical test method (Mann, 1945; N. L. J, 1949; Guo et al., 2019; Kendall, 1975). The advantages of this method are that the measured values do not need to obey a normal distribution and the trend is not required to be linear. It is widely used to determine the significance of the trend of long time series data.
The significance level is calculated using the values of the Z-test statistics. In this study, two significance levels, 95% and 99%, were set. There two significance levels correspond to significant (S) and very significant (VS.). The corresponding Z values respectively are | Z | > 1.96 (p < 0.05), and | Z | > 2.58 (p < 0.01) (Niu et al., 2021).
2.6 Mutation point test
In this study, the M-K mutation point test (Mann, 1945; N. L. J, 1949; Kendall, 1975) and the moving T-test (Wang et al., 2018) were used to determine the mutation characteristics of ET0 in time series (Figure 2). The mutation point of the ET0 on the annual scale sequence was analyzed by using a Matlab algorithm, and the appropriate mutation point was determined by combining the results of the two methods.
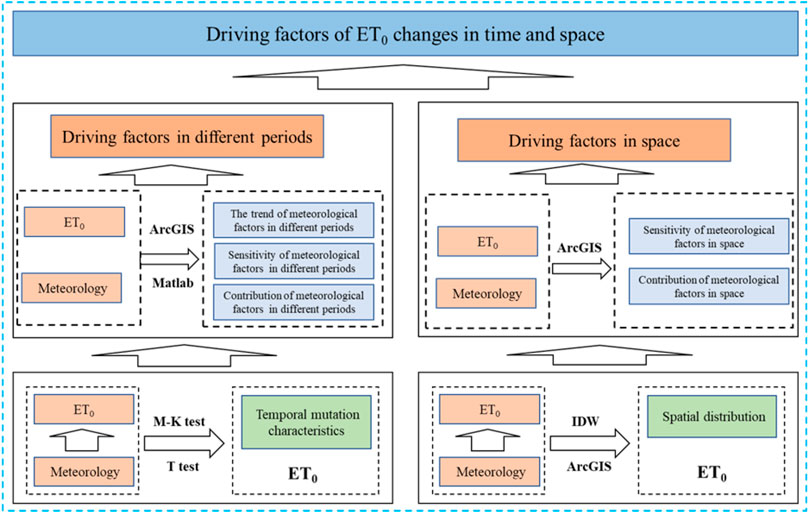
FIGURE 2. Workflow of this study.
3 Results
3.1 Temporal and spatial variations in the ET0
From 1958 to 2020, the multi-year average ET0 in the YLRB was 998.36 mm. It can be seen from Figures 3, 4 that the ET0 was higher in the northeast and lower in the south, with a variation range of 853.18–1,188.68 mm. The highest ET0 value occurred in the northeast, and the lowest value occurred in the center of the basin. It can be seen from Figure 4 that the ET0 exhibited an increasing trend in several areas in the southern and northwestern parts of the basin. In most areas of the basin, it exhibited a decreasing trend, and it decreased significantly in the northern region. The ET0 of the entire basin exhibited a decreasing trend from 1958 to 2020, with an average rate of change of −0.871 mm/yr (p < 0.05).
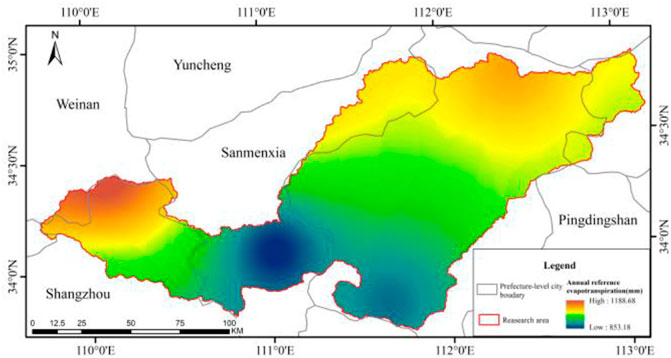
FIGURE 3. The spatial distribution of the annual ET0 in the YLRB during 1958–2020.
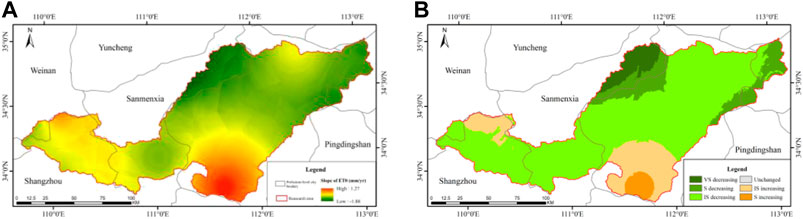
FIGURE 4. Slope of the ET0 on the spatial scale:(A) slopes of ET0; (B) significance levels of ET0.
3.2 Mutation points of ET0
In this study, the mutation points in time series of the ET0 were determined using the M-K mutation point test and the moving T-test. According to Figure 5, the common mutation point, detected using these two methods was 1972. In addition, 1994 was identified as an obvious mutation point using the moving t test. Therefore, the mutation points of the ET0 sequence were in 1972 and 1994. Similar ET0 mutation points were also found in the middle reaches of the Yellow River (She et al., 2017; Niu et al., 2021). According to the mutation points obtained in this study, the entire study period was divided into three periods, namely, 1958–1972, 1973–1994, and 1995–2020.
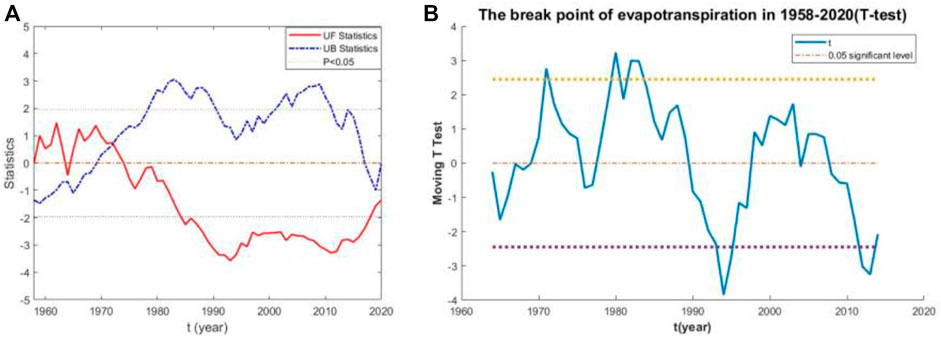
FIGURE 5. Temporal mutation characteristics of the ET0: (A) the M–K test; (B) the moving T-test.
According to the mutation points, the rates of change of the ET0 were 2.93 mm/yr during 1958–1972, −4.113 mm/yr (p < 0.01) during 1973–1994, and 2.097 mm/yr during 1995–2020. The ET0 exhibited a decreasing trend over the entire time series, with an average rate of change of −0.871 mm/yr (p < 0.05). During 1958–1972 and 1995–2020, it exhibited an increasing trend. According to Figure 6, the change in U was the most obvious. During 1973–1994, the U decreased very rapidly. However, T began to increase rapidly around 1983 and decreased slowly after 2000. The changes in these meteorological factors may have affected the changes in the ET0.
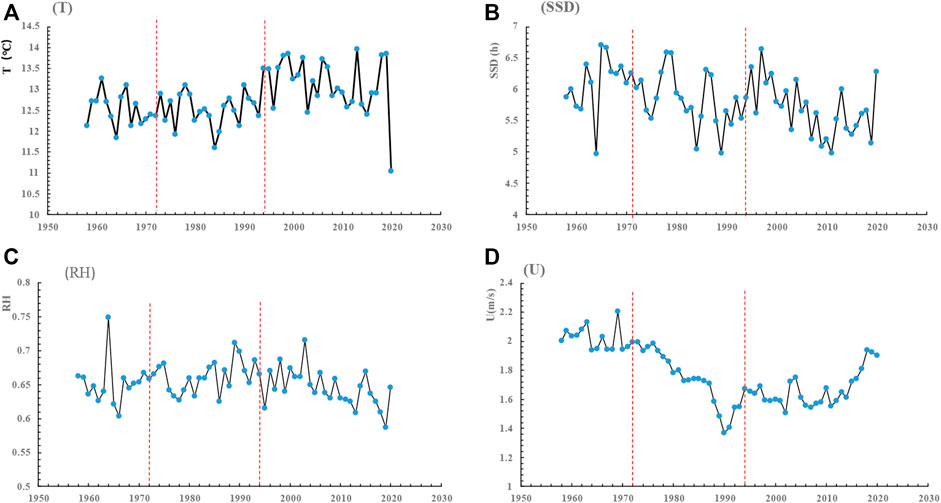
FIGURE 6. Variation trends of the meteorological factors: (A) the variation trend of T; (B) the variation trend of SSD; (C) the variation trend of RH; (D) the variation trend of U.
3.3 Analysis of contributions
3.3.1 Sensitivity of ET0 changes to meteorological factors
The sensitivity of the ET0 changes to the meteorological factors varied temporally and spatially (Figure 7). During 1958–2020, the average sensitivity coefficients of the ET0 to the RH, T, U, and SSD were −0.856, 0.254, 0.204, 0.170, respectively. The variations in the ET0 were the most sensitive to the RH and the least sensitive to the SSD. As shown in Table 2 The sensitivity coefficients (S(x)), contributions (C(x)), and proportional contributions (ρ(x)) in the different periods, the ET0 changes were always the most sensitive to RH during the different periods, but the sensitivity gradually decreased over time. The S(T) tended to increase. S(U) increased significantly from 1994 to 2020. Spatially, S(T) was larger in the central and eastern parts of the basin. S(U) was larger in the northern part of the basin. S (RH) was larger in the eastern part of the basin; S(SSD) was larger in the western part of the basin.
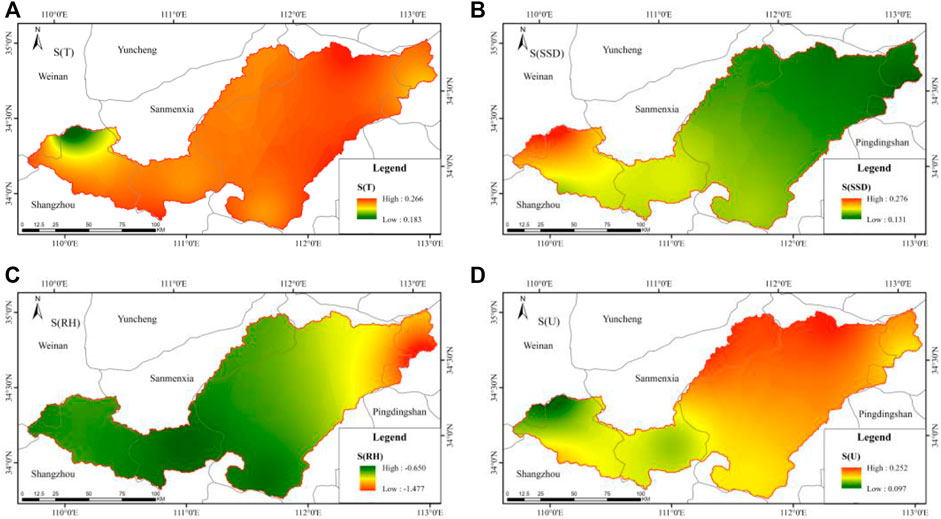
FIGURE 7. Spatial distribution of the sensitivity coefficients: (A) the distribution of S(T); (B) the distribution of S(SSD); (C) the distribution of S (RH); (D) the distribution of S(U).
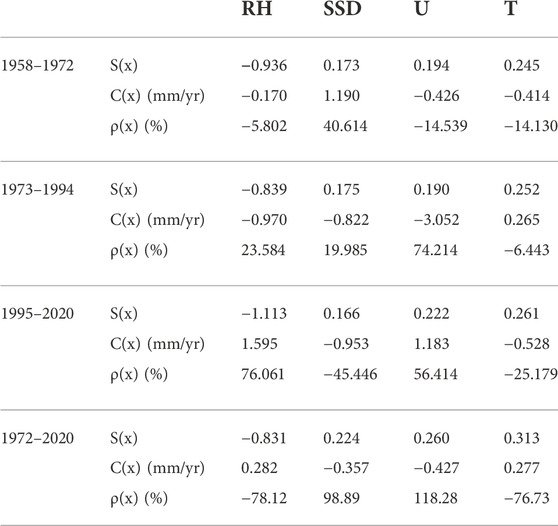
TABLE 2. The sensitivity coefficients (S(x)), contributions (C(x)), and proportional contributions (ρ(x)) in the different periods.
3.3.2 Contributions of meteorological factors to ET0 changes
During 1958–2020, the contribution of U to the ET0 changes was the largest. According to Table 2, the contributions of the meteorological factors to the ET0 changes during 1958–2020 were as follows: C(U) = −0.427 mm/yr, C(T) = 0.227 mm/yr, C (RH) = 0.282 mm/yr, C(SSD) = −0.357 mm/yr. The proportional contribution of the U was the largest (118.28%). The T and RH had positive effects on the ET0, while the U and SSD had negative effects. This result is consistent with the trend of the meteorological factors. The comprehensive effect of the four meteorological factors on the ET0 in the YLRB was −0.225 mm/yr.
The driving factors of the variations in the ET0 changes over time changed over time. During 1958–1972, the proportional contribution of the SSD was 406.14%, and it was the main driving factor. Under the influence of the SSD, the ET0 tends to increase. During 1973–1994, the proportional contribution of the U was 74.21%, and it was the main driving factor. The contribution of the U to the changes in the ET0 was positive during this period. During 1995–2020, the proportional contribution of the RH was 76.06%, and it was the main driving factor. The contribution of the RH to the change of the ET0 was positive during this period.
The comprehensive contribution of the meteorological factors was 0.18 mm/yr during 1958–1972, −4.58 mm/yr during 1973–1994, and 1.30 mm/yr during 1995–2020. The combined contribution was positive during 1958–1972 and 1995–2020, and negative during 1973–1994. Although the contributions of the meteorological factors to the ET0 changes fluctuated, the impact was negative throughout the study period.
According to Figures 3, 8, the U was the most important driving factor of the decrease in the ET0 spatially, with a contribution ratio of greater than 200%. The main influence region of the U was in the northeastern part of the basin, and the other regions were mainly affected by the T and RH. In the regions where ET0 increased, the U and RH were the main driving factors. In the northwestern part of YLRB where ET0 increased, the effect of the T was more obvious. The effects of the U and RH were more obvious in the southern region where ET0 increased.
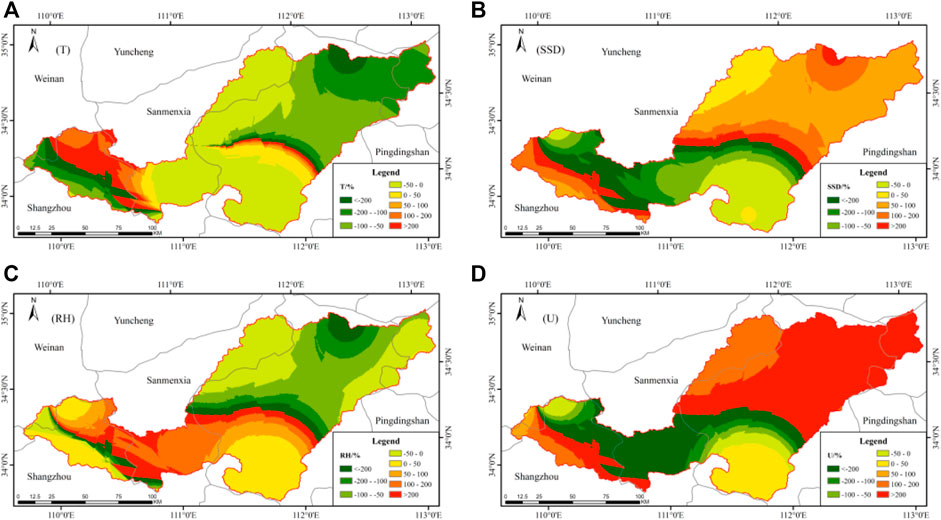
FIGURE 8. The proportional contributions of the meteorological factors on the spatial scale: (A) The proportional contributions of T; (B) The proportional contributions of SSD; (C) The proportional contributions of RH; (D) The proportional contributions of U.
Overall, the main driving factors of the ET0 changes changed over time, but the U was the most important influencing factor. Although the T exhibited an increasing trend, the effect of the T was offset by the effects of the other factors. Similar results have been reported for other areas (She et al., 2017). Spatially, the U is the main driving factor in most areas of the basin, especially in the areas where ET0 decreased.
4 Discussion
4.1 Relationships between meteorological factors and ET0
During 1958–2020, among the four meteorological factors, the variations in the ET0 were the most sensitive to the RH, but the U contributed the most to the variations in the ET0. This indicates that the most sensitive meteorological factor (RH) was not the driving factor of the ET0 changes. This finding also confirms that there are differences in the sensitivities of the meteorological factors and the driving factors in other regions (She et al., 2017; Wu et al., 2021).
The mean values of the U, T, RH, and SSD were 1.77 m/s, 12.78°C, 0.653, and 5.83 h, respectively. The interannual variation trend of the RH was −0.026%/yr, i.e., it did not decrease significantly. That of the U was −0.0083 m/s/yr (p < 0.01), i.e., it decreased significantly. That of the T was 0.0123°C/yr (p < 0.01), i.e., it increased significantly. That of the SSD was −0.011 h/yr (p < 0.01), i.e., it decreased significantly.
The relative rates of change of the meteorological factors were used to measure the change degrees of the meteorological factors, that is, the ratio of the slope of the change trend to the average value within a period. The relative rates of change of the U, RH, T, and SSD during 1958–2020 were −0.395%, −0.040%, 0.096%, and 0.189%, respectively. The U exhibited the largest relative rate of change among the four meteorological factors, while the RH exhibited the smallest.
The driving factor of the ET0 changes was related to the relative rates of change of the meteorological factors. During the study period, the U exhibited the largest relative rate of change, while the RH exhibited the smallest. Similarly, although the variations of the ET0 were the least sensitive to the SSD, the contribution of the SSD was only smaller than the U. The relative rate of change of the SSD was only smaller than that of the U. Therefore, we conclude that the contributions of the meteorological factors to the ET0 change should be closely related to the ranges of the changes in the meteorological factors. Therefore, sensitivity may not be the primary consideration when considering the impact of meteorological factors on ET0 changes. A similar phenomenon was also found in a study of the middle reaches of the Yellow River. The driving factors of the ET0 were the meteorological factors with large relative rates of change. As a part of the middle reaches of Yellow River Basin, this result is consistent with the previous studies in the middle reaches of Yellow River Basin (She et al., 2017). Similarly, the U are also the main driver of the ET0 changes in other regions (Zhang et al., 2014; She et al., 2017; Wang et al., 2019). In addition, it also explains the phenomenon of evaporation paradox to some extent.
In YLRB, the major driving factors varies spatially. The U was the main driving factor of the ET0 in the regions of the YLRB in which the ET0 decreased. However, in the regions where the ET0 increased, the U and RH were the main driving factors. On a larger scale, there are differences in driving factors between different regions. In northern China, U is the driving factor of ET0 change in major regions, especially the Yellow River basin and Beijing-Tianjin region (Shan et al., 2015; She et al., 2017; Chai et al., 2018; Kang et al., 2021). And the vapour pressure deficit is the driving factor in the south of the Chang Jiang River basin and Tibet (Shi et al., 2017; Chai et al., 2018). In the Loess Plateau, U is also the driving factor in semi-arid region. However, the driving factor of the semi-humid region of the Loess Plateau, where climate is similar to the YLRB, is solar radiation (Li et al., 2022). These differences may not take into account the influence of altitude (Kang et al., 2021).
When calculating the ET0 using the Penman-Monteith formula, we assumed that the four meteorological factors were independent of each other. However, there are uncertainties among the meteorological factors, which may lead to errors in the calculated results. The sensitivities and the ET0 to the meteorological factors and their contributions to the change in the ET0 evaluated using the differential method will also be affected.
Human activities change the state of nature, which affects the ET0 by influencing the meteorological factors. However, this process is hard to capture in research. Due to the ecological construction in the YLRB, the vegetation coverage increased continuously (Li et al., 2016). And the rapid development of urbanization leads to the continuous expansion of urban area. These would have increased the surface roughness, leading to lower wind speeds. This phenomenon is found all over the world, which also known as ‘wind stilling’ (Roderick and Farquhar, 2002). A decrease in U also tends to lead to the accumulation of clouds, leading to a decrease in solar radiation (Xiong et al., 2020). The ET0 was potentially affected by these changes. Nationwide, U and SSD all turned around 1990 (Wild, 2009; Xiong et al., 2020). In terms of time, the mutation point of ET0 in 1994 in this study is synchronous with the changes of these two meteorological factors. At the same time, it is found in this study that the influence areas of U and SSD are also highly coincident, indicating that there is a relationship between them.
5 Conclusion
Based on meteorological data from 26 meteorological stations in the YLRB and the surrounding area from 1958 to 2020, in this study, the spatial and temporal variations in and driving factors of ET0 were investigated. Overall, the annual average ET0 exhibited a decreasing trend with a rate of change of −0.871 mm/yr. Spatially, the rate of change of the ET0 gradually changed from a significant decreasing trend to a significant increasing trend from north to south in the basin. The ET0 mainly increased in the south and a few areas in the northwest. During the entire study period, the T mainly exhibited an increasing trend, while the other meteorological factors exhibited decreasing trends with different slopes. The U exhibited the largest relative rate of change. The mutation points were in 1972 and 1994. Thus, the entire research period was divided into three periods.
The sensitivity coefficients of the four meteorological factors revealed that the effect of the RH was negative, while some of the T, U, and SSD were positive during 1958–2020. The ET0 was the most sensitive to the RH, but the sensitivity gradually decreased. The sensitivity varied over time. The contributions of the meteorological factors to the changes in the ET0 varied greatly during different periods. During 1958–2020, the contribution proportion of the U was 118.28%, and that of the T was −76.73%. The U was the dominant factor affecting the variations in the ET0, and the T had the least effect. During 1958–1972, the SSD was the largest driving factor of the changes in the ET0. During 1973–1994, the U was the largest driving factor of the change in the ET0. During 1995–2020, the RH was the largest driving factor of the changes in the ET0. The most sensitive meteorological factor (RH) was not the meteorological factor (U) that contributed the most to the changes in the ET0 from 1958 to 2020. The driving factors were closely related to the relative rate of change of the meteorological factors. The SSD may be affected by the U, which affects the ET0 in turn. The above research, results provide a better understanding of the relationships between the ET0 and the meteorological factors, as well as theoretical support for practical applications.
Data availability statement
The raw data supporting the conclusions of this article will be made available by the authors, without undue reservation.
Author contributions
LY and QT is responsible for the construction of the overall paper structure and paper writing, WH formulates research ideas, technical routes, model establishment and paper writing, ZX is responsible for literature research, TZ is responsible for model solving, LC is responsible for code writing, ZQ is responsible for revising the comments of the article, LX polished the English expression of the article.
Funding
This work is partially supported by the National Science Fund Project for Distinguished Young Scholars (51725905), the National Science Fund Project (51879275), the Five Major Excellent Talent Programs of IWHR (WR0199A012021), and the National Science Fund Project (52130907).
Conflict of interest
The authors declare that the research was conducted in the absence of any commercial or financial relationships that could be construed as a potential conflict of interest.
Publisher’s note
All claims expressed in this article are solely those of the authors and do not necessarily represent those of their affiliated organizations, or those of the publisher, the editors and the reviewers. Any product that may be evaluated in this article, or claim that may be made by its manufacturer, is not guaranteed or endorsed by the publisher.
References
Allen, R., Pereira, L., and Smith, M. (1998). Crop evapotranspiration-guidelines for computing crop water requirements-fao irrigation and drainage paper 56. Fao. Rome 300, D05109.
Bian, Y. M., Dai, H. Y., Zhang, Q. L., Yang, L. P., and Du, W. L. (2020). Spatial distribution of potential evapotranspiration trends in the inner Mongolia autonomous region (1971-2016). Theor. And Appl. Climatol. 140, 1161–1169. doi:10.1007/S00704-020-03154-Y
Chai, R. F., Sun, S. L., Chen, H. S., and Zhou, S. J. (2018). Changes in reference evapotranspiration over China during 1960-2012: Attributions and relationships with atmospheric circulation. Hydrol. Process. 32, 3032–3048. doi:10.1002/Hyp.13252
Darshana, , Pandey, A., and Pandey, R. P. (2013). Analysing trends in reference evapotranspiration and weather variables in the tons River Basin in central India. Stoch. Environ. Res. Risk Assess. 27, 1407–1421. doi:10.1007/S00477-012-0677-7
Feng, X. M., Fu, B. J., Piao, S., Wang, S. H., Ciais, P., Zeng, Z. Z., et al. (2016). Revegetation in China's Loess Plateau is approaching sustainable water resource limits. Nat. Clim. Chang. 6, 1019–1022. doi:10.1038/Nclimate3092
Guo, Y. H., Zhang, Y. S., Ma, N., Xu, J. Q., and Zhang, T. (2019). Long-term changes in evaporation over siling Co lake on the Tibetan plateau and its impact on recent rapid lake expansion. Atmos. Res. 216, 141–150. doi:10.1016/J.Atmosres.2018.10.006
Han, J. Y., Wang, J. H., Zhao, Y., Wang, Q. M., Zhang, B., Li, H. H., et al. (2018). Spatio-temporal variation of potential evapotranspiration and climatic drivers in the jing-jin-ji region, north China. Agric. And For. Meteorology 256, 75–83. doi:10.1016/J.Agrformet.2018.03.002
Jiang, C., Nie, Z., Mu, X., Wang, F., and Liu, W. (2016). Potential evapotranspiration change and its attribution in the qinling mountains and surrounding area, China, during 1960-2012. J. Water Clim. Chang. 7, 526–541. doi:10.2166/Wcc.2016.110
Kang, T., Li, Z., and Gao, Y. (2021). Spatiotemporal variations of reference evapotranspiration and its determining climatic factors in the taihang mountains, China. Water 13, 3145. doi:10.3390/W13213145
Li, Q., Liu, Z., Zander, P., Hermanns, T., and Wang, J. (2016a). Does farmland conversion improve or impair household livelihood in smallholder agriculture system? A case study of grain for green Project impacts in China’s Loess Plateau. World Dev. Perspect. 2, 43–54. doi:10.1016/J.Wdp.2016.10.001
Li, S., Liang, W., Fu, B., Lu, Y., Fu, S., Wang, S., et al. (2016b). Vegetation changes in recent large-scale ecological restoration projects and subsequent impact on water resources in China's Loess Plateau. Sci. Of Total Environ. 569, 1032–1039. doi:10.1016/J.Scitotenv.2016.06.141
Li, X., Liang, W., Jiao, L., Yan, J., Zhang, W., Wang, F., et al. (2022). Identification of dominant climate variables on spatiotemporal variation in reference evapotranspiration on the Loess Plateau, China. Chin. Geogr. Sci. 32, 620–642. doi:10.1007/S11769-022-1290-4
Lv, X. Z., Zuo, Z. G., Sun, J., Ni, Y. X., and Wang, Z. H. (2019). Climatic and human-related indicators and their implications for evapotranspiration management in A watershed of Loess Plateau, China. Ecol. Indic. 101, 143–149. doi:10.1016/J.Ecolind.2019.01.019
Mccuen, R. H. (1974). A sensitivity and error analysis Cf procedures used for estimating evaporation. J. Am. Water Resour. Assoc. 10, 486–497. doi:10.1111/j.1752-1688.1974.tb00590.x
Niu, Z. G., Wang, L. C., Chen, X. X., Yang, L., and Feng, L. (2021). Spatiotemporal distributions of Pan evaporation and the influencing factors in China from 1961 to 2017. Environ. Sci. Pollut. Res. 28, 68379–68397. doi:10.1007/S11356-021-15386-0
N. L. J. (1949). Rank correlation methods. By maurice G. Kendall, M.A. [Pp. Vii + 160. London: Charles griffin and Co. Ltd., 42 drury lane, 1948. 18s.]. J. Of Inst. Of Actuar. 75, 140–141. doi:10.1017/S0020268100013019
Pour, S. H., Abd Wahab, A. K., Shahid, S., and Bin Ismail, Z. (2020). Changes in reference evapotranspiration and its driving factors in peninsular Malaysia. Atmos. Res. 246, 105096. doi:10.1016/J.Atmosres.2020.105096
Roderick, M. L., and Farquhar, G. D. (2002). The cause of decreased Pan evaporation over the past 50 years. Science 298, 1410–1411. doi:10.1126/science.1075390-a
Sen, P. K. (1968). Estimates of the regression coefficient based on kendall's tau. J. Of Am. Stat. Assoc. 63, 1379–1389. doi:10.1080/01621459.1968.10480934
Shan, N., Shi, Z., Yang, X., Gao, J., and Cai, D. (2015). Spatiotemporal trends of reference evapotranspiration and its driving factors in the beijing-tianjin sand source control Project region, China. Agric. And For. Meteorology 200, 322–333. doi:10.1016/J.Agrformet.2014.10.008
She, D., Xia, J., and Zhang, Y. (2017). Changes in reference evapotranspiration and its driving factors in the middle reaches of Yellow River Basin, China. Sci. Of Total Environ. 607, 1151–1162. doi:10.1016/J.Scitotenv.2017.07.007
Shi, H. Y., Li, T. J., and Wang, G. Q. (2017). Temporal and spatial variations of potential evaporation and the driving mechanism over Tibet during 1961-2001. Hydrological Sci. J. 62, 1469–1482. doi:10.1080/02626667.2017.1332416
Vadeboncoeur, M. A., Green, M. B., Asbjornsen, H., Campbell, J. L., Adams, M. B., Boyer, E. W., et al. (2018). Systematic variation in evapotranspiration trends and drivers across the northeastern United States. Hydrol. Process. 32, 3547–3560. doi:10.1002/Hyp.13278
Wang, Q. M., Wang, J. H., Zhao, Y., Li, H. H., Zhai, J. Q., Yu, Z. B., et al. (2016). Reference evapotranspiration trends from 1980 to 2012 and their attribution to meteorological drivers in the three-river source region, China. Int. J. Climatol. 36, 3759–3769. doi:10.1002/Joc.4589
Wang, T. H., Yang, H. B., Yang, D. W., Qin, Y., and Wang, Y. H. (2018). Quantifying the streamflow response to frozen ground degradation in the source region of the Yellow River within the budyko framework. J. Of Hydrology 558, 301–313. doi:10.1016/J.Jhydrol.2018.01.050
Wang, Z., Ye, A., Wang, L., Liu, K., and Cheng, L. (2019). Spatial and temporal characteristics of reference evapotranspiration and its climatic driving factors over China from 1979-2015. Agric. Water Manag. 213, 1096–1108. doi:10.1016/J.Agwat.2018.12.006
Wild, M. (2009). Global dimming and brightening: A review. J. Geophys. Res. 114, D00D16. doi:10.1029/2008jd011470
Wu, D., Fang, S., Tong, X., Wang, L., Zhuo, W., Pei, Z., et al. (2021a). Analysis of variation in reference evapotranspiration and its driving factors in mainland China from 1960 to 2016. Environ. Res. Lett. 16, 054016. doi:10.1088/1748-9326/Abf687
Wu, H., Xu, M., Peng, Z. Y., and Chen, X. P. (2021b). Temporal variations in reference evapotranspiration in the tarim River Basin, central asia. Plos One 16, e0252840. doi:10.1371/Journal.Pone.0252840
Xie, S. D., Mo, X. G., Hu, S., and Liu, S. X. (2020). Contributions of climate change, elevated atmospheric Co2 and human activities to et and gpp trends in the three-north region of China. Agric. And For. Meteorology 295, 108183. doi:10.1016/J.Agrformet.2020.108183
Xiong, J., Wang, Z., Lai, C., Liao, Y., and Wu, X. (2020). Spatiotemporal variability of sunshine duration and influential climatic factors in mainland China during 1959-2017. Int. J. Climatol. 40, 6282–6300. doi:10.1002/Joc.6580
Xu, L. H., Shi, Z. J., Wang, Y. H., Zhang, S. L., Chu, X. Z., Yu, P. T., et al. (2015). Spatiotemporal variation and driving forces of reference evapotranspiration in jing River Basin, northwest China. Hydrol. Process. 29, 4846–4862. doi:10.1002/Hyp.10541
Yang, L. S., Feng, Q., Adamowski, J. F., Alizadeh, M. R., Yin, Z. L., Wen, X. H., et al. (2021). The role of climate change and vegetation greening on the variation of terrestrial evapotranspiration in northwest China's qilian mountains. Sci. Of Total Environ. 759. doi:10.1016/J.Scitotenv.2020.143532
Yin, Y. H., Wu, S. H., and Dai, E. F. (2010). Determining factors in potential evapotranspiration changes over China in the period 1971-2008. Chin. Sci. Bull. 55, 3329–3337. doi:10.1007/S11434-010-3289-Y
Yu, D. Y., Li, X. Y., Cao, Q., Hao, R. F., and Qiao, J. M. (2020). Impacts of climate variability and landscape pattern change on evapotranspiration in A grassland landscape mosaic. Hydrol. Process. 34, 1035–1051. doi:10.1002/Hyp.13642
Zhang, D., Hong, H., Zhang, Q., and Nie, R. (2014). Effects of climatic variation on pan-evaporation in the poyang lake basin, China. Clim. Res. 61, 29–40. doi:10.3354/Cr01225
Zhang, S. L., Yang, D. W., Yang, Y. T., Piao, S. L., Yang, H. B., Lei, H. M., et al. (2018). Excessive afforestation and soil drying on China's Loess Plateau. J. Geophys. Res. Biogeosci. 123, 923–935. doi:10.1002/2017jg004038
Keywords: reference evapotranspiration, Penman Monteith method, sensitivity analysis, trend, Yiluo River Basin
Citation: Yizhe L, Huiliang W, Xin Z, Chenhao L, Zihao T, Qiufen Z, Xizhi L and Tianling Q (2023) Spatiotemporal variations and driving factors of reference evapotranspiration in the Yiluo river basin. Front. Earth Sci. 10:1048200. doi: 10.3389/feart.2022.1048200
Received: 19 September 2022; Accepted: 25 November 2022;
Published: 18 January 2023.
Edited by:
Feng Li, Institute of Subtropical Agriculture (CAS), ChinaReviewed by:
Papa Malick Ndiaye, Centre de Suivi Ecologique, SenegalBaolin Xue, Beijing Normal University, China
Copyright © 2023 Yizhe, Huiliang, Xin, Chenhao, Zihao, Qiufen, Xizhi and Tianling. This is an open-access article distributed under the terms of the Creative Commons Attribution License (CC BY). The use, distribution or reproduction in other forums is permitted, provided the original author(s) and the copyright owner(s) are credited and that the original publication in this journal is cited, in accordance with accepted academic practice. No use, distribution or reproduction is permitted which does not comply with these terms.
*Correspondence: Lv Xizhi, bmlodWx2eGl6aGlAMTYzLmNvbQ==; Qin Tianling, cWludGxAaXdoci5jb20=