 Hiren Jethva1,2*
- 1Morgan State University, Goddard Earth Sciences Technology and Research (GESTAR) II, Baltimore, MD, United States
- 2NASA Goddard Space Flight Center, Greenbelt, MD, United States
Over the past five decades, the Green Revolution in India has been a great success resulting in significantly increased crop yields and food grain productivity. Northwestern India, also known as the country’s breadbasket, alone produces two-thirds of the wheat and rice grains under the crop rotation system. Our previous study has shown that the post-monsoon rice crop production in the Punjab state of India has increased by 25%. The crop yields produce proportionate amounts of residue, a large part of which is subjected to burn in the open fields due to the near-absence of a wide-scale, affordable, and environmentally sustainable removal mechanism. A significant increase in crop productivity coincides with a 60% increase in post-harvest crop residue burning during 2002–2016. The study also demonstrated a robust relationship between satellite measurements of vegetation index—a proxy for crop amounts, and post-harvest fires—a precursor of air pollution events, for predicting seasonal agricultural burning. In this report, the efficacy of the proposed prediction model is assessed by comparing the forecasted seasonal fire activity against the actual detection of active fires for the post-monsoon burning seasons of 2017–2021. A simple linear regression model allows efficient prediction of seasonal fire activity within an error of up to 10%. In addition to forecasting seasonal fire activity, the linear regression model offers a practical tool to track and evaluate the effectiveness of the residue management system intended to reduce fire activities and resulting air pollution.
1 Introduction
The movement of the Green Revolution in India, initiated in the 1960s, has brought great success in terms of significantly increased crop yield and productivity, particularly in staple food grains such as wheat, rice, and other crop varieties. This has been achieved through technology adaptation, high-yielding seed varieties, mechanized agricultural machinery, pesticides, fertilizers, expanded acreage, and a dual cropping system (Parayil, 1992; Pingali, 2012). Especially in the heartland of the Green Revolution, the northern states of Punjab and Haryana have seen a multifold increase in the yield and production of wheat and rice under the crop rotation system in the last several decades (Duxbury, 2001). For instance, the compiled data of crop production by the Punjab University shows an eleven-fold increase in rice crop productivity in Punjab, i.e., ∼1 million tons in 1965 to ∼11 million tons in 2007. Furthermore, Jethva et al. (2019), using the crop production data compiled by the Ministry of Agriculture and Farmers Welfare, Govt. of India, has shown that rice crop production has increased from ∼9 million tons in 2002 to ∼13 million tons in 2016, i.e., a net increase in the productivity by 25%.
Prior to the mid-1980s, seasonal crop harvesting in northwestern (NW) India had traditionally been carried out manually. Since then, the practice of manual harvesting has been gradually replaced by the advent of automatic combine harvesters (Singh and Kaskaoutis, 2014). Although mechanized harvesting has reduced labor, machinery leaves a significant part of the crop stem rooted in the ground. Increasing labor cost of manual harvest, the lack of affordable crop residue removal mechanisms that farmers can bear financially, and a shorter time window for preparing the land for the next seasonal crop, are prime reasons behind farmers resorting to burning the residue in open fields (Badarinath et al., 2006).
Several studies published in recent years, using satellite and ground observations, have adequately highlighted the impact of post-monsoon rice straw burning on extreme levels of air pollution affecting one of the most densely populated regions of the world, i.e., Indo-Gangetic Plain (IGP) (Kaskaoutis et al., 2014; Cusworth et al., 2018; Jethva et al., 2018). Using a 15-year-long record (2002–2016) of NASA’s A-train satellite observations of thermal anomalies (fires) and aerosols (MODIS, OMI, CALIOP), Jethva et al. (2018) have shown an increasing trend in post-monsoon agricultural fires (∼617 per year) and aerosol loading (0.031 and 0.04 per year in aerosol optical depth and UV aerosol index) in November. Furthermore, an intentional delay in the rice growing season from May to June enforced by the Punjab Preservation of Subsoil Water Act 2009 has led to a delay in crop harvesting, followed by the peak residue burning window by about 2 weeks (Jethva et al., 2019; Liu et al., 2021).
In a follow-up study by Jethva et al. (2019), a strong positive trend in fires was attributed to the increased rice crop production by 25%, supported by a net increase in vegetation index (NDVI) by 21%. Concurrently, the post-harvest agricultural fire activity rose by a net ∼60%, leading to a nearly 43% increase in aerosol loading over the IGP region. In addition, the ground-level particulate matter (PM2.5) downwind over New Delhi also showed a concurrent upward trend of 60%. An increase in crop yields implies the generation of proportionate amounts of residue. The relative ratio, also quantified as residue to crop production ratio (RCR), varies considerably depending on crop type, harvesting practice, and environmental factors (Kumar et al., 2015). Previous studies have estimated RCR values in the range of 1.5–2.25 for rice crops in northern India (Gupta et al., 2004; Badarinath et al., 2006). In other words, the amount of agricultural waste generated post-harvest is estimated to be 1.5 to 2.25 times the actual quantities of the crop. Due to the lack of affordable and effective removal mechanisms, farmers resort to burning crop residue in open fields to clear and prepare the land for the following seasonal crop.
Increasing agricultural fire activities implies greater availability of crop residue to burn, and the generation of agricultural waste is proportional to the crop production amounts reflected in NDVI measurements. Following this hypothesis, Jethva et al. (2019) showed a reasonably well-correlated (R2 = 0.70) long-term relationship between NDVI and seasonally accumulated fire counts over NW India. While earlier studies have examined different aspects of the crop burning issue in NW India, the prediction of the totality of seasonal fire activities wasn’t explored until the work of Jethva et al. (2019). The NDVI-fires relationship opened up the possibility of predicting seasonal fire activities in advance by looking at the regional mean NDVI values prior to the onset of the burning season.
In this brief report, the predictability of crop residue fires in NW India, based on the work of Jethva et al. (2019), is assessed for the post-monsoon crop burning seasons of 2017–2021. The accuracy of the predicted seasonal fire activity is evaluated by comparing it to near real-time remote sensing data of thermal anomalies from the Aqua/MODIS sensor. The method section briefly describes the satellite datasets and further refinements applied to the fire counts vs. NDVI relationship. The results section presents the assessment analysis of predicted seasonal fire activity against actual near real-time observations of fire occurrences for the years 2017–2021. Finally, concluding remarks on the findings and future applications are presented in the discussion section.
2 Methods
The methodology adopted in Jethva et al. (2019) used the monthly NDVI dataset (product name MYD13C2) and seasonally accumulated fire counts derived from Aqua/MODIS (product name MYD14) for the pre-burning and burning periods, respectively, over NW India. The selection of the geographical boundaries of the study region over NW Indian subcontinent (Longitudes: 74°–77°E, Latitudes: 29°–32°N) was based on the long-term average of active fire detection from MODIS sensor on board Aqua satellite encompassing prominent areas of residue burning in Punjab and Haryana states of India. A further revision of the derived relationship revealed that the use of the 16-day NDVI product (product name MYD13C1) correlates even better with the total fire counts detected during the post-monsoon season (see Figure 1). The 16-day NDVI dataset provides an improved correlation coefficient and standard fitting error of 0.74 and 1,482, respectively, compared to 0.70 and 1,583 obtained using the monthly NDVI dataset. Because of the improved correlation and lower fitting error, the 16-day NDVI is correlated with fire counts to assess the accuracy of the proposed linear regression model. The MYD13C1 dataset consists of cloud-free spatial composites of 16-day 1-km MYD13A2 data and is available as a Level 3 product projected on a 0.05 degree (5,600 m) geographic climate model grid (Didan, K., 2015). The dataset was obtained from LP DAAC online data holdings at the URL https://e4ftl01.cr.usgs.gov/MOLA/.
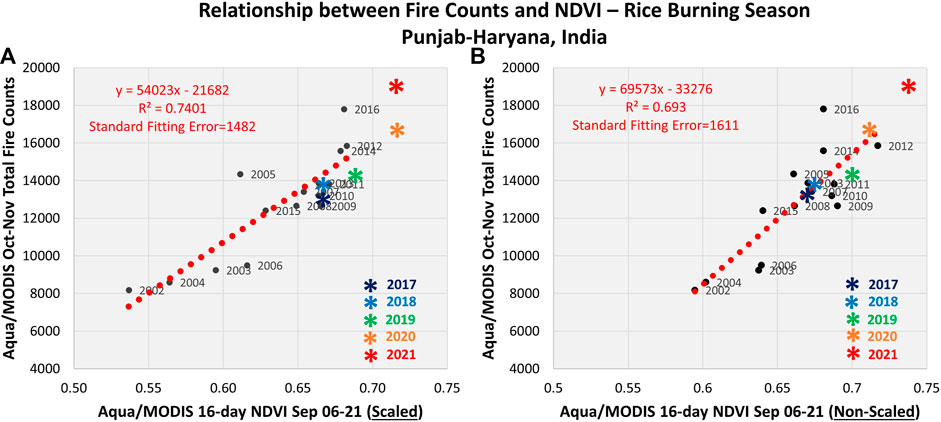
FIGURE 1. Multi-year (2002–2016) relationships between the pre-burning season NDVI and the total number of fire counts during post-monsoon crop burning monthsderived following scaled (A) and non-scaled (B) methods. See the section Method for the description. Both datasets are derived from Aqua/MODIS sensor over NW India. Black-filled circles show values for individual years, whereas the red dotted line represents a linear regression, the statistical measures of which are given on the top-left of each plot. Color-coded asterisk symbols are values observed for the years 2017–2021 not used in the regression.
The monthly, area-averaged NDVI dataset used in Jethva et al. (2019) was scaled by a factor that accounts for interannual variations in the spatial extent of NDVI measurements over the crop area. The factor was calculated by normalizing the total number of NDVI measurements for each year with respect to the maximum number of pixels detected during a particular year over the period 2002–2016. In this study, both scaled and non-scaled (simple area averaged without scaling) 16-day NDVI datasets are used to compare their relative performance in predicting seasonal fire counts.
The MODIS Thermal Anomaly/Fire product provides the geolocation of active fire spots and fire radiative power over land at a spatial resolution of 1 km2 × 1 km2. Active fire detection is physically based on the strong emission of mid-infrared radiation from fires used as a signal in a contextual algorithm (Giglio et al., 2003, 2016). The Aqua/MODIS Thermal Anomalies/Fire 5-Min L2 Swath 1-km data MYD14 (Collection 006, Giglio and Justice, 2015), both post-processed (2002–2016) and near-real time (2017–2021), was obtained from the NASA Fire Information for Resource Management System (FIRMS) (https://earthdata.nasa.gov/earth-observation-data/near-real-time/firms). Fire detection pixels flagged with a confidence value of 30%–80% and 80%–100% that correspond to the “nominal” and “high” classes, respectively, were considered in this study.
3 Results
3.1 Rice residue burning season
Figure 1 displays the multiyear (2002–2016) linear regression relationship between the post-monsoon seasonally accumulated total fire counts (y-axis) observed during the 2-month long burning season (October and November) and 16-day NDVI (x-axis) over the same region for the pre-burning period in September. The black dots represent values for individual years, whereas the red dotted line is a derived linear regression. The results shown here are derived using the scaled (left) and non-scaled (right) NDVI datasets, as described in the method section. The colored asterisk symbols represent observations, not used in the linear regression, in both parameters for the post-monsoon season of 2017 through 2021. Overall, both relationships are found to adequately predict the severity of the residue fire season. However, the differences between the predicted and actual total fire counts remain, which are quantified as % difference and tabulated in Table 1.
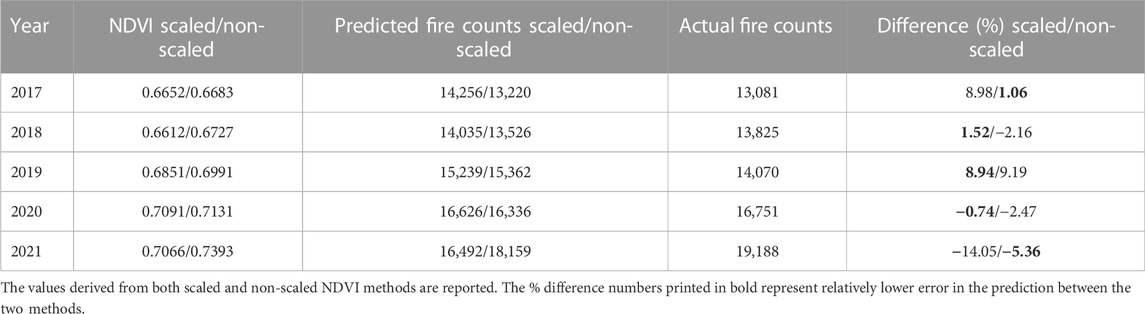
TABLE 1. Values of Aqua/MODIS NDVI for the pre-burning period (September), predicted and actual fire counts for the post-harvest burning season (October and November), and difference (%, predicted-actual) between the latter two for NW India for the years 2017–2021.
Though the scaled version of the relationship delivers better correlation and lower fitting error relative to the non-scaled version, the % error yield with the latter is found to be lower for the years 2017 and 2021. Both methods render similar accuracy in predicting seasonal fires for the years 2018 and 2019. While it is hard to pinpoint the exact reason behind larger errors encountered in the prediction during specific years, the observed spread in the fires-NDVI relationship, thus associated error in the prediction, could be attributed to several factors, including inherent uncertainties in the detection of active fires and derivation of NDVI, cloud cover affecting sampling of both fires and NDVI, unaccounted fire activities occurring before and/or after Aqua overpass time, a saturation of NDVI in dense vegetation canopies, and variabilities in RCR and percentage of total crop residue burned.
Overall, when averaged over the years 2017–2021, the mean error (absolute error) produced by the scaled and non-scaled methods is calculated to be 0.93% (7%) and 0.052% (4%). Regardless of how the NDVI dataset was used, both methods deliver reasonably a good estimate of seasonally accumulated fire counts with an error of up to 10% for 2017–2021.
3.2 Wheat residue burning season
Contrary to the rice residue burning during post-monsoon (October-November), the total fire activities during the springtime wheat residue burning season in April-May are noted to be about four to six times lesser (Jethva et al., 2018). Significantly lower residue burning post wheat harvest may be attributed to the usage of residue as fodder and fuel in power generation. An extension of the fire counts vs. NDVI relationship to the wheat crop burning season (2002–2020), shown in Figure 2, reveals no systematic behavior between the two parameters. The linear regression relationships, both scaled and non-scaled, yield poor correlation (R2 = 0.03) with a large spread in data for the individual years around linear fit and a slight negative slope. Since the main focus of the present report is to assess the predictability of fire activities during post-monsoon, a detailed analysis of the wheat crop burning is left out in this report. It demands a separate study involving year-to-year dynamics of crop yield and production, burning practices, and residue usage for other purposes (fodder, power generation, etc.).
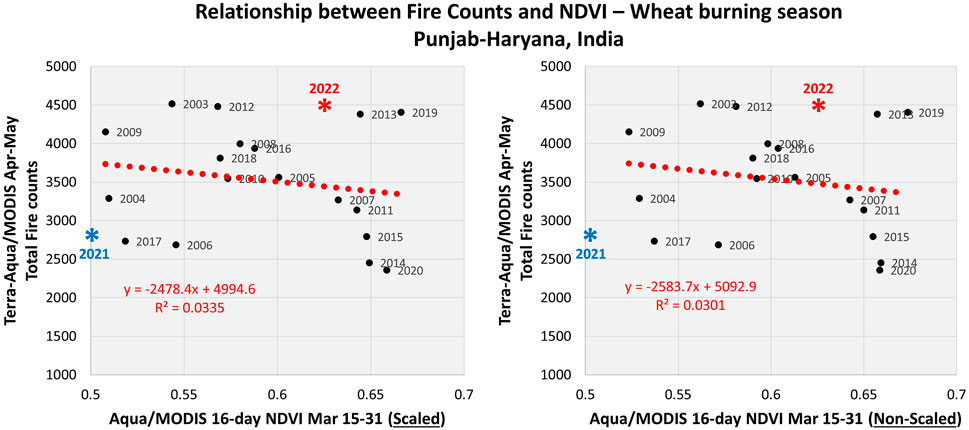
FIGURE 2. Same as in Figure 1 but for the wheat residue burning season (April-May) over NW India.
3.3 Scaling fire detection from MODIS to VIIRS
Since 2012, the VIIRS sensor onboard the Suomi-NPP satellite has provided continuity in the global remote sensing of atmospheric and land parameters, including thermal anomalies. VIIRS detects active fire locations at 375-m resolution—a significant improvement in spatial resolution over MODIS, which provides fire detection at 1-km resolution. Owing to higher spatial resolution, VIIRS is expected to detect smaller-scale fires, which MODIS might miss due to its relatively coarser resolution. The linear regression model developed by Jethva et al. (2019) is based on MODIS observations of NDVI and fire counts. Therefore, it is strictly valid for predicting seasonal fire activity as it would detect by MODIS at a 1-km nominal resolution.
Such a prediction model has not been developed using observations from VIIRS. To extend the seasonal fire prediction to VIIRS, a relationship, as shown in Figure 3, comparing the total fire activity from both sensors over the crop residue burning region of NW India is warranted. The VIIRS thermal anomaly data was accessed from the NASA FIRMS platform. The seasonal fire counts detected during the rice (left) and wheat (right) burning seasons from both sensors over the overlapping period 2012–2021 (black filled circles) are used to derive a linear regression (red dotted line). It shows that VIIRS detects about 3.56 (1.47) times more fire incidences with a positive offset of 18,836 (11,404) than those observed from MODIS for the rice (wheat) residue burning season. The spread of observations around the linear fit can be attributed to how two instruments see the active fires, algorithmic differences, spatial resolution, and temporal changes in fire occurrences between the overpass time (typically within 30 min). Such an empirical relationship comparing fire statistics from two sensors can be helpful in converting MODIS-based fire prediction to that from the VIIRS sensor.
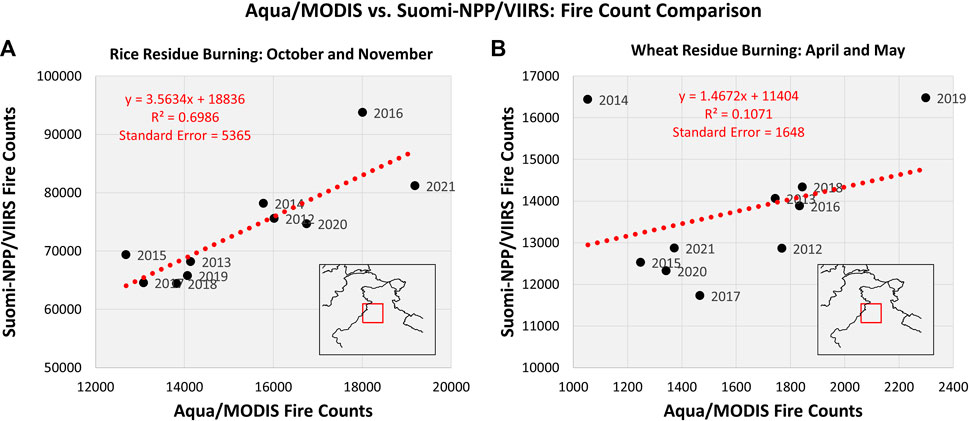
FIGURE 3. Relationship comparing post-monsoon (A) and springtime (B) total fire detection from Aqua/MODIS and Suomi-NPP/VIIRS sensors over NW India(red box inside an inset map). Thermal anomaly data with confidence levels >30% for MODIS and ‘nominal’ and ‘high’ classes for VIIRS are included. Black filled circles show values for individual years (2012-2021), whereas the red dotted line represents a linear regression the statistical measures of which are given at the top left.
4 Discussion
The linear regression model correlating post-monsoon seasonal fire activities and vegetation index NDVI over NW India proposed by Jethva et al. (2019), with refinements applied in this article, offers a practical tool to predict, track, and monitor the severity of the agricultural fire season in advance about one to 2 weeks prior to the onset of a 2-month long burning season. An assessment of the predictability of such an empirical model carried out in this report using the satellite data for the years 2017–2021 shows adequate accuracy of the proposed method, in which the predicted total fire counts are found to be within 10% of the satellite-observed, near real-time data.
The concerns and general awareness about the seasonal crop residue burning and its detrimental impact on air quality and health in the region have grown in recent years, particularly after the anomalous, elevated levels of residue burning and resulting extreme bad air pollution episodes of post-monsoon 2016. With the growing attention and concern year by year, it is expected that an effective, economical, and farmer-friendly crop residue management policy will be implemented in the region to control and curb seasonal burning activities. Under such a favorable scenario, the proposed empirical prediction model discussed in this report will be further helpful in tracking and monitoring the effectiveness of the residue management policy. For instance, reduced burning activities as a result of the strict implementation of such policies would deviate (underestimation) from the expected seasonal crop fire statistics under the “as usual” scenario derived from the proposed linear model. The difference between the two, beyond the inherent uncertainties in the proposed method, can be interpreted as a net reduction in fire activities.
Beginning the post-monsoon season of 2017, the prediction of the total fire activities over NW India was announced and made available to the authorities, academic and government institutions in India, and the public in general on social media (such as Twitter) prior to the onset of seasonal burning. The Earth Observatory—an outreach platform and a part of the EOS Project Science Office at NASA Goddard Space Flight Center has referred to and highlighted the seasonal forecast values in their story/image of the day articles published around the peak time of the residue burning (first 2 weeks of November) almost every year. One such article for the year 2020 can be accessed at the URL https://earthobservatory.nasa.gov/images/147547/a-busy-season-for-crop-fires-in-northwestern-india.
The early forecast assumes importance in gauging the severity of the fire activities, thereby serving as a guideline for planning and preparedness for better management of extreme air pollution episodes. Furthermore, the prediction of the totality of seasonal fires can be useful to gauge the overall spatiotemporal variations in PM2.5 and aerosol loading over the source as well as in the downwind region by assimilating its spatial and temporal distribution over a two-month long season (based on the patterns observed during previous years) into the regional modelsfor making the short-term to even seasonal forecast. The work presented in the report meets at the intersection of land and atmosphere disciplines of Earth Science. While increasing crop production of the staple grain food of wheat and rice secures the nation’s food demand, agricultural practices and crop residue management require urgent attention, particularly in NW India, which is a major contributor to the agricultural output of the country. Until an effective, economical, and farmer-friendly crop residue management is in place, it is expected that farmers, in the wake of no other alternatives, will continue to follow the traditional burning of crop residues in open fields for clearing agricultural land.
The extreme episodes of air pollution resulting from the open field burning of residue in NW India not just affect the source region but encompasses the length and breadth of the populous IGP, as evident from ground instrumentation and satellite maps of aerosol retrievals. The PM2.5 concentration measured at ground stations in the region during the peak period of residue burning (i.e., the last week of October and the first 2 weeks of November) often exceeds the 24-h averaged safe guideline value set by WHO (the standards adopted by the Central Pollution Control Board of India) by a factor of 10–30 (8–15), leading to a situation of a public health emergency. Such hazardous level of air pollution is further enhanced by the wintertime meteorology (i.e., colder temperatures, temperature inversion, and shallower boundary layer) coupled with the possible semi-direct effect of smoke aerosols (Mhawish et al., 2022), resulting in the trapping of particulate matter near-surface.
Increasing crop fires and proportionately deteriorating air quality over IGP is a pressing concern. The work presented here stands as scientific evidence urging the policymakers in India to implement an effective, economical, and farmer-friendly crop residue management system towards eliminating the burning practice, which otherwise may continue to be responsible for the seasonal, hazardous air pollution in the region, affecting the health of millions.
Data availability statement
The MODIS NDVI dataset used in this study can be obtained from the NASA EOSDIS Land Processes Distributed Active Archive Center (LP DAAC) at https://www.earthdata.nasa.gov/eosdis/daacs/lpdaac. The thermal anomaly/fire spots data for MODIS and VIIRS sensors were obtained from the NASA Fire Information for Resource Management System (FIRMS) at https://firms.modaps.eosdis.nasa.gov/. The crop production data mentioned in the paper were accessed from the Crop Production Statistics Information System (http://aps.dac.gov.in/APY/Index.htm) designed and developed by the Agriculture Informatics Division, National Informatics Centre, Ministry of Communication and IT, Government of India. The results derived in this research report can be obtained from the author on request.
Author contributions
HJ formulated the concept, carried out all analyses presented in this research report, and wrote the manuscript. The sole author of the manuscript (HJ) conducted the research work independently out of his own research interest and as a follow-up study of the previous two research papers led by him in the same subject matter.
Acknowledgments
We acknowledge the NASA EOSDIS Land Processes Distributed Active Archive Center (LP DAAC) data portal for the online availability of the 16-day Aqua/MODIS NDVI product (MYD13C1) used in this study. The thermal anomaly/active fire data for MODIS and VIIRS sensors were obtained from the NASA Fire Information for Resource Management System (FIRMS).
Conflict of interest
The author declares that the research was conducted in the absence of any commercial or financial relationships that could be construed as a potential conflict of interest.
Publisher’s note
All claims expressed in this article are solely those of the authors and do not necessarily represent those of their affiliated organizations, or those of the publisher, the editors and the reviewers. Any product that may be evaluated in this article, or claim that may be made by its manufacturer, is not guaranteed or endorsed by the publisher.
References
Badarinath, K. V. S., Kiran Chand, T. R., and Krishna Prasad, V. (2006). Agriculture crop residue burning in the indo-gangetic plains: A study using irs-P6 AWiFS satellite data. Curr. Sci. 91 (8), 1085–1089.
Cusworth, D. H., Mickley, L. J., Sulprizio, M. P., Liu, T., Marlier, M. E., DeFries, R. S., et al. (2018). Quantifying the influence of agricultural fires in northwest India on urban air pollution in Delhi, India. Environ. Res. Lett. 13 (4), 044018. doi:10.1088/1748-9326/aab303
Didan, K. (2015). MYD13C1 MODIS/Aqua vegetation indices 16-day L3 global 0.05Deg CMG V006 [data set]. South Dakota, United States: NASA EOSDIS Land Processes DAAC.
Duxbury, J. M. (2001). Long-term yield trends in the rice-wheat cropping system. J. Crop Prod. 3 (2), 27–52. doi:10.1300/J144v03n02_02
Giglio, L., Descloitres, J., Justice, C. O., and Kaufman, Y. (2003). An enhanced contextual fire detection algorithm for MODIS. Rem. Sens. Environ. 87, 273–282. doi:10.1016/S0034-4257(03)00184-6
Giglio, L., and Justice, C. (2015). MYD14 MODIS/Aqua thermal anomalies/fire 5-min L2 Swath 1km V006 [data set]. South Dakota, United States: NASA EOSDIS Land Processes DAAC.
Giglio, L., Schroeder, W., and Justice, C. O. (2016). The collection 6 MODIS active fire detection algorithm and fire products. Rem. Sens. Environ. 78, 31–41. doi:10.1016/j.rse.2016.02.054
Gupta, P. K., Sahai, S., Singh, N., Dixit, C. K., Singh, D. P., Sharma, C., et al. (2004). Residue burning in rice–wheat cropping system: Causes and implications. Curr. Sci. 87 (12), 1713–1717.
Jethva, H., Chand, D., Torres, O., Gupta, P., Lyapustin, A., and Patadia, F. (2018). Agricultural burning and air quality over northern India: A synergistic analysis using NASA’s A-train satellite data and ground measurements. Aerosol Air Qual. Res. 18, 1756–1773. doi:10.4209/aaqr.2017.12.0583
Jethva, H., Torres, O., Field, R. D., Lyapustin, A., Gautam, R., and Kayetha, V. (2019). Connecting crop productivity, residue fires, and air quality over northern India. Sci. Rep. 9, 16594. doi:10.1038/s41598-019-52799-x
Kaskaoutis, D. G., Kumar, S., Sharma, D., Singh, R. P., Kharol, S. K., Sharma, M., et al. (2014). Effects of crop residue burning on aerosol properties, plume characteristics, and long-range transport over northern India. J. Geophys. Res. Atmos. 119, 5424–5444. doi:10.1002/2013JD021357
Kumar, P., Kumar, S., and Joshi, L. (2015). Socioeconomic and environmental implications of agricultural residue burning, A case study of Punjab India. Springer Briefs in Environmental Science. doi:10.1007/978-81-322-2014-5_2
Liu, T., Mickley, L. J., Gautam, R., Singh, M. K., DeFries, R. S., and Marlier, M. E. (2021). Detection of delay in post-monsoon agricultural burning across Punjab, India: Potential drivers and consequences for air quality. Environ. Res. Lett. 16, 014014. doi:10.1088/1748-9326/abcc28
Mhawish, A., Sarangi, C., Babu, P., Kumar, M., Bilal, M., and Qiu, Z. (2022). Observational evidence of elevated smoke layers during crop residue burning season over Delhi: Potential implications on associated heterogeneous PM2.5 enhancements. Rem. Sens. Environ. 280, 113167. doi:10.1016/j.rse.2022.113167
Parayil, G. (1992). The Green Revolution in India: A Case Study of Technological Change. Technol. Cult. 33 (4), 737–756. doi:10.2307/3106588
Pingali, P. (2012). Green Revolution: Impacts, limits, and the path ahead. Proc. Natl. Acad. Sci. 109 (31), 12302–12308. doi:10.1073/pnas.0912953109
Keywords: crop residue fires, NDVI, post-monsoon, Northwestern India, prediction, assessment, MODIS
Citation: Jethva H (2022) Assessing predictability of post-monsoon crop residue fires in Northwestern India. Front. Earth Sci. 10:1047278. doi: 10.3389/feart.2022.1047278
Received: 17 September 2022; Accepted: 08 December 2022;
Published: 20 December 2022.
Edited by:
Parth Sarathi Mahapatra, Deutsche Gesellschaft für Internationale Zusammenarbeit (GIZ) GmbH, IndiaReviewed by:
Asish Saha, University of Burdwan, IndiaVignesh Prabhu, Center for Study of Science, Technology and Policy—CSTEP, India
Copyright © 2022 Jethva. This is an open-access article distributed under the terms of the Creative Commons Attribution License (CC BY). The use, distribution or reproduction in other forums is permitted, provided the original author(s) and the copyright owner(s) are credited and that the original publication in this journal is cited, in accordance with accepted academic practice. No use, distribution or reproduction is permitted which does not comply with these terms.
*Correspondence: Hiren Jethva, aGlyZW4udC5qZXRodmFAbmFzYS5nb3Y=