 Fan Yuchen1
 Liu Keyu1,2*
- 1Shandong Provincial Key Laboratory of Deep Oil and Gas, Qingdao, China
- 2Laboratory for Marine Mineral Resources, Qingdao National Laboratory for Marine Science and Technology, Qingdao, China
Focused ion beam scanning electron microscopy (FIB-SEM) is a commonly used three-dimensional (3D) pore-network reconstruction method for shales due to its unique capability in imaging nano-scale pores. However, it has been found that for pore space of lacustrine shales with strongly heterogeneous pore structures, the conventional FIB-SEM 3D models usually with dimensions of 10 μm × 10 μm × 10 μm cannot adequately characterize the pore structures as the representative element volume required is much larger than the FIB models. Here, we propose to utilize large volume FIB-SEM (LV-FIB-SEM) 3D models to resolve this challenge. The LV-FIB-SEM model has a significant enhancement in the model size compared with the commonly used conventional FIB-SEM models and a much higher spatial resolution than non-synchrotron nano X-ray CT models for similar imaging sample sizes. With 75 μm × 65 μm × 60 μm as predesigned reconsruction size, after image processing two LV-FIB-SEM 3D models with sizes of 73.56 μm × 38.13 μm × 52.59 μm and 74.01 μm × 43.05 μm × 42.00 μm and model resolution of 30 nm were reconstructed and quantitatively analyzed. When use the conventional FIB-SEM models of 10 μm × 10 μm × 10 μm, the relative deviations between the porosities derived from 100 stochastic models and the average porosity for the two samples studied are −41.13% ∼ +87.31% and −51.66% ∼ +56.05%, respectively, indicating that such small models are not representative of the actual pore structure of the shales investigated. When the model sizes have been increased by 96 times volumetrically, the probabilities of matching average porosities for the two samples increase from 13% to 86% and from 12% to 100%, respectively. This research demonstrates that the upsizing of the FIB-SEM models enables an effective improvement on the representativeness of shale pore structures characterized. It is recommended that LV-FIB-SEM 3D reconstruction be employed to study pore space of lacustrine shales with strongly heterogeneous pore structures, which would enable a more accurate characterization and evaluation of reservoirs for shale oil exploration and development.
Introduction
Nano scale pores are extensively developed in shale reservoirs (Curtis et al., 2012; Loucks et al., 2012; Clarkson et al., 2013). Adequately characterizing nanopore 3D structures of shales is essential for recognizing favorable shale reservoirs (Iglauer and Lebedev, 2018; Wu et al., 2019). FIB-SEM has been routinely used to characterize the 3D distribution of nanopores in shales. Lemmens et al. (2011) used the FIB-SEM 3D reconstruction for the first time to obtain a digital rock (DR) model of shale with dimensions of 15 μm × 15 μm × 1.3 μm, and demonstrated that the FIB-SEM tomography technology is a quite promising new method for characterizing shale pore network, because it has the spatial resolution required to describe the size and geometric features of nanopores. The FIB-SEM 3D reconstruction technique has since been widely used in studying shales worldwide. Dewers et al. (2012) systematically studied the pore-throat diameter distribution, pore connectivity and pore tortuosity of a shale using a 6.6 μm × 3.1 μm × 7.1 μm FIB-SEM 3D model. Yoon and Dewers (2013) investigated the impact of pore structures on fluid transport properties using a 16 μm × 10 μm × 15 μm FIB-SEM 3D model. Shabro et al. (2014) studied the resistivity and permeability at the nanopore scale using a 4.4 μm × 4.4 μm × 4.4 μm organic-rich mudstone model reconstructed by FIB-SEM. Ma et al. (2015) analyzed the preservation mode of shale gas according to the pore geometry characteristics derived from a FIB-SEM 3D model of 7.3 μm × 7.3 μm × 5 μm. Bai et al. (2016) investigated the pore network model of shales in Quebec, Canada segmented from the FIB-SEM 3D model with dimensions of 9.9 μm × 9.1 μm × 10 μm.
However, with increasing application of FIB-SEM 3D reconstruction in characterizing shales, it has been realized that the FIB-SEM model commonly in dimensions of around 10 μm × 10 μm × 10 μm can no longer be representative for most heterogeneous shales. Affected by a strong heterogeneous pore distribution, the conventional-sized FIB-SEM 3D model is insufficient to represent the real pore structure characteristics in shales (Liu et al., 2009; Wu et al., 2020; Wu et al., 2022). Various attempts have been made to address this issue by various researchers using other approaches. Hemes et al. (2015) combined FIB-SEM 3D models and micron X-ray CT 3D models to calculate representative multi-scale pore size distributions and pore throat distributions. Peng et al. (2015) proposed a theoretical model based on data of FIB-SEM reconstruction, micron X-ray CT imaging and high-pressure mercury injection experiment to predict representative permeabilities of shales. Yang et al. (2015) used the multi-point geostatistics method to reconstruct and superimpose digital rock models of different scales to obtain representative shale pore structures. Kelly et al. (2016) proposed to randomly reconstruct the FIB-SEM 3D models at different locations of the same sample and then unify the pore structure features extracted from several models to improve the representativeness of the characterizing results. Gholinia et al. (2020) employed broad ion beam-scanning electron microscopy (BIB-SEM) and obtained a shale digital rock model with a size of 500 μm × 500 μm × 5.3 μm. This technique is good at making 3D models with large length and width. However, the thickness of the reconstructed models is generally quite limited because it would take about up to 30 min for milling and imaging per slice. The voxel size of the BIB-SEM models is 240 nm × 240 nm × 20 nm, insufficient for characterizing shale pores. Fan et al. (2022) developed a fractal method to compute representative pore size distribution curves based on both FIB-SEM models and micron X-ray CT models.
At present, most of methods proposed to enhance the representativeness of digital rock characterizing results are based on prediction models or multiple experiments. There lacks a unified solution to effectively acquire representative data via a single experiment credibly. How to effectively overcome the heterogeneity of pore distribution to obtain real and credible shale pore structure features remains unresolved. This paper proposes to break the previously routine model size of approximately 10 μm × 10 μm × 10 μm reconstructed by FIB-SEM. A large-volume FIB-SEM (LV-FIB-SEM) 3D reconstruction technique was employed to characterize 3D pore structures of shales. LV-FIB-SEM models generally refer to digital rock models with size larger than or equal to 50 μm × 50 μm × 50 μm, because this size is more than 100 times larger than the conventional size of 10 μm × 10 μm × 10 μm, and approaches the upper limit of 3D reconstruction size by FIB-SEM.
Samples
The two shale samples used in this study were selected from the second member of the Palaeogene Kongdian Formation (Ek2) in the Cangdong Sag, Bohai Bay Basin, China. The Ek2 formation is a typical continental shale characterized by mixed sedimentation and strong heterogeneities (Pu et al., 2016; Zhao et al., 2018). The mineral compositions and lithofacies type of the samples are shown in Table 1. The felsic mineral contents of both samples are over 50%, typical of felsic shales. The main difference between the two samples is the clay mineral content. The clay mineral content of sample G1 is 3.33%, while that of sample G2 is 11.22%. The contents of total organic carbon (TOC) for samples G1 and G2 are 4.82% and 5.53%, respectively. The vitrinite reflectance (Ro %) values of the samples are 0.7%–1.0%, within an oil generation window (Ma et al., 2020; Xin et al., 2021). The organic matter in the samples are primarily oil (bitumen) migrated from the adjacent source rock (Li et al., 2020). The storage space is dominated by nano- and micron-scale inter-grain pores. Microfractures such as interlayer fractures and diagenetic shrinkage fractures are also relatively well developed (Guan et al., 2020; Xin et al., 2022).
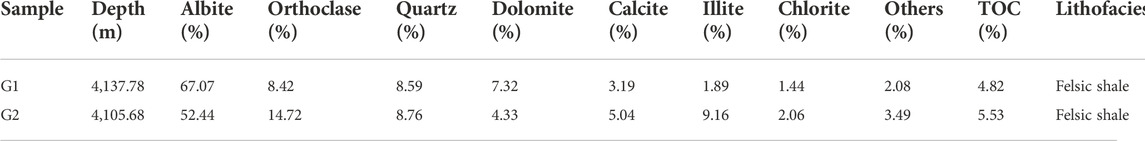
TABLE 1. Summary of mineral compositions and lithofacies of investigated samples.
Methods
Shale sample blocks of 5–10 mm long and wide, and a thickness of 5 mm were prepared for FIB-SEM imaging. The surface of the rock block was polished with argon ion beam to obtain a flat surface for SEM imaging. Conductive silver paste was coated on the four sides and the bottom of the polished block samples to reduce charge accumulation on the sample surface and improve the imaging quality.
A Zeiss crossbeam 550 focused ion beam scanning electron microscope was used to reconstruct 3D models. The pre-designed models have sizes of 75 μm × 65 μm × 60 μm, approximately 293 times larger than the conventional FIB-SEM models of 10 μm × 10 μm × 10 μm. After rotating the sample stage by 54° and focusing the electron beam and ion beam, a trapezoidal trench was cut with the gallium ion beam of 30 kV and 65 nA, and two ear trenches were cut with the gallium ion beam of 30 kV and 30 nA. The trapezoidal trench and ear trenches define the 3D reconstruction area (Figure 1A). Rough polishing and fine polishing are then performed on the cross section of the sample using ion beam with a low voltage and current (Figure 1A). Slices with thickness of 30 nm were consecutively cut by ion beam of 30 kV and 7 nA, with each new-exposed surface being imaged using an electron beam of 1 kV and 500 pA (Figure 1B). The image resolution (pixel size) of the sliced SEM image is 30 nm × 30 nm. Both the sample pre-treatment and image acquisition are quite time-consuming. The whole 3D reconstructing process was thus divided into two steps. First, complete the sample pre-treatment including trapezoidal and ear trenching, rough and fine polishing (Figure 1A), which would usually take about 19 h. Consecutive slicing and imaging were then performed on the pre-treated sample, which usually requires 45 h (Figure 1B).
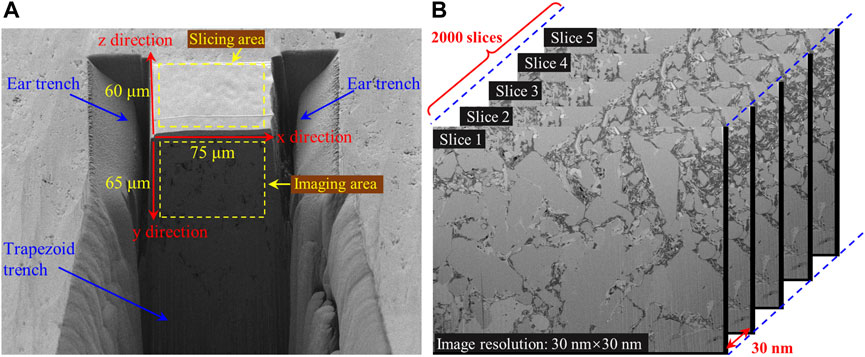
FIGURE 1. Schematic diagram of large-volume 3D reconstruction using FIB-SEM. (A) Pre-treatment of the sample for 3D reconstruction showing the positions of the trapezoidal and ear trenches and the imaging area; and (B) stacked SEM slices illustrating the consecutive slicing process.
Compared with the conventional FIB-SEM 3D model, the process for making a LV-FIB-SEM model is quite lengthy. The FIB-SEM has a limitation on the continuous operating time. Interruptions may occur during the consecutive slicing and imaging process if the operating time exceeds the limitation. Therefore, one should choose an appropriate SEM imaging resolution according to the sample characteristics (median pore size) to minimize the time required for imaging. The time save from a short SEM imaging process can be used to construct larger volume 3D models. For example, the maximum continuous working time for consecutive slicing and imaging by the Zeiss Crossbeam 550 FIB-SEM in this research is 48 h. Under this time frame, we have set 30 nm as our detection resolution during the image acquisition, so a complete set of 2,000 SEM images can be sliced and imaged continuously without interruption. We have finally obtained a LV-FIB-SEM 3D model with lengths of 75 μm in x direction, 65 μm in y direction and 60 μm in z direction (Figure 1). In contrast, if the detection resolution of SEM imaging is set too high, e.g., 5 nm, only the conventional FIB-SEM 3D model (10 μm × 10 μm × 10 μm) can be obtained within the operating time limit. In our case a 30 nm detection resolution is quite adequate for characterizing the shale oil reservoir samples, because it has been shown that oil can only migrate into or produced from pores larger than 50 nm (Li et al., 2019; Liu, 2021).
Results of large volume focused ion beam scanning electron microscopy 3D reconstruction
LV- FIB-SEM 3D reconstruction was used to obtain digital rock models with pre-designed sizes of 75 μm × 65 μm × 60 μm for shale samples G1 and G2. After necessary image cropping for alignment and artifact removing, digital rock models of 73.56 μm × 38.13 μm × 52.59 μm and 74.01 μm × 43.05 μm × 42.00 μm were finally obtained (Figure 2). The pore space of Sample G1 consists primarily of some inter-grain granular pores with bitumen filling in (Figure 2A). The 3D pore-network model of Sample G1 was generated by segmenting the void pores and bitumen-bearing pores from the original digital rock model according to the gray-scale (Figure 2B). The storage space of Sample G2 is dominated by some inter-grain slit-pores, which are also filled with bitumen (Figure 2C). Inter-grain slit-pores are interconnected, forming a large interconnected percolation network (Figure 2D). The conventional FIB-SEM 3D models with sizes of 10 μm × 10 μm × 10 μm are also marked by green cubes in Figures 2B,D, which are much smaller than LV-FIB-SEM 3D models. The close-up view of the pore-network model shows that pores in Sample G1 are irregular and connected by cylindrical throats (Figure 2E). The close-up view of percolation network of Sample G2 is shown in Figure 2F, in which the hollow regions (red arrow indicating area) are the distributing locations of mineral particles wrapped by inter-grain slit-pores.
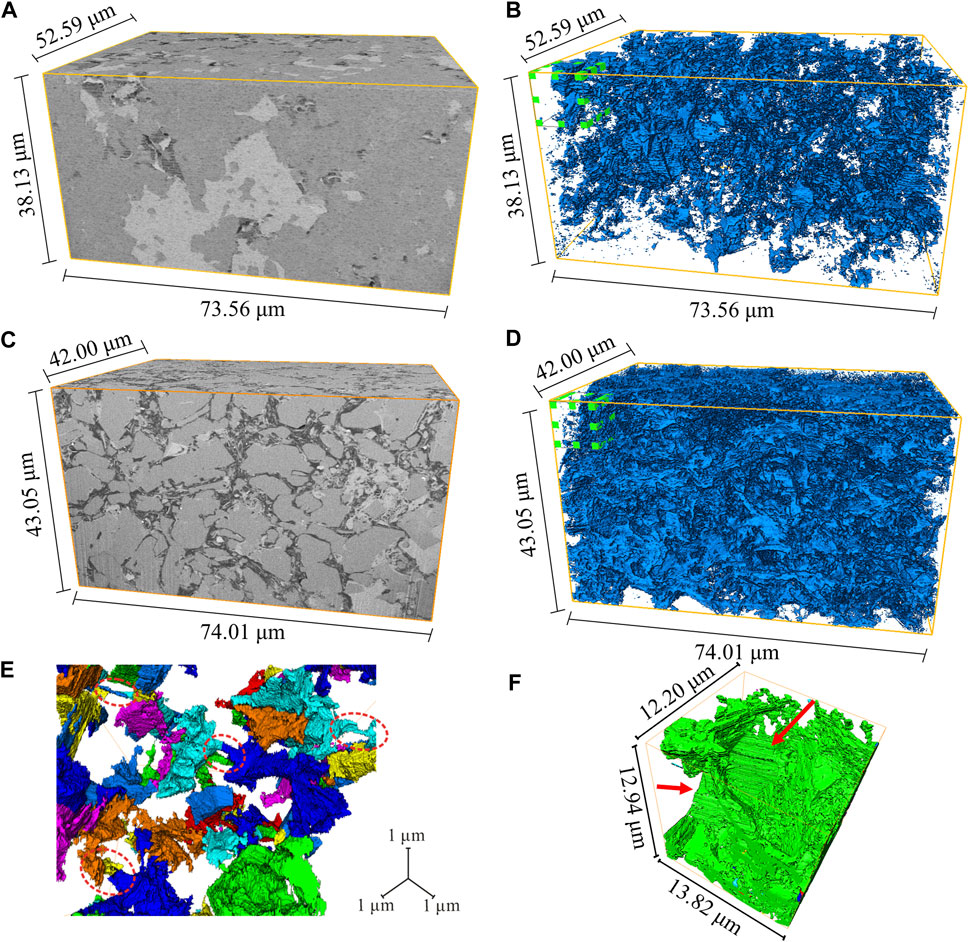
FIGURE 2. Digital rock models of samples G1 and G2 derived from LV-FIB-SEM 3D reconstruction. (A–D) Digital rock models and pore network models of samples G1 and G2, respectively; (E,F) close-up view of the structure of granular pores and slit-like pores in samples G1 and G2, respectively.
The LV-FIB-SEM model of sample G1 has a porosity of 3.85%. The predominant pore volume is provided by granular pores with equivalent diameters of 1–4 μm shown by the pore size distribution curve (Figure 3A). The equivalent diameter of pore throats is mainly range in 7.25–400.00 nm (Figure 3B). The coordination number of granular pores ranges from 1 to 20, with an average of 3.18, indicating the presence of numerous connecting channels between pores. The volume fraction of the largest interconnected pore cluster is 4.41%, accounting for 47.31% of the total pore space. This indicate that pores are interconnected over a large domain.
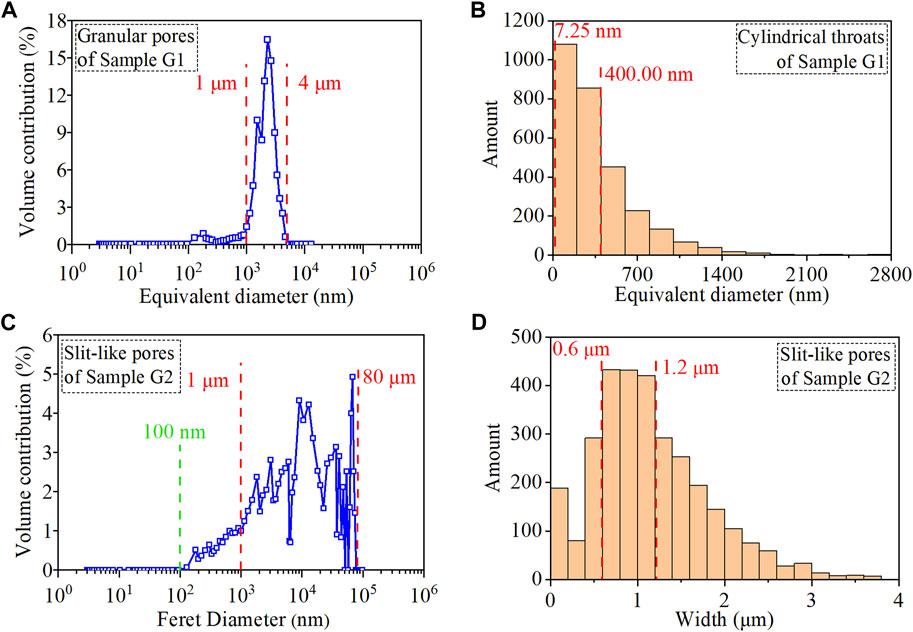
FIGURE 3. Quantitative analysis of LV-FIB-SEM 3D pore-network models. (A) Volume contribution distribution of granular pores and (B) diameter distribution of cylindrical pore throats of Sample G1; (C) volume contribution distribution of slit-pores and (D) width distribution of slit-pores of Sample G2.
The LV-FIB-SEM model porosity of Sample G2 is 8.33%. The storage space for this sample is provided by slit-pores with Feret diameters of 100 nm–80 μm, of which the largest contribution is made by slit-pores of 1–80 μm (Figure 3C). The Feret diameter represents the length of slit-pores in their largest extension direction. Since the storage space of Sample G2 is dominated by slit pores, the width of these slit-pores were counted statistically, which shows a dominant range of 0.6–1.2 μm (Figure 3D). The volume fraction of the largest interconnected pore clusters is 11.46%, accounting for 96.14% of the total pore volume. This indicates slit-pores can interconnect over an extremely large domain.
Verification of large volume focused ion beam scanning electron microscopy models
What is the specific difference between the LV-FIB-SEM model and the conventional (10 μm × 10 μm × 10 μm) FIB-SEM model? Would the upscaling in model size improve the representativeness and accuracy of the pore structure characterizing results? We compared the porosity of FIB-SEM models of different sizes to analyze the effect of FIB-SEM model sizes on the pore structure characterizing results.
Representative element volume of focused ion beam scanning electron microscopy models
The porosity of the digital rock models would change regularly with a gradual increasing model size. Generally, porosity would go through a period of instability firstly and then become stable gradually. When the porosity begins to stabilize, the corresponding model size is then referred to the representative element volume (Bear and Braester, 1972; Baveye and Sposito, 1984). The 3D pore structure characterizing results would become representative and credible only when the analyzed model has a size larger than REV (Costanza-Robinson et al., 2011; Adeleye and Akanji, 2017).
The conventional FIB-SEM model size of 10 μm × 10 μm × 10 μm is used as a base model size. When the model is increased by 10 times by volume, the measured model porosity of Sample G1 is 3.83% (Figure 4A). The model porosity would decrease from 3.83% to 3.40% gradually in the process of increasing model size by 40 times. Then, the porosity gradually increases until the model size increased to 120 times. Afterwards the model porosity reaches a stable level around 3.85% (Figure 4A). Therefore, the model size of 68 μm × 50 μm × 36 μm corresponding to the 120-times upscaling can be determined to be the REV size for the pore space of Sample G1.
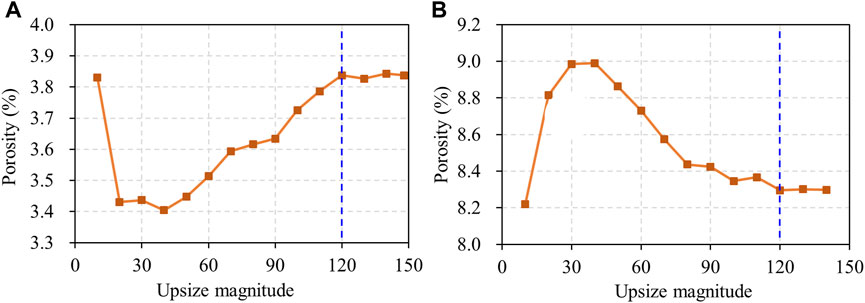
FIGURE 4. Porosity evolution with the increasing model size, showing the size of the representative volume element (REV) of Sample G1 (A) and Sample G2 (B) at an upsizing of 120 times.
The porosity of Sample G2 increases from 8.32% to 8.99% with the upsizing of model, and then decreases gradually. Coincidentally, the model porosity also begins to stabilize around 8.30% when the model size is increased by 120 times from the base model (Figure 4B). The corresponding model size of 71 μm × 42 μm × 41 μm is thus determined to be the REV size for the pore space of Sample G2. The digital rock models of samples G1 and G2 obtained via the LV-FIB-SEM 3D reconstruction are of 73.56 μm × 38.13 μm × 52.59 μm and 74.01 μm × 43.05 μm × 42.00 μm, respectively. The LV-FIB-SEM model sizes of the two samples are larger than their respective REV sizes, indicating that the pore structure information extracted from these two LV-FIB-SEM models would be credible and representative.
Stochastic analysis of conventional focused ion beam scanning electron microscopy models
The conventional small-volume model refers to the digital core model of 10 μm × 10 μm × 10 μm. One hundred small-volume models were selected at random positions in samples G1 and G2. Figures 5A–C shows the random small-volume models of Sample G1. The pore structures of the random models displayed in Figures 5A,C are relatively similar, both showing relatively discrete pore distribution. However, they are quite different from the pore structure of the random model shown in Figure 5B, which displays an extensively connected pore-network. Figures 5D–F shows the random small-volume models of Sample G2. The pore structures of the three random models are quite different between each other. The pores space shown in Figure 5D has a large interconnected network. Figure 5E exhibits a discrete distribution of small isolated pores. However, the model shown in Figure 5F has fewer pores but a relatively good local connectivity. Qualitative observation demonstrates that affected by the pore distribution heterogeneity, the pore structure characteristics displayed in the 10 μm × 10 μm × 10 μm digital core models can be quite variable. The true and representative pore structure characteristics cannot be extracted from such individual small-size models.
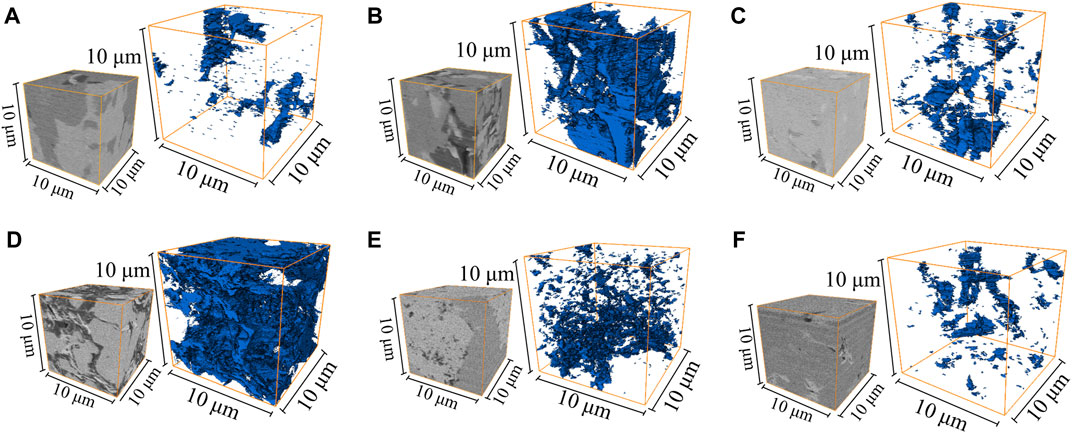
FIGURE 5. Random 10 μm × 10 μm × 10 μm FIB-SEM digital rock models reconstructed from Sample G1 (A,B,C) and Sample G2 (D,E,F), showing distinct variability.
The porosities of 100 random small-volume models of Sample G1 distribute in the range of 0.26%–25.06%, with an average of 4.17% (Figure 6A). The average porosity is regarded as the “true” porosity of the sample investigated. The range −10% ∼ +10% to the average porosity is considered as a reasonable error range for the sample porosity. Therefore, the statistically acceptable porosity range of Sample G1 is 3.75%–4.58%, which is marked by a green rectangular area in Figure 6A. It can be seen that only a few porosity values fall within the green rectangular area. The majority of porosities of the random small-volume models fall outside the statistically acceptable porosity range. In addition, the relative deviations of the small-volume model porosities to their average porosity (4.17%) have also been calculated. The maximum positive relative deviation is +549.45%, and the maximum negative relative deviation is −93.04% (Figure 6C). The average positive relative deviation is +87.31%, and the average negative relative deviation is −41.13%. These high relative deviations indicate large differences between porosities of random small-volume models and the true porosity. There is only 13% probability that the porosities of the random small-volume models are within relative deviation of −10% ∼ +10% (Figure 6E), which is corresponding to the porosity range of 3.75%–4.58%. The probability of obtaining a statistically unacceptable porosity value is up to 87%. Among them, there is a 17% probability of porosities being in the relative deviation range of −40% ∼ −60%, and a 13% probability of porosities being in the range of +20% ∼ +40% (Figure 6E).
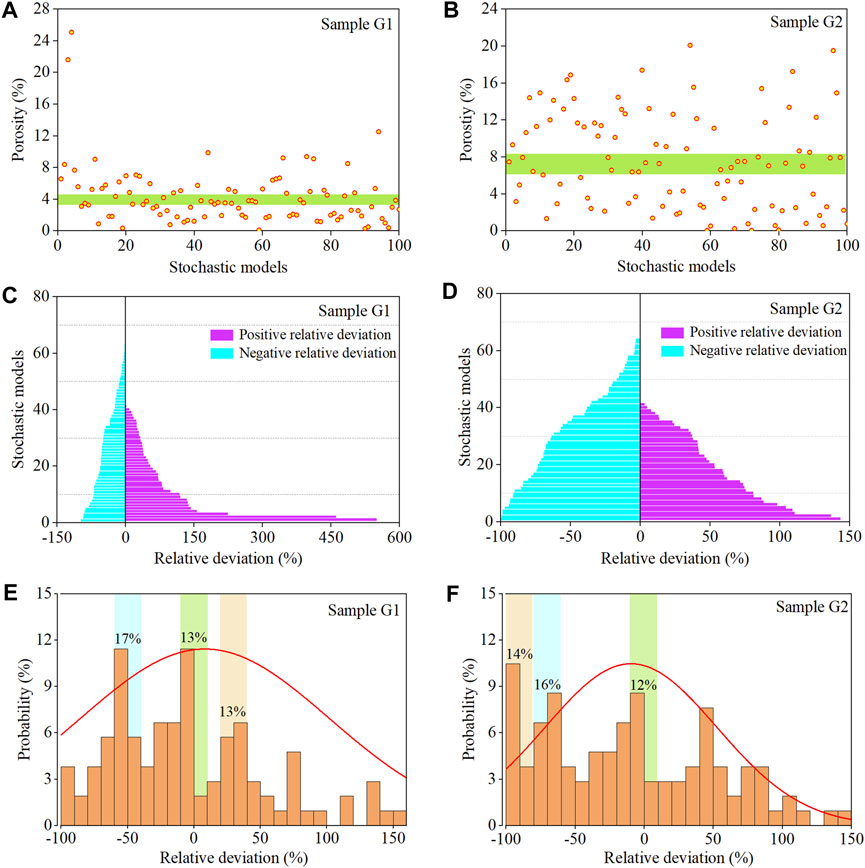
FIGURE 6. (A,B), the porosity distribution of random small-volume models of samples G1 and G2; (C,D), the relative deviations to the average porosity of samples G1 and G2; (E,F), probability distribution of relative deviations of samples G1 and G2.
The porosities of 100 random small-volume models of Sample G2 are in the range of 0.03%–20.07%, with an average porosity of 7.45%. The statistically acceptable porosity range of Sample G1 is 3.75%–4.58%. Similar to the Sample G1, only a few random models have porosities within the statistically acceptable range (Figure 6B). The maximum positive relative deviation to the average porosity is +143.29%, whereas the maximum negative relative deviation is −99.68% (Figure 6D). The average positive relative deviation is +56.05%, and the average negative relative deviation is −51.66%. There is only 12% probability that the random model porosities fall within the statistically acceptable deviation range (6.71%–8.19%), while there is an extremely high probability (88%) that the model porosities are unrealistic (Figure 6F). The probability of porosity within the deviation range of −60% ∼ −80% is up to 16%, while the probability within the deviation range of −80% ∼ −100% is 14% (Figure 6F).
Stochastic analysis demonstrates that the pore structure information extracted from the small-volume digital rock models would vary greatly. There is a high probability that the true pore structure information cannot be obtained. The conventional FIB-SEM models of 10 μm × 10 μm × 10 μm are not large enough to provide representative pore structure characteristics.
Stochastic analysis of upsized focused ion beam scanning electron microscopy models
The small-volume FIB-SEM models (10 μm × 10 μm × 10 μm) are upsized by 8 times, 48 times and 96 times to study the impact of upscaling on the pore-network model representativeness, with corresponding model sizes of 20 μm × 20 μm × 20 μm, 40 μm × 40 μm × 30 μm and 60 μm × 45 μm × 35.5 μm, respectively. When the small-volume models of Sample G1 are upsized by 8 times, the porosity distribution ranges of the 100 random models narrow from 0.26%–25.06% to 1.31%–9.71%. After the upsizing of 48 and 96 times, the porosity distribution ranges further converge to 2.67%–5.21% and 3.41%–4.35%, respectively (Figure 7A), which gradually approach the statistically acceptable porosity distribution range (3.75%–4.58%) shown by the green rectangular area in Figure 6A. The relative deviations to the average porosity are still up to −65.99% ∼ +151.48% after an upsize of 8 times. At an upsize of 48 times the relative deviation narrows to −30.67% ∼ +34.85% and finally converge to −11.78% ∼ +12.79% after an upsize of 96 times (Figure 7B). The gradual decreased relative deviations indicate that the obtained pore structure characteristics slowly approach their true occurrence.
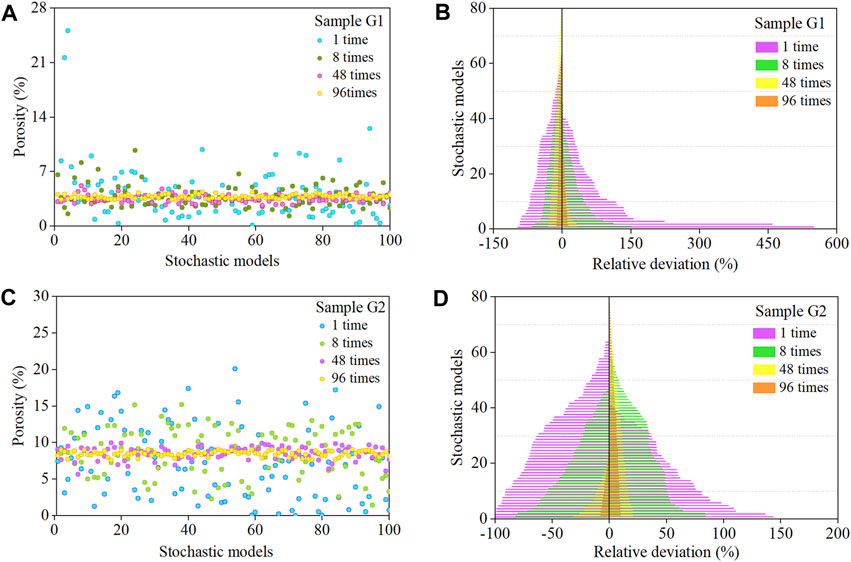
FIGURE 7. (A) Porosity distribution and (B) porosity relative deviation distribution of the conventional small-size FIB-SEM (10 μm × 10 μm × 10 μm) stochastic models (1x) and 8x, 48x, and 96x upsized stochastic models for Sample G1. (C,D) porosity distribution and the porosity relative deviation distribution plots for Sample G2.
Similarly, when the small-volume models of Sample G2 are upsized by 8 times, the porosity distribution ranges of 100 random models narrow from 0.02%–20.07% to 2.31%–15.19%. As the size is gradually upsized to 96 times, the porosity distribution range is further converged to 7.62%–9.06% (Figure 7C), which is quite close to the statistically acceptable porosity distribution range of 6.71%–8.19% (Figure 6B). When the small-volume models are upsized by 8 times, the relative deviations to the average porosity narrow from −99.68% ∼ +143.29% to −72.00% ∼ +84.23%, and finally converge to −6.3% ∼ +9.81% after 96-time upsizing (Figure 7D).
When the small-volume models of Sample G1 are upsized by 8 times, the probability of the relative deviation falling within −10% ∼ +10% (statistically acceptable range of porosity) is 26% (Figure 8A). When the model size is upsized by 48 times and 96 times, the probability increases markedly to 58% and 86%, respectively (Figures 8B,C). The gradual increased probability of acceptable relative deviation can also be reflected by their normal fitting curves, which transform from a relatively broad pattern to a relatively concentrated pattern during the upsizing process of 8 times to 96 times. For Sample G2, the probability of the relative deviation falling in the acceptable deviation range is 16% at 8-time upsizing (Figure 8D). When the model is upsized by 48 times, the probability increases significantly to 67% (Figure 8E). After the model is upsized to 96 times, the probability of the random models falling within the statistically acceptable porosity range reach 100% (Figure 8F).
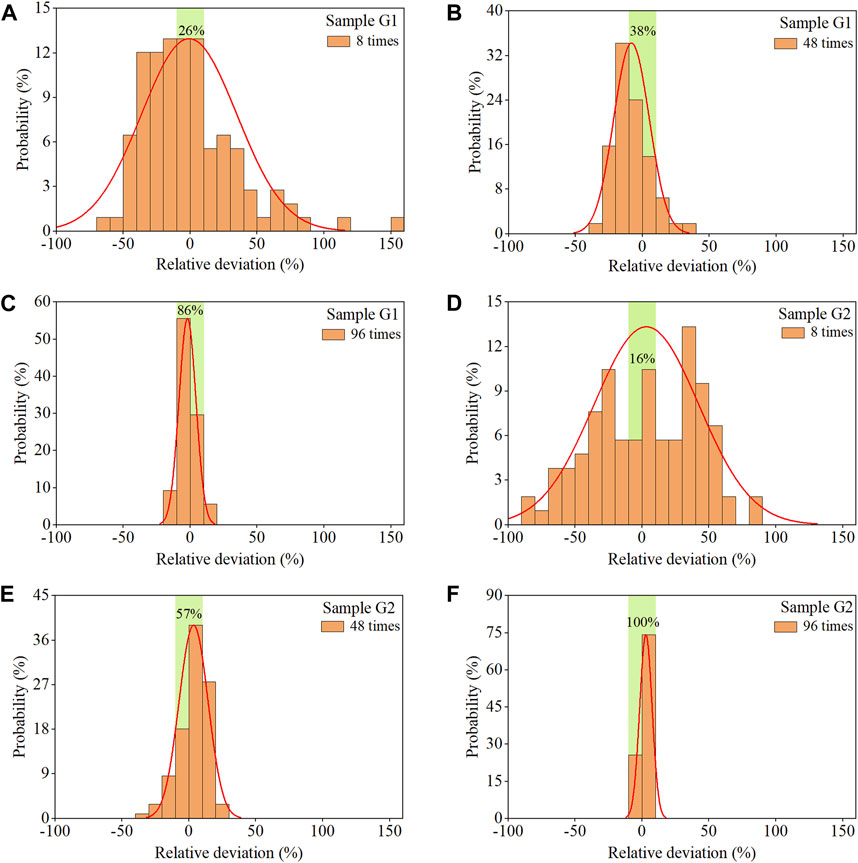
FIGURE 8. Probability distribution of relative deviations to the average porosity, for models upsized by 8 times (A,D), 48 times (B,E) and 96 times (C,F) of samples G1 and G2, respectively.
As the size of the digital rock model is upsized from 10 μm × 10 μm × 10 μm (1x) to 60 μm × 45 μm × 35.5 μm (96x), the model porosity distribution of samples G1 and G2 rapidly approaches to the reasonable error range of the true porosity. The probability of obtaining a true porosity value increases from 13% to 86% and from 12% to 100%, respectively. The stochastic analyses demonstrate that the size increase of the FIB-SEM models can effectively improve the accuracy and representativeness of pore structure characterizing results.
Conclusion
As we have demonstrated, LV-FIB-SEM 3D reconstruction is able to achieve adequate pore space characterization of lacustrine shales with heterogeneous pore structures by using a relatively large volume. The LV-FIB-SEM 3D models we have obtained in this study are at least two orders of magnitude of the conventional FIB-SEM models with sizes of 10 μm × 10 μm × 10 μm. The detection resolution of LV-FIB-SEM model is much higher than that from nano X-ray CT imaging, enabling an effective differentiation of minerals, bitumen and pores. Due to the significant increase in the 3D reconstruction volume, the quantitative results of the LV-FIB-SEM models are much more representative than that of the conventional FIB-SEM models. This allows us to obtain realistic pore structure features more accurately. The LV-FIB-SEM 3D reconstruction technique is an effective method for studying pore structures of strongly heterogeneous lacustrine shales.
Data availability statement
The original contributions presented in the study are included in the article/supplementary material, further inquiries can be directed to the corresponding author.
Author contributions
All authors listed have made a substantial, direct, and intellectual contribution to the work and approved it for publication.
Funding
This research was financially supported by the Major Research Project on the Tethys Geodynamic System from the National Science Foundation of China (No. 92055204), the Shandong Provincial Government on “Continental shale oil accumulation mechanisms and prediction techniques in the Jiyang Depression” (No. 2020ZLYS08), the 14th Five-Year Plan Major Project of the National Laboratory for Marine Science and Technology (2021QNLM020001).
Acknowledgments
Ms. Chunyu Li, the Laboratory manager of Shandong Provincial Key Laboratory of Deep Oil and Gas, China University of Petroleum, Qingdao, China is thanked for her help in acquiring the FIB-SEM images.
Conflict of interest
The authors declare that the research was conducted in the absence of any commercial or financial relationships that could be construed as a potential conflict of interest.
Publisher’s note
All claims expressed in this article are solely those of the authors and do not necessarily represent those of their affiliated organizations, or those of the publisher, the editors and the reviewers. Any product that may be evaluated in this article, or claim that may be made by its manufacturer, is not guaranteed or endorsed by the publisher.
References
Adeleye, J. O., and Akanji, L. T. (2017). Pore-scale analyses of heterogeneity and representative elementary volume for unconventional shale rocks using statistical tools. J. Pet. Explor. Prod. Technol. 8 (3), 753–765. doi:10.1007/s13202-017-0377-4
Bai, B., Sun, Y., and Liu, L. (2016). Petrophysical properties characterization of Ordovician Utica gas shale in Quebec, Canada. Petroleum Explor. Dev. 43 (1), 74–81. doi:10.1016/S1876-3804(16)30008-8
Baveye, P., and Sposito, G. (1984). Reply [to “comment on ‘the operational significance of the continuum hypothesis in the theory of water movement through soils and aquifers’ by P. Baveye and G. Sposito”]. Water Resour. Res. 20 (5), 1295–1296. doi:10.1029/wr021i008p01295
Bear, J., and Braester, C. (1972). On the flow of two immscible fluids in fractured porous media. Dev. Soil Sci. 2, 177–202. doi:10.1016/S0166-2481(08)70538-5
Clarkson, C. R., Solano, N., Bustin, R. M., Bustin, A. M. M., Chalmers, G. R. L., He, L., et al. (2013). Pore structure characterization of North American shale gas reservoirs using USANS/SANS, gas adsorption, and mercury intrusion. Fuel 103, 606–616. doi:10.1016/j.fuel.2012.06.119
Costanza-Robinson, M. S., Estabrook, B. D., and Fouhey, D. F. (2011). Representative elementary volume estimation for porosity, moisture saturation, and air-water interfacial areas in unsaturated porous media: Data quality implications. Water Resour. Res. 47 (7), W07513. doi:10.1029/2010WR009655
Curtis, M. E., Cardott, B. J., Sondergeld, C. H., and Rai, C. S. (2012). Development of organic porosity in the Woodford Shale with increasing thermal maturity. Int. J. Coal Geol. 103, 26–31. doi:10.1016/j.coal.2012.08.004
Dewers, T. A., Health, J., Ewy, R., and Duranti, L. (2012). Three-dimensional pore networks and transport properties of a shale gas formation determined from focused ion beam serial imaging. Int. J. Oil Gas. Coal Trans. 5 (2-3), 229–248. doi:10.1504/IJOGCT.2012.046322
Fan, Y., Liu, K., Yu, L., Liu, J., and Regenauer-Lieb, K. (2022). Assessment of multi-scale pore structures and pore connectivity domains of marine shales by fractal dimensions and correlation lengths. Fuel 330, 125463. doi:10.1016/j.fuel.2022.125463
Gholinia, A., Curd, M. E., Bousser, E., Taylor, K., Hosman, T., Coyle, S., et al. (2020). Coupled broad ion beam–scanning electron microscopy (BIB–SEM) for polishing and three dimensional (3D) serial section tomography (SST). Ultramicroscopy 214, 112989. doi:10.1016/j.ultramic.2020.112989
Guan, M., Liu, X., Jin, Z., and Lai, J. (2020). The heterogeneity of pore structure in lacustrine shales: Insights from multifractal analysis using N2 adsorption and mercury intrusion. Mar. Pet. Geol. 114, 104150. doi:10.1016/j.marpetgeo.2019.104150
Hemes, S., Desbois, G., Urai, J., Schroppel, B., and Schwarz, J. (2015). Multi-scale characterization of porosity in Boom Clay (HADES-level, Mol, Belgium) using a combination of X-ray μ-CT, 2D BIB-SEM and FIB-SEM tomography. Microporous Mesoporous Mat. 208, 1–20. doi:10.1016/j.micromeso.2015.01.022
Iglauer, S., and Lebedev, M. (2018). High pressure-elevated temperature x-ray micro-computed tomography for subsurface applications. Adv. Colloid Interface Sci. 256, 393–410. doi:10.1016/j.cis.2017.12.009
Kelly, S., Ei-Sobky, H., Torres-Verdin, C., and Balhoff, M. T. (2016). Assessing the utility of FIB-SEM images for shale digital rock physics. Adv. Water Resour. 95, 302–316. doi:10.1016/j.advwatres.2015.06.010
Lemmens, H. J., Butcher, A. R., and Botha, P. W. S. K. (2010). FIB/SEM and SEM/EDX: A new dawn for the SEM in the core lab? Petrophysics 52 (06), 452–456. doi:10.1007/s12182-011-0169-2
Li, M., Chen, Z., Ma, X., Cao, T., Qian, G., Jiang, Q., et al. (2019). Shale oil resource potential and oil mobility characteristics of the eocene-oligocene shahejie formation, Jiyang super-depression, Bohai Bay Basin of China. Int. J. Coal Geol. 204, 130–143. doi:10.1016/j.coal.2019.01.013
Li, Y., Liu, K., Pu, X., Chen, S., Han, W., Zhang, W., et al. (2020). Lithofacies characteristics and formation environments of mixed fine grained sedimentary rocks in second member of Kongdian Formation in Cangdong depression, Bohai Bay Basin. J. Earth Sci-China 45 (10), 3779–3796. doi:10.3799/dqkx.2020.167
Liu, H. (2021). Geological particularity and exploration practice of paleogene shale oil in Jiyang depression: A case study of the upper submember of member 4 to the lower submember of member 3 of shahejie formation. Acta Pet. Sin. 43 (5), 581–591. doi:10.7623/syxb202205001
Liu, J., Regenauer-Lieb, K., Hines, C., Liu, K., Gaede, O., and Squelch, A. (2009). Improved estimates of percolation and anisotropic permeability from 3-D X-ray microtomography using stochastic analyses and visualization. Geochem. Geophys. Geosyst. 10, Q05010. doi:10.1029/2008GC002358
Loucks, R. G., Reed, R. M., Ruppel, S. C., and Hammes, U. (2012). Spectrum of pore types and networks in mudrocks and a descriptive classification for matrix-related mudrock pores. Am. Assoc. Pet. Geol. Bull. 96 (6), 1071–1098. doi:10.1306/08171111061
Ma, B., Hu, Q., Yang, S., Zhang, T., Qiao, H., Meng, M., et al. (2020). Pore structure typing and fractal characteristics of lacustrine shale from Kongdian Formation in East China. J. Nat. Gas. Sci. Eng. 85, 103709. doi:10.1016/j.jngse.2020.103709
Ma, Y., Zhong, N., Li, D., Pan, Z., Cheng, L., and Liu, K. (2015). Organic matter/clay mineral intergranular pores in the lower cambrian lujiaping shale in the north-eastern part of the upper yangtze area, China: A possible microscopic mechanism for gas preservation. Int. J. Coal Geol. 137, 38–54. doi:10.1016/j.coal.2014.11.001
Peng, S., Yang, J., Xiao, X., Bob, L., Stephen, C. R., and Zhang, T. (2015). An integrated method for upscaling pore-network characterization and permeability estimation: Example from the mississippian barnett shale. Transp. Porous Med. 109, 359–376. doi:10.1007/s11242-015-0523-8
Pu, X., Zhou, L., Han, W., Zhou, J., Wang, W., Zhang, W., et al. (2016). Geologic features of fine-grained facies sedimentation and tight oil exploration: A case from the second member of paleogene Kongdian Formation of Cangdong sag, Bohai Bay Basin. Petroleum Explor. Dev. 43 (1), 26–35. doi:10.1016/s1876-3804(16)30003-9
Shabro, V., Kelly, S., Torres-Verdin, C., Sepehrnoori, K., and Revil, A. (2014). Pore-scale modeling of electrical resistivity and permeability in FIB-SEM images of organic mudrock. Geophysics 79 (5), 289–299. doi:10.1190/GEO2014-0141.1
Wu, S., Yang, Z., Pan, S., Cui, J., Lin, S., Su, L., et al. (2020). Three-dimensional imaging of fracture propagation in tight sandstones of the upper triassic chang 7 member, ordos basin, northern China. Mar. Pet. Geol. 120 (3−4), 104501. doi:10.1016/j.marpetgeo.2020.104501
Wu, Y., Tahmasebi, P., Lin, C., Zahid, M. A., Dong, C., Golab, A. N., et al. (2019). A comprehensive study on geometric, topological and fractal characterizations of pore systems in low-permeability reservoirs based on SEM, MICP, NMR, and X-ray CT experiments. Mar. Pet. Geol. 103, 12–28. doi:10.1016/j.marpetgeo.2019.02.003
Wu, Y., Tahmasebi, P., Liu, K., Fagbemi, S., Lin, C., An, S., et al. (2022). Two-phase flow in heterogeneous porous media: A multiscale digital model approach. Int. J. Heat. Mass Transf. 194, 123080. doi:10.1016/j.ijheatmasstransfer.2022.123080
Xin, B., Hao, F., Han, W., Xu, Q., Zhang, B., and Tian, T. (2021). Paleoenvironment evolution of the lacustrine organic-rich shales in the second member of Kongdian Formation of Cangdong Sag, Bohai Bay Basin, China: Implications for organic matter accumulation. Mar. Pet. Geol. 133, 105244. doi:10.1016/j.marpetgeo.2021.105244
Xin, B., Zhao, X., Hao, F., Jin, F., Pu, X., Han, W., et al. (2022). Laminae characteristics of lacustrine shales from the Paleogene Kongdian Formation in the Cangdong Sag, Bohai Bay Basin, China: Why do laminated shales have better reservoir physical properties? Int. J. Coal Geol. 260, 104056. doi:10.1016/j.coal.2022.104056
Yang, Y., Yao, J., Wang, C., Gao, Y., Zhang, Q., An, S., et al. (2015). New pore space characterization method of shale matrix formation by considering organic and inorganic pores. J. Nat. Gas. Sci. Eng. 27, 496–503. doi:10.1016/j.jngse.2015.08.017
Yoon, H., and Dewers, T. A. (2013). Nanopore structures, statistically representative elementary volumes, and transport properties of chalk. Geophys. Res. Lett. 40, 4294–4298. doi:10.1002/grl.50803
Zhao, X., Zhou, L., Pu, X., Jin, F., Jiang, W., Xiao, D., et al. (2018). Development and exploration practice of the concept of hydrocarbon accumulation in rifted-basin troughs: A case study of paleogene Kongdian Formation in Cangdong sag, Bohai Bay Basin. Petroleum Explor. Dev. 45 (6), 1166–1176. doi:10.1016/S1876-3804(18)30120-4
Keywords: lacustrine shales, digital rock, 3D pore structure, FIB-SEM tomography, upsizing, heterogeneity
Citation: Yuchen F and Keyu L (2023) Large-volume FIB-SEM 3D reconstruction: An effective method for characterizing pore space of lacustrine shales. Front. Earth Sci. 10:1046927. doi: 10.3389/feart.2022.1046927
Received: 17 September 2022; Accepted: 25 October 2022;
Published: 17 January 2023.
Edited by:
Yuqi Wu, China University of Petroleum (East China), ChinaReviewed by:
Muhammad Jawad Munawar, University of the Punjab, PakistanYong Ma, China University of Petroleum, Beijing, China
Qiming Wang, University of Texas at Arlington, United States
Copyright © 2023 Yuchen and Keyu. This is an open-access article distributed under the terms of the Creative Commons Attribution License (CC BY). The use, distribution or reproduction in other forums is permitted, provided the original author(s) and the copyright owner(s) are credited and that the original publication in this journal is cited, in accordance with accepted academic practice. No use, distribution or reproduction is permitted which does not comply with these terms.
*Correspondence: Liu Keyu, bGl1a2V5dUB1cGMuZWR1LmNu