 Congguang Zhang
 Xiaojie Ye1
- 1Institure of Carbon-Neutral Technology, Shenzhen Polytechnic, Shenzhen, China
- 2School of Biomedical Sciences and Engineering, South China University of Technology, Panyu, China
- 3Heshan Xinde Biological Products Co., Ltd., Heshan, China
Tea industry is considered to have a high energy consumption, due to its complex life cycle system. The global change potential (GWP) of the life cycle of tea, is deserving in-depth discussion. This study conducted a life cycle assessment (LCA) towards the Dianhong black tea products, and evaluated the discharge and mitigation potential, and compared with the results of LCA of other tea to clarify the advantages and disadvantages of Chinese black tea industry. The results showed that the planting stage and packaging stage were the main sources of GWP in the life cycle of black tea, accounting for 43.73% and 39.44% respectively, because of the application of chemical fertilizer and the production of aluminum foil. In the tea processing stage, the GWP has a greater impact on the process of heating and withering, accounting for 8.63%. It is followed by the rolling stage, which accounts for 6.85%, mainly from the consumption of electricity during the process. Finally, the key factors affecting tea production efficiency and quality were analyzed by combining the results of contribution and sensitivity analysis. The research will contribute to the establishment of a more sustainable tea value chain.
Highlights
• The cultivation stage is the main source of GWP impact, accounting for 43.73%.
• The contributions of transportation, fermentation and drying processes to GWP are inconspicuous.
• Impacts are mainly from efficiency of picking machines, fertilizer and packaging materials.
• When the equipment power was increased by 10%, the GWP value decreased by 1.3%.
1 Introduction
Almost 14% of global GHG emissions are emitted by the agricultural sector (Cichorowski et al., 2015). The potential to reduce GHG emissions in the agriculture and food sectors is enormous. As a worldwide popular beverage, tea has a long history in China (Xu et al., 2021; Hayat et al., 2015). Black tea is also a plant resource with medicinal function, which has developed rapidly in China in recent years.
According to China’s National Bureau of Statistics, black tea production increased from 67,300 ton in 2009 to 258,300 tons in 2019 with an increase of 283.8%. The proportion of black tea in the whole tea industry increased from 4.98% in 2009 to 9.3% in 2019. Given the popularity of tea in the global beverage market, its planting amount and production have risen rapidly. It had been shown that both the planting and production of tea, may be associated with a large amount of greenhouse gas emissions (Cichorowski et al., 2015). The research of Soheili-Fard,et al. showed that machinery and diesel fuel were the most polluting segments in farms and factories, respectively. Compared with other steps in the whole tea life cycle, tea production was identified as a major contributor to the environmental burden, with a 57% share. In addition, two-layer packaging was considered as the most polluted scenario, and stoves were found to be more environmentally friendly than electric kettles. Azapagic et al. (2016) analyzed the global warming potential (GWP) of black tea in Kenya throughout its life cycle "from cradle to grave". The research showed that the total impact of tea was independent of the scale of tea production and that the main contributor was tea consumption. Due to the electricity used for boiling water, tea consumption accounted for 85% of the impact. Kouchaki-Penchah, et al. (2017) used data envelopment analysis (DEA) and life cycle assessment (LCA) to determine the energy efficiency of tea production in Iran’s Guilan Province and helped to reduce the environmental burden. Xu, et al. (2019) assessed the carbon footprint and primary energy demand of five Chinese organic tea products using LCA methods. The results indicate that different farming management and processing techniques had a significant impact on the carbon footprint and primary energy demand of different tea products. The study further emphasized the trade-off between high quality tea and low carbon footprint. The whole life cycle of tea, including planting, transportation, production and processing, packaging, had considerable environmental impact.
Fengqing County, Yunnan Province is the "national high-quality tea base county", "national export commodity tea base county", and " national top ten tea producing counties". The tea industry has become an important supporting industry of the local people to raise income, create wealth, develop local economy. Fengqing Yunnan black tea is also the representative of Chinese black tea. Its planting and production technology may represent the highest level in the industry, which is worth further exploration. There are many life cycle assessments of tea, but few studies focus on Yunnan Dianhong tea. For instance, there is almost no study on the potential of climate change in the life cycle. Given the importance of Dianhong tea in China’s tea industry, it is essential to study Yunnan Dianhong tea to determine the key factors of climate change at various stages from tea garden to tea to encourage sustainable production strategies. Life cycle assessment (LCA) is the most widely used assessment tool to quantify and systematically analyze the resources consumed and the potential environmental impacts caused by pollutant emissions throughout the production and consumption activities of a product (Lacirignola et al., 2017). Compared with other environmental impact assessment methods, LCA has the advantages of being systematic and objective, and has become a widely used tool for product environmental characteristics analysis and decision support. It is widely used by researchers in the fields of construction (Kim and Tae, 2016; Meex et al., 2018), agriculture (Dijkman et al., 2018; Khoshnevisan et al., 2014; Nabavi-Pelesaraei et al., 2018), new energy (Zackrisson et al., 2010; Deng et al., 2018), and food and beverage (Fusi et al., 2014; Naranjo et al., 2020).
The aim of this study was to assess the emissions and mitigation potential of Fengqing Yunnan black tea in various stages of planting, transportation, processing and packaging. The results of GWP contribution and sensitivity analysis may identify key factors that influence climate change, tea production efficiency and quality. By comparing with other studies, the advantages and disadvantages of Fengqing Yunnan black tea industry can be identified. A more systematic study may contribute to the establishment of a more sustainable value chain of tea and the improvement of the life cycle assessment database of Yunnan black tea. The main data source of the study is the actual research. The missing data is supplemented by literature research and industry consultation.
2 Materials and methods
Yunnan Dianhong tea producing areas includes more than 20 counties in Lincang, Baoshan, Simao, Xishuangbanna, Dehong and Honghe along the Lancang River in Yunnan. According to the geographical location, Yunnan is divided into three tea regions: Western Yunnan, Southern Yunnan and Northeast Yunnan. Yunnan Dianhong tea is produced in western Yunnan and southern Yunnan. The tea area in western Yunnan includes Lincang, Baoshan, Dehong, Dali four states (regions). The tea planting area accounted for 52.2% of the province, and its production accounted for 65.5% of the province’s total output. It is the main production area of Dianhong tea, including Fengqing, Yunxian, Shuangjiang, Lincang, Changning and other counties, accounting for more than 90% of the production of Dianhong tea. The tea garden selected for the study was in the southwest of Mengyou Town, Fengqing County, Yunnan, China, with an acreage yield of 543.69 kg. This study assessed the environmental impacts of tea planting and production processes based on the LCA study method of ISO 14040 (2006). The sources of GWP contribution of black tea at each stage were studied. Based on the results of the GWP contribution of Dianhong production, the sensitivity analysis of various factors affecting the GWP results was conducted.
2.1 Goal and scope
Climate warming is one of the most significant challenges currently facing the globe and humanity(Zhou et al., 2021). Consequently, it is necessary to assess the climate change impacts of product production processes to support improvement and mitigation strategies.
2.1.1 Functional unit
The analysis was based on the functional unit of "1 kg Yunnan Dianhong tea".
2.1.2 System boundaries
As shown in Figure 1: The system boundary of the study is "from cradle to gate", including the following life cycle stages.
(1)Planting: this includeed the direct and indirect greenhouse gas emissions from the production and application of chemical fertilizers, the application of organic fertilizers, pesticides and herbicides, and the use of diesel engines in the cultivation process, and the transportation of pesticides, herbicides and fertilizers.
(2)Transportation: including the transportation of tea from the tea farm to the factory and the transportation of agricultural materials from the market to the tea farm.
(3)Production: processes water, electricity, and oxygen used in four processes, including warm withering, rolling, aerobic fermentation and drying.
(4)Packaging: the emissions and environmental impact caused by the production process of cardboard and aluminum foil used in packaging, as well as the electricity used in the packaging process.
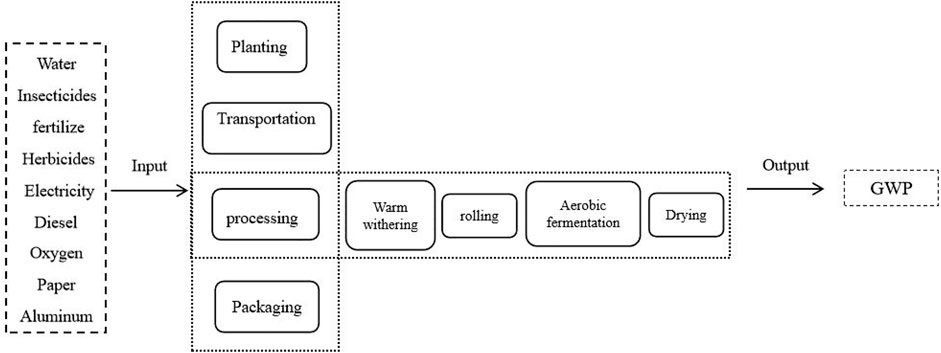
FIGURE 1. Life cycle modeling of Dianhong tea " from cradle to grave"(1999–2017, retrieved on 28 July 2018, Web of Science).
2.1.3 Data sources and assumptions
The study used field research and actual testing as the main data sources, and the missing data were supplemented by literature research and industry consultation. The study assumed that chemical and organic fertilizers were mainly applied in the cultivation process in a 1:1 ratio. The component content and input amounts of urea, potassium superphosphate, and calcium sulfate were shown in Table 1 below. Assumed all organic fertilizer were conventional farm fertilizer. During the withering and rolling process, besides necessary processing equipments, humidifiers, dehumidifiers, air conditioners, and other equipment were also required to control the temperature and humidity of the processing workshop. The specific process equipment parameters are shown in Table 2. The background database used OpenLCA software and the built-in CLCD-China-ECER 0.8 and Ecoinvent 3.1 databases. In the life cycle inventory data collection, we grouped the transportation process into the cultivation process and the packaging process into the production process.
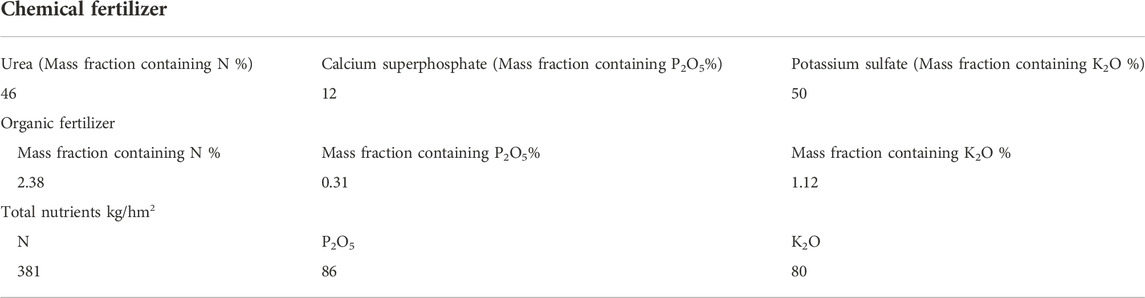
TABLE 1. Fertilizer nutrient composition and input amount.
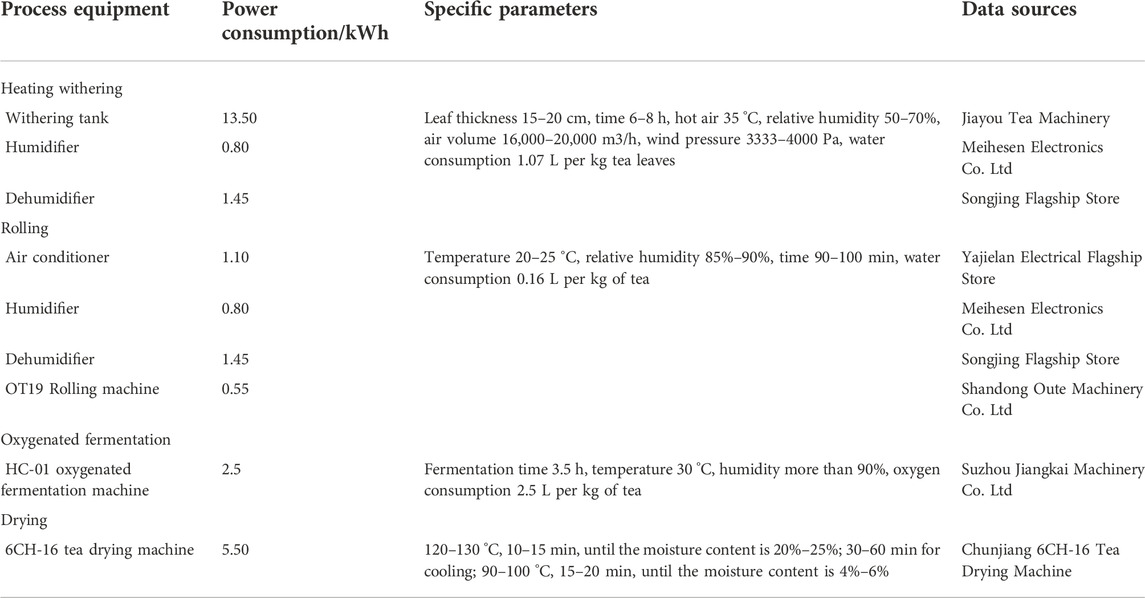
TABLE 2. Process equipment parameters.
2.2 Life cycle impact assessment
LCIA is a qualitative or quantitative assessment process for resource consumption and pollution emission in the life cycle inventory. In this section, we selected the following nine impact categories, as shown in Table 3. Nine impact categories were used to examine the life cycle environmental impacts of Dianhong tea, which laid a foundation for the selection of optimization indicators for different fertilization and processing scenarios. Under the green trade barrier, it is very meaningful to focus on the establishment of product life cycle carbon footprint model, the calculation of carbon emissions and the analysis of emission reduction potential.
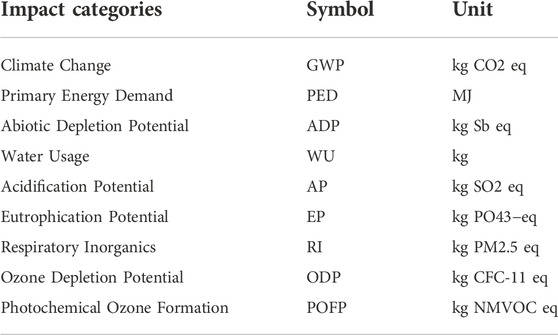
TABLE 3. Environmental impact assessment category.
2.3 Sensitivity analysis
Sensitivity analysis is used to evaluate the sensitivity of the result change caused by a certain change (Igos et al., 2019). In this study, a single-factor sensitivity analysis was used, in which one factor was selected at a time to vary within a specified range while other factors remianed fixed. Specifically, the sensitivity ratio (SR) (Clavreul et al., 2012) was chosen as a measure, which is the ratio of the relative change between the two, and if SR=2 meant that when a factor increased by 10%, its result would increase by 20%. The formula was as follows:
Where, ∆result is the change value of the total GWP; initial_result is the initial value of the total GWP; ∆parameter is the change value in the factor; and initial_parameter is the initial value of the factor.
3 Results
This study analyzed the entire life cycle of Yunnan Dianhong tea. The main sources of GWP contribution at different stages were examined. The result of the entire life cycle study of Yunnan Dianhong tea was also compared with other studies to clarify the advantages and disadvantages of Dianhong production technology. Combined with the sensitivity analysis, the key factors affecting the production efficiency and quality of Dianhong were analyzed.
3.1 Life cycle assessment input inventory analysis
3.1.1 List of inputs to the cultivating process
Table 4 showed the life cycle input list of the cultivating process (including planting and transportation process) and Figure 2 analyzed the diesel input structure of this system. Overall, the diesel consumption of this system could be roughly composed of three parts: agricultural materials transportation, tea transportation and agricultural machinery consumption. Among them, the diesel consumption of organic fertilizer transportation accounted for the largest proportion, accounting for 47.61%. It was because the effective nutrients in the organic fertilizer were low (the nitrogen content is only 2.38%). Therefore, to ensure the necessary nutrients of tea plants, the input amount was much higher than that of chemical fertilizer, resulting in a increase of the transportation cost of organic fertilizer. The second was the transportation diesel consumption of fresh leaves, which accounted for 41.29%. The reason for this phenomenon was mainly related to the longer transport distance of fresh tea. It could be seen from the previous section, the transport distance of tea in this study was 29.9 km, while the transport distance of agricultural materials was only 5 km. The diesel consumption of the rest of the sources were smaller, and its total percentage was 11.1%. Meanwhile, a certain amount of nitrous oxide was directly emitted due to the nitrogen loss during the application of nitrogen fertilizer, which was 4.90E-03 kg/kg.
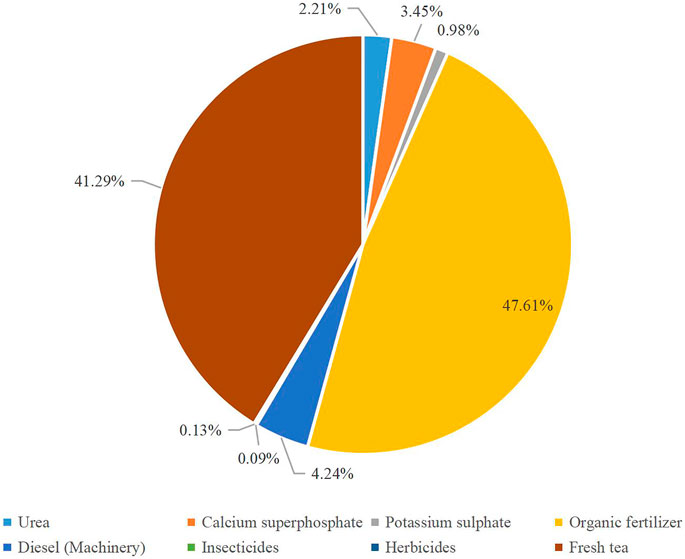
FIGURE 2. Structure of diesel consumption of planting process.
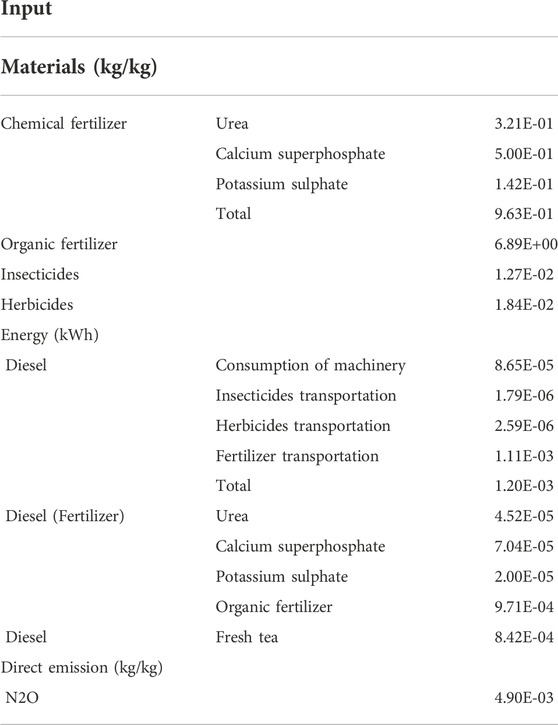
TABLE 4. List of life cycle inputs for the planting process.
3.1.2 List of production process inputs
Table 5 showed the list of process life cycle inputs (including production and packaging processes). In the processing stage, the heated withering process was used in the withering stage, the aerobic fermentation process was used in the fermentation stage, the rolling machine was used in the rolling stage, with a time of 1.5 h, and the dryer was used in the drying stage, with a drying time of 30 min. The whole system covered the material input and power consumption of five stages, including withering, rolling, fermentation, drying and packaging. According to Figure 3, the power of the processing stage system mainly came from the heating withering stage, accounting for 51.17%. The next stage was the rolling stage, which accounted for 40.66%.
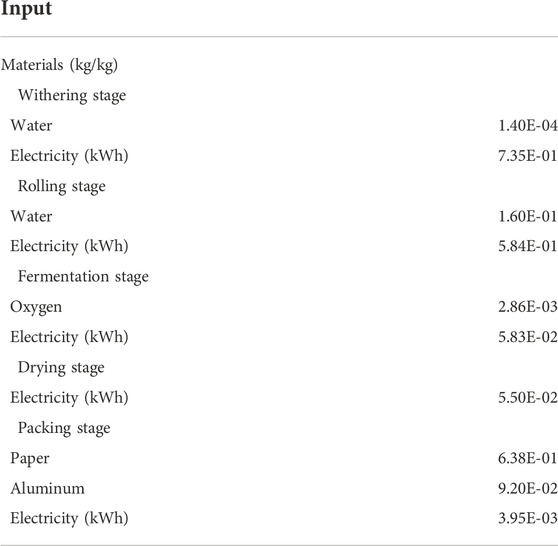
TABLE 5. List of process life cycle inputs.
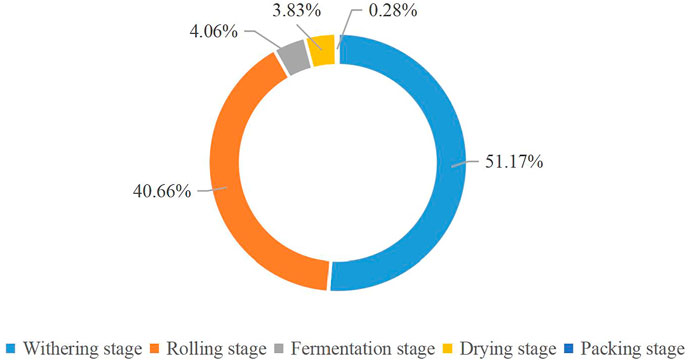
FIGURE 3. Power consumption structure of production process.
3.2 Life cycle inventory analysis
In order to systematically evaluate the environmental impact of the production process of Dianhong tea, this study examined the environmental impacts of nine life cycle evaluation indicators (Climate Chang, GWP, Primary Energy Demang, PED, Abiotic Depletion Potential, ADP, Water Usage, WU, Acidification Potential, AP, Eutrophication Potential, EP, Respiratory Inorganics, RI, Ozone Depletion Potential, ODP, Photochemical Ozone Formation, POFP) for the whole system, and the results were shown in Table 6.
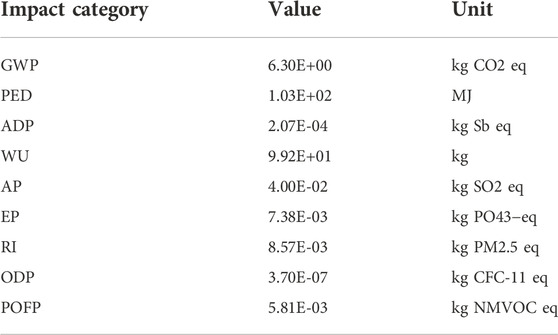
TABLE 6. Results of Life Cycle Assessment of the whole production process of 1 kg DianHong tea.
3.3 Analysis of GWP results of Dianhong tea in different stages
3.3.1 Contribution analysis of GWP results of the entire system
Figure 4 showed the overall GWP contribution of the system. The cultivating stage had the largest GWP contribution of 43.73%, followed by the packing process with 39.44%. At the stage of tea processing, the sector with great influence of GWP was heating withering, accounting for 8.63%. The second was the rolling stage, accounting for 6.85%. The contribution of transportation, fermentation and drying to GWP was small. To get a clearer picture of the main sources of GWP contribution in each stage, we had made a detailed analysis of the GWP contribution in each stage in the following.
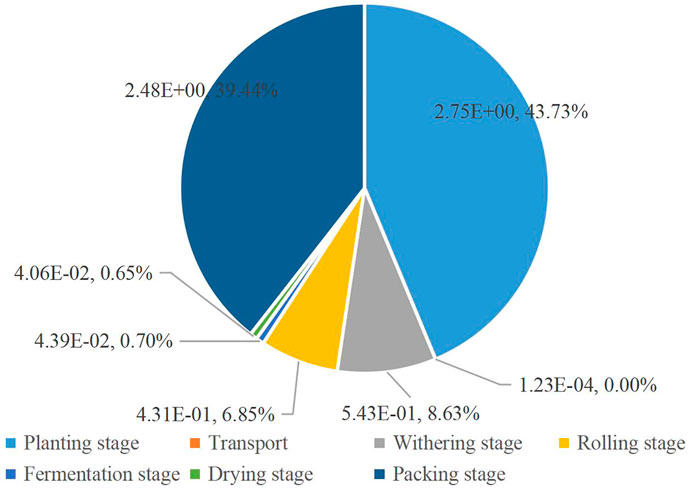
FIGURE 4. GWP contribution of the Overall system of 1 kg Dianhong tea.
3.3.2 Contribution analysis of GWP results of the planting stage
It could be seen from Figure 5 that the direct emission of nitrous oxide caused by nitrogen fertilizer application would greatly improve the GWP in the cultivating process, with the value of 1.30E+00 kg CO2 eq, accounting for 47.17%. The second source of GWP contribution was fertilizer production (including urea, calcium superphosphate, potassium sulfate and organic fertilizers), with a total of 1.10E+00 kg CO2 eq, accounting for 40.00%. From this, it could be found that the cause of the significant increase in GWP at the planting stage was directly related to urea. In this study, the greenhouse gas emissions from urea production were 9.24E-01 kg CO2 eq., accounting for 33.53%, while the urea application process generated a large amount of nitrogen loss and led to the direct emission of nitrous oxide, accounting for 80.70%. The above results indicated that the production and application of nitrogen fertilizers significantly increased the GWP at the planting stage. Therefore, it was of great importance to improve the efficiency and utilization of nitrogen fertilizers, or to develop slow-release fertilizers and organic fertilizers, and to improve the nitrogen fixation potential of the land to reduce greenhouse gas emissions during the process of crop planting.
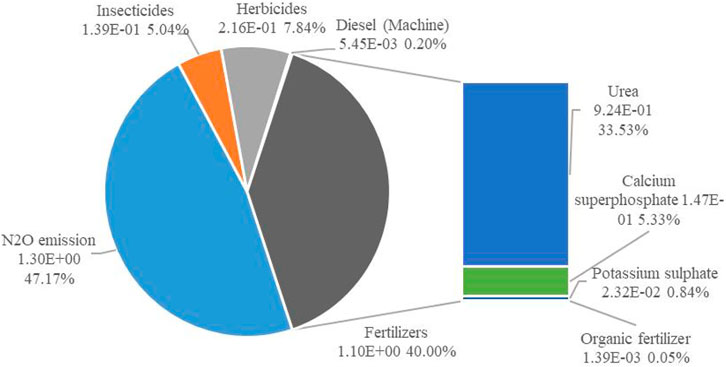
FIGURE 5. GWP contribution of various agricultural inputs in the planting stage of 1 Kg Dianhong tea.
3.3.3 Analysis of GWP results during the processing phase
It could be seen from Figure 6 that the main contribution of GWP in the processing stage came from the heating withering stage and the rolling stage, accounting for 51.3% and 40.72% respectively. The drying and fermentation stages accounted for a smaller proportion, accounting for 3.84% and 4.15%. To met the output and quality demands of the market and consumers, the production of Dianhong tea had been gradually upgraded from original pure manual tea production to mechanized tea production, while the efficiency of tea production equipment and tea production quality had been significantly improved (Khanali et al., 2017; Sharma and Dutta, 2018), and the environmental impact of different tea processing technologies had became a key issue. In addition, the optimization of equipment had the same effect (Sari and Velioglu, 2013). In the sensitivity analysis of this study, it was found that withering and rolling time influenced the GWP results, and in Dianhong production, the withering and rolling times were generally 5–7 h and 70–90 min. Therefore, when the withering time was increased by 15%, its GWP decreased by 0.45%, and when the rolling time was increased by 10%, its GWP decreased by 0.7%. Therefore, it was an important measure to promote energy saving and emission reduction in black tea production to develop new withering technology and green rolling equipment.
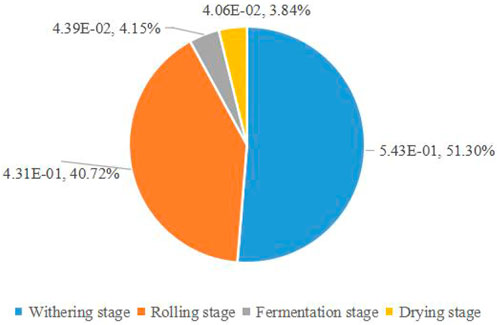
FIGURE 6. GWP contribution of the processing stage of 1 kg Dianhong tea.
3.3.4 Analysis of GWP results during the packaging stage
Since the tea packaging process had a great impact on the overall GWP, it was necessary to analyze this stage in detail. The data were shown in Table 7. During the packaging process, the system inputs included electricity, cardboard, and aluminum foil with a total GWP of 2.48E+00 kg CO2 eq. Among them, the production process of aluminum foil had the largest GHG emission of 2.09E+00 kg CO2 eq., accounting for 84.14%, followed by the production process of cardboard, with a value of 3.91E-01 kg CO2 eq., accounting for 15.74%. It could be seen from the above results that the production process of aluminum foil had the greatest impact on the GWP of packaging process, while the impact of electricity consumption was very small.
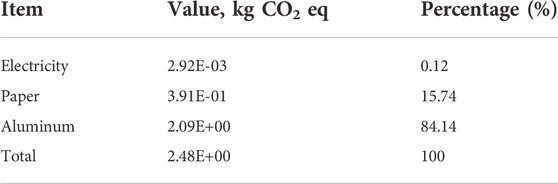
TABLE 7. List and structure of GWP at the packaging process.
Product packaging plays the role of beautifying and promoting goods, and when these missions were completed, it becomes waste. As the number of goods increases, their packaging waste accumulates in large quantities, causing serious environmental pollution. In this study, the environmental impact generated in the tea packaging process occupies about 40% of the overall, which was mainly affected by the production of two packaging materials, aluminum foil and hard paper. Therefore, how to reduce the emission of packaging materials was of great significance to reduce the environmental impact of Dianhong tea production.
At present, the common methods to reduce packaging costs include using more environmentally friendly alternative materials, avoiding excessive packaging, and recycling packaging materials. This study was only conducted from the perspective of material recycling. According to the research, the average recycling rate of aluminum foil and cardboard in China was about 50% (Zhang et al., 2010; Zhu et al., 2020). Based on this criterion, when material recycling was considered, the GHG of aluminum foil and hard paper could be reduced by 50%, which were 1.05E+00 kg CO2 eq. and 1.96E -01 kg CO2 eq., and the final GWP could be reduced by about 20%. The recycling of packaging materials not only reduces the production cost, but also contributes to the sustainable development of Dianhong tea.
3.3.5 Analysis of GWP results during transportation stage
This study was the LCA from cradle to grave, from the tea production boundary to the packaging, without considering the transportation process of tea from the factory to the sales market and the tea consumption process. Therefore, the transportation stage of this study included the transportation process of agricultural materials from the farmers' market to the tea farm and the transportation process of fresh tea from the tea farm to the processing plant. According to the calculation, the corresponding GWP was 6.99E-05 kg CO2 eq., while the transportation emission of tea was 5.31E-05 kg CO2 eq., and the total GWP was 1.23E-04 kg CO2 eq., which accounted for a small percentage compared to other stages.
4 Discussion
4.1 Sensitivity analysis
Based on the research results of GWP contribution of Dianhong production, sensitivity analysis was conducted on various factors affecting GWP results, including planting, transportation, wilting, rolling, fermentation, drying and packaging, and 10 influencing factors with SR absolute value greater than 0.01 were screened out. The results were shown in Figure 7. The following 10 factors were tea picking efficiency, fertilizer utilization efficiency, aluminum foil recovery rate, nitrogen fertilizer utilization efficiency, equipment power, paper resource recovery efficiency, withering time, pesticide input, rolling time, and loss of nitrous oxide emission due to nitrogen application. Among the 10 factors that had been screened, the absolute values of SR of tea picking efficiency and fertilizer utilization efficiency were relatively high, which were 0.42 and 0.40, respectively, indicating that the final GWP was more sensitive to these two factors. The second was the recovery rate of aluminum foil and the emission of nitrous oxide, with absolute values of SR were 0.21 and 0.22, respectively, which were also sensitive to the results. Among the remaining factors, nitrogen fertilizer utilization efficiency and equipment power had more obvious effects on the GWP results.In Section 4.2, the key influencing factors and the relationship between tea production efficiency and quality were further analyzed by combining sensitivity and contribution results.
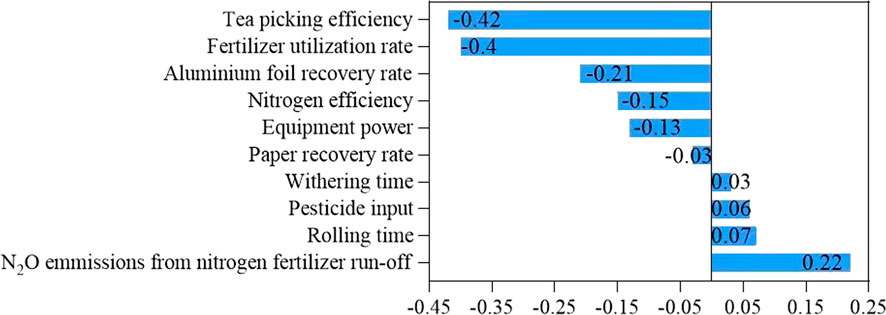
FIGURE 7. Results of GWP sensitivity analysis of the whole production process of 1 kg Dianhong tea.
4.2 Key influencing factors and relationship between tea production efficiency and quality
According to the results of contribution and sensitivity analysis, the GWP results were more significantly affected by the picking efficiency of tea picking machines, fertilizer utilization rate, packaging materials and equipment power. Since this study used agricultural machinery equipment for tea picking, and the tea bud integrity rate would affect the yield per acre of tea farm, resulting in a decrease in yield. At present, the tea bud integrity rate of tea picking machines in China ranges from 76.5% to 78.0% (Yu et al., 2015). It was found by the results of sensitivity analysis study that when its efficiency increased by 1.5%, the total GWP decreased by 0.63%, and the efficiency and effective picking rate of picking machines could significantly affect the GHG emissions of tea production. Therefore, it is an urgent for China to mechanize tea production to improve the effective picking efficiency and reduce the missed picking rate.
The GWP of the cultivating stage accounted for 43.73% of the total, while the production of fertilizer and the emission of nitrous oxide accounted for more than 80% of the GWP of the cultivating stage. The input of fertilizer had greatly affected the GWP of Dianhong tea production. It was important to improve the quality and efficiency of traditional fertilizer, reduce the input loss, and improve the utilization rate to reduce the greenhouse gas emissions of agricultural production. According to the research, the average utilization rate of N, P and K fertilizers in China is between 30% and 40%, which was much lower than the level of 40%–50% in developed countries (Bingqiang, 2016). In this study, the utilization rate of fertilizers was 45% with SR=-0.40, which meant that when the utilization rate increased by 10%, the total GWP decreased by 4%. This indicated a positive significance for environmental emission reduction in the tea production process. The improvement of nitrogen fertilizer efficiency was more prominent in fertilizer application. When the efficiency of nitrogen fertilizer increased by 10%, the total GWP decreased by 1.5%. In addition, the loss of nitrous oxide caused by the loss of nitrogen fertilizer directly affected the environmental emissions of crop planting. The total nitrogen loss rate in Chinese tea farm was around 20%. In this study, when the nitrogen fertilizer loss increased by 2%, the corresponding total GWP increased by 0.44%. Improving the carbon fixation potential of soil, reducing the loss of nitrogen fertilizer application, and expanding the use of organic fertilizer, slow-release fertilizer, and other green fertilizers could not only improve the production efficiency of tea, but also reduce the environmental impact caused by production.
Reducing the amount of packaging materials and recycling them would significantly reduce the environmental emissions of tea production. When the recycling rate of aluminum foil and cardboard increased by 5%, their corresponding total GWP reduced by 1.05% and 0.15%. Meanwhile, since tea processing uses a variety of processing equipment, the power of the equipment was the main factor affecting its electricity consumption. When the power of all processing equipment increased by 10%, its total GWP reduced by 1.3%.
In addition, the running time, equipment volume, temperature and humidity of tea processing would also affect the greenhouse gas emissions. However, at the same time, these factors would have an impact on the quality of tea. Theaflavin, TFs, Thearubigins, TR, and Teabrown, TB affect the color and taste of tea soup. With the increase of fermentation temperature, the content of TFs and TR increased first and then decreased, while the content of TB continued to increase. The higher the content of TFs and TR, the better the quality of black tea. If the fermentation temperature was set between 22 °C and 28 °C (Li et al., 2013), the quality of black tea was better. Therefore, if we only consider the environmental impact of Dianhong production process and ignore the quality of tea, it will have a serious impact on the economic benefits of Dianhong industry.
4.3 Comparison of yunnan dianhong tea and other tea products
In this section, we compare the results of our own LCA study of Dianhong tea with those of other researchers, and then we used them to discuss the strengths and weaknesses of the Dianhong production process. To be consistent with the functional units and system boundaries of Dianhong production, the GWP results of other tea production were processed in this study, ignoring the drinking stage of tea. The results were shown in Figure 8.
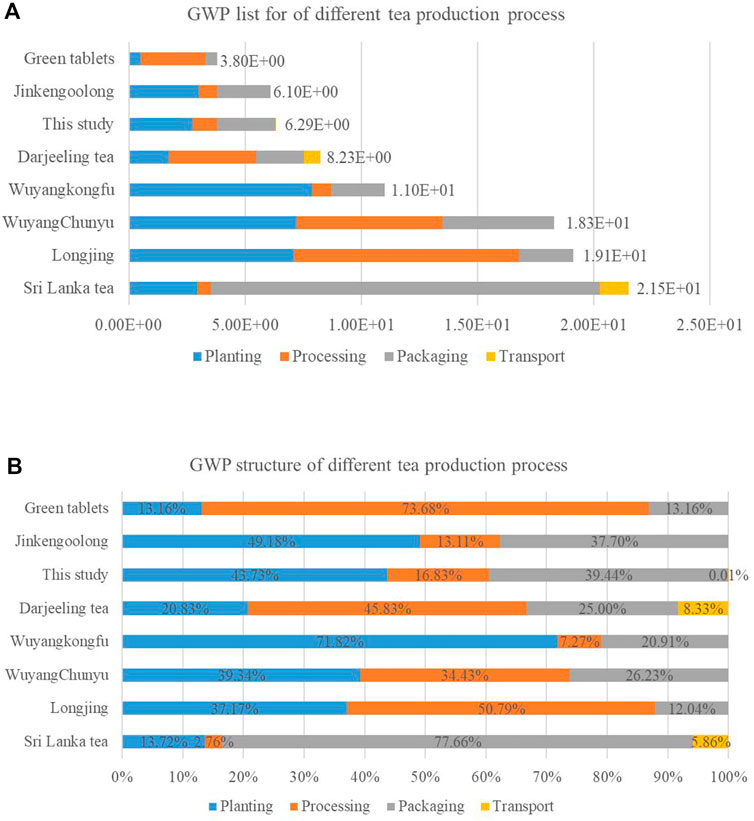
FIGURE 8. Comparison of GWP results and contribution of LCA of different tea with 1 kg tea as the unit.
The above tea production mainly included four kinds of black tea (this study, Darjeeling tea (Doublet and Jungbluth, 2010), Wuyangkongfu (Xu et al., 2019), Sri Lanka tea (Munasinghe et al., 2017), three kinds of green tea (Green tables (Xu et al., 2019), WuyangChunyu (Xu et al., 2019), Longjing (Xu et al., 2019) and one kind of Oolong tea (Jinkengoolong (Xu et al., 2019). Among these results, there were significant differences in GWP emissions from different teas. Even the same type of tea produced different results given different backgrounds. For example, among the four kinds of black tea production, the results of this study, Darjeeling tea and Wuyangkongfu were more similar and much lower than those of Sri Lanka tea. It was difficult to show consistency among different production in the cultivation, processing, and packaging stages. For example, in the cultivation process, Wuyangkongfu used the organic planting mode and applied 4500 kg of rapeseed cake per hectare, which caused a large amount of CO2 emissions, resulting in a significant increase in GWP in the planting stage compared with other black tea production. In addition, the yield of fresh tea would also significantly affect their final GWP results. The yield of Wuyangchunyu, Longjing, Wuyangkungfu, Jinkengoolong and Green tablets were 600 kg/hm2, 1875 kg/hm2, 1875 kg/hm2, 6000 kg/hm2 and 19,875 kg/hm2. Among these kinds of tea, the yield of Green tablets was significantly higher than that of other teas, thus leading to the smallest results for their GWP. In the packaging process, Sri Lanka tea used many different types of packaging materials (such as polylactic acid, polyethylene, corrugated paper, kraft paper, etc.), resulting in a large amount of CO2 emissions, which seriously aggravated the greenhouse gas emissions of tea production.
Although there were great differences in tea production under different backgrounds, some common contents could still be found. First, it could be clarified that when the drinking process of tea was ignored, the production emissions of tea mentioned above were mainly influenced by three aspects: cultivation, processing and packaging, while the impact of transportation was relatively small. At the cultivation stage, the fertilizer ratio and type, the nitrogen fixation potential of tea farm, the tea yield, and the effective picking rate during harvest (Tang et al., 2011; Han et al., 2014; Mu et al., 2020) could have a significant impact on the final results. At the processing stage, different kinds of tea, different processes of the same kind of tea and different equipment selection of the same process could affect the results. Finally, in the packaging stage, tea manufacturers often adopt different packaging strategies according to the quality of tea, targeted consumers, transportation, storage requirements, and cost budgets, while neglecting the negative environmental benefits generated in the packaging process (Soheili-Fard et al., 2018). This affected the benign development of enterprises. Therefore, balancing economic development and environmental impact was one of the priorities in the current research field.
5 Conclusion
Through the life cycle assessment of Fengqing Yunnan black tea "from cradle to gate", combined with the results of contribution and sensitivity analysis, we could draw the following conclusions:
(1) The planting stage was the main source of GWP of the system, accounting for 43.73%, mainly because of the application of chemical fertilizer and the nitrous oxide emissions generated in the application process;
(2) Packaging process was the second largest source of system GWP, accounting for 39.44%, mainly due to the production of aluminum foil;
(3) During the processing stage, GWP had a greater impact on the heating withering and rolling, accounting for 8.63% and 6.85% respectively;
(4) The results of GWP were more significantly affected by the picking efficiency of tea picking machine, fertilizer utilization, packaging materials and equipment power. When the tea picking efficiency increased by 1.5%, the total GWP decreased by 0.63%; When the fertilizer utilization rate increases by 10%, the total GWP decreased by 4%; When the recovery rate of aluminum foil, cardboard and other packaging materials increases by 5%, the corresponding total GWP decreased by 1.05% and 0.15% respectively; When the power of all processing equipment is increased by 10%, the total GWP decreased by 1.3%.
Therefore, how to produce fertilizers in an energy-efficient way, how to improve the absorption rate of fertilizers in the soil, and how to reduce the loss of nitrogen in the process of fertilizer application and plant growth are still one of the main issues of energy saving and emission reduction in agriculture sector at this stage. The development of more efficient agricultural production, processing equipment, and the establishment of material recycling concepts are also important means to promote energy conservation and emission reduction. Of course, the study ignored the impact of the distribution, drinking and other stages of Fengqing Yunnan black tea, which also made the sustainable evaluation of the entire tea value chain limited. In the future, the carbon footprint evaluation of Fengqing Yunnan black tea products "from cradle to grave" and the sustainable development of its industrial value chain will be our research focus.
Data availability statement
The original contributions presented in the study are included in the article/Supplementary material, further inquiries can be directed to the corresponding author.
Author contributions
CZ contributed to the conception of the study; CZ and XY performed the experiment; XW and XY contributed significantly to the analysis and manuscript preparation; XY performed the data analyses and wrote the manuscript; XY helped perform the analysis with constructive discussions.
Funding
This work was supported by the Postdoctoral Program of the International Training Program for Outstanding Young Scientific Research Talents in Guangdong Province, and the Ordos Social Science Project (2022D023).
Conflict of interest
CZ and XY were employed by Heshan Xinde Biological Products Co., Ltd.
The remaining authors declare that the research was conducted in the absence of any commercial or financial relationships that could be construed as a potential conflict of interest.
Publisher’s note
All claims expressed in this article are solely those of the authors and do not necessarily represent those of their affiliated organizations, or those of the publisher, the editors and the reviewers. Any product that may be evaluated in this article, or claim that may be made by its manufacturer, is not guaranteed or endorsed by the publisher.
References
Azapagic, A., Bore, J., Cheserek, B., Kamunya, S., and Elbehri, A. (2016). The global warming potential of production and consumption of Kenyan tea. J. Clean. Prod. 112, 4031–4040. doi:10.1016/j.jclepro.2015.07.029
Bingqiang, Z. (2016). Modification of conventional fertilizers for enhanced property and function. J. Plant Nutr. Fertilizer 22 (1), 1–7. doi:10.11674/zwyf.14470
Cichorowski, G., Joa, B., Hottenroth, H., and Schmidt, M. (2015). Scenario analysis of life cycle greenhouse gas emissions of darjeeling tea. Int. J. Life Cycle Assess. 20 (4), 426–439. doi:10.1007/s11367-014-0840-0
Clavreul, J., Guyonnet, D., and Christensen, T. (2012). Quantifying uncertainty in LCA-modelling of waste management systems. Waste Manag. 32 (12), 2482–2495. doi:10.1016/j.wasman.2012.07.008
Deng, Y., Ma, L., Li, T., Li, J., and Yuan, C. (2018). Life cycle assessment of silicon-nanotube-based lithium ion battery for electric vehicles. ACS Sustain. Chem. Eng. 7 (1), 599–610. doi:10.1021/acssuschemeng.8b04136
Dijkman, T., Basset-Mens, C., and Antón, A. (2018). LCA of food and agriculture life cycle assessment. Cham: Springer, 723–754.
Doublet, G., and Jungbluth, N. (2010). Life cycle assessment of drinking darjeeling tea. Conventional and organic darjeeling tea. Uster: ESU-services Ltd.
Fusi, A., Guidetti, R., and Benedetto, G. (2014). Delving into the environmental aspect of a Sardinian white wine: from partial to total life cycle assessment. Sci. Total Environ. 472, 989–1000. doi:10.1016/j.scitotenv.2013.11.148
Han, Y., Xiao, H., Qin, G., Song, Z., Ding, W., and Mei, S. (2014). Developing situations of tea plucking machine. Engineering 6 (6), 268–273. doi:10.4236/eng.2014.66031
Hayat, K., Iqbal, H., Malik, U., Bilal, U., and Mushtaq, S. (2015). Tea and its consumption: benefits and risks. Crit. Rev. Food Sci. Nutr. 55 (7), 939–954. doi:10.1080/10408398.2012.678949
Igos, E., Benetto, E., Meyer, R., Baustert, P., and Othoniel, B. (2019). How to treat uncertainties in life cycle assessment studies? Int. J. Life Cycle Assess. 24 (4), 794–807. doi:10.1007/s11367-018-1477-1
Khanali, M., Mobli, H., and Hosseinzadeh-Bandbafha, H. (2017). Modeling of yield and environmental impact categories in tea processing units based on artificial neural networks. Environ. Sci. Pollut. Res. 24 (34), 26324–26340. doi:10.1007/s11356-017-0234-5
Khoshnevisan, B., Rafiee, S., Omid, M., Mousazadeh, H., and Clark, S. (2014). Environmental impact assessment of tomato and cucumber cultivation in greenhouses using life cycle assessment and adaptive neuro-fuzzy InferenceSystem. J. Clean. Prod. 73, 183–192. doi:10.1016/j.jclepro.2013.09.057
Kim, T., and Tae, S. (2016). Proposal of environmental impact assessment method for concrete in South Korea: an application in LCA (life cycle assessment). Int. J. Environ. Res. Public Health 13 (11), 1074. doi:10.3390/ijerph13111074
Kouchaki-Penchah, H., Nabavi-Pelesaraei, A., O'Dwyer, J., and Sharifi, M. (2017). Environmental management of tea production using joint of life cycle assessment and data envelopment analysis approaches. Environ. Prog. Sustain. Energy 36 (4), 1116–1122. doi:10.1002/ep.12550
Lacirignola, M., Blanc, P., Girard, R., Perez-Lopez, P., and Blanc, I. (2017). LCA of emerging technologies: addressing high uncertainty on inputs' variability when performing global sensitivity analysis. Sci. Total Environ. 578, 268–280. doi:10.1016/j.scitotenv.2016.10.066
Li, S., Lo, C., Pan, M., Lai, C. S., and Ho, C. T. (2013). Black tea: chemical analysis and stability. Food Funct. 4 (1), 10–18. doi:10.1039/c2fo30093a
Meex, E., Hollberg, A., Knapen, E., Hildebrand, L., and Verbeeck, G. (2018). Requirements for applying LCA-based environmental impact assessment tools in the early stages of building design. Build. Environ. 133, 228–236. doi:10.1016/j.buildenv.2018.02.016
Mu, C., Chen, X. H., and Lin, W. J. (2020). Nitrogen balance status and greenhouse gas mitigation potential in typical Oolong tea production areas. J. Agric. Resour. Environ. 37 (2), 186–194. doi:10.13254/j.jare.2019.0068
Munasinghe, M., Deraniyagala, Y., Dassanayake, N., and Karunarathna, H. (2017). Economic, social and environmental impacts and overall sustainability of the tea sector in Sri Lanka. Sustain. Prod. Consum. 12, 155–169. doi:10.1016/j.spc.2017.07.003
Nabavi-Pelesaraei, A., Rafiee, S., Mohtasebi, S., Hosseinzadeh-Bandbafha, H., and Chau, K. (2018). Integration of artificial intelligence methods and life cycle assessment to predict energy output and environmental impacts of paddy production. Sci. Total Environ. 631-632, 1279–1294. doi:10.1016/j.scitotenv.2018.03.088
Naranjo, A., Johnson, A., Rossow, H., and Kebreab, E. (2020). Greenhouse gas, water, and land footprint per unit of production of the California dairy industry over 50 years. J. Dairy Sci. 103 (4), 3760–3773. doi:10.3168/jds.2019-16576
Sari, F., and Velioglu, Y. (2013). Changes in theanine and caffeine contents of black tea with different rolling methods and processing stages. Eur. Food Res. Technol. 237 (2), 229–236. doi:10.1007/s00217-013-1984-z
Sharma, A., and Dutta, P. (2018). Scientific and technological aspects of tea drying and withering: a review. Agric. Eng. Int. CIGR J. 20 (4), 210–220.
Soheili-Fard, F., Kouchaki-Penchah, H., Raini, M., and Chen, G. (2018). Cradle to grave environmental- economic analysis of tea life cycle in Iran. J. Clean. Prod. 196, 953–960. doi:10.1016/j.jclepro.2018.06.083
Tang, J., Wu, L., and Wu, J. (2011). Relations between tea yields & quality and applied ratio of NPK fertilizers in the initial production tea garden. J. Tea Sci. 31 (1), 11–16. doi:10.13305/j.cnki.jts.2011.01.003
Xu, Q., Hu, K., Wang, X., Wang, D., and Knudsen, M. T. (2019). Carbon footprint and primary energy demand of organic tea in China using a life cycle assessment approach. J. Clean. Prod. 233, 782–792. doi:10.1016/j.jclepro.2019.06.136
Xu, Q., Yang, Y., Hu, K., Chen, J., and Djomo, S. N. (2021). Economic, environmental, and emergy analysis of China's green tea production. Sustain. Prod. Consum. 28, 269–280. doi:10.1016/j.spc.2021.04.019
Yu, H., Hongru, X., and Zhiyu, S. (2015). Study on mechanized operation mode of tea garden in China. China Agric. Sci. Technol. Rep. 18 (3), 74–81.
Zackrisson, M., Avellán, L., and Orlenius, J. (2010). Life cycle assessment of lithium-ion batteries for plug-in hybrid electric vehicles–critical issues. J. Clean. Prod. 18 (15), 1519–1529. doi:10.1016/j.jclepro.2010.06.004
Zhang, D., Tan, S., and Gersberg, R. (2010). Municipal solid WasteManagement in China: Status, problems and challenges. J. Environ. Manag. 91 (8), 1623–1633. doi:10.1016/j.jenvman.2010.03.012
Zhou, X., Huang, G., Li, Y., Lin, Q., Yan, D., and He, X. (2021). Dynamical downscaling of temperature variations over the Canadian prairie provinces under climate change. Remote Sens. 13 (21), 4350. doi:10.3390/rs13214350
Keywords: black tea, carbon footprint, life cycle assessment, process optimization, system efficiency
Citation: Zhang C, Ye X, Wu X and Yang X (2023) Carbon footprint of black tea products under different technological routes and its influencing factors. Front. Earth Sci. 10:1046052. doi: 10.3389/feart.2022.1046052
Received: 16 September 2022; Accepted: 16 November 2022;
Published: 13 January 2023.
Edited by:
Chuanbao Wu, Shandong University of Science and Technology, ChinaReviewed by:
Zhen Liu, Shandong Agricultural University, ChinaXiong Zhou, Beijing Normal University, China
Copyright © 2023 Zhang, Ye, Wu and Yang. This is an open-access article distributed under the terms of the Creative Commons Attribution License (CC BY). The use, distribution or reproduction in other forums is permitted, provided the original author(s) and the copyright owner(s) are credited and that the original publication in this journal is cited, in accordance with accepted academic practice. No use, distribution or reproduction is permitted which does not comply with these terms.
*Correspondence: Congguang Zhang, cWF1bHh4akBob3RtYWlsLmNvbQ==