
95% of researchers rate our articles as excellent or good
Learn more about the work of our research integrity team to safeguard the quality of each article we publish.
Find out more
ORIGINAL RESEARCH article
Front. Earth Sci. , 14 December 2022
Sec. Marine Geoscience
Volume 10 - 2022 | https://doi.org/10.3389/feart.2022.1045716
On inner continental shelves, a variety of coarse grained bedforms, such as gravel dunes, are shaped by hydrodynamic and morphodynamic processes. The formation and evolution of bedforms reflect a balance between seabed and coastal morphology, sediment type and availability, and regional hydrodynamics. Yet, observing bedform evolution directly in the marine environment is rare, mostly due to the lack of repeat seafloor mapping surveys. In this study we use repeat bathymetry from 3 surveys over 4 years from the western Cook Strait/Te Moana-o-Raukawakawa region, New Zealand/Aotearoa. We integrate seabed morphology characterisation with sediment classification and regional hydrodynamic modelling, to investigate the evolution of gravel dunes under multi-directional current conditions. The repeat seafloor mapping reveals morphological changes to plan-view dune geometry and bifurcation of crestlines, with maximum observed vertical changes up to 3 m at water depths between 60 and 80 m. However, no dune migration was detected. Our hydrodynamic model shows that the most prominent morphological changes over the gravel dunes are spatially correlated with eddy formation, and high multi-directional near-bottom currents, reaching maximum speeds of ∼4 m s−1 and bottom stress of >25 N m−2 in each tidal cycle. We demonstrate that the average hydrodynamic conditions in this region are capable of mobilising coarse-grained sediment (i.e., sand to gravel), indicating that the observed morphological changes over multi-year time scales are a result of continuous remobilisation by currents, rather than extreme or storm events. Our findings demonstrate the highly dynamic nature of the seabed in Cook Strait, and the need for regular, repeat mapping surveys to ensure up-to-date seabed morphology information.
Coarse-sediment bedforms, such as gravel dunes, are common features on continental shelves globally (Carling, 1999; Flemming, 2000a). The formation and evolution of gravel dunes in marine environments is complex and depends on regional hydrodynamic conditions and geological setting. Gravel dunes are generally distributed in areas with low to moderate continental sediment inputs and moderate to high-energy conditions (Lo Iacono & Guillén, 2008; Li et al., 2014). Waves generated during low-frequency high-energy storm events appear to be the main forcing mechanism of gravel dunes observed near or connected to the coastlines (Lo Iacono & Guillén, 2008). Below the wave base, bottom currents play a key role in initiating coarse sediment motion and in dune evolution with increasing flow velocity (Flemming, 2000b).
The depth, morphology and orientation of seafloor bedforms can be captured with multibeam bathymetry, and this information is often used to infer submarine sediment transport processes (Lobo et al., 2000; Lamarche et al., 2011; Hughes-Clarke, 2012; Damen et al., 2018; Mitchell et al., 2021). However, morphological changes in bedforms cannot be observed in a single bathymetric dataset, and in the absence of direct observations, numerical or physical modelling experiments are needed to simulate bedform evolution and test potential driving mechanisms (Venditti et al., 2005; Doré et al., 2016; Wang et al., 2019). Having a precise knowledge of the continuous seabed changes worldwide should be accounted for in any assessment of modern and future offshore infrastructure (e.g., submarine cables, tidal turbines, wind power systems) and for navigational safety (Langhorne, 1977; Whitehouse et al., 2000; Stevens et al., 2012; Barrie & Conway, 2014; Majdi Nasab et al., 2021).
In this study we examine morphological changes in gravel dunes located in the western Cook Strait/Te Moana-o-Raukawakawa, New Zealand/Aotearoa. We use repeat multibeam datasets over multi-year (3-year and 1-year) periods. In conjunction with the bathymetric dataset, we analyse seabed sediment samples and run our hydrodynamic numerical model. Our aim is to determine whether the observed morphological changes can be accounted for within the average regional hydrodynamic context or are more likely to be associated with infrequent storm events. Our research contributes to a better understanding of the influence of multi-directional near-bottom currents on the morphological evolution of coarse-grained bedforms. Our results demonstrate the importance of daily current action in shaping continental shelves in Cook Strait.
The study area is located in the western Cook Strait/Te Moana-o-Raukawakawa, adjacent to the outer Queen Charlotte Sound/Tōtaranui (QCS), north-east of the South Island/Te Waipounamu of New Zealand/Aotearoa (Figure 1).
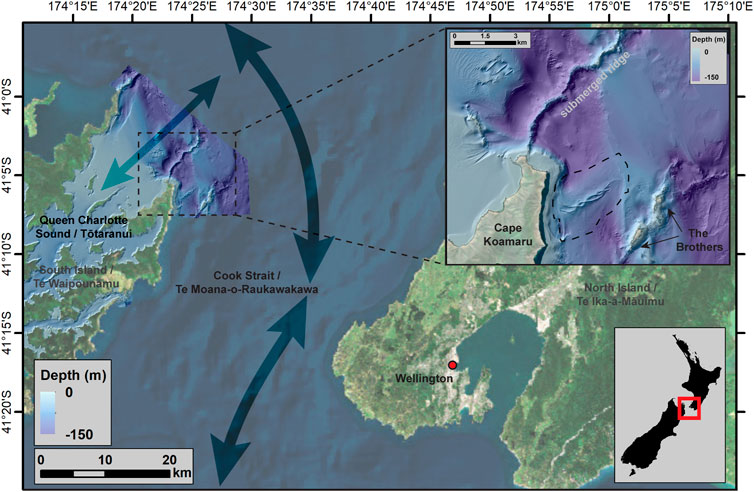
FIGURE 1. Regional bathymetric map of the western Cook Strait/Te Moana-o-Raukawakawa and outer Queen Charlotte Sound/Tōtaranui (QCS) region (satellite imagery source: Esri). High resolution multibeam data collected during the HS51 survey is overlain within the QCS region. Arrows indicate the predominant tidal current directions along Cook Strait and across the entrance of QCS. Black dashed box delimits the study area, shown in detail in the zoom-in inset. Zoom-in inset shows the bathymetric map of the study site, with the 2-m resolution HS51 bathymetry data collected in 2017.
The Cook Strait is a narrow (∼22 km wide and up to 350 m deep) passage of water, separating New Zealand’s North/Te Ika-a-Māui and South/Te Waipounamu Islands (Figure 1). Cook Strait is subject to some of the strongest currents in the world, reaching flows as high as 3.4 m s−1 during spring tides (Heath, 1978; Vennell et al., 1991; Vennell, 1994; Stanton et al., 2001; Stevens et al., 2012). These velocities are caused by a phase difference (i.e., timing of tidal heights) between the tides on either side of Cook Strait (Walters et al., 2010; Stevens, 2014). The strong Cook Strait currents impact the adjacent regions, including the QCS, where near-bottom (∼5 m above seabed) currents can reach speeds of >1 m s−1 (Hadfield et al., 2014), with maximum values of ∼2.3 m s−1 during spring tide (Plew & Stevens, 2013).
The QCS located in the greater Marlborough Sounds/Te Tau Ihu o te Waka a Māui area, a large network of sea-drowned valleys, part of a tectonic block bounded to the south by the Wairau Fault (or Vernon Fault) and to the west by the Waimea-Flaxmore Fault System (Nicol, 2011), both E-NE striking faults. Following this NE-SW orientation, we observe a field of bedforms on the eastern side of Cape Koamaru (dashed line in the inset in Figure 1), and a submerged ridge extending at least 10 km seawards toward Cook Strait (Figure 1). This ridge is bordered on both sides by troughs that descend to 250 m water depth (Watson et al., 2020). To the south-east of the bedforms, The Brothers islands (Figure 1) are the emergent expression of a similar NE trending submarine ridges, rising to ∼240 m height above seabed. The composition and formation of these ridges have not been constrained as they have never been sampled (Watson et al., 2020).
The Marlborough Sounds region has been subject to regional subsidence, tilting, and sea-level fluctuations since the last-glacial maximum (∼18 ka) (Lauder, 1970; Lauder, 1987; Craw et al., 2010; Nicol, 2011). The QCS is one of the main inlets of this area, with an intricate and complex coastline, and characterised by post-glacial sediment deposition, with sediment thickness up to 400 m at the valley axis (Lauder, 1970; Singh, 2001; Nicol, 2011). No large rivers flow into QCS, however continuous changes in land-use and modifications of the coastline have led to large quantities of sediment run-off, increasing the input of fine sediment in the inner valley (Heath, 1974; Lauder, 1987; Urlich, 2015). This fine sediment grades from clay and silts to fine sand, to coarse substrates characterising the outer region of QCS, adjacent to Cook Strait (Boyce, 1971; Lewis & Mitchell, 1981; Lauder, 1987).
Baseline multibeam acoustic data (multibeam bathymetry and seafloor backscatter), and ground-truth data (video footage and sediment samples) used in this study were collected in 2017 as a part of the HS51 hydrographic survey, carried out by National Institute of Water & Atmospheric Research Limited (NIWA) and Discovery Marine Limited (DML) on behalf of Marlborough District Council (Figure 1). The second and third bathymetry surveys were conducted in July 2020 and May 2021 using the Kongsberg EM 2040D multibeam echosounder systems on RV Kaharoa and on RV Ikatere. We designed the repeat mapping surveys to specifically target the field of sedimentary bedforms that were detected in the original bathymetry survey (Figure 1). All bathymetric datasets from the three surveys were processed using QPS Qimera software (V 2.3.5) and were gridded at 2 m horizontal resolution. For details pertaining to acquisition and processing of the bathymetric data, and grain size distribution analyses, refer to Neil et al. (2018); and Watson et al. (2020).
The Regional Ocean Modelling System (ROMS, Haidvogel et al., 2008) was set up for a domain in the QCS to provide time-varying, depth-resolved estimates of current speed and direction. The model had a horizontal resolution of 100 m and a terrain-following sigma-coordinate scheme was used in the vertical with 20 layers to provide a varying vertical resolution of 0.1 m–28 m (see further details in Supporting Information, Supplementary Figure S4). The velocities presented in the results are from the bottom sigma layer which is situated about 5 m above the seafloor in the study region. Two components of velocity (u and v) are reported for flows into and out of QCS (for u-component) and perpendicular to this, along the QCS entrance (for v-component). A positive u value indicates flows out of QCS, towards Cook Strait (approx. north-eastward) and a positive v value indicates a flow direction along the entrance to QCS (approx. north-westward).
The bottom stress is given by a formulation calculated as:
Where
Where
The model initial state and boundary conditions for temperature, salinity, and non-tidal currents came from a larger 2 km-scale Cook Strait model (Chiswell et al., 2019; Hadfield & Stevens, 2020) and tidal currents for 13 tidal constituents (M2, S2, N2, K2, Kl, 01, PI, Ql, 2N2, MU2, NU2, L2, T2) came from the NIWA New Zealand region tidal model (Walters et al., 2001). Surface wind stress came from the New Zealand Limited Area Model (NZLAM) (Webster et al., 2008) and surface heat fluxes from National Centre for Environmental Prediction (NCEP) models (Kalnay et al., 1996). Surface freshwater fluxes were calculated by subtracting NCEP modelled evaporation from locally collected rainfall data (NIWA, 2014). Freshwater input from land runoff was estimated using land-rainfall data.
Mean, max, fifth, and 95th percentiles were calculated for each of u-component and v-component at each grid cell using models’ snapshots at 30-min intervals over 40 days, between 24 May 2021 and 3 July 2021. The 95th percentile represents the strongest NE flows (for u-component) and NW flows (for v-component) velocities. The fifth percentile represents the strongest SW flows (for u-component) and SE flows (for v-component) velocities. Since tidal currents dominate the flow in this region (Walters et al., 2010), particularly at the entrance to the QCS, seasonal and interannual variabilities not captured in the shorter model run (e.g., variabilities in the wind-driven flow) will not have a large influence on the results presented here. Near the location of the bedforms fields, the mean significant wave height and wave period within the time series from 1993 to 2019, is ∼1.3 m and 5.7 s, respectively (Albuquerque et al., 2021a, 2022). The calculated mean wave base depth is 25 m, which is shallower than the water depth where we observe the bedforms, between 50 and 120 m.
Bathymetric derivatives (i.e., slope, curvature, aspect) were created using the Benthic Terrain Modeller (BTM) tool in ArcGIS software (Walbridge et al., 2018) (Supplementary Figure S1). We delineated the crest of the dunes using the bathymetric position index (BPI). BPI is a measure of the elevation of a focal point compared to the mean elevation of the neighbouring cells within a user-defined area (computed using the BTM tool, using the Build Fine-Scale BPI, with inner and outer radius of 8 and 11, respectively, and scale factor (automatically computed) 22). The obtained BPI values represent the locations of bedforms crests (BPI >0, locations that are higher than the average of their surroundings; Figure 2A) and troughs (BPI <0, locations that are lower than the surroundings). The bedforms crest and trough locations (Figure 2B) were extracted from bathymetric transects orthogonal to the crest lines, spaced 2 m from one another (i.e., bathymetric grid resolution, see further details in Supporting Information, Supplementary Figure S4), from bathymetric grids (2017, 2020 and 2021). The 2-D spectral method Fourier decomposition analyses (following the method described by (Damen et al., 2018)) was used to calculate the geometric parameters, including height (h), wavelength (L) and asymmetry index (AI = (L2−L1)/L) (Figure 2B).
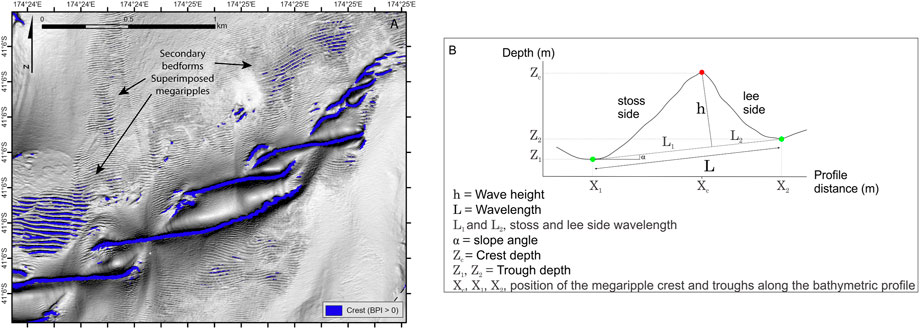
FIGURE 2. (A) Bathymetric position index (BPI) overlain over greyscale slope map, detecting the gravel dune crests in blue (BPI >0). (B) Schematic representation of the measurements extracted for each megaripple, used to calculate key geometric parameters.
Multibeam bathymetry data reveal a field of bedforms located south-east of Cape Koamaru (Figure 1), between 60 and 100 m water depth, and less than 1 km away from the coastline. The observed dunes appear to be intertwined in plan-view, forming a braided dune field (Figure 3). These bedforms have a symmetrical shape with heights ranging from 2 to 20 m, wavelengths from ∼50–250 m, and crestline lengths from 100 m to >800 m, decreasing towards the NE. The dune crests are curvilinear and change orientation from E-W to an NNE-SSW, which produces the distinctive braided shape (Figure 3).
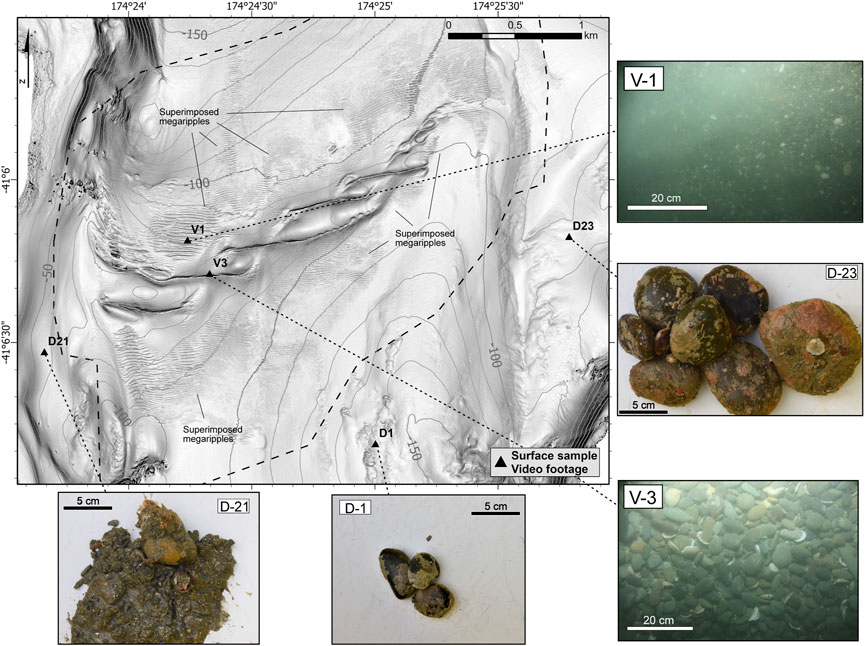
FIGURE 3. Map of the bedforms field located SE of the Cape Koamaru (see location in Figure 1) indicating the location of sampling sites and video footage, with photographs of the sediment samples and seafloor images. Dashed black line limits the re-mapped area and 10 m contour depths are shown as thin grey lines. Greyscale shaded relief uses slope (rather than hillshade) to represent seafloor features, to reduce bias from artificial light source elevation and azimuth.
Secondary bedforms, here referred to as superimposed megaripples, are observed over the dunes, on the northern and southern flanks of the braided dune field (Figure 3). Superimposed megaripples have wavelengths ranging from ∼6 to ∼24 m, with maximum heights of ∼2 m, decreasing in size (wavelength and height) with distance away from the dune field (i.e., towards the north and the south) and from the coastline (i.e., to the east; Figure 3).
The sediment samples collected closest to shore show predominantly gravel sized sediments (i.e., D-21 sample, classified as very coarse sand (if using the method of moments) and very fine gravel (following the Folk and Ward method), see details in Supplementary Table S1, Supplementary Figure S2 and Figure 3). Further offshore, sediments are composed entirely of cobbles (i.e., D-1 and D-23 samples; Figure 3). As such, particle size analyses (i.e., laser grain size distribution) was not performed on these sample. Video footage shows that the dunes are composed of cobble to gravel-sized grains, and the superimposed megaripples comprise a mix of gravel and sand-sized grains (i.e., V3 and V1, respectively; Figure 3).
Differential erosion and deposition are detected in the northern and southern sides of the dunes in both repeat mapping surveys (Figure 4). Up to 5 m of erosion was detected during in the south-west of the dune field over the 3-year period between 2017 and 2020.
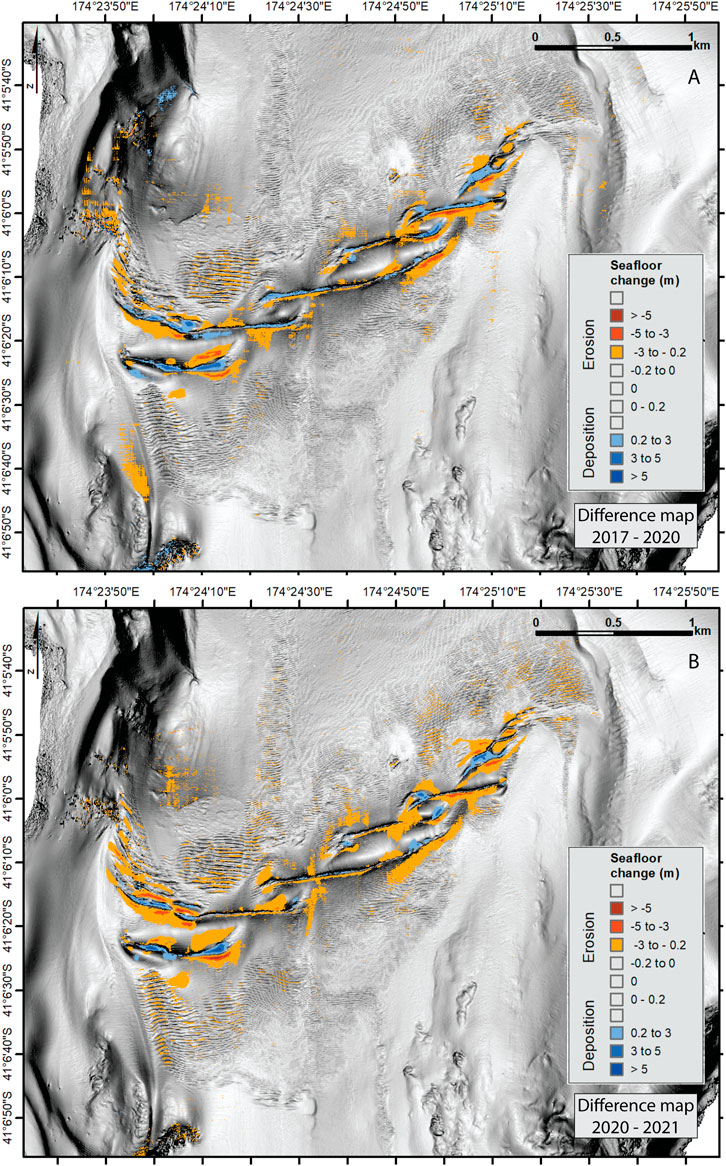
FIGURE 4. Multibeam seafloor slope map with overlaid magnitude of erosion and deposition measured by differencing (A) the 2017 and 2020 surveys (3-year time interval), and (B) the 2020 and 2021 surveys (1-year time interval). (Note: uncertainty in bathymetry datasets at this depth is up to ±0.2 m and has been left transparent in these figures to represent this). For depth information of the area, refer to Figure 3 showing depth contour lines (spaced 10 m). Greyscale shaded relief uses slope (rather than hillshade) to represent seafloor features, to reduce bias from artificial light source elevation and azimuth.
Deposition is the highest over the same region close to the coast (Figure 4A). However, the maximum erosion (i.e., >5 m vertically) during this period is detected over the crest of the dunes, both close to the coast and on the easternmost extent (Figure 4A). During the 1-year period between 2020 and 2021, we measure more erosion than deposition, with the highest erosion concentrating in the same locations along dune crests in the south-western and eastern portion of the bedform field (Figure 4B).
When comparing all bathymetric datasets, the most distinctive change in dune morphology occurs near the coast, on the western side of the gravel dunes (Figure 5, 6). Here, we observe bifurcation of dune crests forming two smaller dunes of shorter crest length (between ∼300 and 400 m) between 2017 and 2020. This dune crest then reforms between 2020 and 2021. However, we do not observe overall dune migration (Figure 5).

FIGURE 5. Morphological evolution of dunes represented by the dunes crest digitised on the three multibeam maps from the 2017 (blue), 2020 (green) and 2021 (red) surveys. Lower panel shows the bathymetric profiles (A-A′) extracted from the three multibeam datasets. For depth information of the area, refer to Figure 3 showing depth contour lines (spaced 10 m). Greyscale shaded relief uses slope (rather than hillshade) to represent seafloor features, to reduce bias from artificial light source elevation and azimuth.
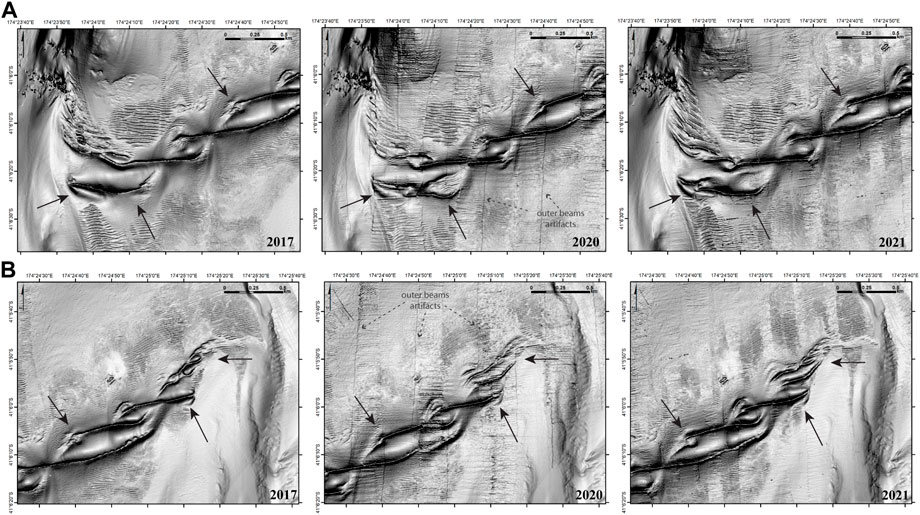
FIGURE 6. Detail of dunes with superimposed megaripples mapped in 2017 (left), 2020 (central) and 2021 (right), close to shore (A), and seaward at the end of the bedform field (B) (see location of zoom-in areas in Figure 5). Black arrows point to locations with the most prominent morphological changes between the three surveys. (Note: due to substantially deteriorated sea state during the 2020 survey, there is additional artifacts in this dataset, manifesting as linear outer beam noise that remains even after processing the data). For depth information of the area, refer to Figure 3 showing depth contour lines (spaced 10 m). Greyscale shaded relief uses slope (rather than hillshade) to represent seafloor features, to reduce bias from artificial light source elevation and azimuth.
The hydrodynamic model outputs show mean near-bottom currents (∼5 m above the seafloor) reaching speeds of >2 m s−1 (Figure 7). The strongest flows, with maximum values of ∼4 m s−1, occur along the north and eastern sides of Cape Koamaru (Figure 7A, B), coinciding with the areas where the modelled bed shear stress reaches maximum values of >20 N m−2 (Figures 7C, D).
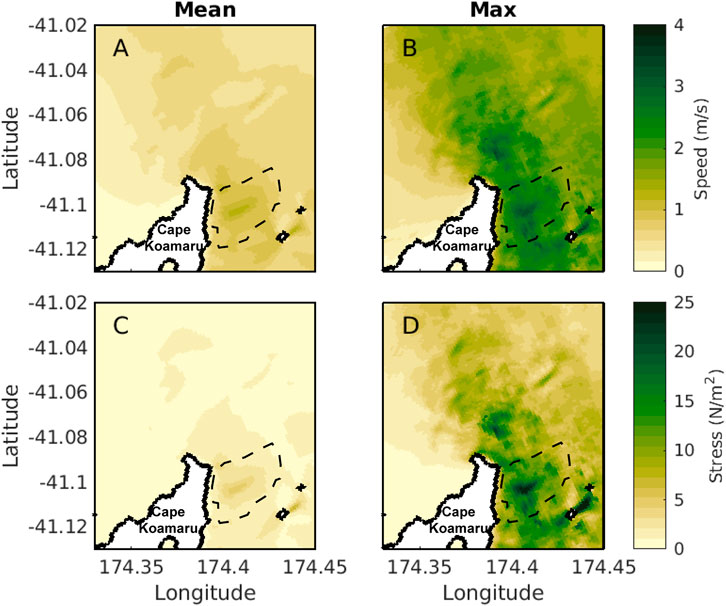
FIGURE 7. Modelled mean (A) and maximum (B) near-bottom current speed (m s−1). Modelled mean (C) and maximum (D) bottom stress (N m−2) in the study area. Black dashed lines outline the area where the bedforms are located (see Figure 1 for reference).
The tidal bottom currents are the strongest in the study region, SE of Cape Koamaru (Figure 8). The strongest positive velocities (the 95th percentile) indicate the strength of the tides in the north-westward (Figure 8B) and north-eastward (Figure 8E) direction. The strongest negative velocities (the fifth percentile) indicate the strength of the tides in the south-eastward (Figure 8A) and south-westward (Figure 8D) direction. To the SE of Cape Koamaru, the tidal currents in the north-west/south-east direction tend to be stronger than the currents in north-east/south-west direction. Tidal current velocities are sometimes non-symmetrical, where one tidal direction has stronger velocities than the opposing one. These non-linearities can be seen in the difference between the 5th and 95th percentiles (Figures 8C, 8F) with notable asymmetries SE of Cape Koamaru. In the western half of the SE Cape Koamaru, tidal currents are stronger in the northerly direction than the southerly direction (with a difference in the 5th and 95th percentiles of 1 m s−1). Whilst less pronounced, there is a stronger southeastward than northwestward tidal flow in the middle of the SE Cape Koamaru (with a difference in the 5th and 95th percentiles of ∼0.2 m s−1).
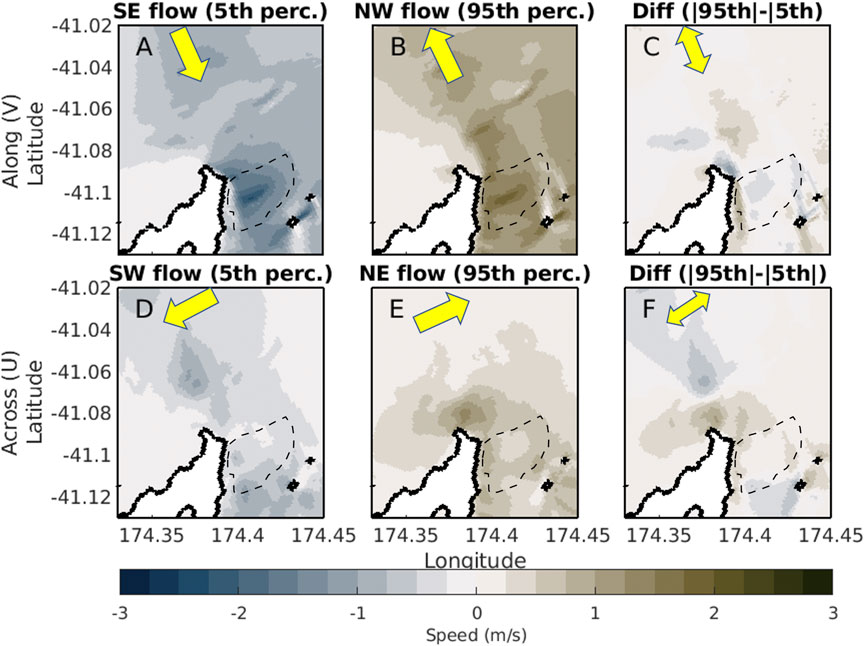
FIGURE 8. The 5th and 95th percentile for components of near-bottom currents along the entrance to QCS [top panels (A, B)] and into/out of QCS [bottom panels (D, E)]. The difference between the 95th and fifth percentile for the u and v components to velocity is shown in panels (C, F). Brown indicates a stronger positive (northeastward and northwestward) flow and blue indicates a stronger negative (southeastward and southwestward) flow. The yellow arrows at the top left of each panel indicates the direction of the flow that is being shown in each panel [panels (A-C) show currents flowing along the entrance of outer QCS; panels (D-F) show currents flow across the entrance of QCS]. Black dashed lines outline the area where the bedforms are located (see Figure 1 for reference).
Here we analysed the morphological changes observed across multiple multibeam surveys over a coarse-sediment bedform field, in water depths of 50–120 m (Figures 3–6). The study region is characterised by multi-directional near-bottom currents, due to the combination of two dominant tidal current flows: NW-SE directed Cook Strait tidal flow, and NE-SW directed tidal flow at the outer QCS (Figures 1, 8).
Our hydrodynamic model reveals that ocean currents SE of Cape Koamaru interact with the complex coastal morphology (e.g., presence of headlands or promontories), and seafloor roughness (i.e., erosional scours/moats, see details in seafloor slope and backscatter information (seafloor hardness) in Supplementary Figures S1, S2), to create eddies, jets and non-linearities in the flow (Figure 9). During each tidal cycle near-bottom currents reach velocities of up to ∼4 m s−1 (Figures 7–9) and bottom stress of up to 25 N m−2 (Figure 7). Near-bottom currents within the eddies reach values >1 m s−1 soon after formation and increase to up to ∼4 m s−1 (Figures 7, 9), as the eddies move northwards and southwards (Figures 9, 10), following the dominant direction of the tidal flow in Cook Strait (Stevens, 2014). Eddy formation occurs adjacent to the coast, south of the SE Cape Koamaru, and near the bedform field (Figure 9). This area is also where the most prominent changes in dune morphology are observed using repeat seafloor mapping over both one- and three- year intervals (Figures 3–5).
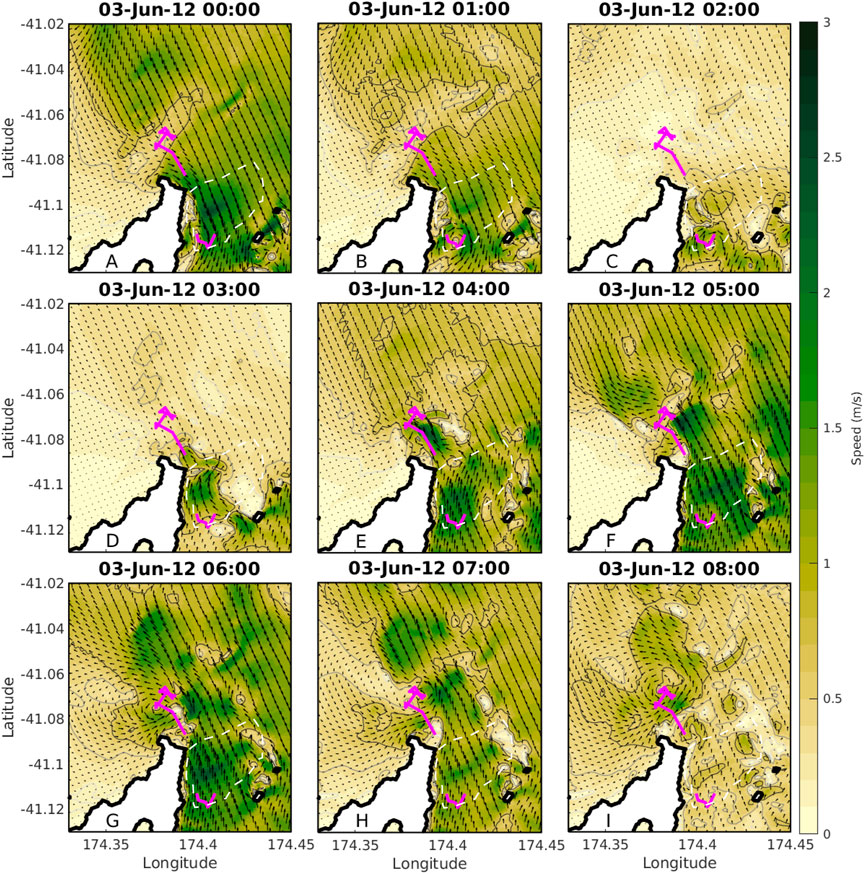
FIGURE 9. Snapshots of modelled near-bottom currents over one tidal cycle (date and time indicated in title of each panel). Colourscale shows current speed, black arrows are current flow vectors and indicate direction of flow. Magenta lines show the path of two eddies formed by the tidal flow. White dashed lines outline the area where the bedforms are located (see Figure 1 for reference).
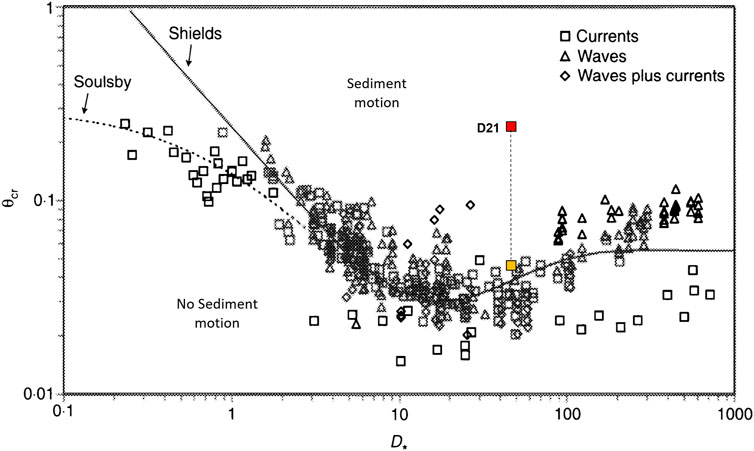
FIGURE 10. Threshold of motion of sediments beneath currents (modified from Soulsby (1997), with θcr being the threshold Shields parameter and D* being the dimensionless grain size) showing that the gravel forming the bedforms in the study region are continuously entrained in each tidal cycle. Red and orange squares represent the maximum (95th percentile) and average bottom stress, respectively, in sampling site D-21 (see location of sample in Figure 3) Note: only sample D21 collected over the gravel dune field was used for this analysis. This sample is composed of >86% of gravel (see Table S1), and is over the threshold of motion of sediment, under maximum and average bottom stress conditions. Samples D1 and D23, collected adjacent to the gravel dunes field (Figure 3), are cobbles with particle sizes ranging between 5 and 10cm; these particles are placed below the threshold of motion of sediment (Supplementary Figure S5).
To the northwest of Cape Koamaru, the fast NW-SE flowing Cook Strait tidal currents curve around the headland, merging into the NE-SW tidal currents flowing in and out of QCS (Figures 8–10). The spatial correlation between eddy development and changes observed in the bedform field suggest that these processes are related.
Our findings are comparable with the results from similar studies in other regions, such as the study conducted in the Bay of Fundy by Li et al. (2014). These authors support the concept that the development and maintenance of coarse-sediment bedforms around headlands is controlled by the variation of tidal current speed and direction, bed shear stress and sediment transport pattern through the course of the tidal cycle (Li et al., 2014). Overall, the gravel dunes presented here are found in a regional setting characterised by low continental sediment input and high-energy conditions, analogous to the coarse-sediment bedforms observed on many oceanic inner shelves around the world, and specifically on the Atlantic margins and western North American shelf (see examples in Lo Iacono and Guillén (2008), their Figure 1).
Analyses of sediment movement thresholds (following Soulsby (1997) calculations) indicate that the average near-bottom currents in this area are strong enough to entrain and transport the coarse-sediment (gravel) fraction and influence the evolution of the coarse-sediment dunes (Figure 11). Calculations of sediment mobilisation thresholds were conducted using 1) the maximum and minimum values of bottom stress extracted from the model outputs, calculated specifically on each of the sampling sites (8.7 and 1.4 × 10⁻⁴ N/m2, respectively; with corresponding maximum and minimum near-bottom currents of 1.8 and 1.3 × 10⁻³ m/s), 2) grain size density and 3) D50 measurements resulting from the grain size analysis (i.e., 2,650 kg/m3 and 2,305.3 µm, respectively, for sample D-21, classified as very coarse sand (if using the method of moments) and very fine gravel (following the Folk and Ward method), see details in Table S1). Our results indicate that the strong near-bottom currents combined with eddy formation, and the associated bottom stresses reached in the study area, exceed the critical thresholds of the gravel-sized sediments mobilisation (Figure 11). Sediments adjacent to the gravel dunes are composed of coarser fraction, i.e., cobbles of diameters between 5–>10 cm (samples D-1 and D-23 in Figure 3). Although this coarse fraction is below the threshold of motion of sediment by near-bottom currents (Supplementary Figure S5), the gravel fraction over the dune field was mobilised even during average bed shear stress conditions (Figure 11).
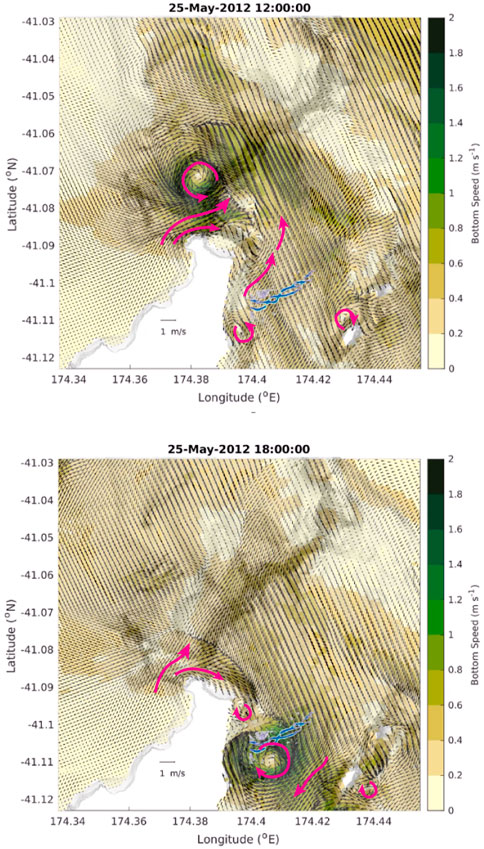
FIGURE 11. Modelled near-bottom currents at different times during a tidal cycle on the 26th–27 May 2012 (when in-situ observations were recorded (see details in Hadfield et al., 2014)), with the bedforms SE of Cape Koamaru (bedform crests delineated in blue) overlapped. Magenta arrows indicate predominant near-bottom current direction in different sites, highlighting the relationship between eddy formation, coastal morphology, and seabed features.
The results of this study show that the changes observed in bedform morphology over three- and 1-year periods, are a result of near constant reshaping by currents, rather than a result of infrequent catastrophic events (e.g., storm). We here demonstrate that the regular mobility of the seabed in this region, in each tidal cycle, even at depths well below the wave base (mean wave depths area ∼25 m near the region where bedforms are observed) (Albuquerque et al., 2021a, 2022). Only during high energy events (i.e., storms), the wave base can reach maximum depths between 80 and ∼100 m. Although this is within the water depth in which we observe the bedforms (Figure 3), these infrequent events are here assumed to not have large influence on the continuous shaping of bedforms, mainly caused by the entrainment of the coarse sediment due to the high bottom stress reached in this area.
The evolution of bedform geometry and morphology depends on the seabed slope and roughness, sediment availability and grain size, and regional hydrodynamics, including tidal characteristics and the associated residual currents (Zang et al., 2011; Wang et al., 2019). In this study we show the continuous morphological changes of the coarse-sediment dunes are likely related to daily tidal cycles. We recognise that there is an imbalance between the time scales from the bathymetric datasets (i.e., multi-year seafloor changes) and the hydrodynamic model outputs (i.e., hourly to daily current patterns). Our analysis of coarse-sediment (gravel) mobility in relation to near-bottom current velocity and bottom stress (Figure 11), support that these dunes are mobilised on timescales that are not currently captured with bathymetry surveys. We recommend future research could focus on more frequent re-mapping surveys, in-situ measurements (e.g., mooring lines deployed over the bedforms, including instruments such as current meters, turbidimeters and cameras, continuously measuring hydrographic and sediment dynamics parameters during several months), and/or less frequent outputs of the hydrodynamics model (e.g., more averaging of the outputs and even re-running the same model with daily and monthly time-steps).
The changes in bedform morphology recorded in this study over multi-year periods (3-year and 1-year) are the first documented in Cook Strait. However, no bedform migration was detected within the timeframe of this study. We here present a unique example of gravel dunes that are being re-sculpted (e.g., crest bifurcation, Figure 5), but remain broadly in the same regional position. As such, they may have formed in a relict setting, but are evolving under modern current conditions. These gravel dunes were potentially formed during sea-level fluctuations, where this part of Cook Strait would have experienced subaerial, intertidal and subtidal settings, resulting in mobilisation of gravel and even boulder size sediment (Lewis & Mitchell, 1981; Lauder, 1987; Singh, 2001; Nicol, 2011). At present-day conditions, in western Cook Strait we observe high-energy multi-directional near-bottom tidal currents (i.e., NW-SE flowing Cook Strait tidal currents curving around the headland to form the NE-SW tidal currents flowing in and out of QCS) combined with eddy formation, resulting in high bottom stress (Figures 7–10). This enhances coarse-grained sediment entrainment and mobilisation (Figure 11), leading to changes to bedform morphology observable in multibeam mapping surveys. In this modern context, along with the sand and gravel-sized sediment, we assume that the fine fraction is also entrained and mobilised in each tidal cycle (unless trapped within the coarser grains’ lattice). The strong tidal near-bottom currents in this region are likely transporting this fine fraction elsewhere preventing its deposition over the bedforms (see seafloor classification and backscatter map for details on regional seabed sediment type distribution, Supplementary Figure S2).
The outcomes of this study support existing model evidence that tidal currents in Cook Strait are predominantly stronger than the inflow and outflow currents in the outer QCS (Figures 7, 8). To further investigate these tidal effects, a higher resolution hydrodynamic model is more appropriate than a long-term simulation that captures seasonal variability with lower resolution outputs. While there are other oceanographic processes, such as wind-driven currents (Walters et al., 2010; Hadfield & Stevens, 2020), internal tides or the mean flow due to differences in sea level height between the north-eastern and the south-western side of Cook Strait (Walters et al., 2010); the short period modelled here will not capture the seasonal variability in these processes. Although seasonal variability is not expected to alter the main findings here, it is expected that it will create slight differences in the currents for each tidal cycle. The expected effect of this will be a slight alteration in the size, positioning, and intensity of the tidal currents and eddies that form.
In Cook Strait, the tidal flow is the dominant transport mechanism, with tidal amplitudes reaching just under 6 Sv with a mean south-eastward flow of 0.42 ± 0.08 Sv (Hadfield & Stevens, 2020). This residual flow is attributed to wind-driven currents, the pressure gradient across Cook Strait, and tidal rectification (Walters et al., 2010; Stevens, 2014; Hadfield & Stevens, 2020). The modelling study performed here is too short to investigate seasonal variability and event-scale changes in this residual flow, but Stevens (2014) has studied these processes in moorings situated in Cook Strait. Stevens (2014) notes a seasonal variability with a flow of up to 0.08 Sv travelling north-westwards in the vicinity of our study region during summer and autumn. This flow reached speeds of up to 0.01 m s−1 above the average speed of 0.1 m s−1 and this small variation might have a small impact in the NW-SE components of flow shown in this study (Figures 7–10). However, as the tidal flow in these directions reaches speeds of up to 3 m s−1, a seasonal variability of the order of 0.1 m s−1 is small in comparison. We expect that seasonal variability will create slight differences in the currents for each tidal cycle, which will manifest as a minor alteration of the size, positioning, and intensity of the tidal currents and eddies that form. Passing extreme events have a larger effect on the currents with Stevens (2014) noting that these events have depth-averaged currents reach speeds of 20% of the maximum tidal currents. The effect of these storms on bottom currents was not determined and is expected to be less than the effect on the depth-averaged currents. However, these storm events may accelerate and decelerate the tidal currents at times.
The results presented in this study highlight that bedform evolution is a complex interplay between the variations of velocity and direction of the near-bottom tidal currents, coastal geomorphology, bathymetry, and sediment type and availability. In this context, we find that daily tidal currents in the Cook Strait continental shelf are strong enough to shape bedforms, such as gravel dunes, indicating this is a region with highly dynamic seabed. Additional in-situ hydrodynamic measurements, together with higher-resolution bathymetry and sediment resuspension and transport modelling, would assist in constraining the spatial and temporal evolution of submarine bedforms.
In this study we assess the character of near-bottom currents and the location of a gravel bedform field to unravel the relationship between bedform evolution and near-bottom tidal currents, eddy formation, coastal morphology, and seafloor bathymetry.
Repeat multibeam bathymetric surveys reveal morphological changes to gravel dunes over multi-year (3-year and 1-year) periods, with the most prominent change being dune crest bifurcation. However, no bedform migration was detected in this area, within the timeframe of this study.
The observed bedform evolution occur within the context of strong multi-directional near-bottom currents. The most significant morphological changes are observed in areas closest to shore, coinciding where eddies are developed in each tidal cycle, and where the near-bottom tidal currents and associated bottom stress exceed the threshold of motion of coarse-grained sediment. This study shows that coarse-grained (gravel) bedforms located in highly energetic continental shelves, such as Cook Strait, are continuously evolving over multi-year timescales, without the effects of extreme events (e.g., storms). These findings demonstrate the dynamic nature of the continental shelf environment - critical information for submarine cable placement, navigational pathways and the integrity of offshore infrastructure.
This study presents new information about sediment transport processes related to tidal currents in New Zealand/Aotearoa; and provides new insights about the formation and evolution of complex morpho-sedimentary patterns under multi-directional current conditions in this and other regions worldwide (Trentesaux and Garlan, 2000).
Multibeam dataset related to this article can be found at https://data-marlborough.opendata.arcgis.com/search?tags=Multibeam, an open-source online data repository hosted at the Marlborough District Council website, and visualized at: https://marlborough.maps.arcgis.com/apps/MapSeries/index.html?appid=155a89b0beb74035bd1c4c71f6f36646.
MR and SW developed and designed the study and associated data collection. MR analysed seafloor data and performed the morphometric and sediment dynamic analyses. SW processed bathymerty data. HM designed and runned the hydrodynamic model. LS provided expert knowledge on sedimentary properties. MR, SW, and LS secured PBRF funding for mapping survey. MR, SW, HM wrote the manuscript with input from LS. All authors discussed results and contributed to the final version of the manuscript.
This work was funded by the University of Auckland FRDF programme, Evaluating Suspended Sediment Impacts on Benthic Ecosystems project (project number 3719981).
The authors would like to thank the crews and scientific parties of the expedition HS51 for the bathymetric data acquisition in 2017, and Kevin Mackay and the crew of RV Kaharoa and RV Ikatere for the remapping survey in July 2020 and May 2021. We would like to thank Mark Hadfield for the collaboration on the near-bottom current modelling and the ROMS developers for use of their code. We are grateful for the ongoing support and guidance from Lee Rauhina-August and the Te Ātiawa o Te Waka-a-Māui community. We thank the reviewers and the editor for their constructive feedback and reviews.
The authors declare that the research was conducted in the absence of any commercial or financial relationships that could be construed as a potential conflict of interest.
All claims expressed in this article are solely those of the authors and do not necessarily represent those of their affiliated organizations, or those of the publisher, the editors and the reviewers. Any product that may be evaluated in this article, or claim that may be made by its manufacturer, is not guaranteed or endorsed by the publisher.
The Supplementary Material for this article can be found online at: https://www.frontiersin.org/articles/10.3389/feart.2022.1045716/full#supplementary-material
Albuquerque, J., Antolínez, J. A. A., Gorman, R. M., Méndez, F. J., and Coco, G. (2021a). Seas and swells throughout New Zealand: A new partitioned hindcast. Ocean. Model. 168, 101897. doi:10.1016/j.ocemod.2021.101897
Albuquerque, J., Antolínez, J. A. A., Gorman, R. M., Méndez, F. J., and Coco, G. (2022). Wave hindcast data - New Zealand. Retrieved May 2022 from https://uoa-eresearch.github.io/waves/hindcast.html.
Barrie, J. V., and Conway, K. W. (2014). Seabed characterization for the development of marine renewable energy on the Pacific margin of Canada. Cont. Shelf Res. 83, 45–52. doi:10.1016/j.csr.2013.10.016
Boyce, A. G. (1971). “Coastal depositional environments of the inner Marlborough Sounds Master thesis,”. Department of Geography (Christchurch, New Zealand: University of Canterbury).
Carling, P. A. (1999). Subaqueous gravel dunes. J. Sediment. Res. 69, 534–545. doi:10.2110/jsr.69.534
Chiswell, S. M., Stevens, C. L., Macdonald, H. S., Grant, B. S., and Price, O. (2019). Circulation in tasman-golden bays and greater Cook Strait, New Zealand. N. Z. J. Mar. Freshw. Res. 55 (1), 223–248. doi:10.1080/00288330.2019.1698622
Craw, D., Anderson, L., Rieser, U., and Waters, J. (2010). Drainage reorientation in Marlborough Sounds, New Zealand, during the last interglacial. N. Z. J. Geol. Geophys. 50 (1), 13–20. doi:10.1080/00288300709509815
Damen, J. M., van Dijk, T. A. G. P., and Hulscher, S. J. (2018). Spatially varying environmental properties controlling observed sand wave morphology. J. Geophys. Res. Earth Surf. 123 (2), 262–280. doi:10.1002/2017JF004322
Doré, A., Bonneton, P., Marieu, V., and Garlan, T. (2016). Numerical modeling of subaqueous sand dune morphodynamics. J. Geophys. Res. Earth Surf. 121 (3), 565–587. doi:10.1002/2015jf003689
Flemming, B. W. (2000a). “On the dimensional adjustment of subaqueous dunes in response to changing flow conditions: A concenptual process model,” in Marine sandwave dynamics. Editors A. Trentesaux, and T. Garlan (Lille, France: University of Lille 1), 61–67.
Flemming, B. W. (2000b). “The role of grain size, water depth and flow velocity as scaling factors controlling the size of subaqueous dunes,” in Marine sandwave dynamics. Editors A. Trentesaux, and T. Garlan (Lille, France: University of Lille 1), 55–60.
Hadfield, M., Broekhuizen, N., and Plew, D. (2014). “A biophysical model for the Marlborough Sounds. Part 1: Queen Charlotte Sound and tory channel,”. NIWA report CHC2014-116 (Auckland, New Zealand: Niwa Taihoro Nukurangi).
Hadfield, M. G., and Stevens, C. L. (2020). A modelling synthesis of the volume flux through Cook Strait. N. Z. J. Mar. Freshw. Res. 55 (1), 65–93. doi:10.1080/00288330.2020.1784963
Haidvogel, D. B., Arango, H., Budgell, W. P., Cornuelle, B. D., Curchitser, E., Di Lorenzo, E., et al. (2008). Ocean forecasting in terrain-following coordinates: Formulation and skill assessment of the Regional Ocean modeling system. J. Comput. Phys. 227 (7), 3595–3624. doi:10.1016/j.jcp.2007.06.016
Heath, R. A. (1974). Physical oceanographic observations in Marlborough Sounds. N. Z. J. Mar. Freshw. Res. 8 (4), 691–708. doi:10.1080/00288330.1974.9515538
Heath, R. (1978). Semi diurnal tides in Cook Strait. N. Z. J. Mar. Freshw. Res. 12 (2), 87–97. doi:10.1080/00288330.1978.9515730
Hughes-Clarke, J. E. (2012). Optimal use of multibeam technology in the study of shelf morphodynamics. Int. Assoc. Sedimentology Special Publ. 44, 1–28. doi:10.1002/9781118311172.ch1
Kalnay, E., Kanamitsu, M., Kistler, R., Collins, W., Deaven, D., Gandin, L., et al. (1996). The NCEP/NCAR 40-year reanalysis project. Bull. Am. Meteorol. Soc. 77 (3), 437–471. doi:10.1175/1520-0477(1996)077<0437:tnyrp>2.0.co;2
Lamarche, G., Lurton, X., Verdier, A.-L., and Augustin, J.-M. (2011). Quantitative characterisation of seafloor substrate and bedforms using advanced processing of multibeam backscatter—application to Cook Strait, New Zealand. Cont. Shelf Res. 31 (2), S93–S109. doi:10.1016/j.csr.2010.06.001
Langhorne, D. N. (1977). “Sandwave research and its relevance to present day navigation and engineering problems,” in Institute of oceanographic sciences internal document, 19 (Wormley, Surrey, UK: Institute of Oceanographic Sciences).
Lauder, G. A. (1987). “Coastal landforms and sediments of the Marlborough Sounds PhD thesis,”. Department of Geography (Christchurch, New Zealand: University of Canterbury).
Lauder, W. R. (1970). The ancient drainage of the Marlborough Sounds. N. Z. J. Geol. Geophys. 13 (3), 747–749. doi:10.1080/00288306.1970.10431351
Lewis, K., and Mitchell, J. S. (1981). Cook Strait: Sediments. New Zealand Oceanographic Institute (now NIWA) Chart Coastal series 1, 200 000. Wellington: Department of Scientific and Industrial Research
Li, M. Z., Shaw, J., Todd, B. J., Kostylev, V. E., and Wu, Y. (2014). Sediment transport and development of banner banks and sandwaves in an extreme tidal system: Upper Bay of Fundy, Canada. Cont. Shelf Res. 83, 86–107. doi:10.1016/j.csr.2013.08.007
Lo Iacono, C., and Guillén, J. (2008). Environmental conditions for gravelly and pebbly dunes and sorted bedforms on a moderate-energy inner shelf (Marettimo Island, Italy, Western Mediterranean). Cont. Shelf Res. 28 (2), 245–256. doi:10.1016/j.csr.2007.08.005
Lobo, F. J., Hernandez-Molina, F. J., Somoza, L., Rodero, J., Maldonado, A., and Barnolas, A. (2000). Patterns of bottom current flow deduced from dune asymmetries over the Gulf of Cadiz shelf (southwest Spain). Mar. Geol. 164, 91–117. doi:10.1016/S0025-3227(99)00132-2
Majdi Nasab, N., Islam, M. R., Muttaqi, K., and Sutanto, D. (2021). Optimization of a grid-connected microgrid using tidal and wind energy in Cook Strait. Fluids 6 (12), 426. doi:10.3390/fluids6120426
Mitchell, N. C., Jerrett, R., and Langman, R. (2021). Dynamics and stratigraphy of a tidal sand ridge in the Bristol Channel (Nash Sands banner bank) from repeated high resolution multibeam echo sounder surveys. Sedimentology 69, 1051–1082. doi:10.1111/sed.12935
Neil, H., Mackay, K., Wilcox, S., Kane, T., Lamarche, G., and Wallen, B. (2018). “What lies beneath? Guide to survey results and graphical portfolio,”. Queen Charlotte Sound/Tōtaranui and Tory Channel/Kura Te Au (HS51) (Auckland, New Zealand: Niwa Taihoro Nukurangi).
Nicol, A. (2011). Landscape history of the Marlborough Sounds, New Zealand. N. Z. J. Geol. Geophys. 54 (2), 195–208. doi:10.1080/00288306.2010.523079
Niwa, (2014). Auckland, New Zealand: NIWA Climate Database. https://cliflo.niwa.co.nz/.The national climate data base
Plew, D. R., and Stevens, C. L. (2013). Numerical modelling of the effect of turbines on currents in a tidal channel – tory Channel, New Zealand. Renew. Energy 57, 269–282. doi:10.1016/j.renene.2013.02.001
Singh, L. J. (2001). “Late Quaternary sea level and tectonic history of Marlborough Sounds. PhD thesis,”. Department of Geography, Environment & Earth Sciences (Wellington, New Zealand: Victoria University of Wellington).
Soulsby, R. (1997). Dynamics of marine sands: A manual for practical applications. London, UK: Thomas Telford.
Stanton, B. R., Goring, D. G., and Bell, R. G. (2001). Observed and modelled tidal currents in the New Zealand region. N. Z. J. Mar. Freshw. Res. 35 (2), 397–415. doi:10.1080/00288330.2001.9517010
Stevens, C. L., Smith, M. J., Grant, B., Stewart, C. L., and Divett, T. (2012). Tidal energy resource complexity in a large strait: The Karori Rip, Cook Strait. Cont. Shelf Res. 33, 100–109. doi:10.1016/j.csr.2011.11.012
Stevens, C. (2014). Residual flows in Cook Strait, a large tidally dominated strait. J. Phys. Oceanogr. 44 (6), 1654–1670. doi:10.1175/jpo-d-13-041.1
Trentesaux, A., and Garlan, T.2000 Marine Sandwave Dynamics (Dynamique des dunes sous-marines),” in Proceedings of an International Workshop, Lille, France, March 2000 (University of Lille).
Urlich, S. C. (2015). Marlborough District Council Technical Report No: 15-009. New Zealand: Marlborough District Council.Mitigating fine sediment from forestry in coastal waters of the Marlborough Sounds
Venditti, J. G., Church, M., and Bennett, S. J. (2005). Morphodynamics of small-scale superimposed sand waves over migrating dune bed forms. Water Resour. Res. 41 (10). doi:10.1029/2004wr003461
Vennell, R. (1994). Acoustic Doppler current profiler measurements of tidal phase and amplitude in Cook Strait, New Zealand. Cont. Shelf Res. 14 (4), 353–364. doi:10.1016/0278-4343(94)90023-X
Vennell, R., and Collins, N.1991. Acoustic Doppler current profiler measurements of tides in Cook Strait, New Zealand coastal engineering—Climate for change,” in Proceedings of the 10th Australasian conference on coastal and ocean engineering, Auckland, Newzeland, December 1991 (Hamilton, New Zealand: DSIR Water Quality Centre Publication).
Walbridge, S., Slocum, N., Pobuda, M., and Wright, D. J. (2018). Unified geomorphological analysis workflows with benthic terrain modeler. Geosciences 8 (3), 94. doi:10.3390/geosciences8030094
Walters, R. A., Gillibrand, P. A., Bell, R. G., and Lane, E. M. (2010). A study of tides and currents in Cook Strait, New Zealand. Ocean. Dyn. 60 (6), 1559–1580. doi:10.1007/s10236-010-0353-8
Walters, R. A., Goring, D. G., and Bell, R. G. (2001). Ocean tides around New Zealand. N. Z. J. Mar. Freshw. Res. 35 (3), 567–579. doi:10.1080/00288330.2001.9517023
Wang, Z., Liang, B., Wu, G., and Borsje, B. W. (2019). Modeling the formation and migration of sand waves: The role of tidal forcing, sediment size and bed slope effects. Cont. Shelf Res. 190, 103986. doi:10.1016/j.csr.2019.103986
Watson, S. J., Neil, H., Ribó, M., Lamarche, G., Strachan, L. J., MacKay, K., et al. (2020). What we do in the shallows: Natural and anthropogenic seafloor geomorphologies in a drowned river valley, New Zealand. Front. Mar. Sci. 7. doi:10.3389/fmars.2020.579626
Webster, S., Uddstrom, M., Oliver, H., and Vosper, S. (2008). A high-resolution modelling case study of a severe weather event over New Zealand. Atmos. Sci. Lett. 9 (3), 119–128. doi:10.1002/asl.172
Whitehouse, R. J. S., Damgaard, J. S., and Langhorne, D. N. (2000). Sandwaves and seabed engineering; the application to submarine cables. Editors A. Trentesaux, and T. Garlan
Keywords: submarine bedform evolution, repeated multibeam mapping, multi-directional tidal currents, near-bottom currents, Cook Strait, seafloor geomorphology, gravel dunes, hydrodynamic modelling
Citation: Ribó M, Watson SJ, Macdonald H and Strachan LJ (2022) Evolution of marine gravel dunes on the open shelf under multi-directional currents conditions. Front. Earth Sci. 10:1045716. doi: 10.3389/feart.2022.1045716
Received: 15 September 2022; Accepted: 01 December 2022;
Published: 14 December 2022.
Edited by:
Katrien Van Landeghem, Bangor University, United KingdomReviewed by:
Mark Coughlan, University College Dublin, IrelandCopyright © 2022 Ribó, Watson, Macdonald and Strachan. This is an open-access article distributed under the terms of the Creative Commons Attribution License (CC BY). The use, distribution or reproduction in other forums is permitted, provided the original author(s) and the copyright owner(s) are credited and that the original publication in this journal is cited, in accordance with accepted academic practice. No use, distribution or reproduction is permitted which does not comply with these terms.
*Correspondence: Marta Ribó, bWFydGEucmliby5nZW5lQGF1dC5hYy5ueg==
Disclaimer: All claims expressed in this article are solely those of the authors and do not necessarily represent those of their affiliated organizations, or those of the publisher, the editors and the reviewers. Any product that may be evaluated in this article or claim that may be made by its manufacturer is not guaranteed or endorsed by the publisher.
Research integrity at Frontiers

Learn more about the work of our research integrity team to safeguard the quality of each article we publish.