 Laura Peruzza
 Maria Adelaide Romano
 Mariangela Guidarelli
 Luca Moratto
 Marco Garbin
 Enrico Priolo
- National Institute of Oceanography and Applied Geophysics—OGS, Trieste, Italy
In August 2021, an extremely productive seismic sequence took place in northeastern Italy. Within 1 month, we identified and localized 407 microearthquakes in the area monitored by the local Collalto Seismic Network. This is about 20 times the average monthly rate of events detected in the last decade; 92% of them are clustered near the village of Refrontolo at about 9 km depth (main event a ML2.5, MW2.4). None of the Refrontolo sequence earthquakes were felt by the population. The earthquakes, mostly identified by automatic procedures, were post-processed by manual picking of P, S-phases and polarities; they were localized by different techniques and define a small SE dipping volume that departs from the brittle surface previously enlightened by microseisms and assigned to the NNW dipping Montello Thrust. We interpret the sequence ruptured pre-stressed patches near to failure of sub-vertical, antithetically oriented faults. The unusual productivity rate and precursory foreshock activity support the hypothesis that the Montello system has a relevant aseismic component. We believe that this episode, of no importance from an energetic point of view, is of greatest interest for deciphering the seismic potential of this area and for strengthening automatic microearthquake detection and location procedures.
Introduction
The Montello anticline (northeastern Italy) has attracted the attention of geologists for centuries because it represents the outermost morphological expression of the eastern Southern Alps, the fold and thrust belt developed since the Eocene (Doglioni and Bosellini, 1987) and reactivated with ENE-trending structures in Late Oligocene to Early Miocene (Castellarin et al., 1992). The deformation along the external front facing the Venetian Po Valley is still ongoing: the growth of the Montello anticline is controlled by a buried thrust (the Montello Thrust—MT) considered active (see Benedetti et al., 2000; Galadini et al., 2005; Burrato et al., 2008; Poli et al., 2008). Picotti et al. (2022) has recently revised surface and subsurface datasets, assigning the MT a lower deformation rate than previously thought; we refer to this paper and references therein for a comprehensive description of the tectonic and geologic details.
This region (Figure 1) has been struck by several moderate-to-severe earthquakes in the past (4.5 < M < 6.5, data taken from CPTI15, see Data Availability Section), but no historical major event is referred to the Montello area. In recent decades, 3 < M < 4 events have been recorded by the regional seismic network of the National Institute of Oceanography and Applied Geophysics (OGS), operated for civil defense purposes since 1977, and by temporary monitoring. Nonetheless, the quality of the national and regional instrumental catalogs is non-uniform in time and space (Sugan and Peruzza, 2011; Danesi et al., 2015; see Romano et al., 2019, and revised catalogs cited therein).
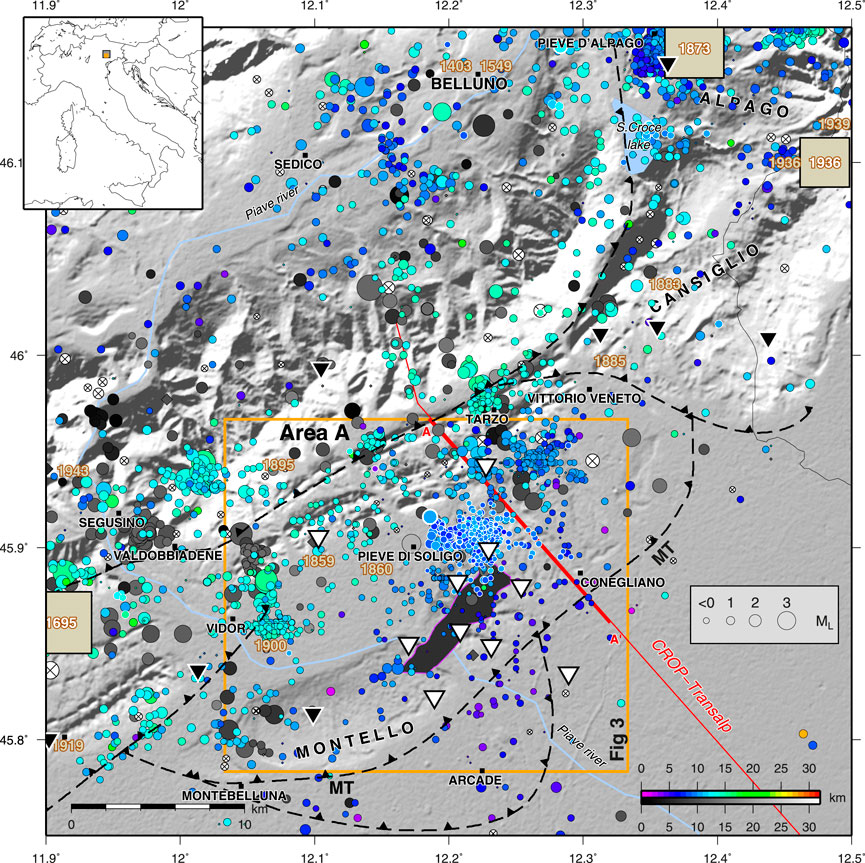
FIGURE 1. Seismotectonic framework of the August 2021 Refrontolo seismic sequence. Historical earthquakes (pale brown squares for M > 5.4, pale brown labels for 4.5 < M < 5.5, taken from CPTI15); early instrumental hypocentral locations (from 1977 to 2011, taken from Romano et al., 2019, gray color palette for depth), and earthquakes detected by the RSC network from 2012 to October 2021 (rainbow color palette for depth), uniformly located (H71, Lee and Lahr, 1975); white cross-hatched symbols are the less constrained solutions, with horizontal and vertical errors respectively greater than 3 and 5 km. The size of the instrumental earthquake symbols is proportional to the local magnitude. The 407 events marked with white circles occurred in August 2021 (this study) and are mainly located near Refrontolo (near Pieve di Soligo). Fault traces (black dashed lines) are taken from Burrato et al. (2008); MT is the Montello Thrust. In black with purple frame, the surface projection of the Collalto UGS, which is seismically monitored by the RSC network within the regional network managed by OGS (stations represented by white and black triangles, respectively). The orange square surrounding the Collalto UGS represents RSC target Area A. The red line is the trace of CROP -Transalp (Transalp Working Group, 2003; Fantoni and Franciosi, 2008).
Since 2012, the monitoring has been improved by the local Collalto Seismic Network (RSC), which was developed to detect microseismicity potentially induced by an underground gas storage (UGS). The Collalto storage exploits since 1994 a natural depleted reservoir located at a depth of 1,500–1,600 m (black polygon in Figure 1), with a net storage capacity of about 600 million Sm3. The RSC has been fully operational since 2012; it was developed and is managed by OGS on behalf of Edison Stoccaggio S.p.A. The 10 RSC stations (white triangles in Figure 1) are equipped with extended-band borehole seismometers (with natural period T ≥ 10 s), and integrated by other stations of the regional network managed by OGS (for further details see Priolo et al., 2015). The RSC stations and network geometry, the detection and location procedures have no notable differences since the installation, thus providing a precious dataset of observations lasting more than 10 years (RSC catalog, see Data Availability Section); within the best earthquake detectability area (Area A in Figure 1, about 20 km wide), magnitude completeness can be considered uniform in time and space and is close to ML0.0 since 2012 (Romano et al., 2019). To date, no earthquakes have been associated with the methane storage activities, on the basis of geometrical considerations, and by means of simplified poro-elastic modelling of gas pressure variations. Conversely, the natural microseismicity has depicted an impressive 3D imaging of the thrusts front (Romano et al., 2019), not available when Galadini et al. (2005) first hypothesized a unique fault segment, capable of M∼6.7 earthquakes with average recurrence times of about 700 yr.
The increase in high-quality seismological data, and the availability of semipermanent geodetic surveys (e.g., Anderlini et al., 2020) have supported a gradual change in the interpretation of the seismogenic potential of the Montello Thrust (MT) and surrounding sources. Initially considered a seismic gap (Burrato et al., 2008) within a single, continuous deformation front, since no major event occurred between the two strong historical events of 1695 and 1873 (see Figure 1), the MT was then segmented into smaller hypothetical faults; the potential sources of major earthquakes are now interpreted split in two sub-parallel fronts (see sources labeled ITCS060, ITCS105 and ITIS101 in the different versions of the database DISS, see Data Availability Section). Several authors now suggest a potential aseismic role of MT, considering the microseismic record (Romano et al., 2019), geodetic/seismic modeling (Barba et al., 2013), or analogs with other anticlines hosting productive gas reservoirs (Valensise et al., 2022).
High-rate, concentrated microseismicity and repeated earthquakes are considered characteristic features of creep faults (e.g., Malservisi et al., 2005; Harris, 2017; Scholz, 2019). Some years of microearthquake monitoring provide an exceptional picture of the deep, brittle horizon associated with MT (see Figure 4 in Romano et al., 2019). However, these observations do not answer all open questions about locked/creeping properties and the potential of seismogenic sources in the area. Microseismicity (Figure 1) often occurs in spotty patches, mainly in swarm-like sequences lasting days to weeks. Other studies on other seismological signatures that could be typical of creeping behavior (e.g., searches for repeated earthquakes) have not yet yielded convincing results. As for the geodetic detectability of deformation in support of a creep hypothesis, many factors argue against the measurability of its expression at the ground surface in this area: the depth of buried faults, the presence of alluvial cover in the plain, the high degree of anthropization, the effective InSAR resolution along the NS direction, and a non-negligible regional karst component in the mountains (e.g., Devoti et al., 2015; Serpelloni et al., 2018).
During August 2021, the most productive sequence of microearthquakes ever recorded by the RSC occurred below Refrontolo (small village near Pieve di Soligo, see Figure 1); 407 microearthquakes were detected and located in 1 month, about 20 times the average monthly rate of events detected in the last decade. Figure 2A shows the cumulative number of events located inside Area A from January 2012 to October 2021; the four jumps refer to clusters with ML of the “main” event ranging from 1.3 to 3.8, occurred in 2014, 2015, 2017, and 2021. The main Refrontolo event (3 August 2021 at 19:05:15.3 UTC1, ML2.5) occurred 1 day after an abrupt increase in microseismicity. More than 90% of the events detected in August were spatially clustered and occurred in two temporal bursts (Figure 2B). None of the Refrontolo earthquakes were felt by the population, due to the low magnitude and depth of the focus (about 8–10 km). On August 3, another event of magnitude ML2.3 occurred in the Alpago area, about 25 km northeast; in September, a seismic sequence started near Valdobbiadene, about 20 km northwest. They show aftershock rates much lower than those of the Refrontolo sequence, and comparable to previously recorded sequences (see Supplementary Table S1; Supplementary Figure S1 in Supplementary Material). Since October 2021, seismic activity has decreased to the usual “background” rates (about 7 events/month on average in Area A).
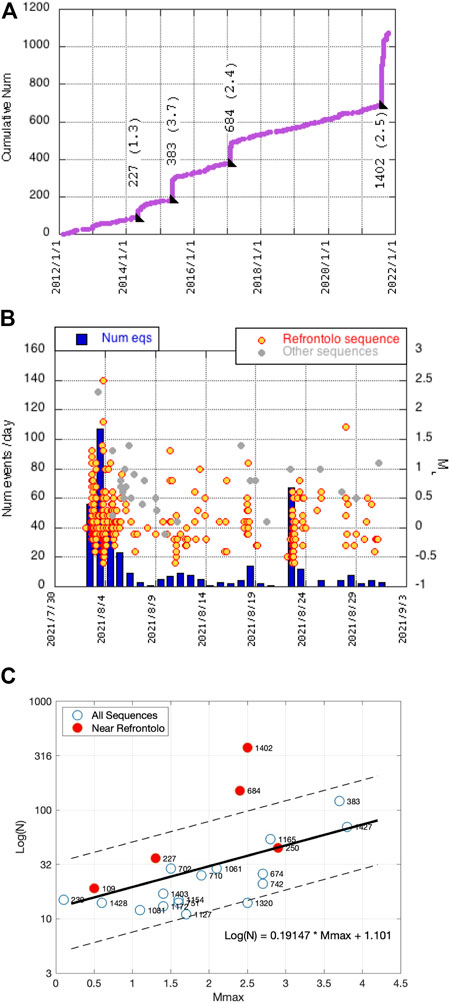
FIGURE 2. Seismicity detected by the RSC network. (A) Cumulative number of events located by the RSC in Area A (see Figure 1) from January 2012 to October 2021; the jumps correspond to sequences, the vertical labels indicate the cluster identifier and maximum magnitude (in brackets)—see Supplementary Material. (B) Daily number of events (left axis, blue bars) and magnitude (right axis, circles) as a function of time for earthquakes located by the RSC in August 2021. Events belonging to the Refrontolo sequence are indicated by red/yellow circles, in gray the events occurred elsewhere but inside the area shown in Figure 1. (C) Global number of events versus Mmax for the most populated clusters identified by the RSC (see Supplementary Material; Supplementary Figure S1; Supplementary Table S1). The labels indicate the clusters ID, the red dots are the sequences closest to that of Refrontolo 2021. The thick solid and thin dashed lines represent the linear regression (formula in the figure) and the 5th and 95th percentiles (2 sigma), respectively. The Refrontolo sequence is the cluster ID 1402.
From the beginning, the number of microearthquakes in the Refrontolo sequence seemed unusually high and not justified by magnitudes. A preliminary analysis shows that only the Refrontolo 2021 cluster, and the nearby Vittorio Veneto one in 2017 (cluster identifier n. 1402 and 684, respectively, see Supplementary Material) are above the 95th percentile in the linear regression obtained from the clusters identified by the RSC network in the last 10 years (Figure 2C); this correlation however is only indicative, as it is affected by the spatial variation in the completeness magnitude, out of Area A.
The series of microearthquakes were rapidly processed daily to track the spatiotemporal magnitude evolution of the sequence and to assess whether spatial migration of seismicity was occurring, taking into account UGS activity at Collalto. The seismic sequence remained spatially confined, and the number of events decreased after the second decade of August.
In this paper, we present the locations obtained after a full manual inspection and re-picking of the P and S-phases of the August 2021 events. These were relocated and processed using various techniques to obtain the most accurate estimates of geometric, energetic, and kinematic parameters. This dataset contains very low magnitude events that are usually not represented in the catalogs.
After 10 years of enhanced monitoring, the analysis of any space and time variation in microseismicity may be of paramount importance to understand the characteristics of the MT, and to discriminate which one between the two facing hypotheses (creeping or locked fault) is more grounded. The 2021 sequence aroused our interest for several reasons. This cluster appears to be different from the previous sequences already observed in the area, for its high productivity and the presence of groups of similar waveforms. It enlightens new fault patches, which can help accounting the deformation budget not yet expressed seismically by the MT, thus providing a potential fault to some light to moderate events (4 < M < 6) observed in the past (e.g., 1859, 1860, 1895, 1900, in Figure 1, between Valdobbiadene and Pieve di Soligo). It may also help detecting possible preparatory phases of major events, similarly, for example, to what was done a posteriori for the 2009 L’Aquila earthquake (e.g., Sugan et al., 2014).
Finally, the sequence also proved to be a “stress test” for our automatic detection and localization processing of microearthquakes. The raw and meta-data are available to the community for testing different algorithms, and enhanced analyses.
Materials and methods
On 2 August 2021, at about 2:00 p.m., the automatic warning system of the local RSC network reported a series of local microearthquakes, most of them in the vicinity of Refrontolo. Within 10 h, more than fifty microearthquakes were recorded and located, with a maximum of ML1.3 (Figure 2B). The approximately 100 events recorded on the second day, August 3, culminated in the main event (ML2.5; eventID = 105), preceeded within 2 min by an ML1.3 and the second strongest event (ML1.8) of the sequence. The earthquake rate decreased until mid-August, when productivity increased again, with more than 60 microearthquakes on August 22 with ML < 1.0; the strongest aftershock (ML1.7, eventID = 388) occurred on August 27 at 23:48:24. By the end of August, the sequence includes 374 located events (clusterID = 1402 in Figure 2C). Meanwhile, several more events (black circles in Figure 2B) occurred in the area of Lake Alpago and S. Croce, about 25 km northeast of Refrontolo (with maximum magnitude ML2.3 on 3 August at 6:52:49, near Pieve D'Alpago in Figure 1); thereafter, activity continued near Valdobbiadene.
Despite the unusual number of events, automatic real-time earthquake detection and localization based on the STA/LTA trigger algorithm and association by grid search of the Antelope software package were followed by manual offline reading of pickings, earthquake relocation, and local magnitude estimation according to our standard data processing (Priolo et al., 2015; Romano et al., 2019). Routine relocations use Hypo71 (Lee and Lahr, 1975; hereafter H71) with a regional 1D velocity model and fixed VP/VS = 1.78 (obtained from the modified Wadati diagram based on the entire data set), and Hypoellipse (Lahr, 1999; HEL) with a local, more detailed 1D velocity model with VP/VS, which varies in depth (velocity model and stations corrections given in the Supplementary Material; Supplementary Tables S2, S3). The first method is used to match regional OGS monitoring conducted since 1977; the second method, used to support seismotectonic analyzes, features minimal traveltime residuals, and more reliable statistical location errors. The local magnitude (ML) adopts the attenuation relation of Bragato and Tento (2005) and static station corrections; in catalogs H71 and HEL, magnitudes for the distance term may differ slightly. Further details on data processing can be found in Romano et al. (2019).
In this study, for the month of August 2021, we applied the standard processing procedures already mentioned to publish the following datasets:
1. Catalog of H71 absolute locations: it contains 407 microearthquakes (localized with at least 10 phase readings in 90% of the cases), with 374 events clustered near Refrontolo with −0.8 ≤ ML ≤ 2.4, RMSmax = 0.43 s and GAP ≤ 180, ERH and ERZ ≤ 1 km in about 80% of the cases;
2. HEL absolute locations, with the same number of events of H71, −0.7 ≤ ML ≤ 2.5, RMSmax = 0.21 s, and GAP ≤ 180, SEH, and SEZ ≤ 1 km in about 90% of cases.
We then applied other methods to estimate locations and energy parameters and obtained the additional data sets listed below:
3. Absolute locations obtained with MigraLoc (Guidarelli et al., 2020) using the full waveform stacking approach; we adopted it to provide absolute solutions alternative to the traditional phase picking methods, in order to exploit the full information contained in the waveform, and to compare different methodologies. It’s worth mentioning that these methodologies are increasingly suggested for locating microseismicity, expecially in the induced seismicity field (see Grigoli et al., 2017 and references therein). We performed event localization using the same velocity model as HEL and iterating the procedure on a 3D grid (0.2 km sampling step) centered on the study area (25 km × 25 km wide horizontally, 16 km in depth). We obtained 97 solutions for the total of 374 events in the Refrontolo sequence, for events with ML > 0; the other earthquakes do not satisfy the minimum number of stations required, with a suitable signal-to-noise ratio. Note that modern waveform-based seismic source location methods are designed to work with many receivers well distributed over the target area: the comprehensive review done by Li et al. (2020) mentions applications at different scales, with a number of stations comparable to our case study.
4. Relative location using HypoDD version 2.1b (Waldhauser and Ellsworth, 2000; Waldhauser, 2012). The input data set is that of HEL, with the same velocity model. We used manual pickings subject to quality control, and the singular value decomposition (SVD) method to solve the inverse problem equations: it estimates physically meaningful least squares errors by computing appropriate covariances. Conversely, the errors in LSQR method are fictitious ones. Both the inversion methods, however, gave similar clusters, with a thin ellipsoid approximately of the same dip. Since SVD is only applicable to a limited number of events, we restricted the relocation procedure to the main geometric cluster of the sequence. The 229 events relocated by HypoDD are from a total of 12433 P-phase and 8978 S-phase differential times with at least 15 observations per event pair. The cluster centroid shifts about 20 m northward from its original position; the average location errors (2sigma) are a few hundred meters, with average time residuals of about 17 ms.
5. Moment magnitude data set (MW) for 324 of 407 earthquakes computed from response spectra (Moratto et al., 2017; Lanzoni et al., 2020) and seismic energy estimates (Kanamori et al., 2020): they allow comparison with ML and help to understand the dynamic properties of the sources.
6. A set of focal mechanisms obtained from the first polarity readings: they were obtained using the FPFIT software package (Reasenberg and Oppenheimer, 1985), with HEL locations. We retain here only the solutions based on more than 10 polarities (for the Refrontolo area, 26 events with ML ranging from 0.5 to 2.5); in case of multiple solution the graphical representation is the one based on the best STDR parameter.
These data sets are available in the Supplementary Material, and in public repositories (see Data Availability Section).
Results
In Figure 3, we compare the locations of H71, HEL, MigraLoc, and HypoDD of the Refrontolo sequence.
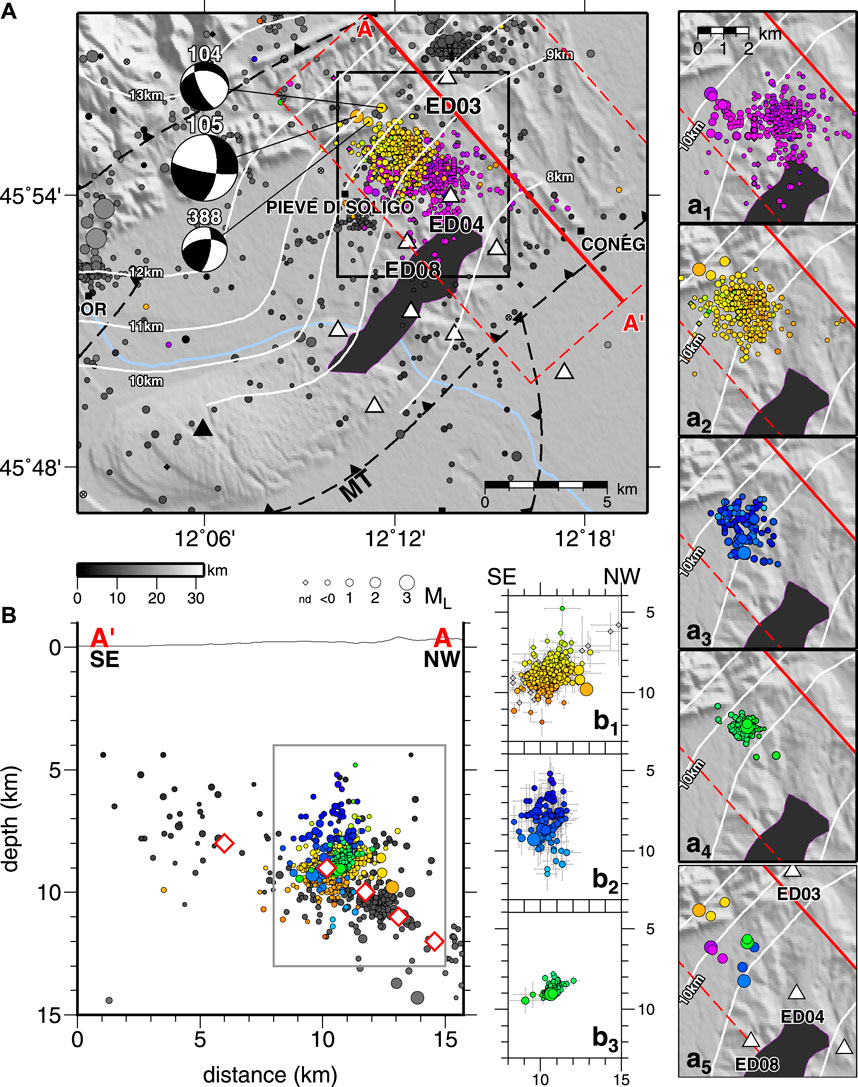
FIGURE 3. Spatial features of the Refrontolo sequence using different location algorithms. (A) Epicentral map of the Refrontolo sequence in August 2021 using H71 (in purple) or HEL (in yellowish colors): the entire HEL catalog of the RSC network from 2012 to October 2021 is shown in the background with gray color palette for depth; beach balls of the three main events with events IDs. White isolines represent the interpolation of the seismogenic horizon interpreted as the Montello Thrust (Romano et al., 2019). Other symbols as in Figure 1. Insets: a1) H71 dataset alone (374 events); a2) HEL dataset (374 events); a3) MigraLoc absolute localizations (97 events); a4) HypoDD relative localizations (229 events); a5) comparison of epicenter location for the three main events localized by different methods. (B) Cross-section of seismicity as above, along a sector of the CROP -Transalp profile (see Figure 1). Insets: b1) HEL; b2) MigraLoc; b3) HypoDD. Location errors are shown by thin gray bars; red diamonds are the projection of isolines representing the MT.
Note on the map (Figure 3A, insets a1-a2) the horizontal shift between solutions H71 and HEL, which exceeds their statistical location errors. Also note that H71 provides the most dispersed cloud of events. About HEL, the cloud of epicenters is slightly elongated along NW-SE direction, and hypocenters dip approximately toward SE (vertical cross section A’A in Figure 3B, inset b1). The sequence occurred near the northeastern edge of the reservoir, at a distance of about 7–10 km when depth is considered.
The absolute locations determined with MigraLoc (insets a3, b2) refer to a limited subset of events (26%, with 97 out of 374 events); they mostly overlap with the solutions of HEL. Unlike HEL, where the main events remain outside the cluster, MigraLoc attracts them inside the cloud, but with a larger scatter along depth than HEL.
The earthquake cluster relocated by HypoDD (61% with 229 events, insets a4, b3) is strongly shrunk and dips about 30° towards SE. These alignments could represent ruptures along a low-angle branch of an antithetic SE dipping fault that diverges from the NW-dipping MT plane (represented by white isobaths in Figure 3).
In general, all localization methods appear to be biased by lateral velocity variations not represented by the 1D models used, and to some extent by azimuthal coverage. This cluster however does not show a lateral continuity (i.e., along strike of the hypothesized antithetic fault). Some sensitivity tests performed by randomizing the stations used, and setting the ratio VP/VS to 1.85 (the highest value obtained for the August 2021 dataset alone, see Supplementary Figure S2 in Supplementary Material) show more concentrated clouds of hypocenters and a slight decrease in the depth of the events. The VP/VS ratio does not affect the depth of the main earthquakes, which is stable at about 8–9 km depth for all localizers; their epicenters are located at a maximum distance of 1–3 km for the different methods (shown in Figure 3, inset a5).
In terms of energy content and rupture size, the seismic moment (M0) is a static measure of earthquake size and provides fault-averaged, low-frequency information about the source processes, but relatively little information about the small-wavelength, high-frequency rupture details. The radiated seismic energy (Er) is related to rupture kinematics and dynamics and can be calculated from energy flux relatively far from the earthquake source (Zollo et al., 2014). It allows inferences to be made about dynamic stress release during earthquake ruptures, and its relationship with M0 yields the apparent stress, which is a proxy for dynamic stress release (Moratto et al., 2019); the Er/M0 ratio is related to variations in stress drop, stiffness, rupture velocity, and shear wave velocity (Bormann et al., 2013). M0 and Er of small magnitude earthquakes in the preparatory phase may also provide new information on the dynamics of ruptures occurring before the main earthquake (Picozzi et al., 2019, 2022).
In this study, M0 is derived from MW, which in turn is estimated from vertical response spectra (SA) computed at 1.0, 0.3, and 0.1 s and properly corrected for path effects (Moratto et al., 2017). This approach assumes that the empirical relationships between MW and the values of SA have been previously calibrated for the studied area, as done by Lanzoni et al. (2020) for the Montello-Collalto area.
We compute MW for 324 of 407 earthquakes identified in August 2021; the low signal-to-noise ratio does not allow MW computation for the remaining 83 events. Figure 4A shows that this dataset satisfactorily fits the relationship previously reported by Lanzoni et al. (2020) for 1659 events with MW 0.4-3.5, during 2012–2018. Similar to previous studies (e.g., Deichmann, 2017; Moratto et al., 2017), magnitudes scale nearly 1:1 for the strongest events (for M > 1.8), while MW is higher than ML and scales 2:3 for the weakest earthquakes. This confirms that the local magnitude of microearthquakes underestimates the released seismic energy due to anelastic attenuation and scattering, which lead to a rapid decay of the high-frequency amplitude (Deichmann, 2017).
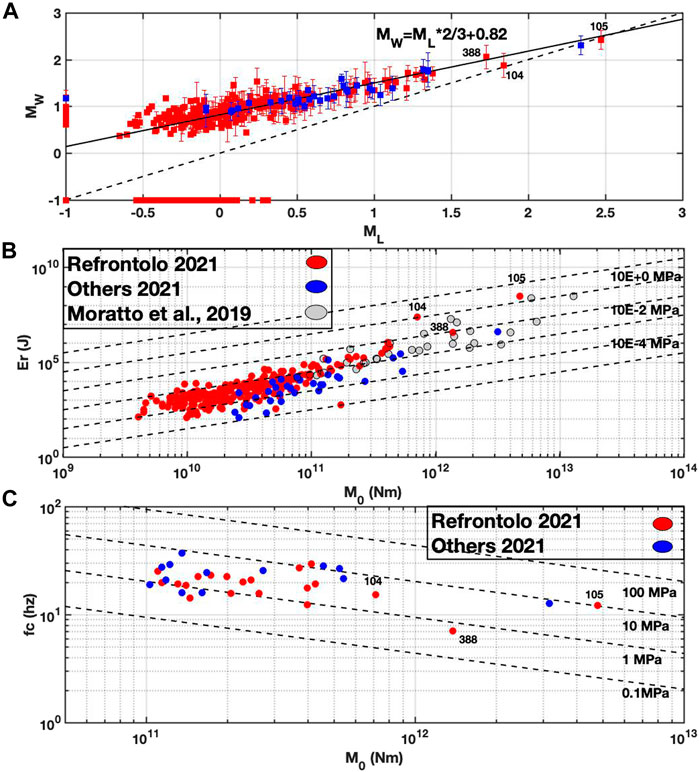
FIGURE 4. Comparison between source parameters estimated by the RSC network (HEL catalog): (A) ML vs. MW for the August 2021 events, Refrontolo sequence with red squares, the earthquakes in other areas in blue squares; the solid black line shows the empirical relationships of Lanzoni et al. (2020). Symbols along the axes (M-1) represent earthquakes without magnitude estimates (MW and ML on the x and y axes, respectively). (B) M0 vs. radiated seismic energy (Er); symbol colors as in (A), the gray circles represent previous events recorded by the RSC network and analyzed in Moratto et al. (2019). (C) M0 vs. corner frequency (fc); dashed black lines represent the constant Madariaga stress drop. Event IDs of the three main earthquakes of the Refrontolo sequence as follows. 104: largest foreshock on August 3, 19:04:06, ML1.8; MW1.9; 105: main earthquake on August 3, 19:05:15, ML2.5, MW2.4; 388: largest aftershock on August 27, 23:48:24, ML1.7, MW2.1.
Er is calculated by applying the time-domain integration method (Kanamori et al., 2020) after corrections for site amplification curves for borehole stations (Moratto et al., 2019). The station distribution in the Collalto area is sufficiently uniform to mitigate the effects of radiation patterns. The energy values estimated for our data set range from 102 to 3*108J (Figure 4B), with the majority of events having energies less than 106J. The Er/M0 ratios, represented by the apparent stress lines using a scaling relation, vary between 10−4 and 2 MPa. Our energy estimates are comparable to those of Moratto et al. (2019), who calculated seismic energy for a data set representative of Collalto seismicity using a different method, i.e., ground-motion velocity and the best-fit frequency-domain spectral model.
Figure 4B also shows that the apparent stress increases with the moment magnitude, reaching 1–2 MPa for the mainshock of the Refrontolo sequence (eventID = 105, see caption) and the foreshock occurred 1 min earlier (ID = 104). The strongest aftershock (ID = 388) is less energetic, with an apparent stress of about 0.1 MPa; we suggest that it dissipated more energy into friction and in the creation of a new rupture surface. The Refrontolo events also have, on average, a larger apparent stress than the values estimated for events at other locations; no bias from the previous data set is detectable, although there is a partial overlap in magnitude. We can therefore only hypothesize some differences in rupture dynamics between Refrontolo and other earthquakes recorded in August 2021; in particular, Refrontolo earthquakes appear to be more efficient at wave radiation and release more energy than the other events at the same seismic moment (Kanamori and Heaton, 2000).
Finally, we estimate corner frequencies for S-wave source spectra and the associated Madariaga stress drop for 33 earthquakes with M0 > 1011 Nm (Figure 4C), using the procedure calibrated by Moratto et al. (2019) in the same area. No systematic bias in the stress drop between Refrontolo events and earthquakes in other areas is evident. Therefore, the observed differences in apparent stress for this limited subset of events cannot be explained by variations in stress drop, while rupture velocity (Beeler et al., 2003), larger for Refrontolo events than elsewhere, would play a crucial role.
About the rupture process, we analyzed the focal mechanisms of the Refrontolo sequence using first polarity data, as they are sufficiently well constrained despite the small magnitudes, thanks to azimuthal coverage. This dataset is also exceptional as events are extremely concentrated in space, and in time too; it is therefore an ideal case to test on real data the performances of different methods proposed both for automatic pickers, and focal mechanism determinations of microearthquakes. In Figure 5, the 26 focal mechanisms (full data set in Supplementary Material) are plotted over selected waveforms at the three nearest stations (location in Figure 3). All types of ruptures are represented; about 1/3 of events are not pure mechanism (beach balls in gray, see Supplementary Figure S6). Despite the spatial pattern is smeared in the location uncertainties, a fairly clear temporal trend can be seen: from the beginning of the sequence till to the main event (ID 105), normal and strike slip mechanisms prevails, then followed by mainly reverse faulting. Such evolution in time is supported by the waveforms too, that are available for further analyses to the readers (see Data Availability Section); this seismic sequence frequently shows groups of self-similar waveforms indicative of different rupture families. Note in Figure 5: the relevant amplitudes of the P-phases for several events at stations ED03 and ED08, which are on opposite sides of the hypocenter cloud; the complementary amplitudes of the P and S phases at station ED04; some similar waveforms with different focal mechanism. The complementarity of the amplitudes can be explained by the 45° angle between the P and S radiation patterns in the actual geometry of the three recording stations; the discrepancies between the waveforms and the focal mechanisms are due to solution instabilities in the inversion for rupture mechanisms with mixed style. We reckon phases anticipating the arrival of S in some events (especially at station ED08); further investigation could confirm our conjecture of S-P converted phases. Finally, some similar waveforms have different focal mechanism, thus showing that the solution obtained by first arrival polarities is uncertain, even if the polarities are well distributed on the focal sphere, and statistical measure of the goodness of fit is acceptable (see the STDR values in Supplementary Material). A comparison of different methodologies (e.g., Fojtíková et al., 2010) is needed, and this dataset is promising, as we have multiple observations from a dense network near the earthquake sequence, and multiple sources concentrated in a small volume.
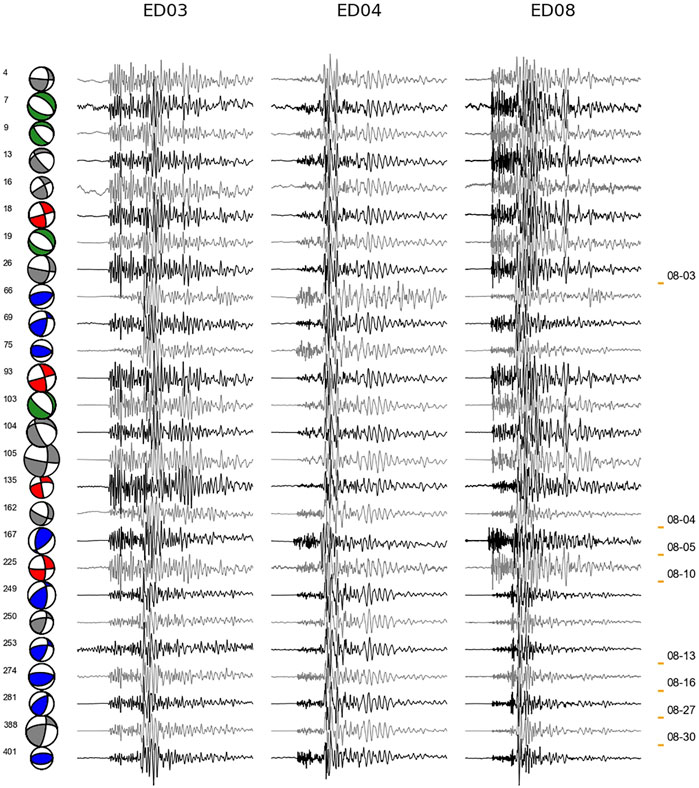
FIGURE 5. Focal mechanisms (Reasenberg and Oppenheimer, 1985) and selected waveforms for the 26 best-constrained earthquakes, i.e., with more than 10 first-pulse polarities; event IDs on the left, labels with dates on the right, red, green, blue and gray respectively for strike, normal, reverse and mixed solutions. The beach balls are scaled to MW. Aside, the seismograms (vertical component) recorded by three RSC (borehole seismometer) stations, ED03, ED04, and ED08, are plotted for each event (see Figure 3 for stations location). The 8.5 s long signals are not filtered, normalized in amplitude, and aligned on P arrivals.
Discussion
Despite the low magnitudes (up to MW2.4), the Refrontolo sequence in August 2021 was the most productive burst of microearthquakes (Figure 2) recorded by the Collalto seismic network since its establishment in 2012. It occurred in an area where no major earthquake occurred in the past, and, even taking into account the incompleteness of the first instrumental catalog, no M > 4 has been observed in the last 45 years (Sugan and Peruzza, 2011; Romano et al., 2019). This absence of light to moderate seismicity, joined with geological evidences of active deformation (Benedetti et al., 2000; Picotti et al., 2022) leave the floor open to some contrasting hypotheses about the seismic potential of the Montello thrust, the end members being: 1) a locked surface of MT, capable of characteristic full rupture (M > 6.5) earthquakes with long recurrence times, or 2) a creeping sector that accommodates the deformation by sliding without relevant earthquakes.
In the Refrontolo sequence, earthquakes are concentrated in a small volume (Figure 3), 2–3 km wide, slightly elongated in a NW-SE direction and dipping SE, at 8–9 km depth. We acknowledge that the four absolute and relative location methods we used give results that partially differ: in the cross sections, HEL shows an ellipsoid SE dipping, MigraLoc depict a mainly vertical feature, HDD a narrow feature SE dipping, but less inclined than HEL; the standard location adopted to be uniform with the regional OGS bulletin (H71, see Supplementary Material too) presents a shift towards ESE, and some artifacts. The maps and cross sections confirm that the statistical horizontal and vertical errors are not representative of the actual uncertainties in rupture location. The use of a local, anomalously high VP/VS ratio (1.85 for the August dataset, compared to 1.78 in the past) helps reduce the scatter in localization (see Supplementary Material; Supplementary Figures S3, S4), but still does not allow us to constrain the ruptures details. However, we acknowledge that this variation was detectable only because we have a sufficient sample of events, very concentrated in time and space: it is simply not feasible, in the common practice of a seismological observatory, using space and/or time variable VP/VS ratios. Therefore, we believe that this blurred image is the best result we can obtain for micro-earthquakes, even with a dense network; readers have to be aware that the spatial distributions of earthquakes (drawn on standard or more sophisticated processing) have their intrinsic, unresolvable uncertainties. Any interpretation must account for such uncertainties, and the use of one single approach may be simplistic, or misleading.
We interpret the sequence as a SE dipping volume that departs from the brittle surface imaged by previous seismicity, as the MT, at about 9 km depth; it breaks up potential off-fault patches, with antithetic geometry. We relate this cluster to the Montello backthrust, a tectonic structure first hypothesized by Fantoni and Franciosi (2008) based on the seismic interpretation of the CROP-Transalp profile, and confirmed by Picotti et al. (2022). This feature has never been revealed by earthquakes before the Refrontolo sequence; thus the seismogenic source can be considered locked. The coexistence of different focal mechanisms and self-similar waveforms suggest the existence of different fracture families in a confined rock volume; focal mechanisms tentatively suggest an evolution in time, from normal/strike to reverse faulting; the high VP/VS could indicate a local increase in the presence of fluids.
Dascher-Cousineau et al. (2020) link aftershock productivity to the frequency of pre-stressed, near-failure patches per unit volume. According to Marsan et al. (2014), productivity can also be increased by the foreshock activity. During the Refrontolo sequence, 40% of earthquakes occurred the day before the main event (MW2.4): because a high rupture velocity is inferred from the energy radiated by the main events, we interpret the sequence as driven by slow deformation transients, possibly related to creep phenomena. If we accept the hypothesis that the Montello thrust slips by creeping, thus not hosting major earthquakes, we can speculate that some historical light to moderate earthquakes occurred in the area (e.g., 1859, 1860, see Figure 1) had their origin on the Montello backthrust (rooted at 9 km depth, as depicted by the 2021 sequence). At this stage, it is not possible to hypothesize the maximum rupture size of such an antithetic fault, but its potential surface can host M∼5 ruptures assigned to the past earthquakes. Further analyses, including some based on the self-similarity of the waveforms of the repeating earthquakes, are underway to better understand the dynamics of the Montello system.
We believe that the analysis of the space and time variation of the microseismicity is crucial to understand the behavior of the Montello thrust and nearby conjugate or inherited faults, as well as to discriminate which one between the two facing hypotheses—Is the MT creeping? Is it a locked fault?- is more grounded. We acknowledge that this cluster has some distinctive characteristics when compared to the other sequences observed in the last decade by the RSC network inside the Area A, where the seismic monitoring is uniform since 2012. Should some other observations confirm a lateral extension and continuity of the antithetic fault along strike, the newly observed seismicity on the Montello back-thrust would then account the deformation budget not yet expressed seismically by the MT. This would possibly provide a fault source to some light to moderate events observed in the past between Pieve di Soligo and Valdobbiadene (Figure 1). There are, however, some still open questions: are these space and time features due to the mechanical properties of rock in that small, confined volume? Do they testify a preparatory phases for other more relevant phenomena? Can we reduce artifacts and improve the quality of hypocenter/fault rupture solutions by other methodologies? We hope the scientific community is interested in answering these questions, benefitting of the raw and processed data that we share with this paper (see Data Availability).
All these considerations are feasible thanks to the existence of the enhanced monitoring of the RSC network; it confirms the role of micro-earthquakes in understanding the seismic potential of light to moderate earthquakes, in an important area of Northeastern Italy, for economic and cultural reasons, in detecting possible preliminary phases of main events, and more in general, in evaluating the seismic potential of the Montello thrust system.
Last but not least, this sequence raised some technical problems that are common to large earthquake sequences, such as: wrong localization, identification of wrong events, loss of earthquakes, wrong estimation of energetic parameters for overlapping signals of different events. At this stage, we believe that the manual revision we have chosen, although very demanding, is the best way to ensure good quality metadata. Our datasets and original data are available to the scientific community to promote benchmarks for automatic identification and localization of events, and new methods for investigating rupture properties.
Data availability statement
The datasets publicly available cited in this study can be found in online repositories listed in the Supplementary Material. The data presented in this study (datasets numbered 1 to 4 in Materials and Methods) are deposited in Zenodo Open Access repository, https://doi.org/10.5281/zenodo.7252308.
Author contributions
LP performed conceptualization, seismic monitoring real-time and off-line data analyses, catalogs and focal mechanisms data analyses and representation, original draft and manuscript handling; MR.: seismic monitoring real-time and off-line data analyses, H71 and HEL catalogs and Supplementary Material preparation; MGu: seismic monitoring real-time and off-line data analyses, MigraLoc analyses, waveform representation; LM, magnitude and energy data analyses and graphs; MGa: cluster analyses, output standardization and Supplementary Material preparation; EP: seismic monitoring off-line data analysis; HDD analysis, original draft preparation. All co-authors contributed to data interpretation, manuscript writing, reviewing and editing.
Funding
This work is done in the frame of the activities that OGS performs for seismic monitoring of industrial sites. This paper does not represent OGS, or UGS concession holders, official opinion and policies.
Acknowledgments
The Collalto Seismic Network is managed by OGS on behalf of Edison Stoccaggio S.p.A. in compliance with the requirements of the Italian Ministry of Environment, Land and Marine Protection (MATTM) and in agreement with the Veneto Region. The authors would like to thank the technical and control room staff: Denis Sandron, Marco Romanelli, Fabio Franceschinel, Marco Santulin, Paolo Bernardi, Peter Klin, Giovanna Laurenzano, Franco Pettenati, Alessandro Rebez, and Angela Saraò.
Conflict of interest
The authors declare that the research was conducted in the absence of any commercial or financial relationships that could be construed as a potential conflict of interest.
Publisher’s note
All claims expressed in this article are solely those of the authors and do not necessarily represent those of their affiliated organizations, or those of the publisher, the editors and the reviewers. Any product that may be evaluated in this article, or claim that may be made by its manufacturer, is not guaranteed or endorsed by the publisher.
Supplementary material
The Supplementary Material for this article can be found online at: https://www.frontiersin.org/articles/10.3389/feart.2022.1044296/full#supplementary-material
Footnotes
1Time always referred to UTC
References
Anderlini, L., Serpelloni, E., Tolomei, C., De Martini, P. M., Pezzo, G., Gualandi, A., et al. (2020). New insights into active tectonics and seismogenic potential of the Italian Southern Alps from vertical geodetic velocities. Solid earth. 11/5, 1681–1698. doi:10.5194/se-11-1681-2020
Barba, S., Finocchio, D., Sikdar, E., and Burrato, P. (2013). Modelling the interseismic deformation of a thrust system: Seismogenic potential of the Southern Alps. Terra nova. 25, 221–227. doi:10.1111/ter.12026
Beeler, N. M., Wong, T. F., and Hickman, S. H. (2003). On the expected relationships among apparent stress, static stress drop, effective shear fracture energy, and efficiency. Bull. Seismol. Soc. Am. 93, 1381–1389. doi:10.1785/0120020162
Benedetti, L., Tapponnier, P., King, G. C. P., Meyer, B., and Manighetti, I. (2000). Growth folding and active thrusting in the Montello region, Veneto, northern Italy. J. Geophys. Res. 105 (B1), 739–766. doi:10.1029/1999jb900222
Bormann, P., Wendt, S., and Di Giacomo, D. (2013). “Seismic sources and source parameters,” in New manual of seismological observatory practice 2 (NMSOP2). Editor P. Bormann (Potsdam, Germany: Potsdam, Deutsches GeoForschungsZentrum GFZ), 1–259.
Bragato, P. L., and Tento, A. (2005). Local magnitude in northeastern Italy. Bull. Seismol. Soc. Am. 95/2, 579–591. doi:10.1785/0120040100
Burrato, P., Poli, M. E., Vannoli, P., Zanferrari, A., Basili, R., and Galadini, F. (2008). Sources of Mw 5+ earthquakes in northeastern Italy and Western Slovenia: An updated view based on geological and seismological evidence. Tectonophysics 453, 157–176. doi:10.1016/j.tecto.2007.07.009
Castellarin, A., Cantelli, L., Fesce, A. M., Mercier, J. L., Picotti, V., Pini, G. A., et al. (1992). Alpine compressional tectonics in the southern Alps. Relationships with the N-apennines. Ann. Tect. 6 (1), 62–94.
Danesi, S., Pondrelli, S., Salimbeni, S., Cavaliere, A., Serpelloni, E., Danecek, P., et al. (2015). Active deformation and seismicity in the SouthernAlps (Italy): The Montello hill as a case study. Tectonophysics 653, 95–108. doi:10.1016/j.tecto.2015.03.028
Dascher-Cousineau, K., Brodsky, E. E., Lay, T., and Goebel, T. (2020). What controls variations in aftershock productivity? J. Geophys. Res. Solid Earth 125, e2019JB018111. doi:10.1029/2019JB018111
Deichmann, N. (2017). Theoretical basis for the observed break in ML/Mw scaling between small and large earthquakes. Bull. Seismol. Soc. Am. 107, 505–520. doi:10.1785/0120160318
Devoti, R., Zuliani, D., Braitenberg, C., Fabris, P., and Grillo, B. (2015). Hydrologically induced slope deformations detected by GPS and clinometric surveys in the Cansiglio Plateau, southern Alps. Earth Planet. Sci. Lett. 419, 134–142. doi:10.1016/j.epsl.2015.03.023
Doglioni, C., and Bosellini, A. (1987). Eoalpine and mesoalpine tectonics in the southern Alps. Geol. Rundsch. 76, 735–754. doi:10.1007/bf01821061
Fantoni, R., and Franciosi, R. (2008). 8 geological sections crossing Po Plain and Adriatic foreland. Rend. online Soc. Geol. It. 3, 365–368.
Fojtíková, L., Vavryčuk, V., Cipciar, A., and Madarás, J. (2010). Focal mechanisms of micro-earthquakes in the dobrá voda seismoactive area in the malé karpaty mts. (little carpathians), Slovakia. Tectonophysics 492, 213–229. doi:10.1016/j.tecto.2010.06.007
Galadini, F., Poli, M. E., and Zanferrari, A. (2005). Seismogenic sources potentially responsible for earthquakes withM≥ 6 in the eastern Southern Alps (Thiene-Udine sector, NE Italy). Geophys. J. Int. 161, 739–762. doi:10.1111/j.1365-246X.2005.02571.x
Grigoli, F., Cesca, S., Priolo, E., Rinaldi, A. P., Clinton, J. F., Stabile, T. A., et al. (2017). Current challenges in monitoring, discrimination, and management of induced seismicity related to underground industrial activities: A European perspective. Rev. Geophys. 55, 310–340. doi:10.1002/2016RG000542
Guidarelli, M., Klin, P., and Priolo, E. (2020). Migration-based near real-time detection and location of microearthquakes with parallel computing. Geophys. J. Int. 221/3, 1941–1958. doi:10.1093/gji/ggaa111
Harris, R. A. (2017). Large earthquakes and creeping faults. Rev. Geophys. 55, 169–198. doi:10.1002/2016RG000539
Kanamori, H., and Heaton, T. H. (2000). “Microscopic and macroscopic physics of earthquakes,” in Geocomplexity and the physics of earthquakes. Editors J. B. Rundle, D. L. Turcotte, and W. Klein (Berlin: Wiley and Sons). doi:10.1029/GM120p0147
Kanamori, H., Ross, Z. E., and Rivera, L. (2020). Estimation of radiated energy using the KiK-net downhole records-old method for modern data. Geophys. J. Int. 221, 1029–1042. doi:10.1093/gji/ggaa040
Lahr, J. C.(1999). Hypoellipse: A computer program for determining local earthquake hypocentral parameters, magnitude and first motion pattern (Y2K compliant version), version 1.0, U.S. Geol. Surv. Open-File Rep. 99–23.
Lanzoni, A., Moratto, L., Priolo, E., and Romano, M. A. (2020). Fast MW estimation of microearthquakes recorded around the underground gas storage in the Montello-Collalto area (Southeastern Alps, Italy). J. Seismol. 24, 1029–1043. doi:10.1007/s10950-019-09889-0
Lee, W. H. K., and Lahr, J. C. (1975). HYPO71 (revised): A computer program for determining hypocenter, magnitude and first-motion pattern of local earthquakes, U.S. Geol. Surv. Open-File Rep. 75–311. doi:10.3133/ofr75311
Li, L., Tan, J., Schwarz, B., Staněk, F., Poiata, N., Shi, P., et al. (2020). Recent advances and challenges of waveform-based seismic location methods at multiple scales. Rev. Geophys. 58, e2019RG000667. doi:10.1029/2019RG000667
Malservisi, R., Furlong, K. P., and Gans, C. R. (2005). Microseismicity and creeping faults: Hints from modeling the hayward fault, California (USA). Earth Planet. Sci. Lett. 234, 421–435. doi:10.1016/j.epsl.2005.02.039
Marsan, D., Helmstetter, A., Bouchon, M., and Dublanchet, P. (2014). Foreshock activity related to enhanced aftershock production. Geophys. Res. Lett. 41, 6652–6658. doi:10.1002/2014gl061219
Moratto, L., Romano, M. A., Laurenzano, G., Colombelli, S., Priolo, E., Zollo, A., et al. (2019). Source parameter analysis of microearthquakes recorded around the underground gas storage in the Montello-Collalto Area (Southeastern Alps, Italy). Tectonophysics 762, 159–168. doi:10.1016/j.tecto.2019.04.030
Moratto, L., Saraò, A., and Priolo, E. (2017). Moment magnitude (Mw) estimation of weak seismicity in Northeastern Italy. Seismol. Res. Lett. 88, 1455–1464. doi:10.1785/0220170063
Picotti, V., Romano, M. A., Ponza, A., Guido, F. L., and Peruzza, L. (2022). The Montello thrust and the active mountain front of the eastern Southern Alps. northeast Italy: Tectonics.
Picozzi, M., Bindi, D., Spallarossa, D., Oth, A., Di Giacomo, A., and Zollo, A. (2019). Moment and energy magnitudes: Diversity of views on earthquake shaking potential and earthquake statistics. Geophys. J. Int. 216, 1245–1259. doi:10.1093/gji/ggy488
Picozzi, M., Spallarossa, D., Iaccarino, A. G., and Bindi, D. (2022). Temporal evolution of radiated energy to seismic moment scaling during the preparatory phase of the Mw 6.1, 2009 L’Aquila earthquake (Italy). Geophys. Res. Lett. 49, e2021GL097382. doi:10.1029/2021GL097382
Poli, M. E., Burrato, P., Galadini, F., and Zanferrari, A. (2008). Seismogenic sources responsible for destructive earthquakes in NE Italy. Boll. Geof. Teor. Appl. 49, 301–313.
Priolo, E., Romanelli, M., Plasencia Linares, M. P., Garbin, M., Peruzza, L., Romano, M. A., et al. (2015). Seismic monitoring of an underground natural gas storage facility: The Collalto Seismic Network. Seismol. Res. Lett. 86 (1), 109–123. doi:10.1785/0220140087
Reasenberg, P. A., and Oppenheimer, D. (1985). FPFIT, FPPLOT and FPPAGE: FORTRAN computer programs for calculating and displaying earthquake fault-plane solutions. U. S. Geol. Surv. Open-File Rep. 85–739. doi:10.3133/ofr85739
Romano, M. A., Peruzza, L., Garbin, M., Priolo, E., and Picotti, V. (2019). Microseismic portrait of the Montello thrust (southeastern Alps, Italy) from a dense high-quality seismic network. Seismol. Res. Lett. 90/4, 1502–1517. doi:10.1785/0220180387
Scholz, C. (2019). The mechanics of earthquakes and faulting. 3rd ed. Cambridge: Cambridge University Press. doi:10.1017/9781316681473
Serpelloni, E., Pintori, F., Gualandi, A., Scoccimarro, E., Cavaliere, A., Anderlini, L., et al. (2018). Hydrologically induced karst deformation: Insights from GPS measurements in the Adria-Eurasia plate boundary zone. J. Geophys. Res. Solid Earth 123, 4413–4430. doi:10.1002/2017JB015252
Sugan, M., Kato, A., Miyake, H., Nakagawa, S., and Vuan, A. (2014). The preparatory phase of the 2009Mw6.3 L'Aquila earthquake by improving the detection capability of low-magnitude foreshocks. Geophys. Res. Lett. 41, 6137–6144. doi:10.1002/2014GL061199
Sugan, M., and Peruzza, L. (2011). Distretti sismici del Veneto. Boll. Geofis. Teor. Appl. 42, 3–90. doi:10.4430/bgta0057
Transalp Working Group, Castellarin, A., Cantelli, L., Bertelli, L., Borrini, D., Fantoni, R., Sella, M., et al. (2003). The TRANSALP seismic profile and the CROP 1A sub-project in MCROP ATLAS - Seismic Reflection Profiles of the Italian Crust. Editor D. Scrocca, C. Doglioni, F. Innocenti, P. Manetti, A. Mazzotti, L. Bertelliet al. (Istituto Poligrafico e Zecca dello Stato) 62, 107–126.
Valensise, G., Donda, F., Tamaro, A., Rosset, G., and Parolai, S. (2022). Gas fields and large shallow seismogenic reverse faults are anticorrelated. Sci. Rep. 1827 12, 1827–2322. doi:10.1038/s41598-022-05732-8
Waldhauser, F., and Ellsworth, W. L. (2000). A double-difference earthquake location algorithm: Method and application to the northern hayward fault, California. Bull. Seismol. Soc. Am. 90/6, 1353–1368. doi:10.1785/0120000006
Waldhauser, F. (2012). HypoDD: A program to compute double-difference hypocenter locations. hypoDD version 2.1b, 06/2012. doi:10.3133/ofr01113
Keywords: microearthquake activity, active thrust faulting, Southern Alps (Northern Italy), earthquake detection and location, seismic potential of faults
Citation: Peruzza L, Romano MA, Guidarelli M, Moratto L, Garbin M and Priolo E (2022) An unusually productive microearthquake sequence brings new insights to the buried active thrust system of Montello (Southeastern Alps, Northern Italy). Front. Earth Sci. 10:1044296. doi: 10.3389/feart.2022.1044296
Received: 14 September 2022; Accepted: 03 November 2022;
Published: 24 November 2022.
Edited by:
Nicola Alessandro Pino, National Institute of Geophysics and Volcanology (INGV), ItalyReviewed by:
Alberto Frepoli, Istituto Nazionale di Geofisica e Vulcanologia (INGV), ItalyMaria Mesimeri, Swiss Seismological Service, ETH Zurich, Switzerland
Copyright © 2022 Peruzza, Romano, Guidarelli, Moratto, Garbin and Priolo. This is an open-access article distributed under the terms of the Creative Commons Attribution License (CC BY). The use, distribution or reproduction in other forums is permitted, provided the original author(s) and the copyright owner(s) are credited and that the original publication in this journal is cited, in accordance with accepted academic practice. No use, distribution or reproduction is permitted which does not comply with these terms.
*Correspondence: Laura Peruzza, bHBlcnV6emFAb2dzLml0